Detecting Interest in Video Advertisements Using EEG
←
→
Page content transcription
If your browser does not render page correctly, please read the page content below
Detecting Interest in Video Advertisements Using EEG
                          Data Analysis
        Hadrian Jules Y. Ang                         Gabriel Alberto Sanchez                        Jose Antonio Pascual
     Ateneo De Manila University                     Ateneo De Manila University                 Ateneo De Manila University
  Katipunan Ave, Quezon City 1108                 Katipunan Ave, Quezon City 1108             Katipunan Ave, Quezon City 1108
           (02) 426 6001                                   (02) 426 6001                               (02) 426 6001
    hadrianang@outlook.com                             influx571@gmail.com                           joaoiep@gmail.com

ABSTRACT                                                               interest in advertising may help create models towards better
For a commercial or advertisement to be considered good, it must       advertisements that not only help advertisers, but also viewers, as
capture the viewer’s attention and hold the viewer’s interest. The     they are able to view more interesting and stimulating
curiosity, flow, wonder, and excitement that interest then cues can    commercials.
be beneficial to advertisers and the product that they are selling.
The goal of this study is to build a model that predicts levels of     Brain-computer interfaces (BCI) are defined as “communication
viewer interest in advertisements based on EEG, EOG and EMG            systems that do not depend on the brain’s normal output pathways
signals. Participants of the experiment were Ateneo college            of peripheral nerves and muscles” [5]. BCIs have applications in
students majoring in different courses and coming from different       medicine and gaming; Brainfingers (specifically the Neural
year levels. The resulting linear regression models per                Impulse Actuator model), a BCI created by Dr. Andrew Junker,
advertisement, with 10-fold cross-validation, had r-values ranging     was originally marketed as a gaming peripheral.
from -0.0332 to 0.4089 Additional features were engineered,
creating another set of models with r-values ranging from -0.0021      One of the uses of BCI data is emotion detection, such as in a
to 0.4213. An additional linear regression with 5-fold student-        study done by Plotnikov et al. entitled “Measuring Enjoyment in
level cross-validation was performed with an r-value of 0.129627.      Games Through Electroencephalogram (EEG) Signal Analysis”.
SVM classification with 10-fold cross validation was also used,        In the study, a set-up involving four commercial electrodes was
with classifier accuracy reaching 66.6667% for the original set of     used (two temporal, two frontal). The study’s 8 participants then
features and 67.1111% with the additional features.                    played an open-source version of Tetris with different speeds. A
                                                                       computer then recorded scores and answers to a questionnaire. To
General Terms                                                          detect flow, a Gaussian Kernel SVM was trained for each user
Measurement, Experimentation, Human Factors,                           with 67% of samples for training and the other 33% for testing,
                                                                       achieving an average accuracy of 81% while an SVM trained for
Keywords                                                               all users achieved an accuracy of 73% (alpha, beta, theta, delta
EEG, EMG, EOG, Brainfingers, Nerual Impulse Actuator, SVM,             and gamma waves from each electrode were used as features) [6].
Linear Regression
                                                                       One of the emerging fields that uses BCIs today is called
1. BACKGROUND OR CONTEXT                                               “neuromarketing” which seeks to combine disciplines such as
For a commercial or advertisement (“ad”) to be considered good,        economics, neuroscience and psychology to study decision
“something must be inherent in the commercial that allows it to        making situations [7]. This field is promising because it allows
live on in the mind of the consumer way after its thirty seconds on    researchers to gather objective data from viewers’ brain responses
screen” [1]. For an ad to properly stay with a viewer, one has to      and use this to derive information that can help investigate things
inspire interest in a product, issue or cause. Interest, proposed to   such as brand loyalty and decision making [7].
be a commonly felt emotion, arises in contexts that offer novelty,
change, possibility, mystery or challenge [2]. Emotions tend to        In the study entitled “Use of EEG as a Neuroscientific Approach
cause other related emotions that amplify the original experience      to Marketing,” 20 participants viewed a set of advertising videos
and in the case of interest, these are curiosity, flow, wonder and     with a 64 channel Tin/ Silver electrode cap placed on their heads
excitement [2] [3]. All of these are potentially beneficial to an      for data recording [7]. After watching the videos, the participants
advertiser selling a product, pushing for a cause or drawing           answered a questionnaire based on a Likert scale (1 – hate it, 2 –
attention to an issue or event.                                        didn’t like, 3 – indifferent, 4 – like it, 5 – love it). There were 30
                                                                       videos in all, shown in different blocks 6 at a time. Numerous
The first formal advertising framework was AIDA made by E. St.         techniques were then used for cleaning and data analysis. One of
Elmo Lewis in 1898: an acronym that stands for attention,              them is the creation of brain mappings for the ad with the highest
interest, desire and action [4]. Despite being established over one    and lowest ratings where frequency band activity was mapped to
hundred years ago, this framework already included interest as         parts of the brain they originated from (coloring the parts of a
one of the desirable characteristics in an ad. One of the categories   brain image with greater activity in a certain frequency range).
of models used in advertising would be the Pure Affect Models,         The mappings were then compared and contrasted with each other
which states that consumers form preferences “on the basis of          to see differences in certain areas of the brain to find correlations
elements such as liking, feelings and emotions induced by the          between brain activity and the ratings. The researchers found that
advertisement. . . .” [4]. Because of this, being able to detect       parts of the brain that are related to interest actually did exhibit
more activity in the relevant bands when the participants were The participants of the study were 25 Ateneo college students
watching the videos they rated the highest [7]. from different year levels majoring in various fields.
Choromonska et al. performed a marketing survey to find out the Participants averaged 3.54 hours of television a week and 9.2
better of two very similar advertisements [8]. The difference hours of watching YouTube. Out of 25 participants, 11 were
between the two ads was only the addition of a manual gesture female, 14 were male and their ages ranged from 17 to 21 years
and a change in camera angle for four seconds. Based on their old.
post-test examinations, most participants did not consciously see a
difference; however, the version with the manual gesture had 3.2 Instruments
significantly better scores than the one without it. The researchers The group used the Brainfingers Neural Impulse Actuator (NIA)
then used EEG (in a 10-20 placement system) to search for to gather data, as it is one of the consumer-oriented EEG devices
statistically significant differences in frontal cortex activity and that also features EOG and EMG. With the help of the SDK, the
EMG to search for differences in facial muscle activity to find out group created a C# program that synchronizes the videos to be
if this difference in perceived ad quality registers itself through shown, the Brainfingers’ recording and question pop-ups. The
brain waves or facial muscle activity. In the second by second program was set to query data from Brainfingers every 100
analysis of the data, significant but weak correlations were found milliseconds.
between the EEG data of the two ads (based on alpha activity) and
a strong difference in the activity of a certain facial muscle was The group compiled ads of different genres such as action,
found. Though they declared their results to be observational, the comedy, romance, musical, drama and educational. The order
researchers concluded that the brain indeed registers differences with which the videos appeared was not randomized, so it was
between ads and that it can be captured to some extent with EEG uniform across all participants. The advertisements chosen were
and EMG [8]. for products used daily, mostly consisting of food and hygiene
products
As seen in the few studies above, BCI technology is filled with
inherent possibilities; thus, it may be interesting to find what Table 1 below lists videos that were chosen, written in the order
kinds of models or classification algorithms work well with BCI they were shown. All of these were made and aired in the
data so that one may derive more information from raw data Philippines. The group tried to choose a good balance of
recordings. supposedly interesting and uninteresting ads, in hopes of creating
a more even class distribution in the final data set.
Reviews of classification algorithms with BCIs have been done
before; however, Brainfingers is different from usual laboratory A questionnaire popped up after each advertisement, asking the
EEGs because it has a fewer electrodes (only 3). This is opposed participants to rate how interested they were with what they had
to the studies mentioned above that used laboratory EEGs that just watched (a text box was provided for comments). An even
may have many more electrodes to capture signals from specific number scale of 1-4 was used to force a certain choice, rather than
areas of the brain. Though there is no straightforward way of leaving an undecided / neutral option. These assessments were
accurately mapping EEG data from Brainfingers to specific areas then used as classes for data analysis.
of the brain (since it only has three electrodes), it is at least able to
split the signals into Alpha, Beta and Theta bands and includes 3.3 Data Gathering
electrooculogram (EOG) and electromyogram (EMG) data [9] For the data gathering phase, the participants were tested
[10]. An additional advantage would be Brainfingers’ portability individually, the procedure taking around 15 minutes per person.
and ease of set-up compared to lab EEGs. Testing started with a briefing on the procedure and the
participants were urged to answer as honestly as possible
2. GOAL AND RESEARCH QUESTIONS throughout the process. A pre-test questionnaire was given to
The goal of this paper is to create a machine-learned model of collect data such as age, gender, course and average amount of
viewer interest in advertisements using EEG, EOG, and EMG time spent watching television and YouTube each week.
data. The specific research questions of the paper are: Brainfingers was then calibrated for each participant. A second
1. What is the relationship between the various brain briefing was then given before the video, explaining the video
signals and viewers’ reported interest? ! compilation and the question prompts between ads. Brainfingers
2. Which set of ad features correlate with levels of was then calibrated; the group made sure that each participant was
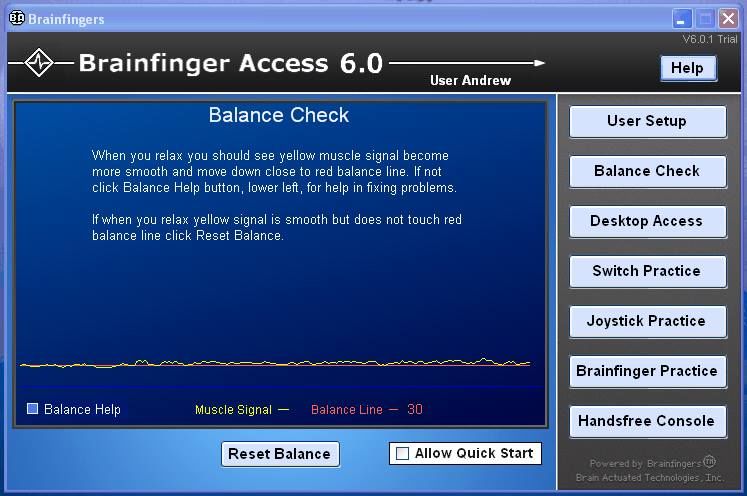
interest? ! in the balanced state before playing the advertisements (shown in
3. How can we build a model of viewer interest using data Figure 1 below).
from a device such as Brainfingers? How good are the
The participants watched a video compilation composed of
models?!
advertisements of different genres, while staying grounded with
the Brainfingers control box (by touching the box), as past
research has shown that this improves results [9]. The participants
3. METHODS were also advised not to touch the Brainfingers headband. The
testing was done one participant at a time either in ALLS or an
3.1 Participant Profile adjacent room.e 3. Screenshot of Post-Ad questionnaire
3.3.1 Debriefing Questions
Did you enjoy watching the advertisements?
What is your general feeling as of the moment?
Do you have any further reactions with some of the
advertisements? What about the study itself?
3.4 Results and Data Analysis
Feature vectors extracted were divided per person, per
advertisement, resulting in nine feature vectors per person.
Division of EEG data into bands (Alpha, Beta, Theta) was
automatically done by the Brainfingers Access Suite and was only
queried by the group’s program.
3.4.1 Data cleaning
Figure 1. Yellow Line Matching Red, Balanced State Data gathered consisted of multiple feature vectors per
advertisement (as the C# program made one query / reading every
By compiling videos together, the group was able to collect a lot 100 milliseconds). Because of this data had to be cleaned then
more data (more recordings on different ads) and it also helped compressed into a single feature vector per ad. Feature vectors
simulate a long commercial break. The Brainfingers Access that had dimensions two standard deviations away from the mean
Suite’s calibration tool was used again to ensure that participants (computed within the individual ad data sets only) were removed
returned to the baseline, the brain’s default state, after each using a simple Java program. This cleaning was done to remove
advertisement to ensure brain activity recorded is caused by the ad data noise often caused by movements of the NIA headband,
being viewed [7]. especially since some participants may brush the headband with
their hands or move their head around as part of their reactions to
Brainfingers was used as an EEG device to measure the activity of the advertisements. The mean of each dimension was then
the participants’ brainwaves, specifically the alpha, beta and theta computed in order to collapse all data from a certain person’s ad
waves. Data from the Brainfingers’ EOG and EMG functionality viewing experience it into a single feature vector (per person, per
was also recorded. The study also involved the answers to the ad), resulting in 225 vectors (25 participants, 9 advertisements
question previously stated. The questionnaire popped up after each). Each vector was then labeled based on the ratings
each advertisement and had to be answered before the next one participants gave them during the data gathering phase.
would play. The C# program was used to synchronize video
viewing and the querying of data that the Brainfingers Access 3.4.2 Additional Features
Suite records program also included a GUI for asking the Additional features based on previous studies were added to aid in
necessary questions and recording their results to generated text model building later on. Theta waves are associated with working
files. memory and emotional processes, while alpha waves are related
to a decrease in information processing (sometimes called “idling
After each test, there was a debriefing where the member of the rhythms”) [7]. The ratio of these two waves, which may help
group giving the test asks what the participant thought about the describe amount of information processing, was then computed
ads or what they felt while viewing the ads (shown below). with the equation below. A smaller value for this ratio would
mean a more active mind, while a larger one would mean
idleness.
! !"#ℎ!1 + !"#ℎ!2 + !"#ℎ!3
= !!!!!!!!!!(1)
! !ℎ!"#1 + !ℎ!"#2 + !ℎ!"#3
The study by Plotnikov et al. aimed at measuring enjoyment in
video games found that certain trends were apparent in the EEG
“attention ratio,” or the Theta/Low-Beta wave ratio, namely, there
is usually a negative correlation between this ratio and a person’s
attention level [6]. The attention ratio was then computed for each
vector using the equation below.
Figure 2. Screenshot of pre-test questionnaire GUI !ℎ!"#1 + !ℎ!"#2 + !ℎ!"#3
!"!"#!$%# = ! !!!!!!!!!!(2)
3 ∗ !"#$1
According to other studies, there are interrelations between Alpha
and Beta waves; thus, their ratio can be used to assess levels of
mental attentiveness [11]. This feature was then computed using
the following equation.
F
igur! !"#ℎ!1 + !"#ℎ!2 + !"#ℎ!3
= !!!!!!!!!!(3)
! !"#$1 + !"#$2 + !"#$3
After computing these additional features, they were appended to
each feature vector, creating a total of 14 dimensions.
3.4.3 Exploratory Data Analysis
Before data models are built, it would be interesting to see which
features correlate with interest. Correlations between features and
self-reported levels of interest were computed using Microsoft
Excel’s data tools. Table 3 below shows features with a noticeable
level of correlation (at least compared to the other features), as
they had absolute values greater than 0.1.Table 1. Descriptions of Advertisements
Numbe Title Genre Company/ Language Description Source Length
r Product
1 Labels Against Educational Pantene English Men and women are shown in various daily situations. Labels are http://www.youtub 61s
e.com/watch?v=kO
Women / Critical then flashed while the scenes of men and women are juxtaposed jNcZvwjxI
together. This emphasizes the difference in labels such as boss –
bossy, persuasive – pushy, showing that women are labeled wrongly
for things men are praised for.
2 Click Tayo! Musical Cherry Mobile Taglish Sarah Geronimo sings and dances while walking through a http://www.youtub 62s
e.com/watch?v=qa
presentation of mobile phones. Features of the phones, such as Wi-Fi kLtm8JV5Y
connectivity and QWERTY keyboards, are then shown in big flashy
text together with simulated phone UIs.
3 Bouncer Comedy Selecta Filipino The ad starts with the line “Hanggang saan aabot ang 20 pesos mo?” https://www.youtu 32s
be.com/watch?v=A
Cornetto A young man then uses a single twenty peso bill to pay the bouncer KZGSG3Gy5c
to a club, but this isn’t enough money, so the bouncer just brings out
a flashlight, moves it around, simulating club lights, while asking the
teenager to dance. The ad then suggests that the viewer spend the
money on ice cream instead.
4 Palmolive Naturals Musical Palmolive Taglish A woman, played by Janella Salvador, goes to what seems like a http://www.youtub 62s
e.com/watch?v=M
Intensive Moisture Palmolive convention called “Great Hair Day” and sees her crush. oo0QqAdfXQ
Janella’s MTV She suddenly becomes conscious of her hair, but she sings that she is
prepared for the chance encounter because she used Palmolive
shampoo. She then breaks into a song and dance number ending with
her crush approaching her with a gift.
5 Coke Ko ‘To Comedy Coca-Cola Taglish A woman who has just purchased a bottle of coke when her friend http://www.youtub 29s
e.com/watch?v=ET
arrives. The two friends then play a game where they clap their 8vRoXWhGI
hands together faster and faster. The first one who makes a mistake
loses and the winner gets the bottle of coke.
6 Noel Drama Jollibee Filipino An OFW comes home to the Philippines from Qatar after 2 years of https://www.youtu 51s
be.com/watch?v=2
not spending Christmas with his family. He is driven to his family DmID9cTums
by an old taxi driver whose son has been abroad for 5 years. They
both talk about how wonderful Christmas is with the family;
however, the OFW senses the sadness of the taxi driver (since unlike
him, his family is not in the country). When they arrive at Jollibee,
the OFW is greeted by his family, as he surprises his kids with his
arrival for Christmas. He then invites the old taxi driver to join them
for Christmas and they then enjoy a dinner together in Jollibee.
7 Everybody Musical Rexona English In a shower room, men wearing towels break into a song and dance http://www.youtub 31s
e.com/watch?v=fHj
number of the Backstreet Boys’ “Everybody.” They then proceed to 3a-JAMTQ
use their deodorant sticks as microphones. The ad ends with a zoom
in of the Rexona product.8 Ramon Bautista vs. Musical / Nescafe Taglish The band Parokya ni Edgar is singing in front of a sari-sari store http://www.youtub 189s
e.com/watch?v=2
Parokya ni Edgar Comedy when a woman suddenly appears warning them that their planet is in WnafG7er8w
danger. A giant robot, controlled by the villain Rebolto, crashes into
the city from space. The band then uses their own giant robot, called
Edgar, conveniently hidden underneath the sari-sari store. Despite
their own giant robot, the band starts to lose the battle. They then
bring out Nescafe 3 in 1 Coffee to power up their robot, but instead
of fighting they offer Rebolto coffee. The ad ends with the band and
Rebolto drinking coffee together.
9 First Love Drama / McDonalds Taglish A man narrates how every time he goes to McDonalds, he http://www.youtub 62s
e.com/watch?v=8V
Romance remembers meeting his first love when they were still kids. He talks dG8eCxors
about how they liked the same things like dipping fries in ice cream
sundaes. Years later he meets his first love again, but she is now
married to someone else, but he is still happy despite not ending up
together.
Table 2. Additional Data
Advertisement Average Rating Given by Participants (out of 4) Number of Participants Who have Seen It Before
1. Labels Against Women 2.72 17
2. Click Tayo! 1.96 12
3. Bouncer 3.56 23
4. Palmolive Natural Intensive Moisture Janella’s MTV 1.72 12
5. Coke Ko ‘To 3.20 17
6. Noel 3.24 16
7. Everybody 2.48 4
8. Ramon Bautista vs. Parokya ni Edgar 3.36 6
9. First Love 3.24 20Table 3. Notable Correlation Levels Beta3 -0.4466 0.1995
2
Data Set Attributes R R Theta1 0.1129 0.0127
Ad#1 Alpha1 -0.1111 0.0123 Muscle -0.3342 0.1117
Beta1 0.1342 0.0180 Attention 0.1761 0.0310
Beta2 0.1689 0.0285 Alpha/Beta 0.1284 0.0165
Beta3 0.2089 0.0436 Ad#6 Beta2 0.1510 0.0228
Theta1 -0.1251 0.0157 Beta3 0.1035 0.0107
Theta3 -0.1154 0.0133 Muscle 0.1213 0.0147
Glance -0.1657 0.0275 Ad#7 Alpha/Theta -0.1560 0.0243
Muscle -0.2794 0.0781 Attention 0.1151 0.0132
Attention -0.1888 0.0356 Alpha/Beta -0.3202 0.1025
Alpha/Beta -0.2882 0.0831 Ad#8 Alpha2 -0.1049 0.0110
Ad#2 Beta1 0.1195 0.0143 Alpha3 -0.1455 0.0212
Beta3 0.1308 0.0171 Beta1 -0.3384 0.1145
Muscle -0.1501 0.0225 Beta2 -0.4558 0.2078
Ad#3 Alpha1 0.1195 0.0143 Beta3 -0.5531 0.3059
Alpha2 0.1401 0.0196 Muscle -0.5211 0.2715
Alpha3 0.1509 0.0228 Attention 0.2847 0.0811
Beta1 0.2256 0.0509 Alpha/Beta 0.4521 0.2044
Beta2 0.2764 0.0764 Ad#9 Alpha1 -0.1714 0.0294
Beta3 0.2469 0.0610 Alpha2 -0.1503 0.0226
Theta1 0.2065 0.0426 Alpha3 -0.1927 0.0371
Theta2 0.1537 0.0236 Beta1 -0.1656 0.0274
Theta3 0.2080 0.0433 Beta2 -0.1828 0.0334
Glance 0.1462 0.0214 Beta3 -0.2067 0.0427
Muscle 0.2061 0.0425 Theta1 -0.1806 0.0326
Alpha/Theta -0.5596 0.3132 Theta2 -0.2277 0.0518
Attention 0.2023 0.0409 Theta3 -0.1699 0.0289
Alpha/Beta -0.2139 0.0458 Glance -0.2540 0.0645
Ad#4 Alpha1 -0.1821 0.0332 Muscle -0.5889 0.3468
Alpha2 -0.1919 0.0368 Attention -0.0903 0.0082
Alpha3 -0.2050 0.0420 Alpha/Beta -0.1216 0.0148
Beta1 -0.2219 0.0492 Data Set Beta1 -0.1315 0.0173
Beta2 -0.2146 0.0461 Beta2 -0.1388 0.0193
Beta3 -0.2051 0.0421 Beta3 -0.1550 0.0240
Theta1 -0.1855 0.0344 Muscle -0.2011 0.0404
Theta2 -0.1776 0.0315 Based on the correlation results across each advertisement, two
Theta3 -0.1913 0.0366 signals were most notable; beta waves varied between positive
and negative correlation with interest labels depending on the
Glance -0.1809 0.0327 advertisement, but muscle signals were almost always negative.
Muscle -0.2659 0.0707 The negative muscle signal makes sense as minimal facial muscle
movement may mean the person is really paying attention to the
Alpha/Theta -0.1553 0.0241 ad. Beta waves are usually associated with focused concentration
Attention 0.1070 0.0114 and may increase when doing a mathematically related task or
suppressing an action [12]. The correlations of beta waves with
Ad#5 Beta1 -0.2571 0.0661
the interest label were sometimes negative and sometimes
Beta2 -0.3704 0.1372 positive. One possible explanation would be that some ads mayhave needed focus to appreciate (such as Ad#1), while others may Ad#9 -0.4891 * Beta2 + -0.6124 * -0.0021 0.0000
have needed loosening up (such as Ad#8). Theta2 + 1.4297 * Theta3 + -
0.8923 * Muscle + -0.2784 *
3.4.4 Linear Regression With Original Features Alpha/Beta +4.289
University of Waikato’s Weka library was then used for data
analysis [13]. The group ran Linear Regressions with 10 fold Whole 0.1454 * Alpha1 + -0.6587 * 0.1259 0.0159
cross-validation on the entire data set (all 225 vectors), then on Data Alpha2 + 0.2544 * Beta1 +
data sets divided according to advertisements being watched (25 Set 0.3033 * Beta2 + -0.3593 *
vectors each). The group first ran the algorithm using only Beta3 + -0.2055 * Theta1 +
features that came from recorded data; thus, each vector had 11 -0.1317 * Theta2 + 1.8509 *
dimensions. Glance + -0.348 * Muscle +
0.3853 * Attention + -0.1878
Table 4. Linear Regression Results * Alpha/Beta + 3.4192
Data Model R R2
Set Though the addition of new features allowed the creation of one
Ad#1 -0.7619 * Alpha1 + 1.3841 * -0.1957 0.0383 additional model (for Ad # 3), its effect on r-values was
Beta1 + -1.1026 * Beta2 + inconsistent. While it did improve the r-values of the model in
0.4141 * Beta3 + 0.2446 * some advertisements, a few of them also dropped, most notably
Theta1 + -1.5445 * Muscle the r-value for whole data set’s model. Looking at results for the
+ 2.8998 entire data set (instead of per ad), the new features did not
correlate very well with interest ratings (thus, they are not
Ad#5 -0.4333 * Beta2 + 0.2737 * 0.4064 0.1652
included in Table 3) with the values -0.0769, 0.0441 and -0.0693
Theta1 + -0.6447 * Theta3 for Alpha/Theta, Attention and Alpha/Beta respectively.
+ 3.5416
Ad#8 -0.407 * Beta3 + 0.0695 * 0.4089 0.1672 Previous studies have found that the Theta/Low-Beta or
Theta1 + 3.8276 “Attention” ratio seems to be negatively correlated with attention
Ad#9 -0.0332 0.0011 levels (which serves as a factor in interest) [6]. The group’s
1.2385 * Beta2 + -1.2889 *
analysis of data had different results though, as the correlation
Beta3 + -0.9078 * Theta2 +
values were positive for six of the nine advertisements (including
1.713 * Theta3 + -0.8216 *
Muscle + 3.4488 the r-value for the entire data set which had a value of 0.0225).
Positive values in the six ads ranged from 0.0442 in Ad #6 to
Whole -0.777 * Alpha2 + 0.3033 * 0.1302 0.0170 0.2847 in Ad #8. Negative values in the three other
Data Alpha3 + 0.3837 * Beta2 + - advertisements ranged from -0.0227 to -0.1888. This
Set 0.3193 * Beta3 + -0.1001 * inconsistency may be due to the difference in equipment and
Theta1 + 1.5825 * Glance + methods used, as the cited study used the Elemaya Visual Energy
-0.3096 * Muscle + 3.443 Tester combined with 2 frontal and 2 temporal electrodes (as
opposed to the Brainfingers’ 3 frontal electrodes). Since
positioning of electrodes, and number of electrodes are key factors
3.4.5 Additional Feature Engineering Results when it comes to EEG, data in the relevant frequency range may
Linear regression was ran again to evaluate whether or not
not have been too accurate [6].
additional features can contribute to model building. The same
process as the original set of features was followed, running linear
The correlation of Alpha/Theta ratios with the interest levels were
regression on data sets per advertisement then the data set as a
negative for 6 of the 9 ads, having values ranging from -0.0166 to
whole. Since there are three new attributes (Alpha/Theta,
-0.5596, while it had a value of -0.0873 for the whole data set.
Attention, Alpha/Beta) each feature vector now has14 dimensions.
Alpha waves are associated with relaxation and usually rise when
one’s eyes are closed, while Theta waves are associated with
Table 5. Linear Regression Results with new features
daydreaming, stress or frustration and the line between being
Data Model R R2 awake or asleep [12]. Since high Alpha/Theta ratios are associated
Set with decreases in information processing, a negative correlation
Ad#1 -1.8252 * Muscle + -0.7139 -0.0947 0.0090 with interest would make sense (though it would still depend on
* Alpha/Theta + -1.1193 * the actual advertisement, as not all may need this information
Attention +5.1099 processing).
Ad#3 0.8281 * Theta3 + -1.5673 * 0.2031 0.0412 In the study conducted by Liu et al. on measuring degrees of
Glance + -0.5359 * human attention, the Alpha/Beta ratio was one of the features that
Alpha/Theta + 4.1957 contributed greatly to the accuracy of their SVM classifier [11]. It
Ad#5 -0.5556 * Alpha3 + 1.1648 * 0.2825 0.0798 was not as significant in linear regression models though, as it was
Beta1 + -0.7991 * Beta2 + - of significance only in three of the ten models constructed. The
0.6172 * Beta3 + 0.8641 * ratio did correlate reasonably well with interest ratings; however,
Glance + -0.5387 * it was inconsistent across advertisements. For ads where the
Alpha/Beta + 4.8217 correlation reached reasonable levels, the value was often
negative, implying increased interest with either lower alpha
Ad#8 0.6654 * Beta2 + -0.8963 * 0.4213 0.1775 waves or higher beta waves.
Beta3 + 3.7815Overall, the additional features did not contribute significantly to Machines (SVM) [12]. This is because SVM is said to be flexible
the results and in some cases, models with the original features enough to handle the dimensionality of the data very well [10].
correlated better with interest. The group ran the algorithm on each data set with 10-fold cross
validation using RBF, Linear and Polynomial kernels, all using
3.4.6 Student-Level Cross-Validation Weka in conjunction with libsvm [15]. All other settings aside
To create a possibly better, more general model, linear regression from the kernel were left as their default values. To divide the
with student-level cross-validation was executed using data with data set into two classes, ratings of 3 or 4 were classified as
the engineered features. The process was done by first creating the “interested” and ratings of 1 or 2 were classified as
five-folds, each containing data from five participants; they were “uninterested”. The class distribution was not very balance, as 148
then labelled Test Set A, B, C, D, E. Training Set A was then vectors were labeled as “interested” and only 77 were labeled as
created, which contains all the data in Test Set B, C, D, E (all the “uninterested”. Table 7 below shows the accuracy of the
data except Test Set A). This process was repeated to create classifier.
Training Set B, C, D, E. Running linear regression with each of
the training sets mentioned produced the models below. Table 7. SVM Results with Original Features
Data Set Linear Polynomial RBF
Table 6. Student-Level Cross-Validation Results
Ad#1 56% 52% 56%
Training Set Model
Ad#2 68% 68% 68%
Set A 0.1976 * Alpha1 + -0.6922 * Alpha2 + Ad#3 96% 96% 96%
0.4083 * Beta1 + -0.1776 * Beta3 + -0.2394 Ad#4 84% 80% 84%
* Theta1 + 0.2928 * Theta2 + -0.7435 * Ad#5 84% 92% 80%
Theta3 + 1.7747 * Glance + -0.3389 * Ad#6 80% 76% 80%
Muscle + 0.561 * Attention +-0.1904 * Ad#7 44% 40% 56%
Alpha/Beta +3.2489 Ad#8 92% 92% 88%
Set B 0.5818 * Alpha1 + -0.8528 * Alpha2 + Ad#9 84% 88% 88%
0.3552 * Alpha3 + -0.7499 * Beta1 + 0.9754 Whole 66.6667% 66.2222% 63.5556%
* Beta2 + -0.5712 * Beta3 + -0.1064 * Data Set
Theta1 + 0.1754 * Theta2 + -0.2989 *
Muscle + -0.2124 * Alpha/Theta + -0.1676 * Table 8. Kappa and ROC Results
Alpha/Beta + 3.7934 Data Linear Polynomial RBF
Set C -0.145 * Alpha1 + -0.2297 * Alpha2 + Kappa ROC Kappa ROC Kappa ROC
0.4772 * Alpha3 + -0.1953 * Beta1 + 0.4958 Ad#1 -0.078 0.467 -0.154 0.433 -0.078 0.467
* Beta2 + -0.2837 * Beta3 + -0.2743 * Ad#2 -0.075 0.472 -0.075 0.472 -0.075 0.472
Theta1 + 1.2752 * Glance + -0.2924 * Ad#3 0 0.5 0 0.5 0 0.5
Muscle + 0.3585 * Attention + -0.1435 * Ad#4 0 0.5 -0.068 0.476 0 0.5
Alpha/Beta + 3.0679 Ad#5 0.254 0.601 0.702 0.851 -0.068 0.476
Set D -0.6202 * Alpha2 + -0.2426 * Alpha3 + Ad#6 0 0.5 -0.071 0.475 0 0.5
0.6322 * Beta1 + -0.4232 * Beta3 + -0.0773 Ad#7 -0.136 0.433 -0.222 0.391 0.116 0.558
* Theta1 + 0.2277 * Theta3 + 1.3639 * Ad#8 0.468 0.667 0.468 0.667 0 0.5
Glance + -0.3927 * Muscle +-0.3042 * Ad#9 -0.064 0.477 0 0.5 0 0.5
Alpha/Beta + 4.0856 Whole 0.049 0.519 0.063 0.525 -0.011 0.496
Data
Set E 0.3301 * Alpha1 + -0.8486 * Alpha2 + Set
0.1716 * Alpha3 + 0.18 * Beta1 + -0.1692 *
Beta2 + 0.0467 * Theta1 + -0.142 * Theta2 + Based on the results above, when it came to the whole data set,
-0.3984 * Theta3 + 1.3907 * Glance + - the linear classifier performed the best with a 66.6667% success
0.3593 * Muscle + -0.1813 * Alpha/Theta + - rate. Though results within individual advertisements seem quite
0.112 * Alpha/Beta + 3.7796 high, one cannot conclude that the classifier worked, as class
distributions within these small 25 vector data sets are often
skewed towards one side; thus, simply labelling everything as
The models were then used to test their corresponding test sets
“interested” may still give a high success rate. Based on the
resulting in predicted ad ratings. The correlation between
Kappa statistic values in Table 8, the models were not very good
predicted ad ratings and the actual ratings was 0.129627 or an r2-
classifiers, despite high accuracy rates reported (probably due to
value of 0.016803. While there is still a correlation, it is very
skewed class distributions); thus, correct classifications are
weak and is only slightly better than the results with 10-fold
probably due to chance.
cross-validation performed with the engineered features (though
that model was created without dividing the data set based on
SVM was run again with the additional features that were
participants). The correlation is also still weaker than the linear
engineered, namely Alpha/Theta, Attention and Alpha/Beta
regression with 10-fold cross-validation done without the
engineered features. (totalling 14 dimensions).
3.4.7 SVM Classification Table 9. SVM Results with Additional Features
One of the algorithms that has been used for classification of Data Set Linear Polynomial RBF
brain-computer interface data before would be Support Vector Ad#1 60% 56% 60%Ad#2 64% 60% 68% from a single ad does not get compressed into a single feature
Ad#3 96% 96% 96% vector leading to a larger and better data set (which can help a lot
Ad#4 84% 84% 84% in classification). Another way to improve the results would be to
Ad#5 88% 88% 80% look for a different way of labeling data with their respective
Ad#6 76% 76% 80% classes. Though participants were asked to answer honestly,
Ad#7 40% 44% 48% numerous other factors may have affected self-assessments.
Ad#8 92% 88% 88%
Ad#9 80% 76% 88% Research can still be done on other features that can be engineered
to help produce better models. The use of other algorithms may
Whole 67.1111% 62.2222% 61.7778%
also lead to a better model and more conclusions, as there may
Data Set
still be a non-linear relationship between the attributes. Other
popular classifiers such as different neural networks or Bayesian
Table 10. Kappa and ROC Results w/ Additional
classifiers may come up with better results. In addition to these,
Features
testing different feature subsets in model creation may improve
Data Linear Polynomial RBF
classifiers, especially with SVM classification.
Kappa ROC Kappa ROC Kappa ROC
Ad#1 0.074 0.533 0 0.5 0 0.5 Reducing the skewedness of the data set towards a certain class
Ad#2 -0.142 0.444 -0.202 0.417 -0.075 0.472 may also improve the classifier (there were too many “interested”
Ad#3 0 0.5 0 0.5 0 0.5 cases in this study). To help the results even more, more
Ad#4 0 0.5 0 0.5 0 0.5 participants are needed to increase the size of the data sets per
Ad#5 0.503 0.726 0.503 0.726 -0.068 0.476 advertisement. This may help lead to more information about
Ad#6 -0.071 0.475 -0.071 0.475 0 0.5 certain ad characteristics and form better, more conclusive
Ad#7 -0.222 0.391 -0.129 0.436 -0.045 0.478 classifiers within each ad data set. In addition to this, more
Ad#8 0.468 0.667 0.336 0.644 0 0.5 advertisements may also help to balance the distribution of
Ad#9 -0.106 0.455 -0.136 0.432 0 0.5 reported interested and uninterested classes.
Whole 0.088 0.535 -0.020 0.492 -0.044 0.482
Data 4. CONCLUSION
Set Attempts to find relationships with EEG data and self-reported
interest levels had mixed results. The study found that there are
Based on the results above, the additional features did not indeed relationships between EEG (and also EMG) data and
contribute much to the model, as Kappa values remain close to 0 interest. Muscle signals and beta waves usually had reasonable
(or 0 in some cases) for most classifiers. In some cases, it actually levels of correlation with interest. The idling rhythms, or
reduced the model’s classification accuracy. Though these Alpha/Theta ratio, showed the expected inverse relationship with
additional features were cited in other studies as significant interest; however, the study had different findings from literature,
contributors to SVM classifiers, using them in conjunction with as it usually found a positive correlation between the attention
each other may have harmed results. In the study by Liu et al. the ratio and interest.
researchers tried multiple subsets of features in order to find the
one that would create the best classifier [11]. This method is No linear model could be made out of almost half of the data sets
computationally expensive for vectors with 14 dimensions and so (per advertisement). Models that were actually made with 10-fold
has not been included in this study, but doing this in future studies cross validation had reasonable r-values and adding new features
may contribute to the accuracy of classifiers and models such as the attention ratio and idling rhythms helped construct an
produced. additional model; however, most r-values were negatively
affected by this.
3.4.8 For Further Study
Since Brainfingers only has three electrodes, it may have lacked Though the SVM classifiers seemed to perform reasonably with
the sensitivity and resolution of better sensors, as it even lacks the classification rates above 60% the data set had a lot more data
ability to measure delta and gamma waves. The use of devices points classified as “interested” rather than “uninterested”. The
with more electrodes may help gather better data that can lead to very low Kappa values show that correct classifications are most
better results. Despite the Brainfingers’ easy set-up, the different likely due to chance.
fits of the adjustable headband may have also influenced results,
as wearing it too tight, too loose or even moving it slightly when Overall, the models are not very good and may not serve as very
worn, affected the data gathered. Different ways of presenting the good predictors of interest in future applications. Based on the
videos may also produce different results (such as presenting them results of the study, it is very difficult to conclude that a viable
in a different order or in blocks). model may be constructed out of data from a consumer device,
such as Brainfingers.
Different data cleaning techniques may help get better results, as
removing data points two standard deviations away and taking 5. ACKNOWLEDGEMENTS
means as a response to headband issues may have also caused a The group wishes to thank the Ateneo Laboratory for the Learning
loss of information. Sciences, especially Dr. Ma. Mercedes T. Rodrigo, Ph.D. and Ms.
Jessica Sugay, not only for the guidance in conceptualizing and
Pre-processing techniques such as separating data according to executing this study, but also for providing the necessary
fixed window lengths together with taking additional interest resources to make it possible. The group would also like to thank
ratings during ad viewing may provide more data and take better the technicians of the Department of Information Systems and
note of EEG, EOG or EMG changes. This also means all the data Computer Science for their help in managing the necessaryresources, and Dr. Andrew Junker for his help with regard to Using the Neural Impulse Actuator: A Usability and Statistical
using the Brainfingers hardware and software. Furthermore, the Evaluation. California Polytechnic State University, 2009.
group wishes to thank the members of the Ateneo de Manila
Programming Varsity for sharing their time in helping us conduct 10 Lotte, F, Congedo, M, Lecuyer, A, Lamarche, F, and Arnaldi,
a dry run and suggest additional advertisements to use for our B. A Review of Classification Algorithms for EEG-based
study. Finally, the group extends its gratitude to all the Brain-Computer Interfaces. Journal of Neural Engineering
participants of the study, for sharing their time for the data (March 2007).
gathering phase.
11 Liu, Ning-Han, Chiang, Cheng-Yu, and Chu, Hsuan-Chin.
6. REFERENCES Recognizing the Degree of Human Attention Using EEG
Signals from Mobile Sensors. Sensors, 13, 8 (2013).
1 Aitchison, Jim. Cutting Edge Commercials. Prentice Hall,
Singapore, 2001. 12 Larsen, Erik. Classification of EEG Signals in a Brain-
Computer Interface System. Norwegian University of Science
2 Fredrickson, Barbara. Cultivating Positive Emotions to and Technology, 2011.
Optimize Health and Well-Being. Prevention & Treatment, 3
(March 2000). 13 Hall, Mark, Frank, Eibe, Holmes, Geoffrey, Pfahringer,
Bernhard, Reutemann, Peter, and Witten, Ian. The WEKA
3 Averill, James. On the Paucity of Positive Emotions. In Kirk Data Mining Software: An Update. SIGKDD Explorations, 11,
Blankstein, Patricia Pliner, Janet Polivy, ed., Assessment & 1 (2009).
Modification of Emotional Behavior. Plenum Press, New
York, 1980. 14 Raftery, Adrian E. Bayesian Model Selection in Social
Research. Sociological Methodology, 25 (1995), 111-163.
4 Demetrios Vakratsas, Tim Ambler. How Advertising Works:
What Do We Really Know? Journal of Marketing, 63, 1 15 Chang, Chih-Chung and Lin, Chih-Jen. LIBSVM: a library for
(January 1999). support vector machines. ACM Transactions on Intelligent
Systems and Technology, 2, 3 (2011), 27:1-27:27.
5 Tan, Desney and Nijholt, Anton. Brain-Computer Interfaces
and Human-Computer Interaction. In Brain-Computer 16 Guillaume Chanel, Julien Kronegg, Didier Grandjean, Thierry
Interfaces. Springer, London, 2010. Pun. Emotion Assessment: Arousal Evalutation Using EEG's
and Peripheral Physiological Signals. University of Geneva,
6 Anton Poltnikov, Natalia Stakheika, Carlotta Schatten, Geneva.
Francesco Bellotti, D. Paranatha, R. Berta, A. De Gloria.
Measuring Enjoyment in Games Through 17 Polivy, Janet. Measuring and Modifying Moods: An
Electroencephalogram (EEG) Signal Analysis. University of Introduction. In Kirk Blankstein, Patricia Pliner, Janet Polivy,
Genoa, Genova. ed., Assessment & Modification of Emotional Behavior.
Plenum Press, New York, 1980.
7 Custódio, Pedro Filipe de Jesus Pereira. Use of EEG as a
Neuroscientific Approach to Advertising. Technical University 18 Graham Hooley, Nigel Piercy, Birgitte Nicoulaud. Marketing
of Lisbon, Lisbon, 2010. Strategy. Pearson Education, 2012.
8 Ohme, Rafal, Wiener, Dawid, Reykowska, Dorota, and 19 Hollis, Nigel. Emotion in Advertising: Pervasive, Yet
Choromanska, Anna. Analysis of Neurophysiological Misunderstood. Millward Brown, 2010.
Reactions to Advertising Stimuli by Means of EEG and
Galvanic Skin Response Measures. Journal of Neuroscience,
Psychology, and Economics, 2, 1 (2009), 21-31.
9 Braydn Renolds, Aaron Waechter. Brain Computer InterfacingYou can also read


