Climate Analysis and Monitoring - Research Plan for 2015 2019 14 January 2015 - Faron Anslow
←
→
Page content transcription
If your browser does not render page correctly, please read the page content below
Climate Analysis and Monitoring
   Research Plan for 2015‐2019

            14 January 2015

                              Faron Anslow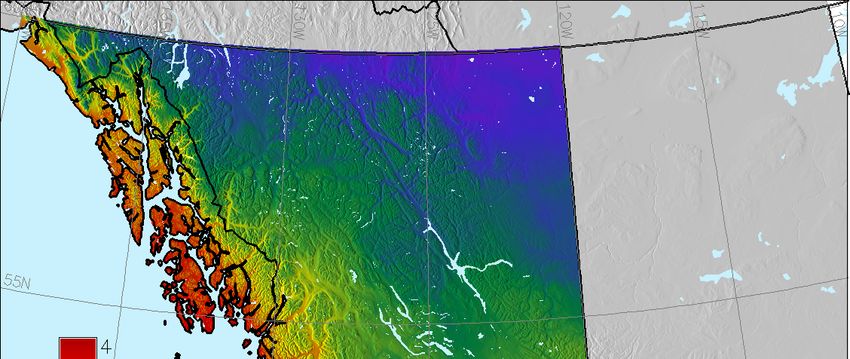
ii
Climate Analysis and Monitoring
   Research Plan for 2015‐2019

            14 January 2015

                              Faron Anslow

                                        iii
iv
Citation
Anslow, F., 2015: Climate Analysis and Monitoring, Research Plan for2015-2019. Pacific Climate
Impacts Consortium, University of Victoria, Victoria, BC, 19 pp.

About PCIC
The Pacific Climate Impacts Consortium is a regional climate service centre at the University of Victoria
that provides practical information on the physical impacts of climate variability and change in the Pacific
and Yukon Region of Canada. PCIC operates in collaboration with climate researchers and regional
stakeholders on projects driven by user needs. For more information see http://pacificclimate.org/.

Disclaimer
This information has been obtained from a variety of sources and is provided as a public service by the
Pacific Climate Impacts Consortium (PCIC). While reasonable efforts have been undertaken to assure its
accuracy, it is provided by PCIC without any warranty or representation, express or implied, as to its
accuracy or completeness. Any reliance you place upon the information contained within this document is
your sole responsibility and strictly at your own risk. In no event will PCIC be liable for any loss or
damage whatsoever, including without limitation, indirect or consequential loss or damage, arising from
reliance upon the information within this document.

                                                                                                           v
vi
Acknowledgements

The foundations for the work outlined in this plan were put in place by the visions of Dave Rodenhuis,
Ted Weick, Lawrence Pitt, and Francis Zwiers by establishing the Climate Related Monitoring Program
data sharing agreement and funding to bring PRISM to BC. The Pacific Institute for Climate Solutions
has provided ongoing support for PRISM climate and timeseries mapping. The BC Climate Action
Secretariat has provided program guidance and contract support for projects surrounding the Climate
Related Monitoring Program. Thanks to all of these contributors. Finally, I'd like to thank my partner for
putting up with the excessively long hours that I've worked over the past year in the name of these
projects.

                                                                                                         vii
viii
Climate Analysis and Monitoring
                                                   Research Plan for 2015-2019
About PCIC…………………………………………………………………………………………………v
Acknowledgements……………………………………………………………………………………….vii
1. Introduction ........................................................................................................................................... 1
  1.1     Background: Means for Broad-Scale Understanding of BC's Climate ......................................... 1
  1.2      The Climate Analysis and Monitoring Theme .............................................................................. 2
  1.3     Progress referenced to the 2012-2016 five-year plan.................................................................... 3
     1.3.1      Develop the PCDS ................................................................................................................ 3
     1.3.2      PRISM Mapping ................................................................................................................... 4
     1.3.3      Seasonal Climate Reviews .................................................................................................... 4
2. Research Plan ........................................................................................................................................ 5
  2.1      Purpose .......................................................................................................................................... 5
  2.2     Two-year Research Objectives ..................................................................................................... 5
     2.2.1      Development of the Provincial Climate Dataset ................................................................... 5
     2.2.2      PRISM Mapping ................................................................................................................... 5
     2.2.3      Delivery of Climate Information and Service Objectives ..................................................... 5
  2.3     Five-year Research Objectives...................................................................................................... 6
     2.3.1      Development of the Provincial Climate Dataset ................................................................... 6
     2.3.2      PRISM Mapping ................................................................................................................... 6
     2.3.3      Delivery of Climate Information and Service Objectives ..................................................... 8
  2.4      Spatial Domain.............................................................................................................................. 9
3. Approach ............................................................................................................................................. 10
  3.1      Roles and Resources ................................................................................................................... 10
  3.2      PCDS........................................................................................................................................... 10
     3.2.1      Quality Control ................................................................................................................... 10
     3.2.2      Calculating CLIMDEX Indicies ......................................................................................... 11
     3.2.3      Homogenisation of station data........................................................................................... 11
  3.3      PRISM......................................................................................................................................... 11
     3.3.1      Timeseries Mapping ............................................................................................................ 11
     3.3.2      Uncertainty .......................................................................................................................... 12
     3.3.3      Extension to Extremes. ....................................................................................................... 13
4. Applied Research Activities and Deliverable Products ...................................................................... 14
  4.1      Developing the PCDS ................................................................................................................. 14
     4.1.1      Maintain data ingestion and improve data quality in the provincial climate data set.
     Ongoing from present. Secondary quality control by fiscal year end 2015-2016............................... 14
     4.1.2      Work with CRMP partners to improve the meta-data content and delivery with PCDS data
     (student opportunity). Begin 2014-2015 and ongoing throughout this research plan ......................... 14
     4.1.3      Calculate CLIMDEX indices on the data in the provincial climate data set. Complete by
     2015-2016. .......................................................................................................................................... 14
     4.1.4      Homogenize long records of climate station data in concert with Environment Canada
     scientists. Changepoint detection complete by 2016-2017. ................................................................ 14
  4.2      PRISM climate mapping ............................................................................................................. 14
     4.2.1      Update PRISM climate normals to most recent normal period and produce monthly
     timeseries maps. Complete by fiscal year end 2014-2015. ................................................................. 14
     4.2.2      Release of monthly PRISM maps. 2015-2016. have routine map release up and running by
     2016-2017. .......................................................................................................................................... 14
     4.2.3      Begin to quantify the reliability of PRISM products. Release climate map uncertainty
     products by 2015-2016. ...................................................................................................................... 14

                                                                                                                                                            ix
4.2.4 Expanded application of PRISM to daily timeseries and mapping of extremes. Under
investigation and PRISM/PCIC roles established by 2017-2018. ...................................................... 14
4.3 Seasonal Climate Reviews .......................................................................................................... 14
4.3.1 Deliver monthly and seasonal anomaly maps in both point and gridded format. Complete
2014-2015. .......................................................................................................................................... 14
4.3.2 Expand seasonal analysis to include atmospheric circulation anomalies. Complete
automated mapping products by 2015-2016. ...................................................................................... 14
4.3.3 Produce descriptive seasonal climate analyses at regular intervals. 2016-2017. ................ 14
4.3.4 Development of a web tool for generation of custom maps for climate analysis in BC.
2016-2017. .......................................................................................................................................... 14
4.3.5 Develop high-resolution climate anomaly maps based on the ongoing monthly PRISM
maps. 2017-2018. ................................................................................................................................ 14
5. References ........................................................................................................................................... 15
6. Figures ................................................................................................................................................ 17
x1. Introduction
1.1 Background: Means for Broad‐Scale Understanding of BC's Climate
The province of British Columbia spans a diversity of climates ranging from moist, temperate forests
along the southwest coast to arid regions in the interior, sub-arctic taiga in the northeast to high altitude
ice fields in the Coast Range. Furthermore, the large-scale climate variations are perturbed locally by
topography which induces such features as rainshadows, cold air pooling, and orographic influence on
temperature and precipitation. These effects lead to diverse climate regimes in close proximity. This range
is exemplified by the annual climatology of precipitation and temperature shown in Figures 1 and 2
respectively. The climate of BC is furthermore complicated by the province's proximity to the Pacific
Ocean. Natural variability in the region owing to the El Niño Southern Oscillation has been widely
documented and has impacts on temperature and precipitation especially during the winter months.
related to this variability, recent research has been divided on whether climate change along the west
coast of North America is detectible owing to the influence of sea surface temperatures on climate of the
region and the large decadal and longer temporal scale natural variability associated with the northeast
Pacific Ocean (Abatzoglou et al., 2014; Johnstone and Mantua, 2014). Inland of the coast, temperatures
have warmed substantially and are less dependent on the modulating effects of the Pacific. Detection of
BC regional change associated with the changing global climate will benefit from a description of British
Columbia’s climate baseline in the form of station based measurements and spatially interpolated
climatology. Analysis of climate data also allows for calculation of recent seasonal weather anomalies
and extremes where they occur. These data, in conjunction with other atmospheric data sets, can also be
used in a research context to examine physical mechanisms that lead to the occurrence of anomalies and
extremes in British Columbia weather, and as targets for statistical downscaling.
Climate has most reliably been measured through instrumental observations of weather variables over
long periods of time. In British Columbia, station measurements date back to the early 1870s and there
are substantial numbers of measurements throughout the 20th century through to present. These data are
useful for characterizing the mean climate state and the statistical variability about that mean, thus setting
the background for climate change and extremes analysis. A nearly complete archive of station
observations for British Columbia is now housed at PCIC and is supplemented in near real-time through
automated connections with Environment Canada and two of the larger provincial observational
networks: The Ministry of Transportation and Infrastructure and the Ministry of Forests, Lands and
Natural Resource Operations. Automated procedures for delivery of monthly updates from BC Hydro are
also in place.
In the last ~40 years, more observational tools have become available such as remote sensing. Examples
of weather related remote sensing instruments include Doppler radar on the ground and satellites capable
of measuring a wide variety of variables using multispectral sensing. These techniques are useful for
assessing conditions over large areas nearly simultaneously, but their observational records are fairly
short and the life-span of individual instruments is generally less than a decade making homogeneity a
major issue. These factors continue to limit their use for understanding climate variability on multidecadal
and longer timescales, yet remote sensing data are incorporated into atmospheric reanalysis which enable
better climate analysis. Looking forward, observational records from remote sensing will become better
homogenized and the records long enough for longer-term climatological work.
Station observations have their own pitfalls including changes in instrumentation, station location, and
physical setting that occur over time. Observational records are also subject to interruptions in station
records due to lack of funding, community needs, maintenance among other reasons. Station data
represent a valuable resource to many types of users including applied researchers, the interested public,
and industry despite these limitations (Miles and Associates, 2003). Furthermore, it is the responsibility of
1the custodians of climate data to ensure that the quality of the data and any efforts to improve the data are
fully documented and that this documentation is passed on to subsequent users.
One application of station data is the
production of spatially interpolated Table 1: Acronyms used throughout this document
climatological fields. A four-kilometre Acronym Meaning
resolution climatology was previously
developed for BC over the 1961-1990 climate BCMoE BC Ministry of the Environment
normal period by the PRISM Climate Group
BPA Bonneville Power Administration
at Oregon State University (Daly et al., 1994;
Daly et al., 2002; Daly et al., 2008). This CAM Climate Analysis and Monitoring
product has been used extensively by PCIC
and many other users ranging from ecologists CLIMDEX Climate Indices for Extremes
to glaciologists to foresters. Along with the CRMP Climate Related monitoring Program
value of the PRISM climatology, the ease of
access to this data as made available through ENSO El Niño Southern Oscillation
the ClimateWNA software (Wang et al., HI PCIC Hydrological Impacts Theme
2006; Wang et al., 2011) is a prime reason for
its wide use. PCIC alone receives numerous NOAA National Oceanic and Atmospheric
requests for information from the CWNA Administration
product. Since the generation of PRISM for OSU Oregon State University
the 1961 -- 1990 climate normal period and
the development of CWNA, PCIC has PCDS Provincial Climate Data Set
produced a new, high resolution climatology PCIC Pacific Climate Impacts Consortium
for the province as a result of a collaboration
with the PRISM Climate Group. This product PDO Pacific Decadal Oscillation
has been incorporated into Climate BC which
PICS Pacific Institute for Climate Solutions
is a sister product of CWNA. Despite this
update, the end-year of the current mapped PRISM Parameter Regression on Independent
normal period is almost 15 years in the past. Slopes Model
This places emphasis on the need for maps for
the most recent climate normal period of RCI PCIC Regional Climate Impacts
1981-2010. Once these maps are completed, SCR Seasonal Climate Review
regular updates will keep BC's climate normal
picture up-to-date.
1.2 The Climate Analysis and Monitoring Theme
The Climate Analysis and Monitoring (CAM) theme at the Pacific Climate Impacts Consortium aims to
meet needs for reference climate data and also aims to interpret recent seasonal weather in light of climate
data available for the province. Externally to PCIC, the CAM theme is actively supported by the BC
Ministry of Environment (BCMoE) and the Pacific Institute for Climate Solutions (PICS) who recognize
the fundamental importance of weather and climate observations in the Pacific region in the context of
climate variability and change. This research plan identifies the complementary roles of each organization
so that data is utilized for practical benefits to industry and government, in addition to its research value.
The BCMoE leads the multi-agency effort of CRMP and is primarily responsible for the collection of
meteorological data from multiple networks operated by provincial ministries and corporate organizations
in the province.
PCIC is committed to the CAM project as a major, strategic theme to provide reference climate data and
near-real-time interpretation of recent seasonal weather. This includes, climate monitoring and
2interpretation of climate variability and trends, as well as the occurrence of extreme events. Presently,
CAM remains a developing theme within PCIC. Nevertheless CAM is able to serve the needs for past
climate data within PCIC and a broad range of users in BC. These data are used in the private sector,
industry, and government for applied research, as well as for information to meet the public interest and
as downscaling targets by PCIC’s other themes.
The main purposes of the CAM theme are to:
Incorporate ongoing observations and improve the quality of data in the Provincial Climate Data
Set (PCDS): by assembling, hosting, maintaining and providing data access as described in the
CRMP agreement (BC Ministry of Environment, 2010).
Use these data to develop high spatial resolution maps of British Columbia climate for the
variables Tmin, Tmax, Tmean, and Precipitation for all months of the year and for the annual
mean/total as described in the CRMP agreement and PRISM agreements (2010a,b).
Subsequently, use PRISM to develop timeseries maps of monthly mean temperature and
precipitation.
Apply the PCDS to monitor seasonal weather anomalies and relate these anomalies to known
modes of seasonal variability in western North America such as the El Niño Southern
Oscillation.
Deliver this information (PCDS, climate maps, and the results of climate monitoring) to the
private sector, commercial enterprises, and governments for research, planning and policy
guidance. Seasonal information on climate anomalies, trends and extreme events will also meet
the interests of the public in British Columbia.
The research activities of the CAM theme can be broken down into three temporal scales which are
consistent with those under consideration by the other PCIC themes. For CAM, these timescales are
oriented toward the past because this theme is not aimed at forecasting or making climate projections.
Specifically, the timescales of interest for the past are:
Short-term – Monthly to annual
Near-term – Annual to decadal
Long-term – Multidecadal to centennial.
Because the majority of CAM research activities are limited by the temporal extent of available station
data, activities will be limited to the period from 1870 through the present with an emphasis on the period
from the 1950s onward for which observational data are more widely available.
1.3 Progress referenced to the 2012‐2016 five‐year plan
A useful metric for the planning process and for the progress of the theme itself is to review the previous
research plan and assess its prescience. The subsections below reflect the division of the applied research
activities from the previous research plan and within each one, the broad accomplishments and remaining
unaccomplished activities will be described. Together, these will help lead into the upcoming research
plan.
1.3.1 Develop the PCDS
To-date, the PCDS is incorporated into a database and is accessible via a web based portal through a
simple interface that makes accessing the data simple for basic and advanced use. An initial version of
climate normals has been placed on the data portal for the stations that have sufficient record for this. The
database is being updated in near-real time through automated feeds from Environment Canada, the
Ministry of Transportation and Infrastructure, and the Ministry of Forests, Lands, and Natural Resource
Operations Wildfire Management Branch. Automated monthly updates are also provided by BC Hydro
and ingested manually. Together, this comprises the backbone of meteorological data collection in the
3province but does require PCIC-initiated requests for data from the remaining network operators to keep
the dataset as up-to-date as possible. The data in the PCDS has now undergone a basic set of range checks
and other simple quality control procedures. There remain a large number of relatively simple quality
control methods that should be applied to the data and this remains a priority of the theme as outlined in
the research proposed here. However, this remains a yet-to-be realized piece of low hanging fruit to
enhance the usability of the dataset for PCIC's users. For a project investigating the occurrence of extreme
rainfall due to so-called atmospheric rivers, precipitation records were analyzed for extreme single and
multi-day rainfall events. Finally, in support of the recent release of the IPCC WG1 report, temperature
records were analyzed for trends in the occurrence of frost-days across BC.
1.3.2 PRISM Mapping
The biggest advancement of the theme in the past two years has been the development and release of new
PRISM climate normal maps for British Columbia for the 1971 -- 2000 climate normal period. This
process involved significant collaborative work with the PRISM Climate Group at Oregon State
University, assistance from a research intern for the spring 2012, and development of a means of
integrating snow and glacier observations into the precipitation observation network for the province.
These maps have been made available via a web portal through the efforts of PCIC's computational
support theme. Most recently, the mapping effort has preliminarily been extended toward developing
timeseries maps of monthly average maximum temperature, minimum temperature, and precipitation
from 1950 onward. PCIC has also been contracted by the BPA and NOAA to develop climate maps for
the 1981 -- 2010 climate normal period and this work is underway. Developing methods to assess
uncertainty and sensitivity of PRISM has not been tackled save for initial methodological discussions
with Chris Daly and the inclusion of Alex Cannon in the effort. Finally, a comparison between PRISM
and the output from other gridded climate products is yet to be completed but would be valuable both
internally and externally to PCIC.
1.3.3 Seasonal Climate Reviews
The CAM theme has been regularly issuing maps showing the monthly temperature and precipitation
anomalies at observational sites in BC. The maps are now made available on the PCIC website on the
second of every month for the preceding month and refreshed with updated data on the 15th of each
month. In the past year, some time has been invested in developing a similar, automated system for
mapping anomalies from an atmospheric perspective using the North American Regional Reanalysis. This
supports rapid analysis of atmospheric conditions that may have led to anomalies observed at stations as
presented in the earlier product. In both of these efforts, progress has been made to cast the anomalies in
the perspective of the statistical distribution of the historical record such that each month's anomaly at
each station (or location in the reanalysis) is presented in the context of expectation for that location.
Although not yet a component of the seasonal climate reviews, CAM has invested effort in developing
methods to spatially interpolate anomalies and then use the interpolated products to investigate trends in
temperature, precipitation and their derivatives (such as Frost Days) province-wide as well as over
smaller regional subsections such as the Ecoprovinces.
42. Research Plan
2.1 Purpose
This section is intended to outline the research activities of the CAM theme from 2014 through 2018.
Individual activities are organized into two-year and five-year outlooks and are separated among the
broad research areas of the CAM theme. The proposed methodology for achieving the objectives outlined
below is given in section 3.
2.2 Two‐year Research Objectives
2.2.1 Development of the Provincial Climate Dataset
In its present state, the PCDS is assembled and available through PCIC's data portal. Activities related to
the dataset will therefore focus on maintaining the near real-time ingestion of observational data and
improving the data already present in the database such that its value is enhanced for users. This effort
will be furthered by working jointly with the CRMP to begin cataloguing metadata for stations in the
PCDS. This is a major task, so it will extend over the two- and five-year timespans of this research plan.
Initial efforts are underway to establish basic, standardized information at stations that are part of the
CRMP’s climate network. These include sensor siting, orientation, exposure, and basic sensor
information. Surprisingly, while some of these data are gathered by most networks, there is not yet a
unifying standard for all networks in BC’s government. Further efforts to gather this basic data will
greatly enhance the value of the PCDS data. Additionally, projects focussed on analyzing the station data
and adding value will be conducted. The current activity of computing trends on province-wide and
regional scales is one example. Within the two-year timeframe, calculation of the CLIMDEX indexes on
the station data will be a priority. This activity necessarily follows on the heels of further quality control
efforts, including the homogenization of key long-duration records that have not yet been homogenized
by Environment Canada.
2.2.2 PRISM Mapping
Creating the 1981-2010 climate normal maps is one of the most important applied research activities for
the CAM theme in the near term. This work has been contracted by NOAA and the BPA in the United
States. At the time of this writing, the process is under way with a deliverable date of March, 2015.
Beyond this timeframe, focus will turn toward generating a set of monthly time-series maps of
temperature and precipitation with aim toward completion by 2016. This will enable the merging of
PRISM mapping products with seasonal climate review activities which rely on a separate stream of
spatially interpolated data. The third major research goal is to develop an uncertainty product to
accompany PRISM climate and timeseries maps.
2.2.3 Delivery of Climate Information and Service Objectives
Activities in this section are tied to work in the previous two in terms of data delivery and public-facing
products. Regional anomaly and trend maps will be used to update the 2002 climate indicators report (BC
Ministry of Environment, 2002) and these methods may be used to update trends and assess monthly and
5seasonal anomalies in terms of the historical record. This will be part of the seasonal climate review
process in the next two years and will contribute to updating the regional climate summaries that the RCI
theme is undertaking this year. In the near-term, automated generation of circulation anomalies from the
North American Regional Reanalysis (Messinger et al., 2006) will be released with the monthly and
seasonal anomaly maps to aid in interpreting observational anomalies. Finally, the station-based anomaly
product will be modified to reflect anomalies in terms of the historical record of the station to indicate the
anomaly normalized to each station's variability. This will allow users to quickly grasp how unusual a
given month or season's anomaly is within the scope of the station’s record. Finally, we aim to make an
initial release of the monthly PRISM timeseries maps on the web portal by the end of the 2015-1016
fiscal year. The generation of the maps is an ambitious undertaking, and the full release is not likely to
occur prior to the end of fiscal year 2016-2017. However, once the maps are generated, delivery of the
maps will be straightforward owing to the extensible nature of the data portal developed by PCIC’s
Computational Support group.
2.3 Five‐year Research Objectives
2.3.1 Development of the Provincial Climate Dataset
Developing the PCDS will be an ongoing effort throughout the span of this and subsequent research
plans. It is expected that work collecting, storing, and delivering metadata will be take a substantial
amount of time and will not be completed even in the 5-year scope of this document. However, this effort
will add substantial value to the PCDS and is supported by BC government. More importantly from a
research perspective, CAM will initiate efforts to homogenize longer records in the PCDS. The aim is to
supplement the work of Vincent et al. (2002) and Mekis et al. (1999) in making a more comprehensive
set of benchmark climate records for British Columbia. These efforts will focus on temperature and
precipitation variables to begin with. Completion of homogenization efforts is dependent on acquiring
metadata on the station data (such as station re-siting, instrument changes and changes to the
measurement environment) as well as completion of rigorous quality control of the station data. Because
of these somewhat onerous requirements, approaching the homogenization as a staged effort is most
appropriate. Initial efforts may focus on automated change detection within records and identification of
suitable long-term stations and nearby partner stations. As this is conducted, quality control and metadata
process could be performed in parallel. Thus far, much of the work with the PCDS has been oriented
toward the primary climate variables of temperature and precipitation. In the long-term, extending
anomaly and trend analysis to other variables in the dataset such as wind, snow, and humidity will be
explored.
2.3.2 PRISM Mapping
The long term efforts associated with PRISM will be oriented toward near real-time production of maps
and extension of the mapping efforts to other variables or derived variables. Early in the extended period,
work with PRISM will be oriented toward releasing monthly maps in near real-time as data becomes
available from feeds into the PCDS. Efforts to assess the viability of developing a daily PRISM timeseries
will also be made. The PRISM Climate Group in the US has an operational component aimed at
producing daily maps that is comprised of several full-time employees dedicated to the task in addition to
an overall greater availability of observational data. The task is somewhat onerous given the resources
available to CAM and PCIC as a whole so daily maps will remain investigational within the scope of this
plan. An example of one of the hurdles is the comparative lack of archived and spatially comprehensive
radar coverage over Canada. The PRISM group's efforts to create daily maps of precipitation rely strongly
on nearly complete radar coverage of the US to establish the precipitation occurrence mask for a given
day. Furthermore, as temporal scales shorten, so do the correlation lengths of observed anomalies thus
6making higher spatial density of observations critical for producing accurate fields. Some portions of
British Columbia may not have sufficient spatial coverage to justify high resolution daily PRISM
products. However, if users see a need for daily PRISM maps and the task proves feasible, then this may
be pursued in future if resources are made available. The most novel application of PRISM will be
investigating the potential for using PRISM to map extremes. Preliminary work with station data indicates
that extremes follow spatial gradients in a manner similar to longer term averages. Mapping extremes
would provide a good framework for ongoing collaboration with the PRISM Climate Group at Oregon
State University once uncertainty work is completed. This brings up a broader issue of maintaining the
PRISM code in the future. A fruitful approach might involve ongoing collaboration with the PRISM
Climate Group through the exchange of in-kind support with each institute contributing resources in their
areas of expertise. In the instance of developing an extremes product, PCIC's expertise lies in statistical
understanding of extremes as well as nuances of climate and meteorological phenomenon in British
Columbia. PRISM Climate Group has experience applying PRISM to alternative climate variables such
as humidity, and standard deviation in daily temperature. Combining efforts could lead to a mutually
beneficial approach to fulfill a growing demand for understanding extreme events.
7Table 2: Research objectives of the Climate Analysis and Monitoring theme.
Objective Description Temporal Priority
range of study
1 PRISM Climatology Mapping: Development of the Long‐term 1
1981‐2010 period monthly and annual climate normal
maps for British Columbia.
2 Development of the PCDS: Update and maintain the Short‐term and 1
database of historical station data. Implement near‐ Long‐term
real‐time quality control. Begin process of identification
of long station records suitable for homogenization and
application of change‐point techniques. With sufficient
meta‐data complete homogenization.
3 PRISM Uncertainty and Sensitivity Analysis: Perform Long‐term 1
analysis of PRISM to assess the uncertainty and
parameter sensitivity of the maps and use this
assessment as an indicator of the utility of the maps as
well as to inform users of PRISM climate maps.
4 PRISM Time‐series Mapping: Generation of a time Long‐term 2
series of 30 arc‐second maps of temperature and
precipitation in British Columbia on a monthly basis.
Initially, these maps will be produced for years 1950 to
present. Future work will explore production of
monthly in near real‐time and investigation of
production of daily PRISM maps.
5 Develop Seasonal Climate Reviews: Expand the existing Short‐term 2
station anomaly maps to include regional gridded
anomalies and atmospheric circulation anomalies.
Aspire to develop a web‐tool to allow a user to create
custom maps of station and gridded anomalies and data
to meet their own needs. Utilize PRISM monthly maps
in the anomaly mapping process.
2.3.3 Delivery of Climate Information and Service Objectives
Activities aimed at delivering climate information will be oriented around the data portal and eventually
toward allowing users to begin to customize products to meet their own needs. As they are generated, the
PRISM monthly maps will be placed on the data portal. Anomaly maps may be calculated from these but
doing so will require careful analysis of the effects of an evolving network on the PRISM maps. Although
the present effort of generating monthly analysis of temperature and precipitation anomalies for the
province is not labour intensive, the process is not highly flexible. An approach tailored to users' needs by
allowing them to select timeframes and variables of interest to generate their own maps and data sets
would be ideal. Thus, a useful avenue for seasonal reviews is to develop such automated tools for use by
the lay person and the technical user as well. An example use case would answer needs that could arise
after the occurrence of a high magnitude precipitation event. The proposed tool could be used to analyse
the extent of anomalies, the magnitude (on the timescale of days or hours where data is available) and
some of the contributing atmospheric conditions that lead to the event. Because PCIC's services are not
intended to be serving the immediate and real-time operational time scale, this tool would be most useful
8to policy makers, planners, and scientists looking at recent or distant historical events rather than
addressing conditions of an evolving system. One existing example of a similar tool was created jointly
by Ouranos and Environment Canada and is managed through Climate-Québec (see http://www.climat-
quebec.qc.ca). Customized mapping could have a very large scope as described above. For this research
plan, we will aim to focus on surface temperature and precipitation observations and a small set of
atmospheric circulation variables such as geopotential height, wind components, water vapor, and
temperature at several pressure levels and enable analysis on monthly and seasonal time scales first. Once
a proof of concept is established and the demands of developing such a tool are understood, then we can
reassess any possibility of expanding the tool. Finally, a long-term goal of the theme has been to issue
seasonal documents outlining the anomalies for the previous periods and highlighting some of the
atmospheric drivers behind those anomalies. By the end of the 5-year research cycle, this should be a firm
component of the CAM theme.
2.4 Spatial Domain
The activities outlined in this research plan are intended to provide greater climate understanding over the
entirety of the province of British Columbia. The Seasonal Climate Reviews will be described for the
province as a whole and also by sub-region. Additionally, some coverage of all of western Canada will be
provided through the use of reanalysis data and station data made available by Environment Canada.
However, broad and thorough extension of these efforts is somewhat precluded by the lack of a data
sharing agreement between these provinces/territories analogous to the CRMP Agreement, although data
are becoming better organized in recent years. Subregional break-down of weather reviews will be made
following the eco-provinces as shown in Figure 3 as well as the BC Resource Regions which are actively
used by organizations within FLNRO as well as other ministries. Descriptions of regional details will
enable users of Seasonal Climate Reviews to quickly focus on the locations that they are most interested
in. It is important to note, especially for seasonal climate products, that the inferences that can be made
for the north and northeast part of BC will be accompanied by greater uncertainty than those for the south
of the province owing to the much lower station density in those regions. While much of CAM’s focus is
province wide, some aspects of the seasonal climate products will apply at the point, or individual station,
scale.
93. Approach
3.1 Roles and Resources
The research proposed in this plan will principally be conducted by PCIC with aid from PICS, the
BCMoE, and the PRISM climate group. There will be a distribution of work among the research themes
of PCIC with CAM taking the leading role, and the CAM lead taking responsibility for assignment and
completion of tasks. External collaborative work is planned with the PRISM Climate Group at Oregon
State University although PCIC's formal agreement with the PRISM Climate Group has ended.
Furthermore, collaborations are expected between the various British Columbia Ministries for the purpose
of data sharing and the transfer of metadata.
Data delivery and ongoing work with quality control and metadata will be done in association with the
BCMoE CRMP Program, who will also participate by reviewing and interpreting results for planning and
policy applications. Furthermore, the BCMoE will insure that the collaborating British Columbia
ministries and cooperating organizations who have contributed observational data and site metadata will
also receive the benefits from climate analysis and monitoring by PCIC; e.g., access to datasets (PCDS),
climate maps and time series.
PCIC's computational support group's resources and expertise will be needed for the development of web-
facing tools to access PCDS data, various climate products produced by the CAM theme, and interactive
analysis tools. Their support has enabled very efficient development of existing web products and other
software at a much higher level of quality than so-called research grade software.
3.2 PCDS
3.2.1 Quality Control
Much of the research work associated with the formation of the PCDS revolves around the intertwined
efforts of performing quality control on the data and calculating station normals. Beyond the already-
applied range checks, further quality control will incorporate nearby station data to identify outliers and,
at the most sophisticated, will incorporate machine learning-based methods for the detection of errors in
measurements. Some examples can be found in the work of Dereszynski et al. (2007) and Hill et al.
(2009). These approaches will not be implemented until the later part of this research plan.
Comparison of measurements at one station with those from a nearby station is a part of so-called buddy
checking. The PRISM climate mapping process provides an avenue for doing this at the monthly
timescale, so by proceeding with climate mapping, better quality controlled station data will arise
iteratively. In addition to the PRISM approach, we propose to apply a unified set of quality control
procedures to the temperature and precipitation records in the data set at the daily time scale using
techniques already published in operational manuals (such as those from the WMO) and the scientific
literature. Specifically, these will focus on approaches that use the statistics of the data within a given
station to identify outliers as well as approaches using nearby stations to identify faulty measurements or
periods of offset (a selection of methods are outlined in Belousov et al., 1972; Miller and Benjamin, 1992;
Shafer et al., 2000; Durre et al., 2010; Dunn et al., 2012). This analysis will be aided for temperature by
using the daily Adjusted Homogenized Canadian Climate Dataset whose stations can serve as anchor
stations in regions with sufficient station density for providing "buddy" checks. We will investigate
applications of single station quality control in a study region with low station density and combined
single-station and station methods in a study region with higher station density. Quality control using
nearby stations will be tested in the sparse area as well. It is expected that the precipitation data are of
lower quality and will present a greater challenge, especially the observations from the winter season and
for remote/high elevation sites. Toward the latter parts of the 5-year period these quality control
techniques will be applied to other variables in the PCDS.
103.2.2 Calculating CLIMDEX Indicies
A useful expansion of the description of climate for a given station is to detail the magnitude of extremes
observed in the station's record. The CLIMDEX indices provide a standardized suite of quantified
descriptors of temperature and precipitation extremes. PCIC has contributed greatly to the understanding
of extremes both through contributing to work analyzing extremes in climate projections (Sillmann et al.,
2013a,b) and through the development of the “climdex.pcic” R programming package to analyze gridded
and station data for the CLIMDEX indices (available at http://cran.r-
project.org/web/packages/climdex.pcic/index.html). This R package makes calculation of the CLIMDEX
indices straightforward once appropriate quality control measures have been applied to the data. Some of
this has been completed as part of a project investigating so-called atmospheric rivers in the province
wherein 95th and 99th percentile precipitation events were analyzed. When completed, the CLIMDEX
indices will provide an important additional climate descriptor for stations in BC. In a major extension of
the PRISM mapping effort, these indicators may be used to create high resolution maps of extremes as
outlined below. This will give a novel picture of climate in British Columbia.
3.2.3 Homogenisation of station data
For the purposes of climate analysis, long, continuous records of climate variables are very useful for
determining trends. Environment Canada has a set of homogenized temperature, precipitation, sea level
pressure, and wind speed data for selected locations Canada-wide. In British Columbia, this comprises
~50 stations for temperature (Vincent et al., 2012; Vincent et al., 2002) and ~100 stations for
precipitation (Mekis and Vincent, 2011; Mekis et al., 1999). These records have been created using
Environment Canada stations which are often situated at relatively low elevations in BC near human
habitation. A similar dataset using stations from the PCDS could extend the spatial coverage to less
populous regions and also to high elevation sites. However, the records available in the PCDS are
typically shorter than those available from many Environment Canada stations. This does not prevent the
creation of homogenized records, but would necessitate the combination of multiple records to make
single, long records. Methodology for this has been pioneered by Environment Canada scientists.
Adjusting records from a differing locale to create a combined record introduces some uncertainty which
would need to be addressed in the final product. Although software and methods are available for
homogenizing data records, the process is time consuming and hinges on assembling good metadata for
stations. This is important for confirming identified inhomogeneities in a given record arising from station
relocation, sensor changes, or issues of station siting. The optimal approach would be to conduct the
homogenization effort in stages. The first stage would comprise applying automated algorithms to
identify change-points within individual records. Concurrently, or following this, nearest suitable
neighbor stations that may be used to create a composite, extended record would be identified. When
metadata become available, the automatically identified change-points will be compared with the records
for the station possibly confirming or denying a justification for a given shift in the record. Because of
the magnitude of the effort and the needed preconditions or station quality control and good metadata,
homogenization efforts will be entered into toward the end of the research horizon outlined in this
document.
3.3 PRISM
3.3.1 Timeseries Mapping
One of the primary goals with the agreement between the PRISM Climate Group and PCIC was to
generate a time series of high-resolution maps of monthly average temperature and precipitation for the
province. Production of these maps will provide useful feedback on the quality of the station data they are
derived from and a good foundational data set for generating driving data for impacts models (such as
11hydrologic models, wildfire models, crop models, etc.). The methodology for producing maps has so-far
been adopted from the PRISM Climate Groups approach. Maps are generated using climate normals for a
given month as one of the predictors in what the PRISM group terms "climatologically aided
interpolation". Because monthly mean temperature and precipitation totals demonstrate very similar
elevation relationships as climatological values, using PRISM in this mode generates very strong linear
relationships between the climatology predictor and the monthly predictand. This is most strongly
demonstrated for temperature owing to more complicated interactions between precipitation and
topography on month-long timescales. Where stations contain inaccurate or erroneous data, the misfit is
often readily obvious which enables the generation of monthly timeseries maps to feedback to the quality
assessment of station data. This approach may be somewhat comparable to using thin plate splines with
the climatology as one of the covariates and that method may be investigated for comparative purposes.
Once the process for generating monthly maps is established, the ongoing production of maps is relatively
straight forward. Despite that, one of the potential issues that arises from this kind of mapping is the effect
of changes to the observational network from month-to-month. Especially in locations with sparse
observational coverage or seasonal variation in coverage, PRISM can be sensitive to the loss of
observational points and this often results in relatively sharp discontinuities when viewing a given
monthly map as an anomaly map relative to the normal. Development of uncertainty estimates and
attaining an understanding of PRISM sensitivity will aid in mitigating these issues or at least help
quantify the effects. Because of these issues, the utility of the monthly timeseries maps for trend analysis
is not readily clear. If trends appear insensitive to such changes in the network, then the timeseries will
allow the calculation of very high resolution trend maps for BC. The most likely scenario is that trend
analysis will be feasible in locations with high station densities such as the lower mainland and southern
Vancouver Island and possibly more densely instrumented valleys such as the Okanagan. Elsewhere,
discontinuities in station coverage may make trends inaccurate. In locales where trends may be calculated.
The results could be highly useful to research activities aimed at understanding changes in small scale
processes such as local eco systems.
3.3.2 Uncertainty
In order for maps of the climatology to be credible and most useful to their users, they must be
accompanied by estimates of the uncertainty associated with the data. There are three major uncertainty
sources in this map making process. The total uncertainty arises from:
1. uncertainties in the accuracy of the underlying station data due to siting and instrument error;
2. uncertainties associated with interpolating a measured climate value to locations where no
observations are present;
3. uncertainties associated with parameter selection for the PRISM model;
4. uncertainties associated with choice of regression model used to develop spatial relationships
among stations;
To assess the uncertainty associated with station measurements, a boot-strap approach can be used
wherein synthetic datasets are created by sampling from the uncertainty range of each station in the data
set and generating maps from the sampled values. Here measurement uncertainty is that associated with
station siting and instrument accuracy. This effort should converge on a distribution of maps that has a
characteristic mean and variance. Addressing the uncertainty associated with station sparseness is
probably best addressed through a "jack-knife" technique in which stations are randomly removed and the
influence of the removal on mapped climate is assessed. It can be foreseen that removal of stations in data
limited areas will result in dramatic changes in the mapped climate because of a lack of information. This
kind of evaluation could also be used to establish uncertainty estimates on mapped weather anomalies, so
this activity will benefit other CAM research aims. Uncertainty due to model parameters is more difficult
to quantify objectively. PRISM is a knowledge-based system; so much of the parameter tuning is done
12with an eye to reducing model error at station locations, but also toward generating known features in
climate such as matching growth envelopes for vegetation known to exist in a given location. One
approach to assessing this uncertainty entails selecting multiple sets of input parameters by selecting
parameter values at random within an accepted range. Another approach would involve tuning groups of
PRISM parameters to selected regions in the province and comparing the mapped climate using all
possible groups to that tuned for the specific region. The resulting variation in the mapped climate fields
will indicate sensitivity to parameters as well as uncertainty due to parameter selection. Finally, the
uncertainty associated with the linear regression used in the model will provide an estimate of uncertainty
in modelled values. The uncertainty estimates derived from these methods can be combined to give a total
uncertainty to the mapped climate variables.
3.3.3 Extension to Extremes.
Over the course of calculating CLIMDEX indices on some of the station data from the PCDS, it was
apparent that extremes tend to follow similar spatial patterns as do long-term means. This suggests that
using PRISM to map extremes may be a feasible line of investigation. This could be done either as a
climatologically aided interpolation as is done for the timeseries maps or as a standard PRISM mapping
process using a digital elevation model as a predictor. Approaching this activity will require either
justification for application of current weighting approaches in the PRISM algorithms, or developing new
weighting algorithms suitable for processes unique to extremes. For example, cold extremes in winter are
likely to be associated with unusually deep temperature inversions which may not be captured in the
present PRISM parameterizations. Additionally, extreme precipitation events in summer months are
likely associated with convective systems for which orographic precipitation processes and thus
elevational dependence of precipitation may not apply. Finally, this activity will hinge on the production
of CLIMDEX indices for the PCDS stations so will need to take place after those are produced during the
2015-2016 fiscal year.
134. Applied Research Activities and Deliverable Products
The research approaches outlined above can be broken down into individual applied research projects
which together will accomplish the broader research goals outlines in this plane. This section breaks apart
the research path into the individual components with targeted completion dates or, where applicable,
commencement dates.
4.1 Developing the PCDS
4.1.1 Maintain data ingestion and improve data quality in the provincial climate data set. Ongoing
from present. Secondary quality control by fiscal year end 2015-2016.
4.1.2 Work with CRMP partners to improve the meta-data content and delivery with PCDS data
(student opportunity). Begin 2014-2015 and ongoing throughout this research plan
4.1.3 Calculate CLIMDEX indices on the data in the provincial climate data set. Complete by
2015-2016.
4.1.4 Homogenize long records of climate station data in concert with Environment Canada
scientists. Changepoint detection complete by 2016-2017.
4.2 PRISM climate mapping
4.2.1 Update PRISM climate normals to most recent normal period and produce monthly
timeseries maps. Complete by fiscal year end 2014-2015.
4.2.2 Release of monthly PRISM maps. 2015-2016. have routine map release up and running by
2016-2017.
4.2.3 Begin to quantify the reliability of PRISM products. Release climate map uncertainty
products by 2015-2016.
4.2.4 Expanded application of PRISM to daily timeseries and mapping of extremes. Under
investigation and PRISM/PCIC roles established by 2017-2018.
4.3 Seasonal Climate Reviews
4.3.1 Deliver monthly and seasonal anomaly maps in both point and gridded format. Complete
2014-2015.
4.3.2 Expand seasonal analysis to include atmospheric circulation anomalies. Complete automated
mapping products by 2015-2016.
4.3.3 Produce descriptive seasonal climate analyses at regular intervals. 2016-2017.
4.3.4 Development of a web tool for generation of custom maps for climate analysis in BC. 2016-
2017.
4.3.5 Develop high-resolution climate anomaly maps based on the ongoing monthly PRISM maps.
2017-2018.
14You can also read