Oscillating focus of SopA associated with filamentous structure guides partitioning of F plasmid
←
→
Page content transcription
If your browser does not render page correctly, please read the page content below
Molecular Microbiology (2007) 64(5), 1198–1213                                                 doi:10.1111/j.1365-2958.2007.05728.x

Oscillating focus of SopA associated with filamentous
structure guides partitioning of F plasmid
OnlineOpen: This article is available free online at www.blackwell-synergy.com

Toshiyuki Hatano,1 Yoshiharu Yamaichi1† and                           (Gerdes et al., 2004); one is cis-acting, and functions as a
Hironori Niki1,2*                                                     centromere-like site. The other genes encode an ATPase
1
 Microbial Genetics Laboratory, Genetic Strains                       and a DNA binding protein that binds to the centromeric
Research Center, National Institute of Genetics, 1111                 site respectively. In the case of the sopABC mechanism of
Yata, Mishima, Shizuoka 411-8540, Japan.                              F plasmid, a centromeric site of the F plasmid, sopC, is
2
 Department of Genetics, SOKENDAI, 1111 Yata,                         specifically bound by SopB (Mori et al., 1989).
Mishima Shizuoka 411-8540, Japan.                                        The SopA ATPase interacts with the SopB–sopC
                                                                      complex that the SopB protein binds to centromeric site
                                                                      sopC. Subcellular localization of actively partitioning F
Summary
                                                                      plasmid has been visualized by fluorescence in situ
The F plasmid is actively partitioned to daughter cells               hybridization (FISH) (Niki and Hiraga, 1997) and green
by the sopABC gene. To elucidate the partitioning                     fluorescent protein (GFP)-tagging methods (Gordon
mechanisms, we simultaneously analysed move-                          et al., 1997). F plasmids that are actively segregated by
ments of the plasmid and the SopA ATPase in single                    the sopABC partitioning genes are localized at specific
living cells. SopA, which is a putative motor protein                 subcellular sites during the E. coli cell division cycle. F
assembled densely near nucleoid borders and formed                    plasmid is primarily located at midcell in newborn cells.
a single discrete focus associated with less dense                    After replication of the plasmid, each daughter plasmid
filamentous distribution along the long axis of the                   migrates towards the 1/4 and 3/4 positions of cell length.
cell. The dense SopA focus oscillates between cell                    Separated F plasmids are tethered at the cell quarters
poles. The direction of the plasmid motion switches                   until the host cell divides into two daughter cells. Using
as the SopA focus switches its position. The velocity                 immunofluorescence microscopy, discrete fluorescent foci
of the plasmid motion stays constant while it oscil-                  of SopB in cells are observed in the presence of the sopC
lates moving towards the SopA focus. The low                          DNA segment (Hirano et al., 1998), and SopB-CFP also
density filamentous distribution of SopA persisted                    forms fluorescent foci in a living cell (Lim et al., 2005). As
throughout the SopA oscillation. The focus associ-                    SopB binds to sopC in the actively partitioning plasmid,
ated with filamentous distribution of SopA was also                   the discrete fluorescent foci of SopB are formed on the
observed in a cell without nucleoid. The SopA fila-                   plasmid DNA. Even if SopA is defective, the SopB–sopC
ment may guide the movement of the plasmid as a                       complex can be localized at midcell, but not the 1/4 and
railway track and lead it to cell quarters.                           3/4 positions of cell length (Yamaichi and Niki, 2004). ATP
                                                                      hydrolysis of SopA is required for F-plasmid partitioning
                                                                      (Libante et al., 2001). Thus, SopA is essential for faithful
Introduction
                                                                      movement of the plasmid from midcell to the cell quarters.
In bacteria, extra-chromosomal elements have mecha-                      Many homologues of SopA have been found in bacte-
nisms that maintain them stably in their host cells. These            ria, and SopA belongs to a large family of partition-related
mechanisms include regulation of replication, physical                proteins that also includes MinD, a cell division site regu-
separation of replicated copies and partitioning of copies            lator (Yamaichi and Niki, 2000). Spatial oscillation of MinD
to daughter cells (Hiraga, 2000; Gordon and Wright, 2000;             (Raskin and de Boer, 1999) and some of the homologues
Draper and Gober, 2002). Partitioning is crucial for low              of SopA (Marston and Errington, 1999; Quisel et al., 1999;
copy number plasmids. The partitioning mechanism of                   Ebersbach and Gerdes, 2001) have been demonstrated,
many plasmids is governed by a set of three genes                     and these proteins have been observed to form a helical
                                                                      shaped structure in the cell (Shih et al., 2003; Ebersbach
Accepted 2 April, 2007. *For correspondence. E-mail hniki@
lab.nig.ac.jp; Tel. (+81) 55 981 6870; Fax (+81) 55 981 6826.         and Gerdes, 2004). Oscillation of SopA was also
†Present address: Channing Laboratories, 181 Longwood Avenue,         observed under the induction of SopA-GFP expression,
Boston, MA 02115, USA.                                                and SopA oscillates inside live cells with a period of
Re-use of this article is permitted in accordance with the Creative
Commons Deed, Attribution 2.5, which does not permit commercial       20 min (Lim et al., 2005). In addition, it is reported that
exploitation.                                                         helix-like structures of SopA were observed in despite low
© 2007 The Authors
Journal compilation © 2007 Blackwell Publishing Ltd
Guidance of F-plasmid partitioning by SopA 1199
resolved images under an immunofluorescence micros- consistent with the models. Further experiments are
copy (Adachi et al., 2006). A mutated SopA is fused with needed to verify the models properly.
GFP, and this mutant SopA-GFP forms long filaments in Here we simultaneously analysed movement of SopA
the absence of the other sop genes (Lim et al., 2005). and plasmid DNA in a living cell. Active form of SopA-GFP
Furthermore, SopA has been shown to form filaments in or YFP made it possible to address some crucial questions;
vitro in an ATP and SopB-dependent manner (Lim et al., Does oscillating SopA form a filamentous structure in the
2005; Bouet et al., 2007). cell? If so, is the oscillation of SopA coupled to the bipolar
SopA is a putative motor protein for movement of the movement of plasmid DNA? This is the first attempt to
plasmid from midcell to the cell quarters, although it is not analyse the spatial dynamic relationship between SopA
clear how the ATPase generates the driving force for and the SopB–sopC complex of the F plasmid. Our study
plasmid segregation. Based on the properties of the provides new clues as to how the putative SopA motor
ATPase, the partitioning machinery for plasmids can be protein contributes to plasmid partitioning.
divided into two families: the actin-type ATPase family, and
the Walker-type ATPase family (Gerdes et al., 2000). The Results
ATPases play a critical role in migration of plasmids
Labelling of SopA and partitioning plasmid DNA
towards daughter cells, and thus presumably function as
motor proteins to generate a driving force for the bipolar To investigate the behaviour of the putative motor protein,
movement. For example, ParM, which is encoded on a R1 SopA, we attempted to observe the dynamics of subcel-
drug-resistance plasmid, is an actin-type ATPase and con- lular localization of SopA in a living cell. We constructed
sidered to be a prokaryotic actin homologue (van den Ent SopA proteins fused to a green or yellow fluorescent
et al., 2002). In vivo and in vitro, ParM forms a filamentous proteins (SopA-GFP or SopA-YFP respectively), and the
structure with the plasmids at both ends, and then pushes sopA gene was replaced with one of the fusion genes on
the plasmids towards the tips of the cell pole (Moller- the F plasmid (Fig. 1A and Fig. S1). Thus, expression of
Jensen et al., 2003; Garner et al., 2004). In contrast, the both the fused sopA and sopB genes was controlled by
Walker-type ATPases can be found encoded on P1 the native regulatory region of the sopAB operon. Expres-
phages and F plasmids as ParA and SopA respectively. sion level of SopA-YFP or SopA-GFP fusion proteins
The ATPase activity of SopA is about 1000-times weaker (70.7 kDa) was confirmed by Western blotting measure-
than that of the typical Walker type ATPase (Watanabe ment using anti-SopA or anti-GFP or YFP antibody (Fig.
et al., 1992; Libante et al., 2001). The ATPase activity is S2A and C). Quantification analysis using the blotted
stimulated in the presence of DNA, and further by addition membrane treated with anti-SopA antibody demonstrated
of the SopB protein. Interestingly, the SopB protein alone that the expression level of SopA-GFP or SopA-YFP
fails to stimulate the ATPase activity of SopA (Watanabe increased less than twofold or threefold that of the SopA
et al., 1992). It is still unknown that how ATP hydrolysis by protein, respectively (Fig. S2B). This increase of SopA-
the SopA ATPase contributes to the plasmid segregation. GFP or SopA-YFP did not affect to the active partitioning
Although SopA is polymerized in vitro in the presence of of F plasmids as showed in Fig. 1B.
SopB and sopC containing DNA (Lim et al., 2005), DNA To assess the biological function of the fusion proteins,
itself inhibits polymerization of SopA (Bouet et al., 2007). we measured the stability of the plasmids in host cells
SopB counteracts this DNA-mediated inhibition by (Fig. 1B). Plasmids that encoded sopA-yfp (pNIG111)
masking DNA. SopB spreads from sopC (Biek and were as stably maintained in host cells as the wild-type
Strings, 1995; Lynch and Wang, 1995; Rodionov et al., plasmid pXX325. Although the stability of plasmids that
1999) and masks plasmid DNA. This allows SopA poly- encoded sopA-gfp (pNIG105) was slightly decreased
merization at plasmid DNA. In fact, SopA colocalizes with relative to pXX325 and pNIG111, pNIG105 was much
SopB (Lim et al., 2005; Adachi et al., 2006). Thus, it is more stably maintained in host cells than pNIG152, which
thought that SopA mediate plasmid separation via its poly- lacks sopA and pXX327, which completely had lost the
merization or extension between two daughter plasmids active partitioning mechanism (Fig. 1B). Therefore, SopA-
including the SopB–sopC complex (Lim et al., 2005). GFP or SopA-YFP retains the biological function suffi-
However, it is not certain that the wild-type SopA forms a ciently to carry out active plasmid partitioning in the
filament that can extend by polymerization in a living cell. presence of SopB and sopC.
On the other hand, theoretical model is proposed to To label the partitioning plasmid, DNA fragments con-
account to the parABS (Hunding et al., 2003) and the taining the binding sites for the LacI repressor were
sopABC partitioning mechanism (Adachi et al., 2006). embedded in the plasmids and the LacI repressor protein
Based on reaction-diffusion equations, the models fused to a cyan fluorescent protein (CFP) was expressed
attempt to explain bipolar migration of plasmid DNA. under the control of arabinose inducible promoter. The
Some aspects of the plasmid partitioning mechanisms are C-terminal 11 amino acid residues of the LacI protein were
© 2007 The Authors
Journal compilation © 2007 Blackwell Publishing Ltd, Molecular Microbiology, 64, 1198–12131200 T. Hatano et al.
A mini-F
sopA gfp FRT SD sopB sopC
plasmid
B C D
100
Stability (%)
50 pNIG100 (lacOP)
E
10 pNIG113
0 10 20 30 0 10 20 30 (sopA-yfp, lacOP)
Time (generations)
Fig. 1. Structure, stability and subcellular localization of mini-F plasmids.
A. Schematic representation of the structure of the mini-F plasmid carrying the sopA-gfp fusion gene (pNIG105). The gfp gene replaced the
stop codon of the sopA gene and the Shine-Dalgarno (SD) sequence was inserted upstream of the sopB gene by homologous recombination.
FRT; FLP recombinase Recognition Target.
B and C. TH456 cells harbouring pXX325 (sopA +B +C + closed circle), pXX327 [D(sopABC); closed triangle], pNIG152 (DsopA, sop +B +C + open
triangle), pNIG138 (DsopA, sop +B +C +, lacO; open circle), pNIG105 (sopA-gfp, sopB +C + cross), pNIG100 (sopA +B +C +, lacO; inverted triangle),
pNIG111 (sopA-yfp, sopB +C + square), or pNIG113 (sopA-yfp, sopB +C +, lacO; diamond) were grown in L medium with 20 mg ml-1 ampicillin at
37°C and then transferred to L medium without ampicillin with (C) or without (B) 0.2% arabinose added to the media. The time of transfer was
considered as time = 0.
D and E. Combined images of the phase-contrast and the LacI-CFP fluorescence micrographs. TH456 cells harbouring pNIG100 (sopA +B +C +,
lacO, D) or pNIG113 (sopA-yfp, sopB +C +, lacO, E). Cells were exponentially grown at 37°C in M9 succinate medium with supplements, and
synthesis of the LacI-CFP fusion protein was induced by addition of 0.2% arabinose to the media. Images are shown of one focus of
LacI-CFP localized at midcell, and two foci of LacI-CFP localized at the cell quarter positions. Bar indicates 1 mm.
deleted to avoid tetramerization (Straight et al., 1996). As of pNIG111 and pNIG100, pNIG113, which encoded both
even moderate expression of LacI-CFP for visualization of sopA-yfp and the lacO array. The stability of pNIG113 was
the LacI biding site has been reported to affect cell growth slightly decreased relative to pNIG100 and PNIG111, and
when the binding site was embedded in chromosome induction of LacI-CFP by the addition of arabinose
near replication origin, oriC (Lau et al., 2003), we reduced reduced its stability still further (Fig. 1B and C). Neverthe-
the induction level of LacI-CFP by inserting the lacI-cfp less, the stability of pNIG113 was much higher than
gene in the chromosome instead of in a multicopy pNIG138, which lacks sopA harbouring lacO array and
plasmid. Even in the presence of arabinose as an inducer, pXX327, which lacks the sopABC genes, indicating that
expression of LacI-CFP from the single copy gene on the the SopABC partitioning mechanism functioned suffi-
chromosome did not affect the colony formation of cells in ciently well for this study. Thus, LacI-CFP also formed
which the LacI-CFP binding site was embedded in the cellar fluorescent foci at the cell quarters in the cell
chromosome near oriC (data not shown). We measured (Fig. 1E).
the stability of the plasmid containing the lacI binding
sequence (pNIG100) in this host cell (Fig. 1B). The
Localization of plasmid DNA near the cell quarters
plasmid pNIG100 was stably maintained over 12 h incu-
bation (about 27 generations). When the host cells were Previous reports indicate that the actively partitioning F
cultivated in medium including arabinose, the stability of plasmid is located at the cell quarters (Gordon et al.,
pNIG100 was not at all affected by the expression of 1997; Niki and Hiraga, 1997). The single plasmid is mainly
LacI-CFP (Fig. 1C). Under these culture conditions, the located at midcell, and after replication the plasmids
induced LacI-CFP protein formed clear fluorescent foci at migrate to positions 1/4 and 3/4 along the cell length. We
the cell quarters in the cell as it binds to the plasmid DNA determined the subcellular localization of newly con-
(Fig. 1D). Thus, binding of LacI-CFP protein to the structed plasmids pNIG100 and pNIG113 by using the
plasmid was judged not to interfere with the SopABC fluorescence foci of LacI-CFP, and obtained the similar
partitioning mechanism. results regarding the subcellular localization of the two
To track the fluorescent foci of SopA-YFP and LacI-CFP active partitioning plasmids (Fig. 2A and B). Although the
simultaneously, we constructed a plasmid that was hybrid distribution of a single focus of pNIG113 (Fig. 2B, i) was a
© 2007 The Authors
Journal compilation © 2007 Blackwell Publishing Ltd, Molecular Microbiology, 64, 1198–1213Guidance of F-plasmid partitioning by SopA 1201
Fig. 2. Subcellular localization of mini-F
A Cell with one focus
60 1
Cell with two foci
60
plasmids. The mini-F plasmids were detected
by fluorescence of the LacI-CFP fusion
N=300 50
i ii iii
% of cell number
50
% of cell number
2 protein bound to the lacO array, and the
Cell length (µm)
40 positions of the LacI-CFP foci were measured
40
3 in cells with one or two foci. TH456 cells
30 30 harbouring the mini-F plasmids were grown to
N=300 4
20 20 log phase in M9 succinate medium with
10 5 10
supplements with 0.2% arabinose at 37°C.
A. pNIG100 (sopA +B +C +, lacO).
0 6 0 B. pNIG113 (sopA-yfp, sopB +C +, lacO).
B 60 1
N=300
60 C. pNIG101 [D(sopABC), lacO]. Cells with a
single focus were statistically analysed and
% of cell number
% of cell number
50 i 2 ii 50 iii the distribution frequencies of the foci are
40
Cell length (µm)
40 3 shown in the histograms (i). The position of a
30 30 focus is shown as a percentage of cell length.
N=300 4 The dotted line indicates a position 35% along
20 20 the cell length. Cells with two fluorescent foci
5
10 10 were statistically analysed (ii). The distances
0 6 0
of LacI-CFP foci from the midcell are plotted
versus cell length. For each pair of foci from a
C 60 1 60 cell, the focus closest to the cell pole is
% of cell number
% of cell number
50 N=172 50 iii shown in blue. The distance of the other
Cell length (µm)
i 2 ii focus in the same cell from the same pole is
40 40
3 also shown (red). Dotted lines indicate the 1/4
30 30 and 3/4 positions along the cell length,
4 dashed lines indicate the position of cell
20 N=300 20
poles, and solid lines indicate the midcell
10 5 10 position. The histograms show the distribution
0 6 0 frequencies of the foci (iii).
0 10 20 30 40 50 -3.0 -1.5 0 1.5 3.0 0 20 40 60 80100
Position of one focus Distance of two foci from mid cell (µm) Position of two foci
(% of cell length) (% of cell length)
little broader than that of pNIG100 (Fig. 2A, i) and a small The SopA foci were located near the cell poles, but not
fraction of pNIG113 was localized at a position 20–35% at their tips. This positioning pattern was similar to that of
along the cell length, pNIG100 and pNIG113 were both replication oriC and replication terminus that were local-
mainly located near midcell (at positions 35–50% position ized at the nucleoid border during the cell division cycle
along the cell length). When two foci were present in a (Niki and Hiraga, 1998). To confirm the subcellular posi-
cell, they were localized at/near positions 1/4 and 3/4 tioning of SopA, cells were stained using DNA-specific
along the cell length (Fig. 2A, ii, iii and Fig. 2B, ii, iii). The fluorescent dye (Hoechst33342). The SopA-YFP foci
sopABC deletion mutant plasmid (pNIG101) was unstable were indeed located at the tip of nucleoid (Fig. 3B and
and the distributions of the plasmids were different from Fig. S3A). Thus, the focus of SopA-YFP was not localized
others (Fig. 2C). These results indicated that daughter at midcell where the plasmid DNA could be localized
copies of the plasmids migrated to the cell quarters prior (Fig. S3C). Further analysis of SopA-GFP and SopA-YFP
to segregation into the daughter cells. fluorescence revealed that in addition to the strong focus
described above, a small fraction of the labelled SopA
proteins formed a filamentous structure in cells (see
Assembly of SopA focus at the nucleoid tip
below).
To investigate the distribution dynamics of the SopA
protein, we observed the subcellular localization of the
Requirement for ATPase activity, SopB and sopC for the
SopA-GFP and SopA-YFP in living cells. We found that
assembly of SopA focus
the SopA protein tended to form a single fluorescent focus
in majority (54.2%) of the cells (Fig. 3A). On the other In order to eliminate the possibility that fusion of the fluo-
hand, only 5.2% of cells had multiple foci. Because most rescent protein to SopA caused artificial aggregation of
cells had a single focus throughout the cell division cycle, the fusion proteins inside the cells to form the observed
only one of daughter cells could receive the focus and the foci, we analysed the localization of SopA-YFP by combi-
other could not (Fig. S3B). In fact, 40.4% of cells had no nations with plasmids with various mutations of the
strong SopA-GFP focus, although the mini-F plasmid sopABC genes. For the sopB deletion plasmids, SopA-
encoding the sopA-gfp gene was stably maintained in YFP was distributed over the whole nucleoid in cells
much more than 40% of cells in the population (Fig. 1B). (Fig. 3C). Similar results were obtained using deletion
© 2007 The Authors
Journal compilation © 2007 Blackwell Publishing Ltd, Molecular Microbiology, 64, 1198–12131202 T. Hatano et al.
Fig. 3. Analysis of SopA localization.
A A. TH456 cells carrying pNIG105 were grown
to log phase at 30°C in M9 succinate medium
Focus number in a cell % Total (# cells) with supplements, and embedded in an agar
medium to allow images of SopA-GFP to be
captured. Cell membranes were stained with
0 24.3% (335) FM4-64. Sectional images were processed by
using a deconvolution algorithm. Merged
16.1% (222) images showing SopA-GFP and the cell
membrane are shown. Cells (n = 1380) were
categorized according to the number of
1 26.6% (367) SopA-GFP foci and the presence of the
filaments, and the types of the cells are
represented as diagrams.
23.3% (322) B–G. Localization of SopA-YFP in cells with F
plasmids with various mutations. TH456 cells
4.3% (60) carrying the mini-F plasmids were
exponentially grown at 30°C in M9 succinate
medium with supplements, and then 1 mg ml-1
2 2.4% (33) Hoechst 33342 was added to the medium for
1 h.
B. pNIG111 (sopA-yfp, sopB +C +).
1.2% (17) C. pNIG120 (sopA-yfp, DsopB, sopC +).
D. pNIG121 (sopA-yfp, sopB +, DsopC).
0.2% (3) E. pNIG122 [sopA-yfp, D(sopBC)].
F. pNIG140 (sopA K120R-yfp, sopB +C +)
G. pNIG141 (sopA K120Q-yfp, sopB +C +). From
0.4% (6) top to bottom rows, the images are
phase-contrast, SopA-YFP and DNA images,
and merged images of phase-contrast,
>3 0.9% (13) SopA-YFP (green) and DNA (magenta). Bar
indicates 1 mm.
0.1% (2)
Total: 1380 cells
B C D E F G
mutants for sopC and both sopB and sopC (Fig. 3D and were distributed over the whole nucleoid, and did not
E). It has previously been shown that focus formation of assemble as discrete fluorescent focus (Fig. 3F and G).
SopA-GFP required all three components including the These results suggest that the SopA focus formation
wild-type SopA, SopB and sopC DNA (Lim et al., 2005). observed with the fusion protein reflects the functional
To test whether formation of the SopA-YFP foci behaviour of SopA for plasmid partition.
depended on the ATPase activity of SopA, a point muta-
tion was introduced into the Walker motif A of the sopA-yfp
Oscillating SopA, and followed by plasmid DNA
gene, and subcellular localization of the mutated fusion
protein was analysed. We constructed two types of the Fluorescent foci for SopA-YFP and LacI-CFP were simul-
mutated fusion genes: first, SopAK120R mutated protein, taneously observed in a LacI-CFP-expressing living cell
which has lost the ATPase activity and second, SopAK120Q that, and time-lapse observations were performed to
mutated protein, which retains almost the same ATPase analyse the subcellular localization dynamics of both
activity as the wild type, but its activity is not stimulated by types of foci during plasmid segregation. The fluores-
SopB (Libante et al., 2001), whereas the ATPase activity cence of LacI-CFP was very faint compared with that of
of the wild-type SopA is enhanced by SopB (Watanabe SopA-GFP or SopA-YFP, so the length of time for which
et al., 1992). Both of the mutant SopA fusion proteins we could simultaneously observe plasmid DNA and SopA
© 2007 The Authors
Journal compilation © 2007 Blackwell Publishing Ltd, Molecular Microbiology, 64, 1198–1213Guidance of F-plasmid partitioning by SopA 1203
was restricted to less than 20 min. Figure 4 shows the to the time of the movement, the cumulative travel dis-
movement of the plasmid DNA and SopA over 35 min, tance of SopA-YFP focus was higher and the difference
because for this cell the conditions for detecting fluores- reflected its sudden increase in velocity of the SopA
cence signals were better than for others. When a single movement towards the opposite pole (Fig. 4D). In all our
fluorescent focus of SopA-YFP was observed, it changed analyses, the focus of SopA-YFP started to migrate
location from one cell pole to the other (Fig. 4A). We towards opposite pole before plasmid DNA did. Thus, the
observed that the SopA-YFP focus near one pole gradu- oscillation of the SopA-YFP affected the directional move-
ally disappeared within a few minutes, after which a new ment of the plasmid DNA without changing its velocity.
focus appeared near the opposite pole (Fig. 4A). The When either sopB or sopC, or both were deleted from
exposure time is less than 1 s, which is much shorter than the F plasmid, or the SopA ATPase was inactivated, the
intervals (30 s). It might not be the case that movement of SopA-YFP focus was never observed to oscillate, but
a focus along a track during the exposure. Thus, the instead was found to be evenly distributed over the whole
SopA-YFP focus did not migrate towards the opposite nucleoid (Fig. 3C–F). Thus, SopB and sopC, as well as
pole directly, but SopA-YFP near one pole dispersed the ATPase activity of SopA are all required for the oscil-
within the cell over a short period and then reassembled lation of SopA-YFP.
around the opposite pole to produce a new fluorescence
focus.
Wandering plasmid DNA near midcell
The single fluorescent focus of SopA-YFP was located
near the cell poles, but not at their tips. The exact location Previous works have shown that the mini-F plasmid is
of the focus was at the tip of the nucleoid (see above). In primarily localized at midcell (Gordon et al., 1997; Niki and
contrast, the fluorescent focus of LacI-CFP at the plasmid Hiraga, 1997), suggesting that the plasmid could be fixed
DNA was continuously detected in the cell during oscilla- there. The results of the present study, as shown in Fig. 2,
tion of the SopA-YFP focus and it moved towards the were consistent with this notion. However, our time-lapse
SopA focus (Fig. 4A). Other cells showed the similar observations of living cells revealed that the plasmid DNA
results of SopA and mini-F movement, although time of actually migrated backwards and forwards along long axis
their observation was shorter than that of Fig. 4A. These of the cell length. Although these observations may
results indicate that the periodical disassembly and appear contradictory, the average location of the oscillat-
assembly of SopA-YFP was somehow tied to the plasmid ing plasmid observed in the time-lapse experiment was
movement. near the midcell (Fig. 4E), which is consistent with the
Movement of both of the fluorescent foci, SopA-YFP previous reports that showed plasmids were localized at
and LacI-CFP in the cell was illustrated in a kymograph, mid cell. On the other hand, the average location of the
which visualized the traces of centre of the fluorescent SopA-YFP focus was at the two poles (Fig. 4F). Thus, the
foci in a series of time-lapse pictures (Fig. 4B, and Fig. mini-F plasmid remains near the midcell in living cells, but
S4A). The SopA-YFP focus moved backwards and for- it is not anchored at a specific site constantly.
wards along long axis of the cell length four times during
a 35 min time-lapse observation. Oscillation of SopA was
Oscillation of SopA between the nucleoid tips
similar to that of the Min proteins, except for the interval of
oscillation. The interval of oscillation of Min proteins is less The foci of SopA-YFP and SopA-GFP were located at the
than 1 min (Raskin and de Boer, 1999). In contrast, the nucleoid tip (Fig. 3A, and Fig. S3A), and thus we hypoth-
intervals of oscillation of the SopA foci varied from a few esized that oscillation of SopA-YFP probably occurred
minutes to more than 10 min in each cell. A single fluo- between the two tips of the nucleoid. To test this idea,
rescence focus of LacI-CFP chased after the SopA-YFP oscillation of SopA-YFP was observed in a cell in which
focus, and then LacI-CFP also oscillated along the long cell division was inhibited by addition of cephalexin to
axis of the cell. The SopA-YFP focus started to disperse produce elongated cells with elongated nucleoids. In the
when the LacI-CFP focus came near it. After reassembly elongated cells shown in Fig. 4G, two elongated nucle-
of SopA-YFP focus at the opposite pole, the direction of oids were formed and the focus of SopA-YFP oscillated
movement of LacI-CFP reversed immediately, and the from a tip of one nucleoid to the other tip. This result
focus continued to follow that of SopA-YFP, and thus the supports the idea that the SopA-YFP focus is oscillated
focus of LacI-CFP did not linger at the poles. The kymo- between nucleoid tips.
graph also could allow estimating velocity of the foci.
During the ‘chase’, the velocity of LacI-CFP was almost
After separation, one plasmid stays and the other goes
constant and did not accelerate in response to the rapid
movement of the SopA-YFP focus (Fig. 4C). While the We monitored plasmid segregation by monitoring the
cumulative travel distance of LacI-CFP was proportional separation of a single fluorescent focus of LacI-CFP in a
© 2007 The Authors
Journal compilation © 2007 Blackwell Publishing Ltd, Molecular Microbiology, 64, 1198–12131204 T. Hatano et al.
A B
Merge YFP CFP 0
0
0.5 5
1.0
10
Time (min)
1.5
2.0 15
2.5 20
3.0
25
3.5
4.0 30
4.5
35
5.0
0 0.2 0.4 0.6 0.8 1.0
5.5
Scale of Distance (μm)
6.0
6.5
C D 8.0
Total travel distance (μm)
7.0 0.03 7.0
Velocity (μm/sec)
7.5 6.0
8.0 5.0
0.02
8.5 4.0
9.0
3.0
0.01 2.0
9.5
1.0
10.0
0 0
10.5 0 10 20 30 0 10 20 30
11.0 Time (min) Time (min)
11.5 E F
12.0 40 40
% of focus position
% of focus position
12.5
30 30
13.0
13.5 20 20
14.0 10 10
14.5
0 0
15.0 0 0.2 0.4 0.6 0.8 1.0 0 0.2 0.4 0.6 0.8 1.0
(min) Distance (μm) Distance (μm)
G 0 min 5 min 10 min 15 min 20 min
YFP
DNA
Merge
Fig. 4. Analysis of movement of SopA and plasmid DNA.
A. Time-lapse images of SopA-YFP and LacI-CFP (plasmid DNA). TH130 cells carrying pNIG113 (sopA-yfp, sopB +C +, lacO) were grown to log
phase at 30°C in M9 succinate medium with supplements. Images were captured for 35 min with intervals of 30 s, and each frame taken
during the first 15 min is shown. Merged images showing phase contrast images, fluorescence images of SopA-YFP (YFP), and fluorescence
images of LacI-CFP (CFP) are also shown (Merge).
B. Kymographs of movement of SopA-YFP and LacI-CFP. To analyse the movement of SopA foci, the brightest focus was automatically
selected in each cell. The point with the highest intensity for each fluorescent focus was traced, and a track is shown that represents
movement of the foci in a cell. Scale bar indicates 1 mm, as the distance of migration. The diagram represents movement of SopA-YFP
(green) and LacI-CFP (magenta).
C. Velocity of movement of SopA-YFP (green) and LacI-CFP (magenta).
D. Total travel distance of SopA-YFP (green) and LacI-CFP (magenta).
E and F. Average position of SopA-YFP (F) and LacI-CFP (E).
G. Time lapse images of SopA-YFP (green) and the nucleoid (magenta) in a cell treated with cephalexin (10 mg ml-1). TH456 cells carrying
pNIG111 (sopA-yfp, sopB +C +) were grown to log phase, and cephalexin (10 mg ml-1) was added to the media for 2 h. A cell harbouring two
elongated nucleoids is shown. Arrows indicate nucleoid tips. Images were captured for 20 min with intervals of 5 min. Bar indicates 1 mm.
© 2007 The Authors
Journal compilation © 2007 Blackwell Publishing Ltd, Molecular Microbiology, 64, 1198–1213Guidance of F-plasmid partitioning by SopA 1205
A B E H
Merge YFP CFP
0
0
0.5
Time (min)
1.0 5
1.5
2.0
10
2.5
3.0
3.5 15
4.0 0 1.0 2.0
4.5 Scale of distance (µm)
5.0
C F I
5.5
0.05 0.05 0.05
6.0
Velocity (µm/sec)
6.5 0.04 0.04 0.04
7.0
0.03 0.03 0.03
7.5
0.02 0.02 0.02
8.0
8.5 0.01 0.01 0.01
9.0
0 0 0
9.5 0 5 10 15 0 5 10 15 0 5 10 15
10.0 Time (min) Time (min) Time (min)
10.5
D G J
11.0 0.4 0.4 0.4
Total distance (µm)
11.5
0.3 0.3 0.3
12.0
12.5 0.2 0.02 0.2
13.0
13.5 0.1 0.01 0.1
14.0
0 0 0
14.5 0 5 10 15 0 5 10 15 0 5 10 15
(min) Time (min) Time (min) Time (min)
Fig. 5. Analysis of movement of SopA and plasmid DNA during separation of the plasmid.
A. Time lapse images of SopA-YFP and LacI-CFP (plasmid DNA). TH456 cells carrying pNIG113 (sopA-yfp, sopB +C +, lacO) were
exponentially grown at 30°C in M9 succinate medium with supplements. Images were captured for 14.5 min with intervals of 30 s, and each
frame is shown. Merged images showing phase contrast images, fluorescence images of SopA-YFP (YFP), and fluorescence images of
LacI-CFP (CFP) are shown (Merge).
B, E and H. Kymographs showing the movement of SopA-YFP (green), and LacI-CFP (magenta and blue). Scale bar indicates 2.5 mm, as the
distance of migration.
C, F and I. Velocity of movement of SopA-YFP (green) and LacI-CFP (magenta and blue).
D, G and J. Total travel distance of SopA-YFP (green) and LacI-CFP (magenta and blue).
Analyses of movements in (A) are shown in (B–D), and others are shown in (E–G) and (H–J).
living cell (Fig. 5A). Figure 5B and Fig. S4B show kymo- cence focus of LacI-CFP was split into two foci. Although
graphs of the movements of both SopA-YFP and LacI- one of the foci continued to move, it stayed around the
CFP foci during plasmid segregation. After transfer of the position at which the focus became separated. Whereas
SopA-YFP focus to the distal end, the single LacI-CFP the other started to travel to the opposite pole, at which
focus remained at the cell pole for a few minutes and did the SopA-YFP focus was located. Interestingly, both the
not immediately follow the SopA-YFP focus. This is in separated foci moved with similar velocity after separation
contrast to the oscillating phase in which LacI-CFP focus (Fig. 5C), and the cumulative travel distances of the LacI-
started to move soon after transfer of the SopA-YFP focus CFP foci increased roughly in proportion to the duration of
to the other end (Fig. 4B). Suddenly, the single fluores- the movement (Fig. 5D). Furthermore, the cumulative
© 2007 The Authors
Journal compilation © 2007 Blackwell Publishing Ltd, Molecular Microbiology, 64, 1198–12131206 T. Hatano et al.
travel distance of the ‘stationary’ focus appeared to be one. The filamentous structure in cells without the SopA
greater than that of the focus that travelled to the other focus reached from pole to pole in almost all cells. In
end in the examples we observed. These results indicate addition, various mutations of the sopABC genes inhib-
that the ‘stationary’ plasmid DNA copy was not constantly ited the assembly of SopA on the nucleoid tips
anchored near the cell quarter, and that the position of the (Fig. 3C–G), and also prevented formation of the filamen-
plasmid was fluctuated around this area. In contrast, the tous structure of SopA-YFP (data not shown). It appears
‘travelling’ plasmid DNA copy moved to the opposite pole that formation of the filamentous structure of SopA is
directly without varying from its path. An additional two associated with the process of the active partitioning of
kymographs of plasmid separation showed similar move- the F plasmid.
ments for LacI-CFP and SopA-YFP (Fig. 5E–J).
The length of filamentous structure remains constant
Filamentous structure of SopA during oscillation of SopA
A single dense fluorescent SopA-YFP focus was visual- If elongation (or contraction) of the filamentous SopA
ized in cells by a conventional fluorescent microscopy. structure provides the motive force for plasmid migration,
Higher-sensitivity microscopic imaging at combined with the length of the SopA filament should change as the
deconvolution algorithms revealed a SopA-YFP filamen- plasmid migrates. To address this question, we examined
tous shaped structure along the long axis of both fixed the relative relationship between cell length and filament
and living cells (Fig. 6A and B). We could also detect the length among cells harbouring a filamentous SopA struc-
filamentous structure of SopA-YFP by confocal micros- ture without SopA foci (Fig. 3A; top row). Figure 6E shows
copy, indicating that the filamentous shape of decon- that the ratio of cell length to filamentous length was more
volved images we had shown here were not artefacts than 0.8 in almost all cells. This result indicates that the
produced by deconvolution algorithms (Fig. 6C). In some SopA-GFP protein assembles in a filamentous structure
cells, the SopA-YFP focus was very bright at the pole and that span the entire length of the cell without becoming
the filamentous structure appeared throughout the cyto- shorter as the plasmid migrates. However, the above
plasm (Fig. 6A), while in others, only the filamentous result cannot eliminate the possibility that the filamentous
structure extended to the tip of the cell pole (Fig. 6C). filaments temporarily contracted for a short period during
Three-dimensional analysis confirmed that the continu- oscillation of the SopA foci. Therefore, we analysed the
ous filamentous structure in cells (Fig. 6D). We analysed dynamics of the filamentous structure in living cells in
a number of cells with the filamentous SopA-GFP struc- which oscillation of the SopA focus was occurring
ture (Fig. 3A). Although we failed to detect filamentous (Fig. 6F). At each time point, the filamentous structure
structure in 20.4% of the cells, almost all the cells har- extended from cell pole to cell pole. Although the structure
bouring SopA-GFP foci also had the filamentous SopA- of the SopA filament as a whole remained constant, the
GFP structure. Interestingly, a significant number of cells intensity distribution of GFP fluorescence did change
(24.3%) had a filamentous SopA-GFP structure without a slightly (Fig. 6F). This result suggests that the SopA pro-
bright focus (Fig. 3A; top row), suggesting SopA-GFP teins that comprise the filaments are not static and that
was in the process of being transferred from one pole to redistribution of the SopA protein possibly occurs within
the opposite pole, or the cell just divided without inheriting the filament while maintaining the overall structure. Fur-
the strong focus and did not have enough time to develop thermore, in dividing cells, the filamentous structure was
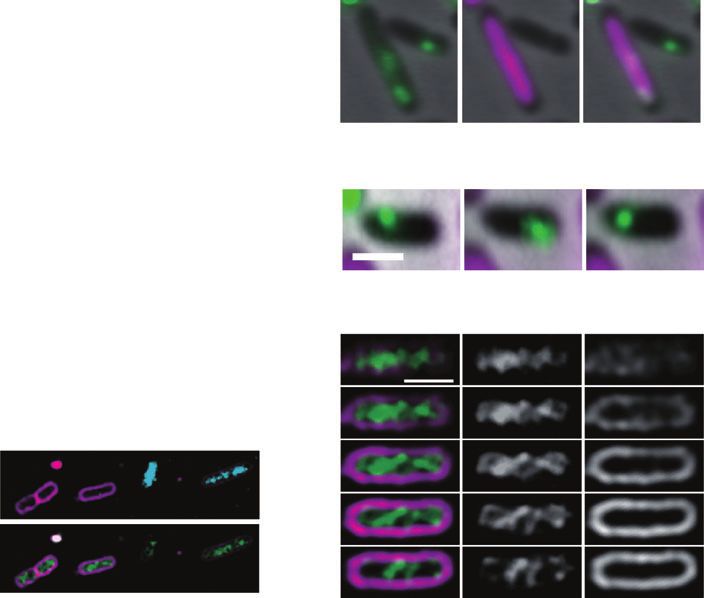
Fig. 6. Characterization of the SopA filaments in cells. TH456 cells carrying pNIG105 (sopA-gfp, sopB +C +) were exponentially grown at 30°C
in M9 succinate medium with supplements. The cell membrane was stained with FM4-64.
A and B. Sectional images of SopA-GFP in a cell fixed with 80% methanol (A) and a living cell (B). The images were captured along the
z-axis at 0.2-mm intervals, and treated with a deconvolution algorithm. Merged images showing SopA-GFP (green) and the cell membrane
(magenta) are shown (Merge). Scale bars indicate 1 mm.
C. An optical section image of SopA-GFP in a living cell obtained by confocal microscopy at 0.1-mm intervals along the z-axis of the
microscope. (Top) Merged images showing SopA-GFP (green) and the cell membrane (magenta). (Middle) SopA-GFP. (Bottom) Cell
Membrane. Scale bar indicates 1 mm.
D. A three-dimensional image of SopA-GFP was reconstructed based on the images shown in panel B and visualized at the angle of degree
as indicated.
E. Ratio of the length of the SopA-GFP filaments to cell length. Cells (n = 110) that contained the SopA-GFP filament without a focus were
measured.
F and G. Time-lapse observation of the filamentous SopA-GFP structure. Deconvolved sectional images of living cells are shown as projection
images. The sectional images were taken every 15 min. A unit cell (F) and a dividing cell (G). Merged images of SopA-GFP (green) and the
cell membrane (magenta) (top), SopA-GFP alone (middle), and distribution of the relative signal intensity of SopA-GFP (bottom) are shown.
The relative signal intensity between 0 and 255 in a cell is shown as a gradation of colour from magenta (weakest) to red (strongest)
according to the colour gradient bar shown at bottom right. Scale bar indicates 1 mm.
© 2007 The Authors
Journal compilation © 2007 Blackwell Publishing Ltd, Molecular Microbiology, 64, 1198–1213Guidance of F-plasmid partitioning by SopA 1207
A B
Cell Membrane SopA-GFP Merge Cell Membrane SopA-GFP Merge
C D E 40
Merge
% of cell number
0°
30
12°
20
36°
10
60°
0
SopA-GFP 0 0.2 0.8 1.0
Ratio of a cell length
and a filament length
F
Membrane
0 15 30 45
Time (min)
G
0 15 30
Time (min)
also divided at midcell (Fig. 6G). These results indicate Formation of the SopA filament in anucleated cells
that the filamentous structure spans the cell length and
gradually elongates and divides following the cell growth Because we found that the SopA foci tend to be localized
and division. This observation contradicts the model in on nucleoid tips, it seemed plausible that the SopA protein
which the filament acts as an elongating or contractile bound to host chromosome DNA at nucleoid tips as a
apparatus that pushes or pulls the plasmid DNA. nucleation site for focus formation, because the SopA
© 2007 The Authors
Journal compilation © 2007 Blackwell Publishing Ltd, Molecular Microbiology, 64, 1198–12131208 T. Hatano et al.
protein is able to bind to DNA and function as the auto- cells, as in wild-type cell (Fig. 7C and D). Moreover, the
repressor of its promoter. This hypothesis implies that a SopA foci still oscillated in anucleated cells. Each of the
nucleoid is an essential factor for positioning and oscilla- SopA foci in living cells with or without nucleoid changed
tion of the SopA foci. If so, regular positioning and oscil- the position, suggesting oscillation of the SopA foci is
lation of the SopA foci would be disturbed in anucleated independent of the nucleoids (Fig. 7F). In addition to the
cells (DNA-less cells). We therefore investigated how the location of the SopA-YFP foci, we investigated the forma-
SopA-YFP foci behaved in anucleated cells. We previ- tion of the filamentous structure in anucleated cells and
ously reported that mutants with a large chromosomal detected the filamentous structure in these cells (Fig. 7G
inversion between the Ori domain and the Ter domains and H). These results clearly indicate that the nucleoid is
produces anucleated cells at a high frequency (Niki et al., not essential for the assembly, positioning, or formation of
2000). However, a suppressor mutation, a secondary filaments of SopA.
inversion between the IS elements on the chromosome,
easily occurs in the mutants with the large inversion
Discussion
during cultivation (Cornet et al., 1996), and the ratio of
anucleated cells is decreased overall. Thus, we con- To avoid interference with the physiological state of seg-
structed a strain in which mutants with the large chromo- regating plasmids, SopA-GFP or SopA-YFP were under
somal inversion could be selected as antibiotics resistant control of the native sop promoter on the mini-F plasmid
cells, which produced anucleated cells at a higher fre- (Fig. 1) and then expressed at as low level as possible
quency (19.6%: 227/1160 anucleated cells). (Fig. 2). To analyse the movements of plasmid DNA and
We next examined whether SopA was localized at the the SopA protein in a single cell for as long as possible,
cell poles. We found that about 17% of anucleated cells we developed a system to detect faint fluorescence in this
had the SopA-YFP foci at cell poles (39 cells/227 anuce- experiments. Thus, we succeeded in taking time-lapse
lated cells). Of the anucleated cell producing cells, about photographs for at least 15 min. Oscillation of SopA was
23% of cells with nucleoids also had the SopA-YFP foci observed in almost all cells with the SopA foci. Oscillating
(216 cells/933 cells), and about 17% of the parental cells periodically, as has also been observed for the Min pro-
had the SopA-YFP foci (218 cells/1294 cells); these ratios teins (Raskin and de Boer, 1999), the Soj proteins
were not significantly different. We next analysed the sub- (Marston and Errington, 1999; Quisel et al., 1999), and
cellular location of the SopA-YFP foci in the parent cells SopA (Lim et al., 2005). Oscillation of SopA was similar to
and anucleated producing cells (Fig. 7A, B and E), and those of the Min proteins and the Soj proteins, except for
found position of the SopA-YFP single foci seemed to be the interval of oscillation. The interval of oscillation of Min
distributed over anucleated cells, as seen in Fig. 7B. proteins is less than 1 min (Raskin and de Boer, 1999). In
When the distribution of the SopA-YFP foci was analysed contrast, the intervals of oscillation of the SopA foci varied
carefully, the SopA-YFP foci tended to be more often from a few minutes to more than 10 min in each cell. The
positioned near the cell poles. This was clearer in longer intervals were similar to that of the Soj proteins. Longer
cells (> 2 mm). The SopA-YFP foci could be localized to a interval of the SopA oscillation (about 20 min) was moni-
position at 10–20% along the cell length in anucleated tored (Lim et al., 2005). Oscillation of SopA is slower than
Fig. 7. Subcellular localization of SopA-YFP in anucleated cells. Cells were exponentially grown at 30°C in M9 medium including succinate
with supplements, and treated with 1 mg ml-1 Hoechst 33342 to stain DNA for 1 h.
A and B. Position of the SopA-YFP focus in the parent strain, TH768 (YK1238/pNIG111) (A), or in anucleated cells, TH790 (B). Position in
cells with a single focus is plotted versus cell length. The dotted lines indicate the middle of the cells and dashed lines indicate the position of
a pole.
C and D. Histograms showing the distribution frequency of the foci in cells longer than 2 mm with a single focus. Normal cells (C) and
anucleated cells (D) are shown.
E. Localization of SopA-YFP in cells with or without nucleoids (anucleate cell). Phase contrast image merged with SopA-YFP fluorescence
images (green; left), chromosomal DNA image (magenta; middle), and with both SopA-YFP fluorescence (green) and chromosomal DNA
image (right) are shown. The arrowhead indicates an anucleated cell.
F. Time lapse images of SopA-YFP fluorescence in an anucleated cell. Images were captured for 10 min at intervals of 5 min. Phase contrast
images merged with both SopA-YFP fluorescence (green) and chromosomal DNA images (right) are shown.
G. Projection images of sectional images of SopA-YFP fluorescence in an anucleated cell. Sectional images were captured along the z-axis
with 0.2-mm intervals and treated with a deconvolution algorithm. The deconvolved image of the cell membrane (magenta) was merged with
that for chromosomal DNA (blue; upper), or for SopA-YFP fluorescence (green; lower).
H. A series of sectional images of an anucleated cell with the SopA-YFP helical structure (surrounded by a white dashed rectangle in the
lower panel of G). Merged images of the cell membrane (magenta) and SopA-YFP fluorescence (green: left), SopA-YFP fluorescence alone
(middle) and the cell membrane alone (right). Scale bars indicate 1 mm.
I. A model of the helical structure of SopA (green) and movement of F plasmid (magenta star) in a cell. SopA assembled near the cell pole is
shown as circle. The polarity of the filament is changed during oscillation of SopA. The polarity change switches the direction of the movement
of F plasmid (magenta arrow).
© 2007 The Authors
Journal compilation © 2007 Blackwell Publishing Ltd, Molecular Microbiology, 64, 1198–1213Guidance of F-plasmid partitioning by SopA 1209
A B E SopA-YFP DNA Merge
N=311
N=311 1
Cell length (μm)
1
2 2
3 3
4 4
2 1 0 2 1 0
Distance of a focus from midcell (μm) F 0 min 5 min 10 min
C D
30 N=206 30 N=125
Cell length (μm)
20 20
10 10
H
0 0
0 10 30 50 0 10 30 50
Position of one focus (% of cell length)
G
I
© 2007 The Authors
Journal compilation © 2007 Blackwell Publishing Ltd, Molecular Microbiology, 64, 1198–12131210 T. Hatano et al.
that of the Min proteins, suggesting regulatory mechanism may be given polarity, and then plasmid migrates
of oscillation is different from each other. Timing of the towards the one direction. SopA dynamics are likely
SopA oscillation might be regulated by the SopB–sopC important for plasmid partitioning, as a SopA static
complex on the plasmid as shown in Fig. 4A and B. There- mutant is defective for partition (Lim et al., 2005). Thus,
fore, this indicates that velocity of the plasmid including it is not merely the ability of SopA to form filaments that
the SopB–sopC complex may be one of crucial factors to is crucial for partition, they must be dynamic, and be
determine a period of the SopA oscillation. able to reversibly polymerize and depolymerize. The
The oscillation of SopA is compatible with the reaction- dynamics of SopA probably contributes to the polarity
diffusion partitioning model that proposed by Adachi et al. change of the SopA filaments in a cell. Perhaps the
(2006). However, we are unable to straightly apply this bright SopA foci are considered as a nucleation core that
model to some of our results. First, the model could not assembles near one end of the filament (Fig. 7I). The
explain the dynamic change of direction of the F plasmids oscillation of SopA foci causes a change in the polarity
movement by the SopA (Fig. 4A and B). Second, when of the filament, so that the direction of plasmid move-
the replicated plasmids split near the one pole, one of the ment is switched from one cell pole to the other. Thus,
daughter plasmids migrated towards the opposite pole. In polarity of the SopA filamentous structure might be
addition to the SopA oscillation, the SopB–sopC complex important for determining the direction of the plasmid
on F plasmid could be oscillated in a cell (Fig. 4A and B). movement.
Thus, two oscillating components of the sopABC partition- It is observed that SopA forms radial aster in vitro (Lim
ing system are open to further discussion on theoretical et al., 2005). This also suggests that multiple fibres of SopA
models that is based on reaction-diffusion equations. can form in cell. Therefore, it seemed that these filaments
In this study we attempted to understand how the puta- that extend to radial pattern from SopA foci, a nucleation
tive motor protein SopA contributes to migration of the core, looked amorphous structure in cells (Fig. 6).
actively partitioning plasmids. Bidirectional extension of In general, a motor protein converts chemical energy
the ParM filament with plasmids at both ends during into physical energy, and contributes to generating driving
plasmid segregation (Moller-Jensen et al., 2003; Garner force or directional movement against thermal fluctuation.
et al., 2004) has been observed. Although Adachi et al. In this context, the SopA ATPase could generate driving
(2006) also observed the filamentous structure of SopA by force for plasmid movement. The biochemical property of
indirect immunofluorescence microscopy in fixed cells, SopA suggests that when the plasmid with the SopB–
dynamics of the SopA filaments had not been sopC complex approaches the assembled SopA near the
investigated. SopA has been shown to form filaments in cell pole, the SopB–sopC complex could enhance the
vitro in an ATP and SopB-dependent manner (Lim et al., ATPase activity of SopA. The stimulation of ATPase activ-
2005; Bouet et al., 2007). These filaments polymerize or ity could further enhance the disassembly of SopA, and
extend in vitro, and the average rate of in vitro polymer- then SopA could reassembles at the opposite cell pole.
ization is similar to the rate of F plasmid separation (Lim Although assembly and disassembly of SopA foci repre-
et al., 2005). This observation suggests that SopA poly- sent abrupt changes, the migrating plasmid has an almost
merization is coupled to partition. However, the SopA constant velocity.
polymerization in vivo has not been demonstrated until When the SopB–sopC complex stimulates the SopA
now. We found that SopA formed a filamentous structure ATPase activity, SopA can inversely disrupt the SopB–
in a living cell (Fig. 6B, C, F and G). Our results of time- sopC complex by interacting with SopB (Lemonnier et al.,
lapse observation found no clear evidence for extension 2000). The actively partitioning plasmid harbouring the
and retraction of the filament in cells with actively parti- SopB–sopC complex follows the oscillating SopA, and
tioning plasmids (Fig. 6F and G). Instead, we provide reaches to the assembled SopA. This might correspond to
evidence showing that the relative length of the filament colocalization of the SopB and sopC complex with SopA
remains constant (Fig. 6E). These results are insufficient (Lim et al., 2005). Then deterioration of the stable complex
to completely eliminate the possibility that filaments tem- of the SopB and sopC complex may cause the actively
porarily contracted for a short period during oscillation of partitioning plasmid to pause and change direction. In the
the SopA foci. Alternatively, if filament elongation and case of paired plasmids, the plasmids could separate from
retraction rates are in equilibrium (i.e. tread-milling by each other by disruption of the SopB–sopC complex. SopB
assembly and disassembly at opposite ends), then a fila- cooperatively binds to the sopC DNA (Mori et al., 1989),
ment will remain a constant length. thus one of the plasmids may easily recover the SopB–
The plasmid may migrate on the SopA filament in a sopC complex and continue to follow the SopA, and the
cell. We consider that the SopA filament guides the other may not. Thus, the interaction between SopA and the
plasmid to the cell quarters as if the SopA filament were SopB–sopC complex is responsible for directional move-
a railway track (Fig. 7I). In addition, the SopA filament ment and segregation of actively partitioning plasmids.
© 2007 The Authors
Journal compilation © 2007 Blackwell Publishing Ltd, Molecular Microbiology, 64, 1198–1213Guidance of F-plasmid partitioning by SopA 1211
This indicates that the cellular amount of SopA and SopB is the partitioning dynamics of the P1 and F plasmids are very
crucial for the dynamic SopABC partitioning system. In different. ParA-CFP of the P1 plasmid does not oscillate
fact, increases in either SopA or SopB cause a defect in from pole to pole, and ParA-CFP is distributed on nucleoids
proper partitioning of the F plasmid (Ogura and Hiraga, with a single faint focus (T. Hatano et al., unpubl. data).
1983; Kusukawa et al., 1987). This suggests that there are mechanical differences
Previous works suggest that the F plasmid is tightly between the partitioning systems.
attached at the cell quarters (Gordon et al., 1997; Niki and In the present study, almost all SopA-YFP proteins were
Hiraga, 1997; Shih et al., 2006; Ebersbach and Gerdes, assembled as a single focus located on one of the sepa-
2005). This suggests that the plasmids bind to a host rated nucleoids in a dividing cell. Thus, the subcellular
factor at the cell quarters in host cells. However, the distribution of SopA caused asymmetrical inheritance of
identities of the host factors for the plasmid localization SopA-YFP during cell division as occasionally almost all
have remained unknown until now. In the present study, SopA was allocated to one of the daughter cells (Fig.
the plasmid DNA moved backwards and forwards along S3B). This explains why some fractions of cells do not
long axis of the cell length (Fig. 4A and B), but tended to have significant fluorescence regardless of the high reten-
be localized at the middle of cells (Fig. 4E). It is possible tion rate of the plasmid in cells (Fig. 3A). This result sug-
that the wandering of the focus represents not net move- gests that asymmetric inheritance of the oscillating
ment of the whole plasmid but reorientation or successive proteins including MinD and Soj could be seen in a divid-
relaxation and compression of a fixed plasmid. In any ing cell. Hence, oscillation of SopA and its homologues
case, the SopA filament could help to localize the plasmid could be considered as one of the fundamental mecha-
in a specific subcellular region. nisms by which asymmetrical distribution of proteins
In fact, our results also indicate that SopA tends to occurs in prokaryotes or eukaryotes.
assemble at the specific subcellular sites. SopA oscillation
in anucleated cells occurred between positions at which
nucleoid tips may be located if there is nucleoid in the cell Experimental procedures
(Fig. 7B and D). We cannot completely exclude the pos-
Bacterial strains and plasmids
sibility that one or more unknown host factors are involved
in positioning of SopA foci. It is likely that SopA dynamics The bacterial strains and plasmids used in this study are
is critical for its localization and positioning of the SopB– listed in Supplemental Table S1. The sopA fusion gene under
sopC complex at the cell quarters. control of the sop operator was constructed according to the
procedures of Datsenko and Wanner (2000) and of Yu et al.
The P1 prophage has a ParABS partitioning system, and
(2000) (Fig. 1 and Fig. S1), as described in detail in the
the ParAATPase and the ParB DNA binding protein belong Supplemental Text.
to the same protein families as SopA and SopB, respec-
tively (Yamaichi and Niki, 2000). Previous works based on
biochemical and genetic studies have indicated that the Growth conditions and media
ParABS partitioning system and the SopABC partitioning
Cells were grown in L broth or M9 medium supplemented with
system have common molecular mechanisms (Hiraga,
sodium succinate (0.25%), thiamine (1 mg ml-1), leucine
2000; Gordon and Wright, 2000; Draper and Gober, 2002).
(50 mg ml-1), arginine (50 mg ml-1), proline (50 mg ml-1) histi-
However, movement of the plasmid with the SopABC dine (50 mg ml-1) and threonine (50 mg ml-1). The following
partitioning system is different from that with the ParABS antibiotics were added to the medium when necessary:
partitioning system (Li and Austin, 2002; Li et al., 2004). ampicillin (20 mg ml-1 or 100 mg ml-1), chloramphenicol
Plasmid segregation by ParA of the pB171 plasmid occurs (15 mg ml-1) and kanamycin (15 mg ml-1). The generation time
as well as P1 plasmid segregation. ParA of pB171 is a (doubling time) was determined on the basis of the turbidity of
member of the Walker type ATPase family, and can oscil- cultures.
late from pole to pole. In addition, the focus of ParA is
localized at the nucleoid border (Ebersbach and Gerdes,
Fluorescence microscopy and optical sectioning
2004). Thus, ParA of pB171 has similar properties to SopA.
The growth conditions of the host cells may also affect Cells from overnight cultures grown at 30°C or 37°C in the M9
movement of the plasmid, and the parS/GFP-ParB tagging medium were diluted and grown at 30°C or 37°C to the early
method used to analyse plasmid localization can also alter exponential phase. Expression of the LacI-CFP fusion protein
was induced by addition of 0.2% arabinose to the media for
some aspects of plasmid dynamics (Gordon et al., 2004). It
3 h. Optical sectioning experiments were performed using an
is possible that, GFP-ParB may have a tendency to localize
Olympus IX70 microscope with a PlanApo X100 1.40 oil
at midcell, because the SopB, an orthologue of ParB of P1, immersion objective lens and the Delta Vision system
has the intrinsic property of specific localization at midcell (Applied Precision). Microscopic imaging was carried out as
(Kim and Wang, 1998; Yamaichi and Niki, 2004). However, described in detail in the Supplemental Text.
© 2007 The Authors
Journal compilation © 2007 Blackwell Publishing Ltd, Molecular Microbiology, 64, 1198–1213You can also read