RAS specific protease induces irreversible growth arrest via p27 in several KRAS mutant colorectal cancer cell lines
←
→
Page content transcription
If your browser does not render page correctly, please read the page content below
www.nature.com/scientificreports
OPEN RAS specific protease induces
irreversible growth arrest via p27
in several KRAS mutant colorectal
cancer cell lines
Caleb K. Stubbs1, Marco Biancucci1,2, Vania Vidimar1,3 & Karla J. F. Satchell1*
Ras-specific proteases to degrade RAS within cancer cells are under active development as an
innovative strategy to treat tumorigenesis. The naturally occurring biological toxin effector called
RAS/RAP1-specific endopeptidase (RRSP) is known to cleave all RAS within a cell, including HRAS,
KRAS, NRAS and mutant KRAS G13D. Yet, our understanding of the mechanisms by which RRSP
drives growth inhibition are unknown. Here, we demonstrate, using isogenic mouse fibroblasts
expressing a single isoform of RAS or mutant KRAS, that RRSP equally inactivates all isoforms of
RAS as well as the major oncogenic KRAS mutants. To investigate how RAS processing might lead
to varying outcomes in cell fate within cancer cells, we tested RRSP against four colorectal cancer
cell lines with a range of cell fates. While cell lines highly susceptible to RRSP (HCT116 and SW1463)
undergo apoptosis, RRSP treatment of GP5d and SW620 cells induces G1 cell cycle arrest. In some cell
lines, growth effects were dictated by rescued expression of the tumor suppressor protein p27 (Kip1).
The ability of RRSP to irreversibly inhibit cancer cell growth highlights the antitumor potential of
RRSP, and further warrants investigation as a potential anti-tumor therapeutic.
The oncoprotein Rat sarcoma GTPase (RAS) cycles between GTP-bound (active) and GDP-bound (inactive)
states for activation of downstream effectors, each playing key roles in cell proliferation and survival1,2. This pro-
cess is highly reliant on GTPase activating proteins (GAPs) and guanine exchange factors (GEFs) for hydrolysis
of GTP and nucleotide exchange of GDP to GTP, r espectively3,4. Upon growth receptor stimulation, activated
RAS recruits downstream effectors, including Rapidly Accelerated Fibrosarcoma (RAF) kinase and phosphati-
dylinositol-3-kinase (PI3K). These effectors subsequently activate signaling pathways responsible for cell growth
and survival, including the mitogen-activated kinase to extracellular signal-regulated kinase (ERK)5 signaling
pathway and the protein kinase B (also known as AKT) to mammalian target of rapamycin (mTOR) pathway,
respectively6,7.
Thirty percent of all human cancers contain mutations in RAS2,8. Mutant RAS, paired with loss of function in
tumor suppressor genes such as TP53 and APC, are sufficient to fully transform cells and drive t umorigenesis8.
Nearly all RAS mutations occur as point mutations at Gly-12, Gly-13 or Gln-61, resulting in constitutive activa-
AS2. Among the major RAS isoforms (HRAS, NRAS, and KRAS), KRAS is the most frequently mutated
tion of R
isoform among all cancers (85%) followed by NRAS (11%) and HRAS (4%)8. RAS mutations are highly enriched
specifically in three of the four most lethal cancers in the United States, including pancreatic adenocarcinoma
(98%), colorectal adenocarcinoma (52%), and lung adenocarcinoma (32%)2,8.
Although numerous studies support the advantages of targeting RAS to treat cancer, it remains an unsolved
challenge in the clinic9–13. Recent studies have taken advantage of biochemical properties of specific RAS mutants
to develop selective small molecule inhibitors specific for highly oncogenic mutant forms of RAS. In particular,
small molecules targeting KRAS G12C have been developed and are undergoing clinical trials14–16. Many of
these agents have shown clinical success with one molecule receiving FDA accelerated approval earlier this
year for treatment of KRAS G12C tumors in non-small cell lung carcinoma17. Despite this success, the strategy
of selective inhibition has problems of being applicable to only a limited range of cancers integrated with per-
sonalized medicine and cannot be used to treat cancers that lack the specific mutation. To address this gap, new
1
Department of Microbiology and Immunology, Feinberg School of Medicine, Northwestern University, Chicago,
IL 60611, USA. 2Present address: GSK Vaccines, Rockville, MD 20850, USA. 3Present address: Merck Research
Laboratories, Boston, MA 02115, USA. *email: k-satchell@northwestern.edu
Scientific Reports | (2021) 11:17925 | https://doi.org/10.1038/s41598-021-97422-0 1
Vol.:(0123456789)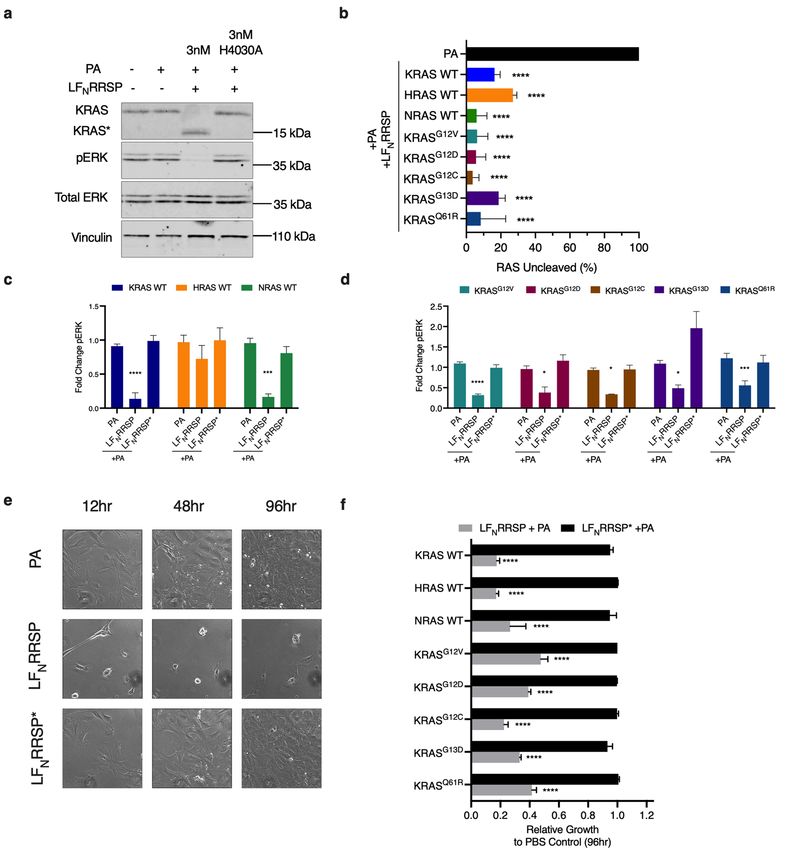
www.nature.com/scientificreports/
approaches are being developed to more broadly target RAS either with proteases that directly cleave R AS18,19
or with linkers that target RAS for cellular degradation20–23.
In line with this alternative strategy, our lab has identified a potent protease that cleaves RAS called the Ras/
Rap1-specific endopeptidase (RRSP). RRSP is a small domain of a large toxin secreted by the bacterium Vibrio
vulnificus during host infection. V. vulnificus delivers RRSP into intestinal epithelial cells during host infection,
where it targets all RAS isoforms and close homolog Ras-related protein 1 (RAP1). Through RAS inactivation,
this bacterium suppresses the host immune response, thereby aiding systemic dissemination of the b acterium24,25.
Detailed structural and biochemical studies have shown that RRSP attacks the peptide bond between Tyr-32
and Asp-33 in the Switch I region of both RAS and R AP126. As a result, RAS and RAP1 are unable to undergo
GTP-GDP exchange or bind to their downstream e ffectors27,28. Recently, RRSP engineered as a chimeric toxin for
in vivo delivery was shown to significantly reduce breast and colon tumor growth in xenograft mouse models18.
The potential applicability of RRSP to a broader range of cancers was screened using the standardized National
Cancer Institute (NCI) cancer cell p anel29. Fourteen of 60 cell lines were classified as highly susceptible with cells
undergoing cytotoxic effects. However, 38/60 of cell lines showed growth inhibition, but not cytotoxicity. Only
8/60 showed low or no susceptibility with cell growing near normal rates, possibly due to lack of the receptor for
the engineered chimeric t oxin18. The observed wide range of cell fates highlights that the cellular responses to
total RAS cleavage has the potential to be quite variable across cancer cell lines. Here, we investigate how RRSP
processing affects cell signaling and demonstrate that cleaving total RAS can have a variable impact on cancer
cell growth and survival. Specifically, we demonstrate that RRSP can disrupt colorectal cancer (CRC) cell growth
through multiple mechanisms, including loss of cell viability, cell cycle arrest, and senescence.
Results
RRSP cleaves and inhibits proliferation in RAS wildtype and KRAS mutant cells. RRSP was
previously shown to specifically cleave HRAS, NRAS, and KRAS when the proteins were ectopically expressed
in HeLa cells and recombinant RRSP was shown to process purified KRAS G12D, G13D, and Q61R in bio-
chemical assays26. To get an even broader sense of RRSP effectiveness across different isoforms and mutants
of RAS, we tested RRSP against the ‘RAS-less’ mouse embryonic fibroblast (MEF) cell line panel developed by
Drosten et al.7. These isogenic cell lines have endogenous RAS genetically deleted from their genome and a single
allele of a human RAS gene is integrated to rescue growth. For delivery of RRSP into mouse cells, we used the
anthrax toxin-based delivery system wherein the anthrax toxin lethal factor N-terminus was fused with RRSP
(LFNRRSP) or LFNRRSP with a catalytically inactivating H4030A amino acid substitution (here after referred to
as LFNRRSP*). Intracellular delivery of RRSP (previously known as DUF5) by anthrax toxin protective antigen
(PA) was previously demonstrated in several mammalian and mouse cell lines26,30,31.
In MEFs expressing human KRAS, HRAS, or NRAS, treatment with 3 nM L FNRRSP dramatically decreased
intact full-length RAS levels with increased detection of cleaved RAS. For each isoform, L FNRRSP was found to
cleave at least 80% of RAS after 24 h (Fig. 1A). As expected, controls treated with PA alone or in combination with
catalytically inactive L
FNRRSP* showed no change of intact RAS protein levels (Fig. 1A,B). We observed similar
RRSP activity in MEF cell lines expressing oncogenic KRAS, including G12V, G12D, G12C, G13D, and Q61R.
Amongst each of the mutant RAS alleles tested, we observed ~ 25% of total RAS remaining following LFNRRSP
treatment, with no significant loss of RAS in cells treated with alone (Fig. 1B). The oncogenic RAS variants with
the higher percentage of RAS remaining following L FNRRSP treatment were G13D and Q61R, although these
differences were not statistically significant. Further, the total RAS remaining in each LFNRRSP-treated MEF
cell line was not statistically significant between groups. In addition to cleavage of RAS, L FNRRSP treated cells
showed significant decrease in phosphorylation of ERK when compared to cells treated with PA alone or with
the catalytically inactive L
FNRRSP* (Fig. 1C,D).
To test the impact of processing of different RAS isoforms on cell proliferation, RRSP-treated cells were
tracked using time lapse imaging for four days. At early timepoints following treatment, LFNRRSP-induced a
severe cell rounding that was not observed in PA alone and L FNRRSP* control treated cells (Fig. 1E). This phe-
notype is consistent with previous studies with RRSP and is possibly linked to cleavage of RAP1, which regulates
cytoskeletal dynamics26,30,32. LFNRRSP treated cells showed reduced confluency at both 48 and 96 h (Fig. 1E) and
continuous treatment for 96 h resulted in at least at least a 60% reduction in confluency for all RAS-less MEF cell
lines compared to cells treated with either PA only or LFNRRSP* mutant controls (Fig. 1F, Supplementary Fig. 1).
Altogether, these results in MEFs demonstrate that RRSP is equally able to cleave all isoforms of RAS and
mutant KRAS to inhibit both ERK phosphorylation and cell proliferation in a defined system. Thus, the KRAS
mutation does not likely solely account for differences in cancer cell fate upon treatment with RRSP. Instead, the
differences more likely depend on processes downstream of RAS processing that could vary in different cell lines.
RRSP inhibits proliferation and pERK activation in CRC cell lines. To probe the effect of process-
ing of RAS on downstream signaling, we focused on four KRAS mutant CRC cell lines, each harboring different
allelic mutations in KRAS (Fig. 2A). Due to problems with variable expression of the anthrax toxin receptor on
the selected human cancer cells, we switched to a recently described, highly potent RRSP chimeric toxin wherein
RRSP is tethered to the translocation B fragment of diphtheria toxin (RRSP-DTB)18. Similar to the anthrax toxin
system, RRSP-DTB binds to a human receptor (heparin binding epidermal growth factor-like growth factor (HB-
EGF)), is endocytosed, and translocated into the cytosol across the vacuolar membrane. Expression of HB-EGF
receptor was found to be similar between the selected CRC cell lines (Supplementary Fig. 2, Supplementary
Fig. 10).
To examine RRSP growth sensitivities between the CRC cell lines, cells were treated with increasing concen-
tration of RRSP-DTB or with catalytically inactive RRSP-DTB (RRSP*-DTB) and growth inhibition was monitored.
Scientific Reports | (2021) 11:17925 | https://doi.org/10.1038/s41598-021-97422-0 2
Vol:.(1234567890)
www.nature.com/scientificreports/
Figure 1. LFNRRSP cleaves and inhibits all RAS isoforms and KRAS oncogenic mutants in RAS-less MEFs. (A)
Representative western blot analysis of L FNRRSP cleavage of RAS and inhibition of ERK in KRAS WT RAS-
less MEFs after 24 h. Vinculin was used as a gel loading control. Protein detection for each immunoblot was
analyzed on the same blot. Protein detection for each immunoblot was conducted on the same blot and cropped
for each individual protein of interest. Full length blots can be found in Supplementary Fig. 7. (B) Densitometric
analysis of total percent RAS in indicated RAS-less MEFs following L FNRRSP treatment for 24 h, n = 3. (C,D)
Densitometric analysis of fold change in pERK compared to PBS control after 24 h for RAS-less MEF cell
lines indicated; n = 3. (E) Brightfield images of KRAS WT RAS-less MEFs treated with either PA alone or in
combination with L FNRRSP or LFNRRSP* at indicated timepoints. (F) Cell growth over time was monitored
with time lapse video microscopy and quantified using Nikon Elements. Values shows relative growth inhibition
in RAS-less MEFs compared to PA control at 96 h following treatment with either L FNRRSP or LFNRRSP*.
Results for all panels are expressed as mean ± SEM of three independent experiments (*P < 0.05, **P < 0.01,
****P < 0.0001 versus PA control as determined through one-way ANOVA followed by Dunnett’s multiple
comparison test).
Scientific Reports | (2021) 11:17925 | https://doi.org/10.1038/s41598-021-97422-0 3
Vol.:(0123456789)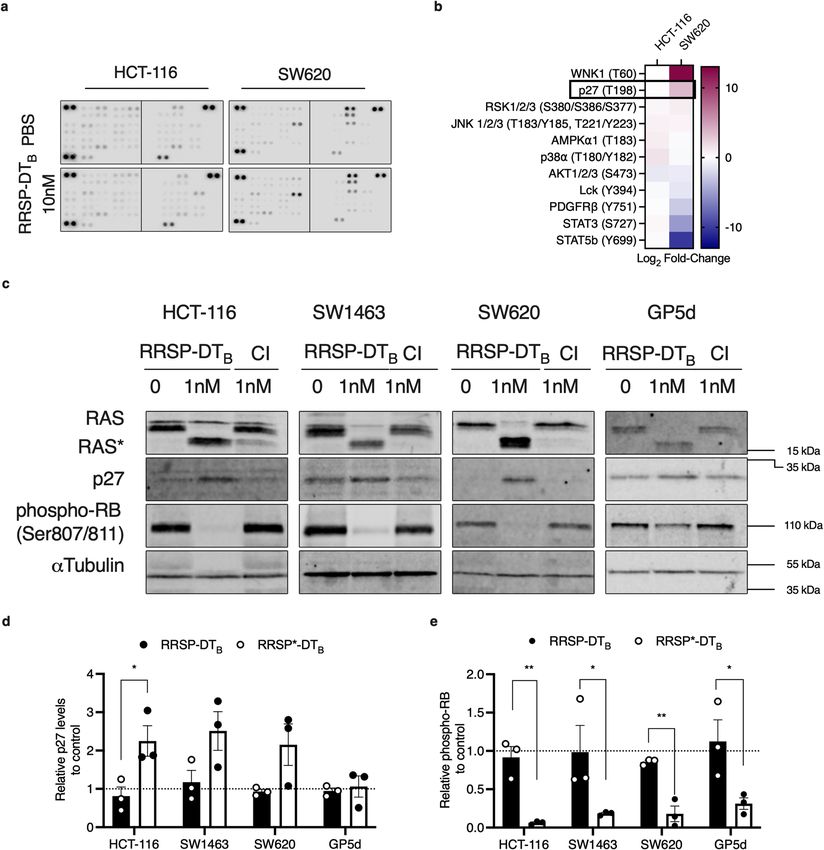
www.nature.com/scientificreports/
Figure 2. RRSP-DTB growth inhibition in CRC cell lines. (A) Cell line panel of KRAS mutant CRC cells used
in this study. (B–E) Cell growth over time was monitored by time lapse video microscopy and cell confluency
was quantified using ImageJ. Fitted dose response curve of RRSP-DTB in CRC cell lines show relative growth
compared to PBS control after 24 h. Results are displayed as mean ± SEM, n = 4. (F) Representative western blot
analysis of RAS cleavage and ERK inhibition in CRC cell lines treated with either RRSP-DTB or catalytically
inactive mutant (labeled by CI) after 24 h. All concentrations are expressed in nanomolar. In all cell lines,
vinculin was used as gel loading control except SW620 cells in which αTubulin was used. Protein detection
for each immunoblot was conducted on the same blot and cropped for each individual protein of interest. Full
length blots can be found in Supplementary Fig. 8. (G,H) Densitometric analysis of fold change in percent
total RAS and pERK compared to PBS control after 24 h in CRC cell lines; n = 3. IC50 concentrations for HCT-
116 and SW1463 can be found in Figs. 2B and 2C. For cell lines where IC50 values could not be extrapolated
(SW620 and GP5d) RRSP-DTB was used at 0.1 nM. Results are expressed as means ± SEM of three independent
experiments (*P < 0.05, **P < 0.01, ****P < 0.0001 versus PBS control as determined through one-way ANOVA
followed by Dunnett’s multiple comparison test).
HCT-116 cells showed the greatest impact of RRSP-DTB on cell confluency and the lowest I C50 (Fig. 2B, Sup-
plementary Fig. 2), consistent with prior data using different methods that HCT-116 cells are highly susceptible
to RRSP18. Cells treated with catalytically inactive RRSP*-DTB showed no difference, confirming the sensitivity
was due to processing of RAS (Fig. 2B, Supplementary Fig. 2). SW1463 cells were also highly susceptible to
RRSP-DTB but with a 12-fold higher I C50 compared to HCT-116 (Fig. 2C, Supplementary Fig. 2). Cell line SW620
was less susceptible to RRSP-DTB after 24 h with about a 40% growth inhibition compared with control at the
highest dose tested of 10 nM. This result using a different method is consistent with prior r esults18, which cat-
egorized SW620 as responding to RRSP by growth inhibition, although the percent inhibition here was less due
to the earlier time point used for comparison. Cell line GP5d was also less susceptible to RRSP, but also showed
growth inhibition when compared to cells treated with the control (Fig. 2D,E, Supplementary Fig. 2). Across
all of the cell lines, at least 80% of total RAS was cleaved by RRSP (Fig. 2F,G). In addition, phosphorylation of
Scientific Reports | (2021) 11:17925 | https://doi.org/10.1038/s41598-021-97422-0 4
Vol:.(1234567890)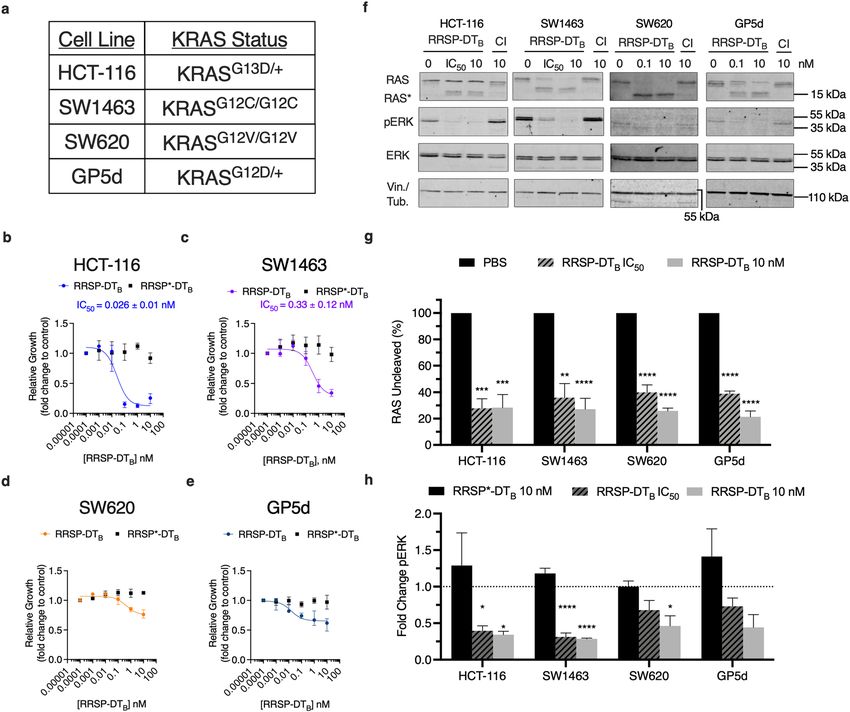
www.nature.com/scientificreports/
ERK was significantly reduced compared to respective RRSP*-DTB treated samples (Fig. 2F,H). We did observe
some variability in detection of uncleaved RAS between cell lines, which can be attributed in part to cells sens-
ing depleted pools of RAS and therefore upregulating expression. This is best observed in HCT-116 cells treated
with RRSP-DTB where total uncleaved RAS protein levels increase above the levels of PBS control even as cleaved
RAS accumulates (Fig. 2F).
The differences in growth following RRSP treatment further impacted long term survival. Using ATP as an
indicator of cell viability, the CellTiterGlo Assay can quantitatively measure the presence of metabolically active
cells through detection of luminescence signal, even if the cells fail to proliferate. In highly susceptible cell
lines HCT-116 and SW1463 cells, treatment with RRSP-DTB resulted in significantly decreased luminescence
compared to mock treated controls after 72 h (Fig. 3A). By contrast, GP5d and SW620 showed no difference in
relative ATP levels after 72 h.
To further understand the survival differences between RRSP-treated cell lines, we used the Caspase-Glo 3/7
Assay, which quantitatively measures caspase-3/7 activity using luminogenic caspase-3/7 substrate to indicate
onset of apoptosis. In highly susceptible cell lines HCT-116 and SW1463, treatment with RRSP at both low (1 nM)
and high (10 nM) concentrations of RRSP-DTB significantly increased luminescence compared to mock-treated
controls after 48 h, suggesting onset of apoptosis (Fig. 3B). This was not the case for GP5d cells where the signal
was highly variable across replicate samples and even decreased in response to RRSP-DTB treatment. For SW620
cells, we observed RRSP-DTB treatment significantly decreased luminescence compared to mock-treated control
suggesting a suppression of apoptosis. When treated for 48 h and reseeded at low cell densities SW620 and GP5d
both showed a decrease in colony formation, suggesting that RRSP can induce a permanent non-proliferative
state, even as cells maintain metabolic activity (Fig. 3C,D). SW620 cells also showed significant increase activity
of the enzyme β-galactosidase, a marker of senescence. This would support our earlier observation in which
apoptosis was suppressed in RRSP-DTB-treated SW620 cells since senescence is known to counteract apoptosis
pathway activation33. However, β-galactosidase activity of treated GP5d cells remained unchanged (Fig. 3E).
Altogether, these data demonstrate that RRSP activity results in induction of apoptosis in highly susceptible
cell lines while, in less sensitive lines, the cells remain metabolically active, but are unable to proliferate and, in
some cases, enter into senescence.
RAS cleavage can induce upregulation of cyclin‑dependent kinase inhibitor p27 and hypo‑phos-
phorylation of RB. We next took advantage of the unique cell line specific effects on cell growth and sur-
vival to better understand the underlying mechanisms regulating cell fate following RAS inhibition. Cell lysates
from treated or untreated HCT-116 (highly sensitive) and SW620 (less sensitive) were incubated overnight with
nitrocellulose membranes containing capture antibodies towards 43 different phosphorylated proteins (Fig. 4A).
For RRSP-treated HCT-116 cells, there was increased phosphorylation observed for cell stress proteins such as
p38α, p90 ribosomal S6 kinase (RSK1/2/3), and Jun-activated kinase (JNK) (Fig. 4B, Supplementary Fig. 3). In
addition, RRSP treatment increased phosphorylation of several Signal Transducer and Activator of Transcrip-
tion (STAT) transcription factors. By contrast, the less responsive SW620 cells showed decreased phosphoryla-
tion of several STAT proteins (Fig. 4B, Supplementary Fig. 3). We also observed a significant fold increase in
With No K(lysine)-1 (WNK1) kinase at Thr-60. This kinase is phosphorylated by AKT in HEK293 cells and is
best known for regulating ion transport across m embranes34. However, phosphorylation of Thr-60 has no effect
on its kinase activity or its cellular l ocalization35. Because RRSP decreases AKT activation (Fig. 4B), it is unlikely
that WNK1 Thr-60 phosphorylation is involved in the growth differences we observe between cell lines.
Thus, we focused on the large fold-change difference observed in phosphorylation at Thr-198 of the cyclin-
dependent kinase inhibitor p27 (also known as Kip1) (Fig. 4B). While HCT-116 cells showed no significant
change in p27 phosphorylation in the screen, SW620 showed a threefold increase in p27 phosphorylation.
RAS is known to regulate critical components involved in cell cycle. RAS activation is directly linked to hyper-
phosphorylation of retinoblastoma protein (RB), thereby relieving its repression of E2F transcription factors,
allowing transcription of G1 promoting genes, and promoting the cell cycle to progress from G1 to S p hase36.
Previous studies have established that phosphorylation of p27 at Thr-198 is critical for stabilizing p27 expres-
sion by preventing ubiquitin-dependent d egradation37. In fact, aberrant RAS activity in cancer cells causes p27
post-translational downregulation through both ERK and A KT5,38,39. These data support that inhibition of RAS
by RRSP could lead to downstream rescue expression of p27 expression in the SW620 cells, thereby slowing
reversing the hyper-phosphorylation of RB.
To test this possibility, all four cancer cell lines were treated with a sublethal dose of RRSP-DTB. The treat-
ment increased p27 protein levels in HCT-116, SW620, and SW1463 cells, while in GP5d cells levels remained
unchanged (Fig. 4C,D). Concomitant with increased abundance of p27, all cell lines showed a significant decrease
in RB phosphorylation at Ser-807/Ser-811 (Fig. 4C,E). Unfortunately, total RB was undetectable using commer-
cially available antibodies. To be confident that RB hypo-phosphorylation was not due to low RB expression,
we transiently expressed green-fluorescent protein (GFP)-tagged RB in HCT-116 cells (Supplementary Fig. 4,
Supplementary Fig. 11). In GFP-RB expressing cells treated with RRSP-DTB, hypo-phosphorylation of RB protein
compared to PBS and RRSP*-DTB controls was observed (Supplementary Fig. 4). Protein levels of total GFP-RB
were decreased upon treatment with RRSP-DTB. This result was expected and is consistent with a role of p27 in
degradation of RB protein to promote growth arrest40.
Unexpectedly, hypo-phosphorylation of RB was also observed in GP5d cells despite showing no change in
the expression or phosphorylation of p27 (Fig. 4D,E). The cyclin-dependent kinase inhibitor, p21, also plays a
critical role in RB regulation. However, there was also no change in p21 protein levels in RRSP-treated GP5d
cells (Supplementary Fig. 4, Supplementary Fig. 12).
Scientific Reports | (2021) 11:17925 | https://doi.org/10.1038/s41598-021-97422-0 5
Vol.:(0123456789)www.nature.com/scientificreports/
Figure 3. RRSP-DTB decreases cell viability in highly sensitive cell lines but causes irreversible growth inhibition in lower susceptible
cell lines. (A) Relative cellular metabolic activity quantified using CellTiterGlo assay after 72-h treatment with 10 nM RRSP-DTB
compared to PBS control in CRC cell lines. (B) Relative apoptosis quantified using Caspase-Glo 3/7 assay after 48-h treatment with
either 1 or 10 nM RRSP-DTB compared to PBS control in CRC cell lines. (C) Representative images of crystal violet-stained colonies
from RRSP less sensitive cell lines pretreated with 10 nM RRSP-DTB for 48 h and replated at low seeding density to form colonies
over 14 days. (D) Quantitative analysis of crystal-violet stained colonies from less sensitive RRSP cell lines from three independent
experiments. Results are expressed as means ± SEM of three independent experiments (E) Measured cell senescence activity in RRSP
less sensitive cell lines treated with 10 nM RRSP-DTB for 48 h then incubated with SA-ß-Gal Substrate for 1 h at 37ºC, n = 3. All
results described above are expressed as mean ± SEM of three independent experiments (*P < 0.05, **P < 0.01, ****P < 0.0001, ns = not
significant versus PBS control as determined through one-way ANOVA followed by Dunnett’s multiple comparison test).
Scientific Reports | (2021) 11:17925 | https://doi.org/10.1038/s41598-021-97422-0 6
Vol:.(1234567890)www.nature.com/scientificreports/
Figure 4. RRSP-DTB cleavage of RAS induces p27 expression in CRC cell lines. (A) Human phospho-
kinase array blots of HCT-116 and SW620 cells treated with either PBS or RRSP-DTB (10 nM) for 24 h. (B)
Densitometric analysis kinase array depicted through a heatmap of relative phosphorylated proteins levels
in response to RRSP-DTB compared to PBS control in HCT-116 and SW620 cells, n = 1. (C) Representative
western blot images of p27 and phosphor-RB expression in CRC cell lines treated with either RRSP-DTB or
RRSP*-DTB for 24 h. Protein detection for each immunoblot was conducted on the same blot and cropped for
each individual protein of interest. Full length blots can be found in Supplementary Fig. 9. (D,E) Densitometric
analysis of fold change in p27 and phospho-RB compared to PBS after 24 h in RRSP-DTB treated CRC cell lines;
n = 3. αTubulin was used as gel loading control. Results are expressed as mean ± SEM of three independent
experiments (*P < 0.05, ** < 0.01, **** < 0.0001 versus PBS control as determined through one-way ANOVA
followed by Dunnett’s multiple comparison test).
RRSP induces G1 phase cycle arrest. Elevated p27 protein expression in combination with hypo-phos-
phorylation of RB suggested that RRSP treatment induces cell cycle arrest. Under normal conditions, p27 regu-
DK241,42. To
lates G1 checkpoint during the cell cycle by preventing entry into S phase through inhibition of C
Scientific Reports | (2021) 11:17925 | https://doi.org/10.1038/s41598-021-97422-0 7
Vol.:(0123456789)www.nature.com/scientificreports/
Figure 5. RRSP-DTB induces G1 cell cycle arrest in CRC cell lines. (A–D) Cell cycle flow cytometry analysis
of CRC cell lines treated with either PBS, RRSP-DTB or RRSP*-DTB (1 nM) for 24 h. Percentage of cells in each
phase are an average of three independent experiments. Bar graphs depict percentage of cells in G1 phase for
each treated sample; n = 3. Results are expressed as mean ± SEM of three independent experiments (*P < 0.05,
**P < 0.01, ****P < 0.0001 versus PA control as determined through one-way ANOVA followed by Dunnett’s
multiple comparison test).
test if RRSP-DTB treatment induces cell cycle arrest, cell lines were treated for 24 h and the percentage of cells
in G1, S, or G2/M phase was monitored. All cell lines that showed reduced RB phosphorylation had significant
population of cells locked in the G1 state compared to PBS and RRSP*-DTB treated samples (Fig. 5, Supple-
mentary Fig. 6). The most dramatic increase in G1 arrest was seen in SW620 cells, where nearly 100% of cells
remained in the G0/G1 phase following RRSP-DTB treatment (Fig. 5C). This G1 cell arrest was dependent on
the RAS processing activity of RRSP as the catalytically inactive mutant RRSP*-DTB did not induce the cell
Scientific Reports | (2021) 11:17925 | https://doi.org/10.1038/s41598-021-97422-0 8
Vol:.(1234567890)www.nature.com/scientificreports/
cycle arrest (Fig. 5A–D). Together, these data illustrate that RRSP cleavage of RAS can induce growth inhibition
through inducing cell cycle arrest, after which some cell lines progress to cytotoxic death.
Discussion
It has been over 30 years since the discovery of the importance of RAS for driving tumorigenesis in cancer. Lung,
pancreatic, and colorectal cancers remain being the most lethal cancers in the United States with high mutation
rates in KRAS, the most commonly mutated isoform. Despite the significant amount of research being conducted
on RAS, it still remains a challenging target in the field. Small molecules directed to specific RAS mutants, spe-
cially KRAS G12C, have shown promising results in clinical trials43, but will only benefit a small subset of patients.
Our lab has discovered RRSP as a potent, site specific inhibitor of RAS capable of inhibiting all RAS isoforms
simultaneously along with downstream activation. RRSP antitumorigenic effects are well demonstrated in vivo
with xenograft models for both breast and colon cancers, wherein tumor growth was stunted and, in some cases,
showed regression18. Evidence for RRSP as a therapeutic inhibitor of RAS is sufficient, however the mechanism
by which RRSP mediates growth inhibition has been an outstanding question. In this study, we examined the
signaling consequences of cleavage of all RAS in several CRC cell lines and its downstream implications on
cell proliferation and survival. The goal of the study was to understand the mechanism of growth inhibition in
response to RRSP, in the absence of cytotoxicity.
First, we examined whether RRSP was a suitable inhibitor across RAS variants. Using the isogenic ‘RAS-less’
MEF model, we demonstrated that all three major RAS isoforms and frequently observed KRAS mutants were
equivalent substrates for RRSP. Loss of RAS resulted in reduced ERK activation, which as expected, negatively
affected proliferation. Most importantly, in this isogenic study, we observed no significant differences in RAS
cleavage between wildtype isoforms and KRAS mutants. RAS-less MEFs are useful for studying isolated bio-
chemical properties and signaling of specific oncogenic RAS in a cellular context making it an excellent model
to study RRSP targeting of mutant RAS. One of the unavoidable disadvantages of this model is the number of
integration sites that vary between RAS-less MEF cell lines. For some RAS cell lines a single gene integration
could not rescue proliferation and required multiple integrations for stable clonal populations. As a result in the
context of RRSP, expression of multiple genes of a single RAS allele may lead to an underestimation of RRSP
effectiveness in cleaving RAS.
We next examined RRSP effectiveness in four CRC cell lines, which displayed variations in susceptibility to
RRSP. Two of the cell lines with the greatest RRSP growth sensitivity, HCT-116 and SW1463, had dramatically
lower metabolic activity and induction of apoptosis compared to controls. Interestingly, GP5d and SW620
retained normal metabolic activity, yet showed significant inability to form colonies following RRSP treatment,
mimicking a senescent-like phenotype. This observation is consistent with prior data for SW620 showing a
reduction in cellular material stained with sulforhodamine B after 48 h of treatment at 13.5 nM RRSP, but
RRSP was not c ytotoxic18. A logical hypothesis is that GP5d and SW620 cells have elevated pERK activity and
therefore are less susceptible to RRSP. However, our data show the opposite in that moderately susceptible cell
lines have significant decreases in pERK and RAS following RRSP treatment. This result would suggest that
inhibition of pERK activity is not a predictor of susceptibility to RRSP in many cell lines. Similar results have
previously demonstrated that varying growth sensitivities to pharmacological inhibition of mitogen-activated
protein kinase kinases (MEKs) do not correlate with pERK activity in KRAS and BRAF mutant CRC cell lines44,45.
Further investigation of RRSP in the context of KRAS mutants expressing low levels of pERK would elucidate
mechanisms regulating cell fate signals between cell lines.
Mechanisms that link RAS and the cell cycle have been well examined. In quiescent cells, p27 is highly
expressed in order to inhibit CDKs activity and to suppress RB p hosphorylation41,42. Upon mitogen stimulation,
RAS activation suppresses p27 protein expression through post-translational modifications that signal for its
ubiquitin-mediated degradation5,38,39. In RAS-driven human cancers, low levels of p27 are frequently observed.
We demonstrated that the growth inhibition in HCT-116, SW1463, and SW620 is the result of G1 cell cycle
arrest through the upregulation of p27. These data suggest that RAS cleavage in certain CRC cell lines induces
p27 upregulation, leading to a cell cycle arrest state that can induce apoptosis at later timepoints. Transient
overexpression of p27 is known to then induce cell cycle arrest and later a poptosis46,47. Although in our studies,
only the highly susceptible cell lines showed decreases in viability and induction of apoptosis, whereas SW620
retained metabolic activity and undergoes cell cycle arrest. It is important to note that a prolonged cell cycle
arrest through p27 induces a persistent cell cycle arrest through induce senescence48. We observe this phenotype
in SW620 cells in which RRSP treatment induced a senescent-like phenotype.
Unexpectedly, GP5d cells did not show upregulation of p27 or p21, although RB was hypo-phosphorylated
and cells initiated G1 cell cycle arrest. These data reveal there must be other pathways that drive growth inhibition
following RAS cleavage. In fact, RRSP from the insect pathogen Photorhabdus asymbiotica, which is identical to
RRSP, also cleaves RAS26 and was recently reported to induce G1 cell cycle arrest49. The proposed mechanism did
not depend on RAS processing, and instead involved RRSP directly binding to CDK1 when it is overexpressed,
essentially functioning as a protein trap. Thus, the multi-domain RRSP may possess at least two mechanisms
to inhibit the cell cycle, one by restoring p27 downstream of RAS processing and another by directly binding
to CDK1. Notably, because low p27 expression levels have been correlated with poor survival in patients with
different types of cancer including colon, the ability of RRSP to restore p27 expression and to initiate cell cycle
arrest could have important implications for the treatment of tumors with aberrant RAS signaling.
In summary, a critical finding of this study was that processing of RAS does not result in a single easily tracta-
ble cell fate in all cancer cells, but drives a suite of alternative overlapping outcomes that can include cytotoxicity,
inhibition of cell cycle and senescence. The differences are not driven by the nature of KRAS oncogenic mutation
as all mutant forms of KRAS were susceptible to RRSP-driven RAS processing in an isogenic system and RAS
Scientific Reports | (2021) 11:17925 | https://doi.org/10.1038/s41598-021-97422-0 9
Vol.:(0123456789)www.nature.com/scientificreports/
was processed in all the CRC cell lines. The impact of RAS processing is thus linked to cancer cell differences in
signal pathways downstream of RAS. A limitation of this study is that only four lines were assessed, suggesting
that the array of variable outcomes could increase as additional cell lines are considered in the future. However,
the key finding here is that, despite differences in the mechanisms underlying RRSP susceptibility, all cells tested
were ultimately susceptible and all led to reduced cell viability, growth, and/or proliferation. Thus, RAS processing
or degradation has great promise as a potential broadly applicable therapy against colon cancer.
Materials and methods
Cell lines. ‘RAS-less’ mouse embryonic fibroblast (MEF) cells were provided by the NCI RAS Initiative at
Frederick National Laboratory for Cancer Research (FNLCR). HCT-116 cells were purchased from the Ameri-
can Type Culture Collection. SW1463, GP5d, and SW620 were provided by the NCI. Each cell line was validated
by the Northwestern University Sequencing Core by Short Tandem Repeat profiling.
All cells were cultured at 37 °C and 5% CO2 atmosphere. HCT-116, SW1463, GP5d, SW620 cells were cultured
in Dulbecco’s Modified Eagle Medium (DMEM)-F12 with Glutamax (Gibco) containing 10% fetal bovine serum
(FBS; Gemini Bio) and 1% penicillin/streptomycin (P/S; Invitrogen). All MEF cells, except for HRAS RAS-less
MEFs, were cultured in DMEM (Gibco) with 10% FBS,1% P/S, and 4 µg/ml of blasticidin (ThermoFisher Scien-
tific). HRAS RAS-less MEFs was cultured in 2.5 µg/ml of puromycin (ThermoFisher Scientific).
Antibodies. Anti-RAS monoclonal antibody recognizing G-domain of all major RAS isoforms was purified
from a hybridoma cell line provided by FNLCR and used at 1:2000 dilution as previously d escribed18. Other
commercially available primary antibodies used were: anti–Phospho-p44/42 MAPK (phosphorylated ERK1/2,
Thr202/Tyr204, Cell Signaling Technology #4377), anti-p44/42 MAPK (ERK1/2, Cell Signaling Technology
#4696), anti-HB-EGF (R&D Systems, #AF-259-NA;), anti-p27Kip1 XP (Cell Signaling Technology #3686), Phos-
pho-RB (Ser807/Ser811, Cell Signaling Technology #8516), anti-p21WAF/Cip1 (Cell Signaling Technology #2947T),
anti-α-Tubulin (Cell Signaling Technology #2144), and anti-vinculin (Cell Signaling Technology #13901). Flu-
orescently-labeled secondary antibodies obtained from LI-COR Biosciences and used at 1:10,000 dilution were:
IRDye 680RD goat anti-mouse (926-68070), IRDye 800CW goat anti-rabbit (925-322211), and IRDye 800CW
donkey anti-goat (925-32214). Western blot images were acquired using an Odyssey Infrared Imaging System
(LI-COR Biosciences) and quantified by densitometry using NIH ImageJ software.
pRB‑GFP transfection. Plasmid RB-GFP FL for expression of GFP-tagged RB was obtained from Addgene
(Catalog #16004). For ectopic gene expression, cell lines were transfected using FuGene HD (Promega) accord-
ing to the manufacturer’s protocols. GFP fluorescence was analyzed using EVOS XL Core imaging system.
Western blotting. Cells were washed in PBS and then resuspended in lysis buffer [150 mM NaCl, 20 mM
Tris (pH 7.5), 1% Triton X-100, and Pierce Protease phosphatase inhibitor (Sigma-Aldrich)]. Lysates were incu-
bated for 15 min on ice and centrifuged at 20,000 × g at 4 °C for 15 min. The concentration of protein in the col-
lected supernatant fluid was determined using the bicinchoninic acid (BCA) assay (ThermoFisher Scientific, no.
23227). Samples were boiled at 95 °C in Laemmli SDS loading buffer for 10 min and protein was separated on
either 15 or 18% SDS–polyacrylamide gels. Proteins were transferred to nitrocellulose membranes and blocked
in Tris-buffered saline (TBS) [10 mM Tris (pH 7.4) and 150 mM NaCl] with 5% (w/v) milk for 1 h. Membranes
were washed with TBS and then incubated in indicated primary antibodies in TBS with 5% (w/v) Fraction V
bovine serum album (Fisher BioReagents #194850) overnight at 4 °C. Total percentage RAS was calculated using
the following equation: % Total RAS = uncleaved RAS band / (RAS uncleaved band / RAS cleaved band) X 100.
Purification and intoxication of LFNRRSP in MEFs. Recombinant LFNRRSP and LFNRRSP* were
expressed in Escherichia coli BL21(DE3) and purified over a HisTrap FF nickel affinity column followed by
Superdex 75 size exclusion chromatography using the ÄKTA protein purifier purification system (GE Health-
care), as previously described30. For intoxication, MEFs were seeded in 6-well plates at 3 × 10⁵ cells per well for
1 h, after which medium was replaced with fresh medium containing with 7 nM Protective antigen (PA) alone
(List Labs, #171E) or in the presence of 3 nM L FNRRSP/ LFNRRSPH4030A and incubated at indicated timepoints
at 37 °C in the presence of 5% CO2.
Purification and intoxication of RRSP‑DTB in CRC cell lines. Recombinant RRSP-DTB and RRSP*-
DTB were expressed in E. coli BL21(DE3) and purified over a HisTrap FF nickel affinity column as previously
described18. Eluted fractions were loaded onto a gravity column containing Strep-Tactin Superflow high capacity
resin, followed by SUMO-tag removal and size exclusion purification over a Superdex 75 column using ÄKTA
protein purifier purification system as previously d escribed18. For intoxication, CRC cell lines were seeded in
6-well plates (~ 70% confluency) overnight, after which medium was replaced with fresh medium containing
either RRSP-DTB or RRSP*-DTB and incubated at indicated timepoints at 37 °C in the presence of 5% C O 2.
Time‑lapse video microscopy. For RAS-less MEFs (6 × 10³ cells per well) were cultured in 96-well clear
bottom white plates in corresponding complete growth medium and treated after 4 h with RRSP-DTB or RRSP*-
DTB. Colorectal cancer cell lines were plated at ~ 80% confluency and cultured in 96-well clear bottom white
plates. Complete growth medium with RRSP-DTB or RRSP*-DTB was added after overnight cell attachment.
All cells were cultured were in Nikon Biostation CT and images were taken at indicated timepoints. Cell conflu-
Scientific Reports | (2021) 11:17925 | https://doi.org/10.1038/s41598-021-97422-0 10
Vol:.(1234567890)www.nature.com/scientificreports/
ency was quantified using Nikon Elements software. IC50 concentrations were calculated using log(inhibitor) vs.
response variable slope (four parameters) function in Graphpad Prism 8.
Cell viability, apoptosis, and cell survival assays. For cell viability assay CRC cell lines were seeded
in 96-well clear bottom white plates at ~ 80% confluency. Complete growth medium with RRSP-DTB or RRSP*-
DTB was added after overnight cell attachment. After 72 h, CellTiter-Glo (Promega) reagent was added to each
well and luminescence was detected using Tecan Safire2 plate reader. For apoptosis assay, CRC cell lines were
seeded at 10,000 cells per well in a 96-well clear bottom white plate. Complete growth medium with RRSP-DTB
or RRSP*-DTB was added overnight after cell attachment. After 48 h, Caspase-Glo 3/7 Assay (Promega) regent
was added to each well and luminescence was detected using Tecan Safire2 plate reader. For crystal violet assays,
cells were treated as described above and were incubated for 48 h. Following incubation cells were harvested and
reseeded at low seeding densities in 6-well plates. Colony formation was monitored over 14 days, during which
media was replaced every three days. On day 14 colonies were fixed in crystal violet fixing/staining solution
(0.05% (g/vol) crystal violet, 1% formaldehyde, 1% (v/v) methanol in PBS. Open source ColonyArea ImageJ
plug-in was used for quantitative analysis of the area % covered by the stained c olonies50. Due to high back-
ground from crystal violet staining in SW620 cells, stained wells were dissolved in 10% acetic acid and destained
on rocker for 30 min. Absorbance was measured at 590 nm using Tecan Safire2 plate reader.
Proteome human phospho‑kinase array. CRC cell lines were treated as described and washed in 1X
PBS. Cells were solubilized using lysis buffer provided by the vendor (R&D Systems) and rocked for 30 min at
4 °C. Suspension was spun for 5 min at 14,000 × g and supernatant was collected. Concentration of protein in
the collected supernatant fluid determined using the BCA assay (ThermoFisher Scientific, no. 23227). 200 μg
of sample lysate was applied to nitrocellulose membranes kinase arrays and incubated overnight at 4 °C. Pro-
vided detection antibodies were incubated with specified concentrations as suggested by the supplier. Membrane
arrays were acquired using Odyssey Infrared Imaging System (LI-COR Biosciences) and quantified by densi-
tometry using NIH ImageJ software. Values from densitometry analysis were normalized to HSP60 control.
Normalized value was then converted to Log2 fold change and plotted on heatmap using Graphpad Prism 8.
Cell cycle flow cytometry. CRC cell lines were treated as described above. After 24 h of treatment, cells
were collected from medium, washed with 1X PBS, and released from well with Trypsin–EDTA (0.25%), phenol
red (Invitrogen). Harvested cells were centrifuged at 700 × g for 5 min. Cells were washed twice in PBS and spun
down at 700 × g for 5 min. PBS was removed and cells were resuspended in 600 μL of ice-cold PBS. Cell were
permeabilized with addition of 1.4 mL of ice-cold ethanol slowly and incubated overnight at -20 °C. Following
two washes with PBS (centrifuged at 700 × g for 5 min), cells were stained in 200 μL PI staining solution (0.1%
Triton X-100, 50 μg propidium iodide (BioLegend), 0.2 mg/mL RNase) for 30 min. Samples were analyzed on
BD LSR Fortessa 1 Analyzer. At least 10,000 events were collected for each sample. Single cell populations were
viewed and gated on cyanine-3 area (Cy3-A) versus cyanine-3 width (Cy3-W) channels, to eliminate doublet
events. ModFit LT Software (Version 5) was used for cell cycle analysis.
Received: 22 April 2021; Accepted: 24 August 2021
References
1. Hunter, J. C. et al. Biochemical and structural analysis of common cancer-associated KRAS mutations. Mol. Cancer Res. 13,
1325–1335 (2015).
2. Hobbs, G. A., Der, C. J. & Rossman, K. L. Ras isoforms and mutations in cancer at a glance. J. Cell Sci. 129, 1287–1292 (2016).
3. Bos, J. L., Rehmann, H. & Wittinghofer, A. GEFs and GAPs: Critical elements in the control of small g proteins. Cell 129, 865–877
(2007).
4. Vigil, D., Cherfils, J., Rossman, K. L. & Der, C. J. Ras superfamily gefs and gaps: Validated and tractable targets for cancer therapy?.
Nat. Rev. Cancer. 10, 842–857 (2010).
5. Kerkhoff, E. & Rapp, U. R. Induction of cell proliferation in quiescent nih 3T3 cells by oncogenic c-Raf-1. Mol. Cell Biol. 17,
2576–2586 (1997).
6. Downward, J. Targeting Ras signalling pathways in cancer therapy. Nat. Rev. Cancer. 3, 11–22 (2003).
7. Drosten, M. et al. Genetic analysis of Ras signalling pathways in cell proliferation, migration and survival. EMBO J. 29, 1091–1104
(2010).
8. Cox, A. D., Fesik, S. W., Kimmelman, A. C., Luo, J. & Der, C. J. Drugging the undruggable Ras: Mission possible?. Nat. Rev. Drug
Discov. 13, 828–851 (2014).
9. Chin, L. et al. Essential role for oncogenic Ras in tumour maintenance. Nature 400, 468–472 (1999).
10. Collins, M. A. et al. Metastatic pancreatic cancer is dependent on oncogenic Kras in mice. PLoS ONE 7, e49707 (2012).
11. Fisher, G. H. et al. Induction and apoptotic regression of lung adenocarcinomas by regulation of a K-ras transgene in the presence
and absence of tumor suppressor genes. Genes Dev. 15, 3249–3262 (2001).
12. Kwong, L. N. et al. Oncogenic Nras signaling differentially regulates survival and proliferation in melanoma. Nat. Med. 18,
1503–1510 (2012).
13. Ying, H. et al. Oncogenic Kras maintains pancreatic tumors through regulation of anabolic glucose metabolism. Cell 149, 656–670
(2012).
14. Janes, M. R. et al. Targeting Kras mutant cancers with a covalent G12C-specific inhibitor. Cell 172, 578–89 e17 (2018).
15. Ostrem, J. M., Peters, U., Sos, M. L., Wells, J. A. & Shokat, K. M. K-Ras(g12c) inhibitors allosterically control GTP affinity and
effector interactions. Nature 503, 548–551 (2013).
Scientific Reports | (2021) 11:17925 | https://doi.org/10.1038/s41598-021-97422-0 11
Vol.:(0123456789)www.nature.com/scientificreports/
16. Patricelli, M. P. et al. Selective inhibition of oncogenic Kras output with small molecules targeting the inactive state. Cancer Discov.
6, 316–329 (2016).
17. FDA grants accelerated approval to sotorasib for KRAS G12C mutated NSCLC. U.S. Food and Drug Administration. https://www.
fda.g ov/d
rugs/r esour ces-i nform
ation-a pprov ed-d
rugs/f da-g rants-a ccele rated-a pprov al-s otora sib-k ras-g 12c-m
utate d-n
sclc (2021).
18. Vidimar, V. et al. An engineered chimeric toxin that cleaves activated mutant and wild-type Ras inhibits tumor growth. Proc. Natl.
Acad. Sci. U S A. 117, 16938–16948 (2020).
19. Chen, Y. et al. Engineering subtilisin proteases that specifically degrade active RAS. Commun. Biol. 4, 299 (2021).
20. Bery, N., Miller, A. & Rabbitts, T. A potent Kras macromolecule degrader specifically targeting tumours with mutant Kras. Nat.
Commun. 11, 3233 (2020).
21. Bond, M. J., Chu, L., Nalawansha, D. A., Li, K. & Crews, C. M. Targeted degradation of oncogenic Kras(G12C) by vhl-recruiting
protacs. ACS Cent. Sci. 6, 1367–1375 (2020).
22. Roth, S. et al. Targeting endogenous K-Ras for degradation through the affinity-directed protein missile system. Cell Chem. Biol.
27, 1151–1163 (2020).
23. Lim, S. et al. Exquisitely specific anti-Kras biodegraders inform on the cellular prevalence of nucleotide-loaded states. ACS Cent.
Sci. 7, 274–291 (2021).
24. Gavin, H. E., Beubier, N. T. & Satchell, K. J. The effector domain region of the Vibrio vulnificus MARTX toxin confers biphasic
epithelial barrier disruption and is essential for systemic spread from the intestine. PLoS Pathog. 13, e1006119 (2017).
25. Gavin, H. E. & Satchell, K. J. F. RRSP and RID effector domains dominate the virulence impact of Vibrio vulnificus MARTX toxin.
J. Infect. Dis. 219, 889–897 (2019).
26. Antic, I., Biancucci, M., Zhu, Y., Gius, D. R. & Satchell, K. J. Site-specific processing of Ras and Rap1 switch I by a martx toxin
effector domain. Nat. Commun. 6, 7396 (2015).
27. Biancucci, M. et al. The bacterial Ras/Rap1 site-specific endopeptidase RRSP cleaves Ras through an atypical mechanism to disrupt
Ras-ERK signaling. Sci. Signal. 11, eaat8335 (2018).
28. Biancucci, M. et al. Substrate recognition of MARTX Ras/Rap1-specific endopeptidase. Biochemistry 56, 2747–2757 (2017).
29. Chabner, B. A. NCI-60 cell line screening: A radical departure in its time. J. Natl. Cancer Inst. 108, 1–7 (2016).
30. Antic, I., Biancucci, M. & Satchell, K. J. Cytotoxicity of the Vibrio vulnificus MARTX toxin effector DUF5 is linked to the C2A
subdomain. Proteins 82, 2643–2656 (2014).
31. Loftis, A. R. et al. Anthrax protective antigen retargeted with single-chain variable fragments delivers enzymes to pancreatic cancer
cells. ChemBioChem 21, 2772–2776 (2020).
32. Bos, J. L. Linking rap to cell adhesion. Curr. Opin. Cell Biol. 17, 123–128 (2005).
33. Childs, B. G., Baker, D. J., Kirkland, J. L., Campisi, J. & van Deursen, J. M. Senescence and apoptosis: Dueling or complementary
cell fates?. EMBO Rep. 15, 1139–1153 (2014).
34. Gallolu Kankanamalage, S., Karra, A. S. & Cobb, M. H. WNK pathways in cancer signaling networks. Cell Commun. Signal. 16,
72 (2018).
35. Vitari, A. C. et al. WNK1, the kinase mutated in an inherited high-blood-pressure syndrome, is a novel PKB (protein kinase b)/
AKT substrate. Biochem. J. 378, 257–268 (2004).
36. Pruitt, K., Pestell, R. G. & Der, C. J. Ras inactivation of the retinoblastoma pathway by distinct mechanisms in NIH 3T3 fibroblast
and RIE-1 epithelial cells. J. Biol. Chem. 275, 40916–40924 (2000).
37. Schiappacassi, M. et al. Role of T198 modification in the regulation of p27(kip1) protein stability and function. PLoS ONE 6, e17673
(2011).
38. Greulich, H. & Erikson, R. L. An analysis of MEK1 signaling in cell proliferation and transformation. J. Biol. Chem. 273, 13280–
13288 (1998).
39. Rivard, N., Boucher, M. J., Asselin, C. & L’Allemain, G. MAP kinase cascade is required for p27 downregulation and s phase entry
in fibroblasts and epithelial cells. Am. J. Physiol. 277, C652–C664 (1999).
40. Broude, E. V. et al. P21(Waf1/Cip1/Sdi1) mediates retinoblastoma protein degradation. Oncogene 26, 6954–6958 (2007).
41. Hengst, L. & Reed, S. I. Inhibitors of the Cip/Kip family. Curr. Top. Microbiol. Immunol. 227, 25–41 (1998).
42. Sherr, C. J. & Roberts, J. M. CDK inhibitors: Positive and negative regulators of G1-phase progression. Genes Dev. 13, 1501–1512
(1999).
43. Goebel, L., Muller, M. P., Goody, R. S. & Rauh, D. KRasG12C inhibitors in clinical trials: A short historical perspective. Rsc. Med.
Chem. 11, 760–770 (2020).
44. Solit, D. B. et al. BRAF mutation predicts sensitivity to MEK inhibition. Nature 439, 358–362 (2006).
45. Yeh, J. J. et al. KRas/BRAF mutation status and ERK1/2 activation as biomarkers for MEK1/2 inhibitor therapy in colorectal cancer.
Mol. Cancer Ther. 8, 834–843 (2009).
46. Schreiber, M., Muller, W. J., Singh, G. & Graham, F. L. Comparison of the effectiveness of adenovirus vectors expressing cyclin
kinase inhibitors p16INK4a, p18INK4c, p19INK4d, p21(WAF1/CIP1) and p27KIP1 in inducing cell cycle arrest, apoptosis and
inhibition of tumorigenicity. Oncogene 18, 1663–1676 (1999).
47. Wang, X., Gorospe, M., Huang, Y. & Holbrook, N. J. P27kip1 overexpression causes apoptotic death of mammalian cells. Oncogene
15, 2991–2997 (1997).
48. Alexander, K. & Hinds, P. W. Requirement for p27(kip1) in retinoblastoma protein-mediated senescence. Mol. Cell Biol. 21,
3616–3631 (2001).
49. Wang, X., Shen, J., Jiang, F. & Jin, Q. The Photorhabdus virulence cassettes RRSP-like effector interacts with cyclin-dependent
kinase 1 and causes mitotic defects in mammalian cells. Front. Microbiol. 11, 366 (2020).
50. Guzman, C., Bagga, M., Kaur, A., Westermarck, J. & Abankwa, D. Colonyarea: An imagej plugin to automatically quantify colony
formation in clonogenic assays. PLoS ONE 9, e92444 (2014).
Acknowledgements
We thank the Frederick National Laboratory for Cancer Research (FNLCR) for providing the RAS-less MEF
cells, KRAS mutant cell lines, and hybridoma cells for the pan-RAS antibody directed against the G-domain.
Matthew Kieffer, Megan Packer, and all members of the Satchell laboratory are thanked for valuable intellectual
input and technical support. This work was funded by grants from the Chicago Biomedical Consortium, H
Foundation, and Northwestern Medicine Catalyst Fund (to K.J.F.S). C.K.S. was supported by a fellowship from
the National Cancer Institute (T32 CA09560). High content imaging was performed on the Nikon Biostation CT
system purchased with the support of NIH grant S10 OD021704. Flow cytometry core services were provided
by the Northwestern University RHLCCC Flow Cytometry Facility supported by NIH grant P30 CA060553.
Author contributions
C.K.S. designed and conducted all experiments and wrote the manuscript. M.B. conducted preliminary experi-
ments with the Ras-less MEF cells. V.V. contributed reagents, assisted with experimental design, and edited
Scientific Reports | (2021) 11:17925 | https://doi.org/10.1038/s41598-021-97422-0 12
Vol:.(1234567890)www.nature.com/scientificreports/
the manuscript. K.J.F.S. oversaw all aspects of design, conduct, and analysis of the experiments and edited the
manuscript.
Competing interests
K.J.F.S. has been granted a patent (US 10,829,752 B2) on use of RRSP to treat cancer. K.J.F.S. is a consultant for
Buoy Health on topics unrelated to this manuscript. K.J.F.S. has a significant financial interest in Situ Biosciences,
LLC, a contract research organization that pursues research unrelated to cancer. C.K.S. is an intern as a scientific
and financial advisor for Aspire Capital Partners, LLC, which invests in oncotherapies. All other authors declare
no conflicts of interest.
Additional information
Supplementary Information The online version contains supplementary material available at https://doi.org/
10.1038/s41598-021-97422-0.
Correspondence and requests for materials should be addressed to K.J.F.S.
Reprints and permissions information is available at www.nature.com/reprints.
Publisher’s note Springer Nature remains neutral with regard to jurisdictional claims in published maps and
institutional affiliations.
Open Access This article is licensed under a Creative Commons Attribution 4.0 International
License, which permits use, sharing, adaptation, distribution and reproduction in any medium or
format, as long as you give appropriate credit to the original author(s) and the source, provide a link to the
Creative Commons licence, and indicate if changes were made. The images or other third party material in this
article are included in the article’s Creative Commons licence, unless indicated otherwise in a credit line to the
material. If material is not included in the article’s Creative Commons licence and your intended use is not
permitted by statutory regulation or exceeds the permitted use, you will need to obtain permission directly from
the copyright holder. To view a copy of this licence, visit http://creativecommons.org/licenses/by/4.0/.
© The Author(s) 2021
Scientific Reports | (2021) 11:17925 | https://doi.org/10.1038/s41598-021-97422-0 13
Vol.:(0123456789)You can also read