Effects of tropical cyclone paths and shelf bathymetry on inducement of severe storm surges in the Gulf of Thailand
←
→
Page content transcription
If your browser does not render page correctly, please read the page content below
Acta Oceanol. Sin., 2020, Vol. 39, No. 3, P. 90–102
https://doi.org/10.1007/s13131-020-1558-4
http://www.hyxb.org.cn
E-mail: hyxbe@263.net

Effects of tropical cyclone paths and shelf bathymetry on
inducement of severe storm surges in the Gulf of Thailand
Saifhon Tomkratoke1, Sirod Sirisup1*
1 Data-Driven Simulation and Systems Research Team, National Electronics and Computer Technology Center,

 Pathumthani 12120, Thailand
Received 22 February 2019; accepted 17 May 2019

© Chinese Society for Oceanography and Springer-Verlag GmbH Germany, part of Springer Nature 2020

Abstract
The influences of tropical cyclone paths and shelf bathymetry on the inducement of extreme sea levels in a
regional bay are investigated. A finite volume coastal ocean model (FVCOM) has been configured for the Gulf of
Thailand-Sunda Shelf. A parametric wind model is used to drive the FVCOM. The contributions of the tropical
cyclone characteristics are determined through a scenario-based study. Validation based on a historical extreme
sea level event shows that the model can resolve the oscillation mechanism well. The intensification of severe
storm surges in the region highly depends on four factors including phase propagation of the storm surge wave
determined by the landfall position, funnel effect caused by locality of the coastline, and shelf bathymetry
determined by the state of mean sea level and coastline crossing angle of the storm path. The coexistence of these
factors can cause particular regions e.g. the Surat Thani Bay, inner Gulf of Thailand and Ca Mau Peninsular to
experience a larger surge magnitude. These areas are found to be highly related to monsoon troughs that develop
during the onset and early northeastern monsoon season (October–November).
Key words: storm surge, extreme sea level, shelf bathymetry, Gulf of Thailand.
Citation: Tomkratoke Saifhon, Sirisup Sirod. 2020. Effects of tropical cyclone paths and shelf bathymetry on inducement of severe storm
surges in the Gulf of Thailand. Acta Oceanologica Sinica, 39(3): 90–102, doi: 10.1007/s13131-020-1558-4

1 Introduction                                                          is representative of Southeast Asia (SEA), the recent period of
    The threat of extreme sea level from storm surges to the South      severe storm surges extends back 50 years, in which only three
Asia and Southeast Asia has become an alarming issue since sev-         surge events have been recorded: Typhoon Harriet (1966),
eral disastrous events emerged in recent decades, e.g., in Bengal       Typhoon Gay (1988) and Tropical Typhoon Linda (1997). The
Bay (Cyclone BOB 01, 1991), the Andaman Sea (Cyclone Nargis,            time span of these events covers a few decades under the recent
2008) and the West Pacific (Super Typhoon Haiyan, 2013). In             climate but the shelf emerged from the last glacial period. Hence,
South Asia (SA), a six-meter storm surge induced by Cyclone             in assessing the vulnerability of the GOT-SS, we may instead
BOB 01 submerged islands and devastated low-lying areas sur-            need to rely on a relatively long period of evidence and a thor-
rounding the Meghna Estuary of Bangladesh causing more than a           ough understanding of storm surge mechanisms. From geologic
hundred thousand casualties and leaving 10 million homeless.            evidence, the washover fans in two low-energy settings on the
This colossal loss of life during the 1991 cyclone season was due       Gulf of Thailand (GOT) coast reveal that up to 19 typhoons struck
to the widespread nature of the surges. As-Salek (1998) stated          the Thai Coast within the last 8 000 years (Williams et al., 2016).
that the number of deaths caused by the BOB 01 storm surge ac-          The prehistoric typhoons in the GOT are also evident by coastal
counted for more than 95% of the total lives lost in the event. In      deposit materials such as carbonate boulders, which have been
the upper Andaman Sea, adjacent to the Bengal Bay, Cyclone              discovered on Ko Larn Island near the head of the GOT (Terry et
Nargis completely ruined Myanmar with more than a hundred               al., 2015). From this evidence, the derived sea current magnitude
thousand casualties together with the catastrophic destruction of       required to lift such carbonate boulders is in the range of 4.7 m/s
properties and ecological systems. The level of surging water in-       and 7.1 m/s. This recent work can serve as reliable evidence of a
duced by that system was approximately six meters above the             historical severe storm surge to the coastal community. Hence,
shoreline elevation. Records of the aforementioned storms indic-        the belief that we are entirely safe from storm surge hazards can
ate that one of the most critical issues that significantly contrib-    now be discarded based on this new evidence. Since the end of
utes to losses is the denial of warning information together with       the 2nd millennium, catastrophic storm surge events in SEA did
storm underestimation by the prediction system. Storm underes-          not occur, and damages from surges prior to 2013 were not
timation also contributes to ineffective storm surge evacuation. A      severe. This made the 2013 strike by Super Typhoon Haiyan in
paradigm shift is needed to enable improvements in prediction           the Philippines particularly surprising. The magnitude of the
and perception of surge-related disasters in SA. This shift has not     Haiyan storm surge had never been previously reported since the
significantly occurred due to limitations of the background con-        related agencies began documentation of storm surge disaster
ditions in conjunction with the relatively short period of archived     events, hence, the warning information was rejected, resulting in
tropical cyclone surge data.                                            massive losses.
    For the Gulf of Thailand and the Sunda Shelf (GOT-SS), which             Regarding hydrodynamic mechanisms, for SEA, the surge
*Corresponding author, E-mail: sirod.sirisup@nectec.or.th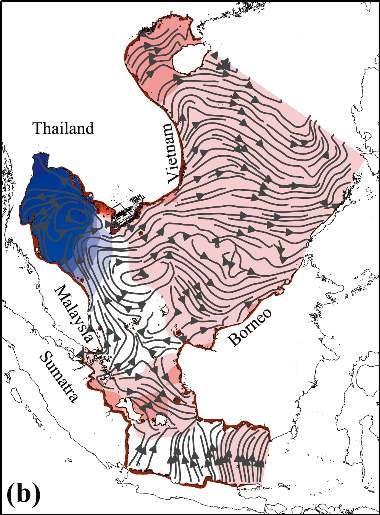
Tomkratoke Saifhon et al. Acta Oceanol. Sin., 2020, Vol. 39, No. 3, P. 90–102 91
mechanism induced by Super Typhoon Haiyan (2013) as well as while the Kalimantan Strait-Java Sea connects to the southern
other legendary cases has not been thoroughly investigated yet. entrance. A unique feature of this region is that overall, it can be
However, a few works focus on recreating the event and provid- addressed as either a wide continental shelf or a wide shallow
ing a surge map. In another region, the Bay of Bengal, vital in- coastal bay.
formation on the mechanism of widespread surges has been re- The uniqueness of oceanography is a result of such geologic-
vealed by As-Salek (1998), Flather (1994), and Debsarma (2009). al settings. A strong standing wave oscillator with a moderate en-
Their results indicate that the combination of coastal trapping ergy dissipation rate (Tomkratoke et al., 2015) is one of the
and the funnel effect can result in a widespread storm surge. Re- unique natures of the GOT. This characteristic causes the largest
cently, the nature of surge–tide interactions in the Bay of Bengal amplitude of the major tide (K1) is merely 0.67 m (Zu et al., 2008)
has been investigated (Hussain and Tajima, 2017). For the and is only found at the headend of the region (the inner GOT).
coastal area in the SEA region, this issue has not yet been further The tide is associated with modest current magnitude of approx-
investigated or affirmed. The variability in climate conditions due imately 0.40 m/s (Saramul, 2017). Besides, the spatial dynamic of
to climate change may result in considerable uncertainty in pre- semi-diurnal tides are mainly influenced by both of basin reson-
dicting a tropical cyclone (TC) in any region, especially in the ance (Tomkratoke et al., 2015). The characteristic of M2 tide near
SEA region. Hence, the awareness of storm surge impact remains the Ca Mau Peninsular in Vietnam, Kuching-Samarahan-Betong
vital and necessary for us. in Sarawak, Malaysia and as well the inner GOT are in good
Throughout the coastal communities of the world, there have agreement with such characteristic. Thus, tidal ranges in those
been significant efforts to improve both prediction systems and regions are relatively high which also suggests the important
the efficiency of mitigation plans to handle storm surge issues. In coastal shelf morphology. The significance of tide-surge interac-
doing so, an insight into storm surge dynamics for each particu- tion in the regions has not yet been completely determined in the
lar basin is vital and customarily needed. In the current study, we present. However, in overall, it tends to show a less influence on
mainly focus on the GOT. In the past few years, investigations of amplification of the storm surge as investigated by Tomkratoke et
cyclonic wind-induced storm surges that involve model develop- al. (2015). In contrary, the influence of topographic and bathy-
ment and validation are found in Kanbua et al. (2005), Phaksopa metric factors tend to be higher. To determine factors producing
and Sojisuporn (2006) and Aschariyaphotha et al. (2011). For de- severe storm surge in the GOT, influences of tides are thus sup-
termination of surge mechanisms, Vongvisessomjai (2007) has pressed in the current study.
reported that fetch length can be an important factor in the pro- For calculations in a Cartesian coordinate system, map pro-
duction of a massive surge. Recently, Sirisup and Kitamoto (2012) jection of the study area and all spatial data are transformed to
presented a normal mode structure of the GOT. The modes were the Universal Transverse Mercator (UTM) coordinate system. For
used to reproduce characteristics of the storm surge induced by creating the computational domain, the study area is subdivided
TC Linda in 1997 with reasonable accuracy. Later, Tomkratoke et into 80 000 triangular grids. The grid resolutions of approxim-
al. (2015) confirmed that modal structures and interactions ately 4 000 to 8 000 m are used for the shelf and deeper zones
between the disturbance system and propagating surge waves in while the finer resolutions of approximately 300 to 1 000 m are
the gulf can induce large positive surges. applied in the coastal regions. For representing the geometric
However, to the best of our knowledge, a comprehensive complexity of the study area well, high fidelity bathymetric data
mechanism of storm surge dynamics in coastal bay systems in- with a resolution of 30 s from GEBCO (General Bathymetric Chart
cluding the influence of cyclonic wind characteristics, the funnel of the Oceans) is used (IOC-IHO, 2003). The computational do-
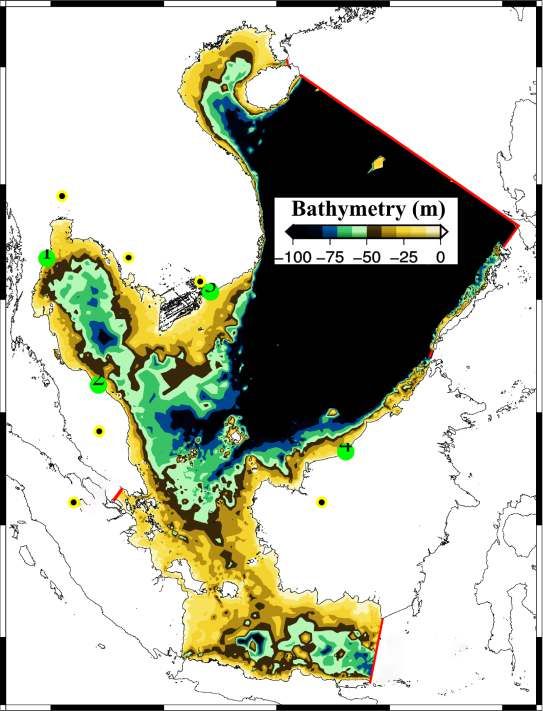
effect and mean sea level, has not been fully investigated. Espe- main covers an area of approximately 880 000 km 2 (Fig. 1a).
cially for the GOT, a comprehensive mechanism of storm surges
has not yet been determined, which reduces the accuracy of 2.1.2 Model configurations
storm surge predictions and risk assessment systems for the re- The ocean hydrodynamic model used in this study, FVCOM,
gion. The current study aims to address these issues. The invest- was developed originally by Chen et al. (2003) and upgraded by
igations are performed with numerical experiments using the fi- the University of Massachusetts-Dartmouth/Woods Hole Ocean-
nite-volume coastal ocean model (FVCOM) (Chen et al., 2003) ographic Institution (UMASS-D/WHOI) model development
together with atmospheric perturbation forcing data based on a team (Chen et al., 2006). The advantages of FVCOM for coastal
parametric wind model (Holland, 1980). and ocean applications include the model’s use of an unstruc-
The remainder of the paper is organized as follows: Section 2 tured triangular mesh to subdivide the horizontal computational
presents the methodology, the results and discussion are presen- domain. In the vertical computational domain, the σ coordinate
ted in Section 3, and our conclusions are in Section 4. transformation is applied to obtain a smooth representation of
the irregular bottom topography. Thus, the geometric complex-
2 Methodology ity of the shoreline and seabed is preserved. Importantly, the
primitive equations of the model can be switched to Cartesian or
2.1 Study area and model configurations spherical coordinate systems. Further, optional turbulence clos-
ure schemes, e.g., Smagorinsky, modified Mellor and Yamada
2.1.1 Study area level 2.5 (MY-2.5), and k-ε turbulence closure schemes, are
The location, configuration of coastlines and seabed topo- provided for a mathematically closed form of the primitive equa-
graphy of the GOT are shown in Fig. 1a. We refer to the GOT as a tions. FVCOM solves the underlying equations by using a flux cal-
sub-basin of the South China Sea (SCS) known as the Sunda Shelf culation integrated over each model grid control volume with a
(SS). The GOT includes sea territories of Thailand, Cambodia, Vi- mode-splitting method for external and internal mode time steps
etnam, Malaysia and China. Its location is from 1.33ºN to 14.00ºN to accommodate faster and slower barotropic and baroclinic re-
and 99.00ºE to 112.00ºE. The GOT is a broad and shallow sea with sponses. These model characteristics allow accurate and effi-
52.0 m average depth. A much deeper sea with 2 000.0 m average cient resolution of the underlying physical mechanism associ-
depth (the SCS) connects to the eastern entrance of the GOT ated with the resonance of long waves and other wave-related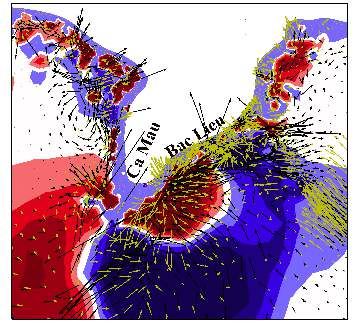
92 Tomkratoke Saifhon et al. Acta Oceanol. Sin., 2020, Vol. 39, No. 3, P. 90–102
100° 105° 110° 115° 120°E
a b
1: Koh Lak Thailand Durian (2006)
20°
2: Geting 2)
(195
3: Vangtau
Cambodia Vae
4: Bintulu
OP Ga Vietnam TC1_OSM
B y (19 Linda
89) (19 )
97) (1970 TC2_ENE
Ruth
15° Thailand Sonamu (2013)
Harr
iet ( 7 2 )
1962 9
Bathymetry/m ) Sally (1 TC3_MNE
Cambodia
Malaysia TC4_LNE
1 100 75 50 25 0
Vietnam
10° 3 Vamei (2001)
Sumatra Borneo
S
SC
GO
T
2
c
M
5°
ala
Thailand
ys
ia
4
10
Cambodia
10 2
B
Vietnam 12
OP
22 14
1
N 14
Borneo
14
20
0°
16
18 16
S 26
18
20
24
22
16
12
14
Malaysia Linda (1997)
5°
OPB
Sumatra Borneo
Fig. 1. Study area, bathymetry (color shaded). Blue circles represent tide station locations with names listed on the upper left corner.
OPBs indicate open boundary locations (a), historical tropical cyclone tracks in the Gulf of Thailand during the last decades and the
scenario storm paths (b), example of wind field for TC Linda (1997) generated from Holland’s Model (c).
hydrodynamic mechanisms. A more detailed description of the cessary. Unfortunately, measurements are usually unavailable.
FVCOM code can be found in Chen et al. (2003). Reanalysis climate data may be recommended as an alternative
Characterization of extreme sea levels only generated by a resource for storm surge studies. However, such data can indeed
cyclonic disturbance is the primary objective of the current study. reconstruct well for ambient wind surrounding the TC cell but
Hence, other contributions such as tides and seasonal mean sea the wind speeds near the cyclone center are normally lower than
levels are disregarded. The model configuration for this purpose actual values (Cavaleri and Sclavo, 2006; Signell et al., 2005). This
is as follows: the radiative boundary type is applied at open limitation may significantly suppress reconstructing storm surge
boundaries of the domain (Fig. 1a), e.g., sea surface dynamic behaviors especially near TC landfall areas, particularly
√elevation is
calculated using a gravity wave propagation speed, gh , where h for small TCs. Although improving TC wind field from hindcast
is the water depth; the parameter for the effect of the bottom drag datasets is possible as proposed by Pan et al. (2016), however, us-
coefficient is set to follow a log model with the lowest value of ing such data in scenarios based study related to the TC transla-
0.004; the zero free surface water elevation and sea current velo- tion paths can be rather unsuitable. In the present study, be-
cities are the model initial conditions. The simulation will be per- cause the effect of the TC paths on the development of storm
formed within the time length of 120 h. To ensure that the model surges is our primary objective, thus, a more suitable approach
stability, the temporal resolution of 1 second is applied. The driv- should be applied. To this end, a parametric wind model such as
ing force is cyclonic disturbances generated by a parametric wind Holland’s model (1980) can be used to provide tropical cyclone
model, the details of which are described next. wind data. The results from this parametric wind model are used
to drive the ocean hydrodynamic model. From Holland’s model,
2.1.3 Driving force the radial velocity (VR) distributed from the storm center can be
The interaction between cyclonic wind and the ocean creates expressed as:
wind stress on the sea surface that is controlled by the strength of
v [ (
the wind. This wind stress generates most of the tropical cyclone- u
u B (Pa − Pc ) ( RMW )B )B ]
t RMW R f Rf
induced surges (Kohno, 2007). Thus, the inverted barometer ef- VR = exp − + − ,
ρ R R
fect can be excluded. However, to accurately simulate the dy-
namic behavior of storm surges, appropriate TC wind data is ne- (1)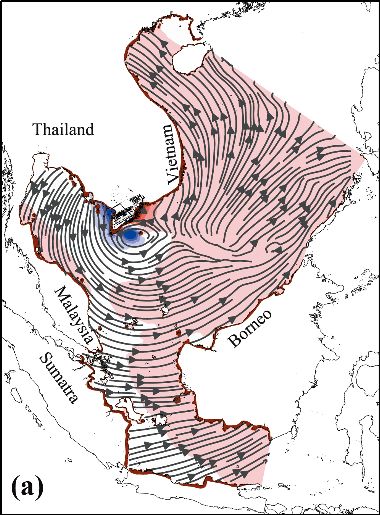
Tomkratoke Saifhon et al. Acta Oceanol. Sin., 2020, Vol. 39, No. 3, P. 90–102 93
where Pa is the ambient pressure, Pc is the central pressure, B is 2.2.2 Mean sea level conditions
the hurricane shape parameter which can be calculated from Theoretically, amplification of storm surges in shallow con-
Pc − 900 tinental shelves is influenced by shelf bathymetry. This amplific-
B=− but is only valid for 1 ≤ B ≤ 2.5, RMW is the
160 ation occurs as the storm surge waves propagate in the decreas-
radius of maximum wind speed, R is the radial distance from the
ing shelf depths. This mechanism has been confirmed by Hors-
center of the storm, f is the Coriolis parameter, and ρ is the air
burgh and Wilson (2007) with their finding that a reduction in
density. To determine the Holland’s model parameters, the trop- surge magnitude occurred at the moment of high water.
ical cyclone data from Digital Typhoon (Digital Typhoon, 2016) Moreover, Rego and Li (2010) found that peak water levels were
have been applied. An example wind field of the considered trop- lower than expected for a landfall at high tide. Their results em-
ical cyclone event (Linda, 1997) generated by this model is phasize that large surges can be intensified more over shallow
presented in Fig. 1c. continental shelves than over deep continental shelves. These
To incorporate the wind field in the FVCOM, the surface wind findings can be directly applied to the GOT-SS, however, an in-
stress must be calculated. The surface wind stress is computed as teresting question is how the scenario changes with sea level
follows: variability. To clarify this issue, we perform numerical experi-
ments under different mean sea level conditions in which the
( ) √ ( ) mean sea level varies in the range of +2.0 to –2.0 m from the
τsx , τsy = Cds ρa Wx + Wy Wx , Wy , (2)
baseline. The interpretation of these results should be helpful to
those concerned with how storm surges respond to sea level vari-
where (Wx ,Wy ) are the x and y components of the wind velocity, ability.
and ρa is the air density. The sea surface drag coefficient, Cds, de-
√
pends on the wind speed, W= Wx + Wy , and takes the form of: 3 Results and discussion
{ 3.1 Model validation
1 × 10⁻³ , for W ⩽ 7 m/s To ensure the hydrodynamic and tropical cyclone models
Cds = (0.192 3 + 0.115 4W) × 10−3 , for 7 ⩽ W ⩽ 20 m/s
2.5 × 10⁻³ , for W ⩾ 20 m/s used in the present study are accurate and the resulting insights
(3) on physical mechanisms are reasonable interpretations, a model
validation needs to be performed. Here, the characteristics of ex-
treme sea level caused by TC Linda (1997) are reproduced using
2.2 Scenario-based simulations the FVCOM (Fig. 2). These results are validated against the obser-
vation sea levels retrieved from the University of Hawaii Sea Level
2.2.1 Storm paths Center (uhslc.soest.hawaii.edu). Specifically, the recorded data
According to the statistical data from Digital Typhoon (Digit- for Koh Lak (Thailand), Vung Tau station (Vietnam) and two ad-
al Typhoon, 2016), it is known that the intensification of TCs in ditional stations in Malaysia are selected for validation purposes
the Western Pacific is associated with the occurrence of mon- and for completeness in interpreting the overall physical mech-
soon troughs (MT). The close relationship between TC activity anism. The locations of these stations are presented in Fig. 1a. It
and MT location in this region was revealed by Wu et al. (2012) is noted that the storm surge level at each station is a departure
and Takahashi et al. (2015). Moreover, Lander (1996) stated that from the typical tide and seasonal water levels.
the average location of the monsoon trough in the area shows a As shown in Fig. 2, the surge magnitude and fluctuation pat-
seasonal response. This enables us to estimate the major charac- terns of the storm surges are in good agreement with the observa-
tions. The current model captures the negative surge and posit-
teristics of TCs under constrained climatic circulation. Guided by
ive surge of TC Linda (1997) in the GOT and the adjacent shelf
variation in the monsoon trough locations over the GOT-SS, the
with reasonable accuracy. However, the simulation tends to un-
translation path of TCs may be estimated. The present study ap-
derestimate positive surges at the Koh Lak and Geting stations
plies this path estimation approach to approximate four storm
(Fig. 2, a and b). In Fig. 2, c and d, the observed sea water levels at
paths derived from dominant troughs over the GOT (Fig. 1b). As
the Vung Tau and Bintulu stations show significant effects of
seen in Fig. 1b, the two upper paths (denoted by TC1_OSM and
wind setup (rising period of the maximum surge level) and the
TC2_ENE) are representative of a monsoon trough that occurs
model result produces good agreement with both the trends and
during the onset and early northeastern monsoon season, i.e.,
fluctuation periods. Nevertheless, the overestimation of surge
October and November, respectively. The distance between magnitude is obvious.
these two paths is approximately 250 km. The difference between observed and modeled results at
In the context of storm surge hazards, effects of TCs de- these two stations indicates that the use of a parametric wind
veloped by equatorward movement of MT have not yet explored model for simulating a storm surge dominated by wind setup
in the GOT-SS, therefore, the other two paths such as TC3_MNE needs more precise information on storm characteristics.
and TC4_LNE are included in the current study. The TC3_MNE Moreover, the amplification processes of storm surges in real
path is associated with the period of mid northeastern monsoon situations can be far more complicated than this model’s capab-
(December) where the MT band normally passing over the end of ility. These types of discrepancies are typically found with simu-
Southern Thailand. The TC4_LNE path supports the scenarios lations near coastal bays where the amplification of long waves
that the MT band become predominated over Malaysia (January- can be intensified by shallow water effects together with local bed
February). These paths are shifted southward, 250 (TC3_MNE) friction; hence, simulation typically produces underestimation or
and 500 (TC4_LNE) kilometers from the location of the TC2_ENE overestimation when local seabed topography is treated as re-
path, respectively. Additionally, the intensity of all the modeled gional. Furthermore, compared with the earlier study by Phak-
storm is 37 m/s (category one on the Saffir-Simpson scale) with a sopa and Sojisuporn (2006), predictions by the current simula-
translation speed of 21 km/h until landfall. tion are significantly improved based on the reproduction of the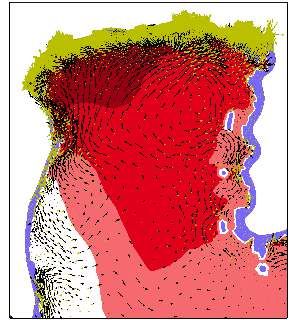
94 Tomkratoke Saifhon et al. Acta Oceanol. Sin., 2020, Vol. 39, No. 3, P. 90–102
Station: Koh Lak Station: Geting
0.6 0.6
0.4 a 0.4 b
Storm surge magnitude/m
Storm surge magnitude/m
0.2 0.2
0 0
-0.2 -0.2
-0.4 -0.4
-0.6 -0.6
observation observation
-0.8 simulation -0.8 simulation
-1.0 -1.0
-1.2 -1.2
00:00 12:00 00:00 12:00 00:00 12:00 00:00 12:00
1997-11-1 1997-11-2 1997-11-4 1997-11-5 1997-11-1 1997-11-2 1997-11-4 1997-11-5
Time Time
Station: Vung Tau Station: Bintulu
0.6 0.6
0.4 c 0.4 d
Storm surge magnitude/m
Storm surge magnitude/m
0.2 0.2
0 0
-0.2 -0.2
-0.4 -0.4
-0.6 -0.6
observation observation
-0.8 -0.8
simulation simulation
-1.0 -1.0
-1.2 -1.2
00:00 12:00 00:00 12:00 00:00 12:00 00:00 12:00
1997-11-1 1997-11-2 1997-11-4 1997-11-5 1997-11-1 1997-11-2 1997-11-4 1997-11-5
Time Time
Fig. 2. Measured and simulated storm surge levels for each station: a. Koh Lak, Thailand; b. Geting, Malaysia; c. Vung Tau station
Vietnam and d. Bintulu, Malaysia.
TC Linda (1997) storm surge. Therefore, based on the current such contributions can be seen at the Vung Tau and Bintulu sta-
simulation results, the underlying mechanism of the storm surge tions. Note that the surge pattern at these stations shows abrupt
induced by TC Linda (1997) can now be accurately characterized. changes in sea level instead of gradual changes such as in the
Further details are discussed next. mirrored N-shaped surge at the Koh Lak station (Fig. 2a). Hence,
Undulation of the sea surface and circulation patterns during wind setup appears to be the dominant factor for this phenomen-
the passage of TC Linda (1997) over the GOT-SS are shown in Fig. 3. on. This issue will be investigated and confirmed in future work.
During the period of the negative surge (Figs 3a and b), the TC
(with 50 kn intensity) is located approximately 450 km off the 3.2 Influence of the storm path
Surat Thani coast, Thailand. The system induces a large undula- A funnel effect is considered here because the triangular
tion of the sea surface with a negative surge covering the middle shape of the bay can confine the concentration of surge energy.
to upper north area of the gulf. The water current pattern in- This issue was pioneered by Proudman (1955) who stated that
duced by TC Linda (1997) is characterized by a large counter- the convergence at coastlines could lead to surge amplification.
clockwise rotation flow cell located near the northern part of the Topographic influences on amplification of a surge in the GOT
gulf (Fig. 3a). Interacting with beaches and seabed topography, have never been accounted for in the development of a surge
the structure of the rotating cell is better developed in a larger cell mitigation scheme. Overlooking this mechanism may reduce the
surrounded by stronger currents. This rotating flow also causes efficiency of storm surge hazard management. In this section, the
the water mass to move away from the GOT into the vicinity of significance of topographic influences on storm surge amplifica-
the TC, thereby depressing the surge amplitude or the tion along the Thai coast is presented. The funnel effect can be
negative/ebb surge phase (Fig. 3b). The current study also shows seen as clusters of large positive surges located at the coastal con-
that influence of the typhoon on the oceanic processes in the vergences of Thailand, Cambodia and Vietnam (Figs 4a and b).
GOT even when the storm intensity weakens to a depression sys- However, surge height differences in each particular area are sig-
tem. In contrast, during the period of the positive surge (Figs 3c nificantly related to the characteristics of the TC path and will be
and d), the rebounding water mass occurs 12 h after the tropical fully described next.
cyclone reaches the southern coast of Thailand (approximately
159 hours after 29/10/1997 00:00:00 UTC). 3.2.1 TC1_OSM path
The characteristic mirrored N-shaped surge pattern (negat- In this scenario, the TC path crosses the Vietnam coast before
ive followed by positive) can be seen in Figs 2a and b. Conform- making a second landfall in Prachuap Khiri Khan, Thailand (Fig. 4a).
ing to the fundamental mode structure of the gulf (Sirisup and This track is almost the same as TC Linda’s (1997). The path dir-
Kitamoto, 2012) in the period of approximately 58 h, the induced ection of TC1_OSM and TC Linda is nearly perpendicular to the
storm surge can properly fit into the gulf geometry and develop a western Thai coast. Long stretching beaches mostly characterize
single nodal band at the shelf entrance (Figs 3b and d). However, the landfall location in this scenario, and two convergent coast-
other contributions, especially wind setup and topographic amp- lines, the inner GOT and the Ban Don Bay, are situated above
lification effects, have not yet been clarified. The importance of and below the landfall location, respectively. As the storm ap-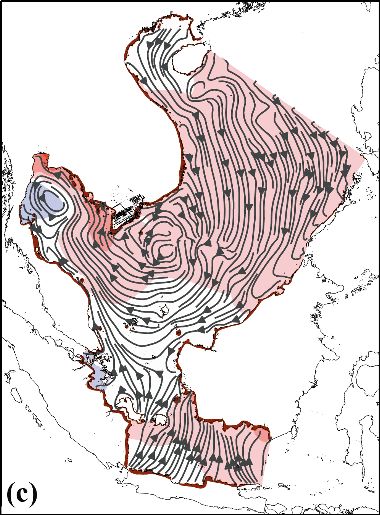
Tomkratoke Saifhon et al. Acta Oceanol. Sin., 2020, Vol. 39, No. 3, P. 90–102                                 95

                 a                                                                b

                                          Vietnam

                                                                                                               nam
                      Thailand                                                         Thailand

                                                                                                           Viet
                                                                                          Ma
                       Ma

                                                                                            lay
                         lay

                                                                                                                            o
                                                          eo                                                            rne

                                                                                               sia
                            sia

                                                      rn                                                              Bo
                                                    Bo
                        Su

                                                                                        Su
                          m

                                                                                           m
                           at

                                                                                            at
                                ra

                                                                                               ra
                                                         -0.8 -0.6 -0.4 -0.2    0   0.2        0.4   0.6   0.8
                                                                       Surge/m (aMSL)

                 c                                                                d
                                         Vietnam

                                                                                                            Vietnam
                     Thailand                                                         Thailand
                                                                                         Ma
                        Ma

                                                                                            la
                           la

                                                                                            ysi

                                                                                                                           o
                            ysi

                                                      rn
                                                          eo                                                            rne
                                                                                               a

                                                                                                                      Bo
                               a

                                                    Bo
                                                                                        Su
                        Su

                                                                                           m
                           m

                                                                                            at
                            at

                                                                                               ra
                                ra

                                                         -0.8 -0.6 -0.4 -0.2    0   0.2        0.4   0.6   0.8
                                                                       Surge/m (aMSL)

Fig. 3. Characteristics of sea surface and circulation during the passage of TC Linda (1997). The storm crossed the tip of Ca Mau (a)
located approximately 450 km off Surat Thani, Thailand; negative surge (b); landfall (c); positive surge period (d) the storm moved
inland.

proaches the coast, the wind front induces asymmetric sea levels               ences convergence at the coastlines, is also significant here. More
at the landfall position (Fig. 5a, red and green curves). Figure 5             precisely, the confined surge contour appears in particular areas
also presents surge levels from various mean sea level conditions.             of the Thai coast, i.e., Phetchaburi to Samut Prakan and Laem
In this section, we mainly consider the storm surge result in rela-            Ngop Bay. Similar confined surge contours are also found in
tion to the baseline mean sea level. The results associated with               Kampot, Cambodia and western Ca Mau, Vietnam. Furthermore,
other mean sea level conditions are interpreted in the next section.           the mirrored N-shaped surge is also found in fluctuation of storm
    In this scenario, the swelling sea level intensifies on the ap-            surge at the landfall location (Fig. 5). It suggests that seiche oscil-
proaching wind front (AWF) yielding the largest surge on the                   lation is inductive mechanism for development of the storm
western coast of the inner GOT. In contrast, the lowered sea level             surge. The maximum positive surge should be explained as the
occurs on the retreating wind front (RWF). This is due to the wa-              coincidence of rebounding water mass from the nearby region
ter mass being pushed away from the coast into the sea resulting               and wind setup.
in a relatively low positive surge region near the landfall location.
This asymmetric surge characteristic is found in all scenarios.                3.2.2 TC2_ENE path
The funnel effect, where the wind-driven water mass experi-                        In this scenario, the TC path makes landfall in southern Thail-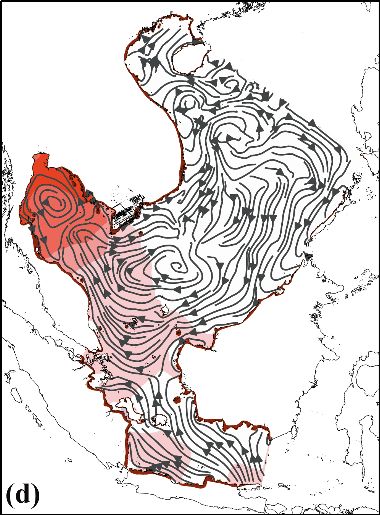
96 Tomkratoke Saifhon et al. Acta Oceanol. Sin., 2020, Vol. 39, No. 3, P. 90–102
a Thailand SP-Samut Prakan b Thailand SP-Samut Prakan
SP SR-Surat Thani SP SR-Surat Thani
Vietnam
KG-Kien Giang
Vietnam
KG-Kien Giang
BL-Bac Lieu BL-Bac Lieu
BT-Betong BT-Betong
TC1_OSM
Gu
KG KG
lf o
Gu
fT
lf o
BL BL TC2_ENE
ha
ea
fT
SR SR
aS
ila
ha
hin
nd
ila
C ea
uth
n
aS
d
So hin
ut hC
So
M
M
ala
ala
ys
y sia
ia
BT BT
c Thailand SP-Samut Prakan d Thailand SP-Samut Prakan
SP SR-Surat Thani SP SR-Surat Thani
Vietnam
KG-Kien Giang
Vietnam
KG-Kien Giang
BL-Bac Lieu BL-Bac Lieu
BT-Betong BT-Betong
KG KG
Gu
Gu
lf
lf
of
BL ea BL
of
aS a
Th
SR SR Se
Th
in
ina
ail
Ch
ail
Ch
an
uth
an
th
d
So
d
u
So
E
TC3_MN
TC4_LNE
M
M
ala
ala
ys
ys
ia
ia
BT BT
0 1 2 3 4 5 6
Surge/m (aMSL)
Fig. 4. Maximum storm surge magnitudes above mean sea level (aMSL) for the hypothetical TC paths. SP, SR, KG, BL and BT
represent the probe locations with names listed on the upper edge.
and. The orientation of the coast relative to the storm direction is ated with the path length to support the effective times for inter-
similar to that in the previous scenario but with a shorter dis- active process between the TC and sea body. Suggested by Figs 5a
tance to the southern coastal convergence (Ban Don Bay, Surat and 5b, the mechanism explaining development of the positive
Thani) (Fig. 4b). The predominance of the funnel effect is clearly surge is the same as that of the TC1_OSM path.
seen. In this scenario, larger and smaller surge magnitudes are Interestingly, the amplification of surge magnitude also ap-
observed inside the bay and the inner GOT, respectively. In the pears at a weaker coastal convergence on the eastern coast of Ca
area with high amplification, Ban Don Bay, water-trapping mor- Mau (Bac Lieu), Vietnam (Fig. 4b). Moreover, the surge level is
phologic structures cause the wind-driven water mass in the re- relatively high (Fig. 7c). To explain the governed mechanism, an-
treating wind front to be trapped. As a result, more water mass other factor, coastline crossing angle, is considered. In this case,
accumulates inside the bay (Fig. 4b). For this path, the fluctu- although the TC does not cross the Vietnamese coast directly, it is
ation of the storm surge at the landfall position is also character- quite close. The translation path of the TC is approximately 40
ized by asymmetric sea level (Fig. 5b, red and green curves). The degrees (measured from the storm path to the coastline in the
maximum storm surge level (approximately 2 meters) seem to be counterclockwise direction) to the eastern coast of Ca Mau.
closed to that of the upper path (TC1_OSM), however, the dura- Hence, the crossing angle is relatively small compared to those of
tion of the positive period is longer. Indeed, this finding is associ- the other tracks. This may be the marginal angle for supporting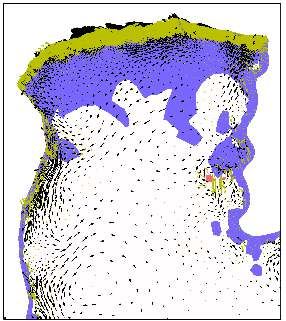
Tomkratoke Saifhon et al. Acta Oceanol. Sin., 2020, Vol. 39, No. 3, P. 90–102 97
3 3
a b
2 2
1 1
Water level (aMSL)/m
Water level (aMSL)/m
0 0
AWF, baseline AWF, baseline
-1 RWF, baseline -1 RWF, baseline
AWF, -1.0 m AWF, -1.0 m
RWF, -1.0 m RWF, -1.0 m
-2 AWF, -2.0 m -2 AWF, -2.0 m
RWF, -2.0 m RWF, -2.0 m
AWF, +2.0 m AWF, +2.0 m
-3 AWF, +2.0 m -3 AWF, +2.0 m
landfall time TC1_OSM landfall time TC2_ENE
-4 -4
0 10 20 30 40 50 60 70 80 90 0 10 20 30 40 50 60 70 80 90
Time/h Time/h
3 3
c d
2 2
1 1
Water level (aMSL)/m
Water level (aMSL)/m
0 0
AWF, baseline AWF, baseline
-1 RWF, baseline -1 RWF, baseline
AWF, -1.0 m AWF, -1.0 m
RWF, -1.0 m RWF, -1.0 m
-2 AWF, -2.0 m -2 AWF, -2.0 m
RWF, -2.0 m RWF, -2.0 m
AWF, +2.0 m AWF, +2.0 m
-3 AWF, +2.0 m -3 AWF, +2.0 m
landfall time TC3_MNE landfall time TC4_LNE
-4 -4
0 10 20 30 40 50 60 70 80 90 0 10 20 30 40 50 60 70 80 90
Time/h Time/h
Fig. 5. Asymmetric sea levels occurred near landfall locations. Red and blue dash lines represent approaching and the retreating wind
front (AWF and RWF). Red dash line indicates the landfall time for each scenario.
effective wind-driven water mass (induced by the approaching er scenarios.
wind front) build up at the coast. According to As-Salek (1998) However, a widespread surge in the inner GOT still occurs
and Jelesnianski (1965), cyclones with a small angle of crossing with modest magnitudes. This result raises the question: when
can produce widespread surges in the coastal area while a larger the contributions of topographic mechanisms become less pro-
angle can reduce the energy input and the velocity of the cyclone’ nounced, what other significant mechanisms can help explain
s translation along the coast. the result characteristics adequately? Following the distribution
of sea levels (Fig. 4c) from this TC, the storm surge indeed
3.2.3 TC3_MNE path propagates along the North-South axis of the gulf instead of fol-
In this scenario, the approaching TC also makes landfall near lowing along the coastline as an edge wave would. This is similar
a weaker coastal convergence (Pattani Bay) (Fig. 4c). The cross- to the mechanism that describes the TC Linda (1997) surge
ing angle of the path is larger than those in other scenarios (ap- presented earlier. Indeed, this appears to be governed by a seiche
proximately 140 degrees measured from the TC path to the oscillation.
Songkla-Pattani coastline). The storm surges at the landfall loca-
tion of this path are shown in Fig. 5c. In comparison, the maxim- 3.2.4 TC4_LNE path
um positive surge influenced by the characteristic of the path and Sensitivity to the funnel effect and crossing angle is observed
coastal topography is slightly different from those of the two up- again in this scenario (Fig. 4d). The first factor is intensified most
per paths. On the contrary, the period of high surge level (ap- in the Samarahan-Betong region of Sarawak, Malaysia because of
proximately 2 meters) is significantly longer. Unlike TC1_OSM its triangular-shaped bay. A cluster of large storm surges is found
and TC2_ENE paths, the development of the maximum positive in the inner bay.
surge mainly shows the hydrodynamic response proportional to The comparison of the storm surge from different landfall loc-
the wind strength. This confirms the effects of wind setup as de- ations dominated by the AWF effect is beneficial for going insight
scribed previously in the validation section. Interestingly, the re- the latter factor. We mention on the development of the storm
duction of ebb surge shows a lesser contribution of the RWF than surge along the eastern coast of Ca Mau in Vietnam again. It is
the other cases (Fig. 5). We speculate that the convex-shaped noted that the approaching TC and the coastline of such region
coastline (Terengganu coastline in Malaysia) may reduce the make a small crossing angle of 40º. This lead to a more effective-
strength of retreating sea current to push the water mass away ness of the AWF to produce large positive surge level. On the con-
from the coast leading to a lower ebb surge magnitude at the trary, the TC4_LNE makes landfall at the southern Terengganu
landfall location although the wind strength is similar to the oth- coastline and is associated with 100º of the crossing angle. There-
98                                                          Tomkratoke Saifhon et al. Acta Oceanol. Sin., 2020, Vol. 39, No. 3, P. 90–102

fore, at the landfall location, significant decrement of the maxim-                                  al TC scenarios. All the hypothetical TC paths make landfall coin-
um positive surge by increment of the crossing angle is instead                                      cidently with a positive surge phase. However, the induced
obtained (Fig. 5d).                                                                                  surges tend to increase as the landfall and peak times become
    Though the path of TC3_MNE and TC4_LNE is parallel, their                                        closed. This behavior coincides with the interactions of the storm
crossing angle associated with the AWF can be different by the                                       wind for propagating surge waves. Further, such processes to-
coastline configuration. Therefore, the former is the largest cross-                                 gether with topographic influences can potentially lead to high
ing angle scenarios as it approaching the southern Thailand as                                       positive surge magnitudes. Note that the baseline is only inter-
mentioned earlier. Indeed, significantly smaller crossing angle                                      preted in this section.
characterizes the characteristic of the latter. The effect of cross-                                     According to storm surge characteristic (Fig. 6) and the posi-
ing angle still valid for explaining development of the max posit-                                   tion of the inner GOT location (Fig. 1), it is seen that the closer
ive surge for them, however, the contamination from the coastal                                      paths (TC1_OSM and TC2_ENE) induce the signature of
convergence effect could also explain the different of the ampli-                                    mirrored N-shaped surge. On the contrary, the farther paths
fication.                                                                                            (TC3_MNE and TC4_LNE) mostly show a typical positive surge or
    For these TCs, the mechanisms governing the asymmetric sea                                       flood surge. Besides, an increase/decrease in surge magnitude is
level are mainly the effect of AWF and RWF. However, it is seen                                      found in the scenarios where TC paths are closer/farther from
that the ebb surge (RWF contribution) at the landfall location for                                   the inner GOT coast. However, as seen in Figs 6b and c, one of
the TC4_LNE tends to be more pronounced. On speculating the                                          the mechanisms found here is that for a TC being far from the in-
mechanism behind this phenomenon, the lesser effect of the                                           ner GOT coast such as TC3_MNE can produce a surge that is as
coastline shape to obstruct the RWF contribution should be ad-                                       high as surges from that of the closer one (TC2_ENE, for ex-
dressed. Furthermore, as compared to the two upper paths, this                                       ample). This result can be explained by the interaction of the TC
scenario tends to increase the widespread surge over the GOT                                         with the negative surge phase such found in the TC2_ENE case.
but with modest magnitude. Thus, under this scenario, the GOT                                        In contrast, a higher surge can occur as the advancing TC coin-
coastal impacts such as damaging surge height may be reduced.                                        cides with positive surges as found in the TC3_MNE case.
                                                                                                         According to Tomkratoke et al. (2015), a TC that is coincident
3.3 Phase propagation                                                                                with a positive surge period (e.g. a time period that surge level is
   In Fig. 6, the characteristics of storm surges near the inner                                     above mean sea level) can enhance the storm surge response
GOT (Samut Prakan) are presented as induced by the hypothetic-                                       magnitude. In contrast, lower enhancement occurs during a neg-

                                      a                                                                                                    b
                                           baseline                                                                                                 baseline
                             4             -1.0 m                                                                                 4                 -1.0 m
                                           -2.0 m                                                                                                   -2.0 m
                                           +2.0 m                                                                                                   +2.0 m
      Water level (aMSL)/m

                                                                                                           Water level (aMSL)/m

                             2             landfall time                                                                          2                 landfall time

                             0                                                                                                    0

                             -2                                                                                                   -2

                             -4                                                                                                   -4
                                                                                      TC1_OSM                                                                                             TC2_ENE

                                  0       10    20     30     40    50     60    70     80      90                                     0       10        20     30   40    50   60   70     80      90
                                                               Time/h                                                                                                 Time/h

                                      c                                                                                                    d
                                           baseline                                                                                             baseline
                             4             -1.0 m                                                                                 4             -1.0 m
                                           -2.0 m                                                                                               -2.0 m
                                           +2.0 m                                                                                               +2.0 m
      Water level (aMSL)/m

                                                                                                     Water level (aMSL)/m

                             2             landfall time                                                                          2             landfall time

                             0                                                                                                    0

                             -2                                                                                             -2

                             -4                                                                                             -4
                                                                                      TC3_MNE                                                                                             TC4_LNE

                                  0       10    20     30     40    50     60    70     80      90                                     0       10       20     30    40    50   60   70    80    90
                                                               Time/h                                                                                                  Time/h

Fig. 6. Variation of sea levels in the inner GOT (Samut Prakan) influenced by hypothetical tropical cyclones and mean sea level (MSL)
conditions. Dash line indicates the TCs landfall time for each scenario.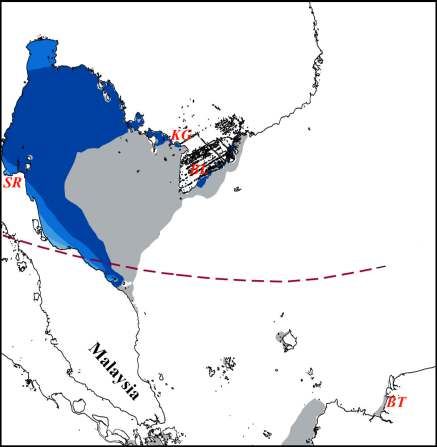
Tomkratoke Saifhon et al. Acta Oceanol. Sin., 2020, Vol. 39, No. 3, P. 90–102 99
ative surge period (e.g. a time period that surge level is below but significant effects of shelf bathymetry are observed. It is
mean sea level) even when the storm intensity increases. The be- found that the storm surge magnitude tends to increase during
havior of TCs coincident with positive surge periods may support low water conditions. In contrast, surge response is less during
the development of a severe surge in the GOT-SS. This can help high water conditions. Consequently, the sensitivity of storm
in assessments of rising coastal sea levels in the inner GOT dur- surge to the shelf bathymetry is higher nearshore than offshore
ing remote disturbances. Precise determination of landfall loca- region. For this reason, specific coastal regions, i.e., the inner
tion and phase propagation of storm surge waves would signific- GOT: Samut Prakan and Surat Thani, Kien Giang and Bac Lie, Vi-
antly benefit efforts in preparation and prediction of storm surges etnam and Betong, Malaysia, can potentially produce high surge
in this region. magnitudes. Furthermore, the surge behavior in these regions
tends to relate to the funnel effect. As a result, the storm surge in
3.4 Effects of mean sea level conditions the nearshore areas can be intensified by shelf bathymetry and
In this section, the influence of shelf bathymetry on storm funnel effects while surges in the offshore areas may be signific-
surge responses in the GOT-SS is presented. The impacts of antly influenced by seiche oscillation. Next, more details on the
storm paths are retained in the simulations, and various scenari- issue are presented.
os of mean sea level are applied to investigate their effects. To de-
termine the magnitude of mean sea level variability, various con- 3.4.1 Seiche mode
tributing sources including tides, seasonal variation and projec- In Fig. 5–7, a time series of storm surges obtained in the GOT-
ted sea level are considered. These sources can cause fluctuation SS are interpreted. The overall mechanism and unique charac-
in mean sea level in the gulf with amplitudes of 1.5, 0.2 and 0.3 m, teristic of storm surge propagation associated with storm paths
respectively. Hence, a range of variability of 2.0 m above the for the baseline case have been discussed in Section 3.2 and 3.3.
present mean sea level can be reasonably used. Testing of the In this section, we mainly focus on the influence of mean sea
sensitivity of mean sea level in a real domain using hypothetical level on the seiche mode of the storm surges.
TC paths base on the variation of MT, our simulation should re- It is found that time to peak for storm surges or seiches is
veal the surge-sea level variation interaction for storm surges in delayed or accelerated as the mean sea levels vary. The case rep-
this region and address concerns of storm surge sea level-de- resenting this result is mainly associated with the TC3_MNE
pendent problems for the affected communities. path. At the landfall location, the peak period of the positive
Overall, the behaviors found in the previous section persist surge can be deferred from that of the baseline as the mean sea
5 5
a Kien Giang, Vietnam b Surat Thani, Thailand
baseline baseline
4 -1.0 m 4 -1.0 m
-2.0 m -2.0 m
3 +2.0 m 3 +2.0 m
Water level (aMSL)/m
Water level (aMSL)/m
landfall time landfall time
2 2
1 1
0 0
-1 -1
TC1_OSM TC2_ENE
-2 -2
0 10 20 30 40 50 60 70 80 90 0 10 20 30 40 50 60 70 80 90
Time/h Time/h
5 5
c d
baseline Bac Lieu, Vietnam baseline Betong, Malaysia
4 -1.0 m 4 -1.0 m
-2.0 m -2.0 m
3 +2.0 m 3 +2.0 m
Water level (aMSL)/m
Water level (aMSL)/m
landfall time landfall time
2 2
1 1
0 0
-1 -1
TC3_MNE TC4_LNE
-2 -2
0 10 20 30 40 50 60 70 80 90 0 10 20 30 40 50 60 70 80 90
Time/h Time/h
Fig. 7. Intensification of storm surges in some particular regions influenced by hypothetical tropical cyclones and mean sea level
(MSL) conditions. Dash line indicates the time when storms make the shortest distance from the coast.100 Tomkratoke Saifhon et al. Acta Oceanol. Sin., 2020, Vol. 39, No. 3, P. 90–102
LCW
level becomes shallower (Fig. 5c, black dots, solid curve). At the surges which can be illustrated as (Pugh, 1987): η ∝ .
H
inner GOT where the topographic factor is lesser, such behavior Where η is the surge height, L is the shelf width, H is the total wa-
is even more pronounced (Fig. 6c, green and red curves). On the ter depth. W is the wind speed and C is a constant combining
other hand, the shallower sea level tends to accelerate the time to gravity, density and empirical drag.
peak of the minimum surge (Fig. 5c, blue dots, solid curve). This Because of the wind stress become more effective in shallow
behavior is also seen in the result of the TC4_LNE path (Fig. 5d, water, the water surface can be significantly raised and bottom
blue dots, solid curve). However, the overall rhythmic structures stress increases. Enhancement of the current through the vertic-
are unchanged. al axis also relies on the mass continuity principle where the flow
The periods of the oscillation for the surges above are approx- speed increases with decreasing cross-sectional area. Hence, re-
imately 25 hours (peak-to-peak). This characteristic suggests that gardless of the shallow bathymetry, the funnel effect also induces
sea level variability has an insignificant impact on the temporal greater intensification of storm surges in the nearshore region of
structure of storm surges in the gulf. This also indicates that the the GOT-SS. Small amplification in the offshore sector is nor-
resonance modal structures should remain unchanged. The mally due to a reduction of damping or bottom friction in deeper
delayed surge, however, seems to be more amplified but it does sea.
not conform to the resonance response of the gulf (Tomkratoke In summary, we have investigated four factors: phase
et al., 2015) and that of the SCS (Chen et al., 2012). Other mech- propagation of the storm surge wave determined by the landfall
anisms such as an interaction between surge and shelf bathy- position, the funnel effect caused by locality of the coastline, shelf
metry may help explain this phenomenon. The details of this in- bathymetry determined by the state of mean sea level and the
teraction are presented next. coastline crossing angle of the storm path. By identifying the im-
portant physical mechanisms that induce severe surges, we
3.4.2 Shelf bathymetry found that the induced surge in particular regions can be re-
As presented in Fig. 5–7, the storm surge magnitude tends to garded as significantly high.
be more amplified or weaken as the mean sea level decreases or
increases, respectively. This conforms to the nonlinear effect re- 4 Conclusions
vealed by Horsburgh and Wilson (2007) and Rego and Li (2010) In the present study, the influence of tropical cyclone paths
who reported that high surges did not occur at high water depths. and shelf bathymetry on the inducement of severe storm surges
However, the development of a high surge in the GOT-SS has a in the Gulf of Thailand-Sunda Shelf is determined via numerical
unique mechanism because of the high complexity of hydro- hydrodynamic simulations and a parametric wind model.Our
dynamic processes. Here, the funnel-shaped or concave validation study shows good agreement between a simulated and
shoreline indeed promotes amplification of the surges as de- observed storm surge. The contributions of each significant
scribed in Section 3.2. Even in the near landfall location, the factor on the generation of severe surges in the region are sum-
storm surge response at the long straight coastline (Prachuap marized as follows:
Khiri Khan, Thailand) increases, but not as much as found at the Storm paths can play a substantial role in controlling oscilla-
concave coastline (Bac Lieu, Vietnam) and the funnel-shaped tion patterns of storm surges in the gulf. Tropical cyclones mov-
bays (Kien Giang, Vietnam; Surat Thani and Samut Prakan, Thai- ing along a monsoon trough during the onset to early northeast
land; Betong, Malaysia) (Figs 4 and 7). In comparison, the incre- monsoon season (October-November, TC1_OSM and TC2_ENE
ment of surge magnitude in the latter regions can exceed 0.5 scenarios, passing over the upper part of the gulf) produce a sig-
times the baseline case while the surge magnitude at the straight nature mirrored N-shaped surge. In contrast, tropical cyclones in
coastline is much lower. the mid and late northeast monsoon season (December-January,
To explain the mechanism of amplification, the vertical struc- TC3_MNE and TC4_LNE, passing over the lower part of the gulf)
ture of the current need to be interpreted. This interpretation can mainly induce a single flood surge. Supported by the flood surge
help one examine how the storm surge flow structure evolves un- period, the funnel effect, and the effective angle of crossing, a
der various mean sea level conditions. In doing so, deviation of severe surge can be induced in particular regions of the Gulf of
surface and bottom currents and surge magnitude between the Thailand-Sunda Shelf, especially in regions with monsoon
scenarios and baseline for only the two upper paths (TC1_OSM trough development during the onset to early northeast mon-
and TC2_ENE) are determined and presented in Fig. 8. Sugges- soon season.
ted by the maximum storm surge magnitude results (Fig. 4), the Varying depth (mean sea level) does not show a significant
most hazard prone region for the TC1_OSM path is the inner contribution to the temporal and resonance modal structures of
GOT while the Surat Thani and Bac Lieu are the most hazard storm surges in the gulf. Instead, a significant surge amplifica-
prone areas for the TC2_ENE path. For the current structure in tion occurs. This amplification is inversely pronounced as depth
those regions, both surface and bottom, larger deviations are increases, and it conforms well with the importance of shelf ba-
seen in the –2.0 meters scenario, especially, in the nearshore re- thymetry on coastal surges as theorized by Pugh (1987).
gion (Fig. 8, upper panel). Hence, the induced currents are However, as suggested by the flow structure, the amplification in
stronger than that of the baseline. This scenario also produces particular regions may be simply explained based on continuity
larger deviations in surge magnitude. In contrast, a minor devi- of mass.
ation is observed in the high-water scenario (Fig. 8, lower panel). Given that the GOT consists of complicated geomorphic
From the response behavior and relationships between the structures that can amplify storm surge magnitudes as revealed
current structure and surge levels in nearshore regions, it is in the current study, the precise forecast of storm paths must be
found that the amplification of storm surges is proportional to incorporated in developing oceanic disaster forecasting systems.
the flow strength and tends to be more intensified in regions with Finally, the highlights of this study are: this study is first to
a funnel or concave shaped coastline. The amplification con- provide the key mechanisms of tropical cyclone paths and shelf
forms well to the importance of shelf bathymetry on coastal bathymetry on the inducement of severe storm surges in the GulfTomkratoke Saifhon et al. Acta Oceanol. Sin., 2020, Vol. 39, No. 3, P. 90–102 101
a Samut Prakan b c
on
ph
um
Ch
ieu
i
Mau
cL
r
habu
Ba
Ca
Petc
han i
Surat T
d Samut Prakan e f
on
ph
um
Ch
u
ieu
Ma
cL
Ba
ri
Ca
habu
Petc
hani
Surat T
surface, 2.0 m/s
bottom, 2.0 m/s
-1.00 -0.75 -0.50 -0.25 0 0.25 0.50 0.75
Surge/m (aMSL)/m
Fig. 8. Current magnitude (arrows) and surge level (filled contour) deviations of scenario mean sea levels (upper: baseline –2.0 m and
lower: baseline +2.0 m), at the highest surge regions i.e. the inner GOT (a and b, TC1_OSM), Surat Thani Bay (c and d, TC2_ENE) and
Ca Mau peninsula (e and f, TC2_ENE).
of Thailand-Sunda Shelf. This study also provides the important 2.0.CO;2
foundation information extreme surges in developing oceanic Chen C, Beardsley R C, Cowles G. 2006. An unstructured grid, finite-
volume coastal ocean model (FVCOM) system. Oceanography,
disaster forecasting systems as well as storm surge preparedness
19(1): 78–89, doi: 10.5670/oceanog.2006.92
and safety for the Gulf of Thailand-Sunda Shelf. And, this study Chen Haoliang, Tkalich P, Malanotte-Rizzoli P, et al. 2012. The forced
can be also used as the guidance and support for field surveys and free response of the South China Sea to the large-scale
studies of storm surge disasters in the Gulf of Thailand-Sunda monsoon system. Ocean Dynamics, 62(3): 377–393, doi:
Shelf. 10.1007/s10236-011-0511-7
Debsarma S K. 2009. Simulations of storm surges in the Bay of
Bengal. Marine Geodesy, 32(2): 178–198, doi: 10.1080/
References
01490410902869458
Aschariyaphotha N, Wongwises P, Humphries U W, et al. 2011. Study
Digital Typhoon. 2016. Typhoon 199726 (LINDA)-General Informa-
of storm surge due to Typhoon Linda (1997) in the Gulf of Thai-
tion (Pressure and Track Charts). http://agora.ex.nii.ac.jp/di-
land using a three dimensional ocean model. Applied Mathem-
gital-typhoon/summary/wnp/s/199726.html.en [2016-05-05]
atics and Computation, 217(21): 8640–8654, doi: 10.1016/
Flather R A. 1994. A storm surge prediction model for the northern
j.amc.2011.03.105 Bay of Bengal with application to the cyclone disaster in April
As-Salek J A. 1998. Coastal trapping and funneling effects on storm 1991. Journal of Physical Oceanography, 24(1): 172–190, doi:
surges in the Meghna Estuary in relation to cyclones hitting 10.1175/1520-0485(1994)0242.0.CO;2
Noakhali–Cox’s Bazar Coast of Bangladesh. Journal of Physical Holland G J. 1980. An analytic model of the wind and pressure pro-
Oceanography, 28(2): 227–249, doi: 10.1175/1520-0485(1998) files in hurricanes. Monthly Weather Review, 108(8):
0282.0.CO;2 1212–1218, doi: 10.1175/1520-0493(1980)108
Cavaleri L, Sclavo M. 2006. The calibration of wind and wave model 2.0.CO;2
data in the Mediterranean Sea. Coastal Engineering, 53(7): Horsburgh K J, Wilson C. 2007. Tide-surge interaction and its role in
613–627, doi: 10.1016/j.coastaleng.2005.12.006 the distribution of surge residuals in the North Sea. Journal of
Chen Changsheng, Liu Hedong, Beardsley R C. 2003. An unstruc- Geophysical Research, 112(C8): C08003
tured grid, finite-volume, three-dimensional, primitive equa- Hussain M A, Tajima Y. 2017. Numerical investigation of surge–tide
tions ocean model: application to coastal ocean and estuaries. interactions in the Bay of Bengal along the Bangladesh coast.
Journal of Atmospheric and Oceanic Technology, 20(1): Natural Hazards, 86(2): 669–694, doi: 10.1007/s11069-016-
159–186, doi: 10.1175/1520-0426(2003)020 2711-4102 Tomkratoke Saifhon et al. Acta Oceanol. Sin., 2020, Vol. 39, No. 3, P. 90–102
IOC, IHO and BODC. 2003. “Centenary Edition of the GEBCO Digital Saramul S. 2017. Seasonal monsoon variations in surface currents in
Atlas”, published on CD-ROM on behalf of the Intergovern- the Gulf of Thailand revealed by high frequency radar. Engin-
mental Oceanographic Commission and the International Hy- eering Journal, 21(4): 25–37, doi: 10.4186/ej.2017.21.4.25
drographic Organization as part of the General Bathymetric Signell R P, Carniel S, Cavaleri L, et al. 2005. Assessment of wind
Chart of the Oceans; British Oceanographic Data Centre, Liver- quality for oceanographic modelling in semi-enclosed basins.
pool Journal of Marine Systems, 53(1–4): 217–233
Jelesnianski C P. 1965. A numerical calculation of storm tides in- Sirisup S, Kitamoto A. 2012. An unstructured normal mode decom-
duced by a tropical storm impinging on a continental shelf. position solver on real ocean topography for the analysis of
Monthly Weather Review, 93(6): 343–358, doi: 10.1175/1520- storm tide hazard. In: Proceedings of 2012 Oceans-Yeosu.
0493(1993)0932.3.CO;2 Yeosu, South Korea: IEEE, 1–7
Kanbua W, Supharatid S, Tang I M. 2005. Ocean wave forecasting in Takahashi H G, Fujinami H, Yasunari T, et al. 2015. Role of tropical
the gulf of Thailand during typhoon Linda 1997: WAM and cyclones along the monsoon trough in the 2011 Thai flood and
Neural network approaches. ScienceAsia, 31(3): 243–250, doi: interannual variability. Journal of Climate, 28(4): 1465–1476,
10.2306/scienceasia1513-1874.2005.31.243 doi: 10.1175/JCLI-D-14-00147.1
Kohno N, Kamakura K, Minematsu H, et al. 2007. The mechanism of Terry J P, Jankaew K, Dunne J. 2015. Coastal vulnerability to typhoon
the storm surges in the Seto inland sea caused by Typhoon inundation in the Bay of Bangkok, Thailand? Evidence from
Chaba (0416). Technical Review 9. RSMC Tokyo-Typhoon Cen-
carbonate boulder deposits on Ko Larn island. Estuarine,
ter
Coastal and Shelf Science, 165: 261–269, doi: 10.1016/j.ecss.
Lander M A. 1996. Specific tropical cyclone track types and unusual
2015.05.028
tropical cyclone motions associated with a reverse-oriented
Tomkratoke S, Sirisup S, Udomchoke V, et al. 2015. Influence of res-
monsoon trough in the western North Pacific. Weather and
onance on tide and storm surge in the Gulf of Thailand. Contin-
Forecasting, 11(2): 170–186, doi: 10.1175/1520-0434(1996)0112.0.CO;2
Pan Yi, Chen Yongping, Li Jiangxia, et al. 2016. Improvement of wind 09.006
field hindcasts for tropical cyclones. Water Science and Engin- Vongvisessomjai S. 2007. Impacts of typhoon Vae and Linda on wind
eering, 9(1): 58–66, doi: 10.1016/j.wse.2016.02.002 waves in the upper gulf of Thailand and East Coast. Songklana-
Phaksopa J, Sojisuporn P. 2006. Storm surge in the Gulf of Thailand karin Journal of Science and Technology, 29(5): 1199–1216
generated by typhoon Linda in 1997 using Princeton Ocean Williams H, Choowong M, Phantuwongraj S, et al. 2016. Geologic re-
Model (POM). Kasetsart Journal (Natural Science), 40(5): cords of Holocene typhoon strikes on the Gulf of Thailand
260–268 coast. Marine Geology, 372: 66–78, doi: 10.1016/j.margeo.
Proudman J. 1955. The propagation of tide and surge in an estuary. 2015.12.014
Proceedings of the Royal Society A: Mathematical, Physical and Wu Liang, Wen Zhiping, Huang Ronghui, et al. 2012. Possible linkage
Engineering Sciences, 231(1184): 8–24 between the monsoon trough variability and the tropical cyc-
Pugh D T. 1987. Tides, Surges, and Mean Sea-Level: A Handbook for lone activity over the western North Pacific. Monthly Weather
Engineers and Scientists. Chichester: John Wiley and Sons Review, 140(1): 140–150, doi: 10.1175/MWR-D-11-00078.1
Rego J L, Li Chunyan. 2010. Nonlinear terms in storm surge predic- Zu Tingting, Gan Jianping, Erofeeva S Y. 2008. Numerical study of the
tions: effect of tide and shelf geometry with case study from tide and tidal dynamics in the South China Sea. Deep Sea Re-
Hurricane Rita. Journal of Geophysical Research, 115(C6): search Part I: Oceanographic Research Papers, 55(2): 137–154,
C06020 doi: 10.1016/j.dsr.2007.10.007You can also read