BERING SCIENCE Winter 2020/2021 - Communicating science in and around the Bering Sea - Alaska Ocean Observing ...
←
→
Page content transcription
If your browser does not render page correctly, please read the page content below
BERING SCIENCE
Winter 2020/2021 — Communicating science in and around the Bering Sea
www.beringregionoceandata.org
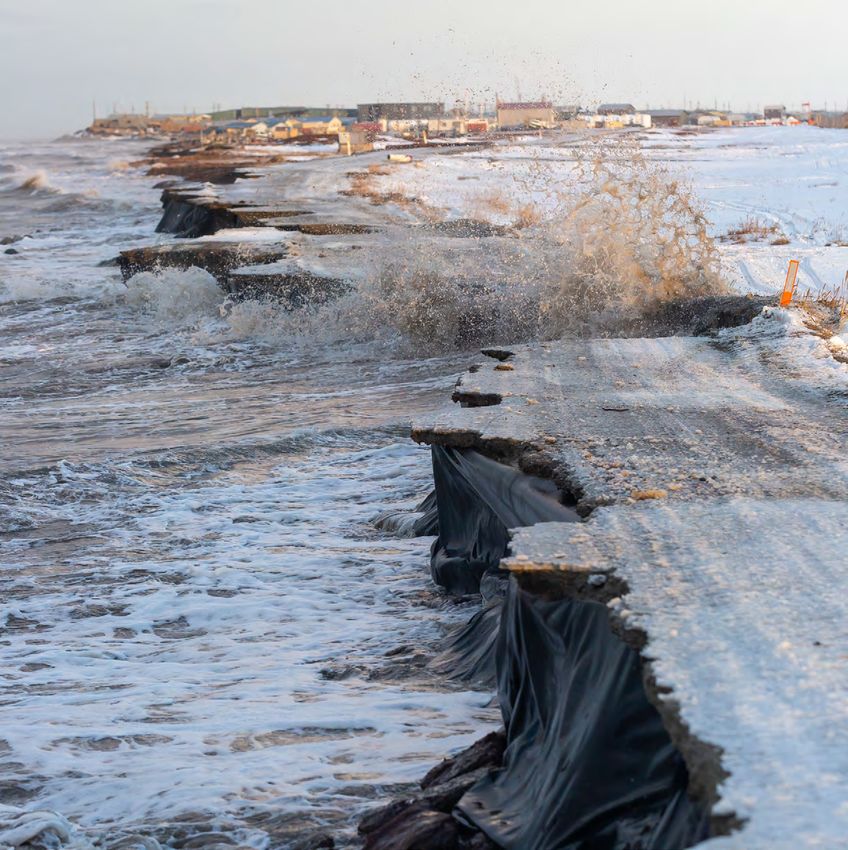
Dennis Davis from Shishmaref
captured this photo of a
storm eroding the road to
the community dump on
November 6, 2020. See more
pictures of climate change
impacts in Shishmaref on
Dennis’s Instagram account
@eskimofixer.
Ocean Data
Sharing Initiative Alaska Ocean Observing System
UAF is an AA/EO employer and educational institution and prohibits illegal discrimination against any individual: www.alaska.edu/nondiscrimination/.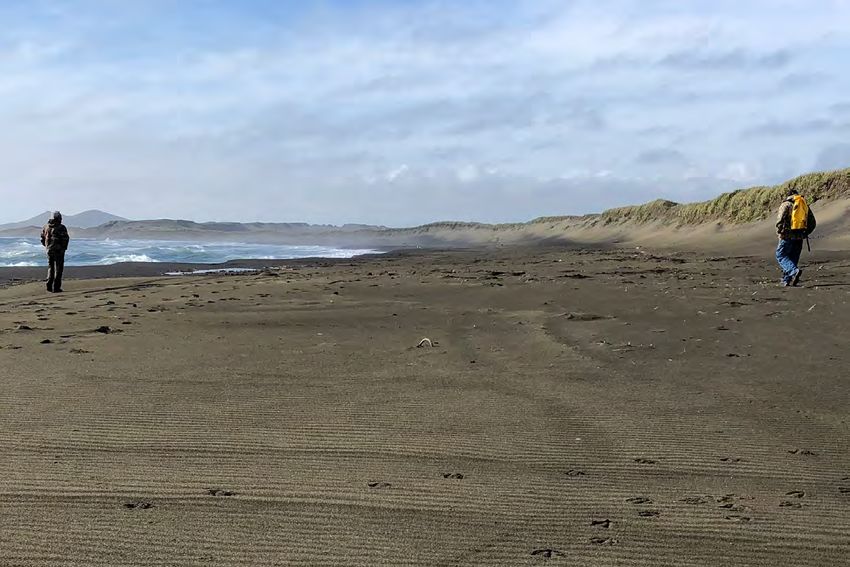
WELCOME                                                                                             NAVIGATION
                                                                                                    Meet a contributor ........................... 3
The Bering Sea is experiencing many changes. Loss of sea ice and record high ocean and air          Climate update .................................. 4
temperatures continue to impact wildlife and all aspects of life for coastal communities. The       Fall storms ........................................... 5
Bering Region Ocean Update project began in spring 2020, in part, to increase regional data         Erosion & flooding .............................. 6
sharing among federal, state, community and private sector partners. This is the third report.      Salmon ................................................. 7
Read previous updates and learn how information is gathered and reviewed at https://aoos.           Walleye pollock ................................... 8
org/beringregion. We provide a resource to state, federal, community and university partners        Crab ...................................................... 9
to share recent observations with community members and other scientists and management             Ocean acidification .......................... 10
agencies. If you gather data or have observations of changes in the Aleutians, Bering Sea or        Plankton .............................................. 11
southern Chukchi Sea contact us for possible inclusion in a future Bering Science report.           Harmful algal blooms ....................... 12
                                                                                                    Gray whales ...................................... 13
COVID-19 impacts                                                                                    Ice seals ............................................. 14
2020 was a challenging year, due in large part to the COVID-19 pandemic. Normally, many             Marine debris .................................... 14
different groups collect data on everything from salmon populations, to water chemistry, to         Seabirds ............................................. 15
seabird breeding success in the Bering Sea. These monitoring efforts provide critical data on       Contacts & citations ........................ 16
the health of the Bering Sea ecosystem and allow us to track how it is changing.
                                                                                                    Who are we?
In 2020, non-local scientists could not travel to rural communities because of COVID-19.            This report is part of the Alaska’s
Many surveys, including several NOAA research cruises, were canceled. US Fish and Wildlife          Changing Environment series (https://
Service was unable to conduct seabird research. Even so, information gaps were filled through       bit.ly/3fbkhAO). It was compiled by
collaboration with community and research partners and using new innovative technologies.           the Alaska Ocean Observing System
                                                                                                    and the International Arctic Research
                                                                                                    Center with collaboration from the
Ecosystem Status Reports                                                                            National Oceanic and Atmospheric
In this publication we share many findings originally compiled for the NOAA Ecosystem               Administration.
Status Reports. These yearly reports describe the status of the Alaska marine ecosystems.
Along with fishery stock assessments, they are used by the North Pacific Fishery                    Reviewers
Management Council to inform commercial fishing quotas in federal water.                            Thank you to our reviewers who
                                                                                                    provided valuable input on this
In recent years, Ecosystem Status Reports began including diverse types of information.             publication.
Communities and Tribes now contribute local and traditional knowledge and help define new
indicators of ecosystem health. With many NOAA research activities canceled in 2020,                Cite this report
local-scale community observations were particularly critical to the reports as were the            Prewitt, J. and H. R. McFarland,
addition of satellite-derived indicators. REPORT ecosystem observations in your community           editors. Bering Science: Winter 2021
to the Ecosystem Status Report editors listed on page 16 or through regional channels.              Bering region ocean update, Issue 3
                                                                                                    [newsletter]. Alaska Ocean Observing
                                                                                                    System, Anchorage, Alaska.
COMMUNITY ADVISORY BOARD
We thank our advisory board
for providing direction,
                                Connie Melovidov, Aleutian           Lauren Divine, Ecosystem       FEEDBACK
                                Pribilof Islands Association, Inc.   Conservation Office at Aleut   Your opinion is valuable to us and
suggestions for content and                                          Community of St. Paul Island   can help guide future reports. Please
                                Erica Lujan, Alaska Native
feedback.                                                                                           provide feedback by filling out the
                                Tribal Health Consortium             Mellisa Johnson, Bering
Chandra Poe, Qawalangin                                              Sea Elders Group               postcard in this report or an online
                                Jennifer Hooper,                                                    survey https://www.surveymonkey.
Tribe Of Unalaska
                                Association of Village                                              com/r/BeringScienceWinter21.
                                Council Presidents

        What do the orange circles mean? For each piece of information in this report we provide the data/information source and a
 #      person to contact to learn more. Use the number in the circle to locate the associated contact and source on page 16.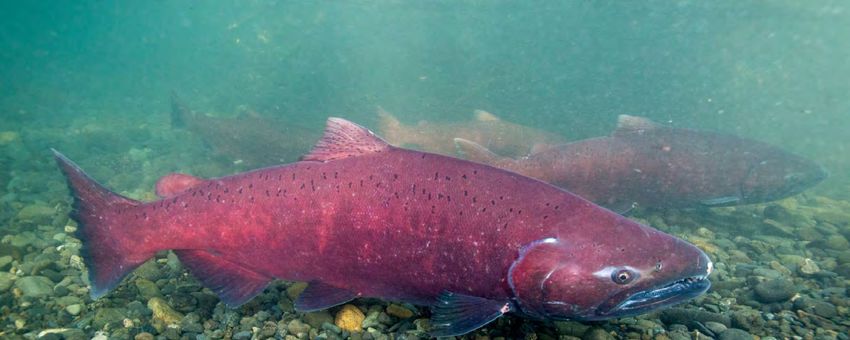
ISLAND SENTINELS OF SAINT PAUL
                  What is your job?
                  Paul Melovidov and Aaron Lestenkof are Indigenous Island Sentinels for the Aleut Community
                  of St. Paul Tribal Government Ecosystem Conservation Office. “As Sentinels we’re on the
Meet Paul         front lines, witnessing the changes in our environment,” said Paul, Sentinel Coordinator. “With             Meet Aaron
Melovidov         data collection we are able to better understand what’s happening with our ecosystem.” They                 Lestenkof from
from St. Paul     contributed data to the Pribilof Islands seabird section on page 15.                                        St. Paul Island.
Island.           What do Island Sentinels monitor?
                  As Island Sentinels, Paul and Aaron gather impressively diverse data on everything from seabirds,
                  to reindeer to erosion. Their regular surveys of Steller sea lions, northern fur seals, harbor seals, sea
                  ducks, gulls and reindeer help track population sizes and Indigenous harvest activities. They also
                  highlight changes, like a recent shift in seabird behavior. “The seabirds that usually migrate when it
                  gets cold this time of year, we’re starting to see them stick around a little longer,” said Aaron.
                  Monitoring beaches for stranded marine mammals and dead seabirds that might be an indication
                  of mass die-offs is another important aspect of the Sentinels’ work. On rookeries and marine
                  mammal habitats they help organize semi-annual marine debris clean ups, which average about
                  20,000 pounds of debris per event. Their stewardship helps keep marine mammal rookeries
                  and haul outs clear of plastics. Adjusting to the ever changing environment, the Sentinels also
                  recently began testing for harmful algal blooms and are instrumental in preventing rats, which
                  have decimated bird populations on some Aleutian Islands, from reaching the island.
                  What are the biggest changes you’ve seen recently?
                  According to Paul, climate change and over fishing have changed St. Paul Island over the past
                  ten years. “You’re looking at a decline in marine mammals, northern fur seals and Steller sea lion.
                  You’ve got mass die-offs of migrating birds. Migrating birds not returning back to the island...
                  Decline of halibut and crab in the Bering Sea... Sea ice normally would come down to the Pribilof
                  Islands, now we’re barely seeing sea ice come down to the islands at all. Less winter snow and
                  more gale force wind storms through fall and winter months. Lastly, there is more marine debris              Paul Melovidov and
                                                                                                                               Aaron Lestenkof
                  on our beaches and shorelines.” Many of these changes are impacting the entire Bering Sea                    survey a beach for
                  region and Paul and Aaron emphasized that communities are not alone, they are in this together.              seabird carcasses.
                                                                                                                               Photo by Hillary
                  Learn more about Paul and Aaron’s work on their Facebook Page www.facebook.com/EcoSysCon                     Burgess.

FISH BIOLOGIST                               What do you study?
Meet Dr. Katie Howard from                   I’m a fisheries scientist at the Alaska Department of Fish and Game. I study the marine life
Anchorage. She contributed the salmon        of salmon — trying to understand how these big questions around climate change, carrying
information on page 7 of this report.        capacity in the ocean and competition among species may influence Alaskan salmon and
                                             our fisheries, and how we can use this knowledge to inform decisions about our fisheries.
                                             Why do you do the work you do?
                                             Fish and fisheries are important to people. They represent food, livelihoods, a lifestyle and are
                                             integral to people’s cultures. Growing up, I always wanted to use whatever skills and talents I
                                             had to help people — being a fisheries scientist who can discover and share information that
                                             helps people make decisions about their fisheries is how I’ve found I can do that. Fish and the
                                             natural world are also amazing, which makes it easy to be passionate about my work.
                                             What is the most rewarding/interesting thing about your work?
                                             There is so much that is interesting about salmon in the Bering Sea, I wouldn’t even
                                             know where to start! Easily the most rewarding thing about my work is the people. I am
                                             very fortunate that I get to work with and interact with incredible scientists, fishermen,
                                             stakeholders, boat crews, students and communities almost every day. I learn something
                                             new every time, and I’ve met some truly inspiring people along the way.
                                             Is there anything else you would like to add?
                                             Learn more about salmon in the ocean, share ideas, insights, or get information – check
                                             out our Facebook page www.facebook.com/ADFGUnderseaWorldOfSalmonAndSharks 3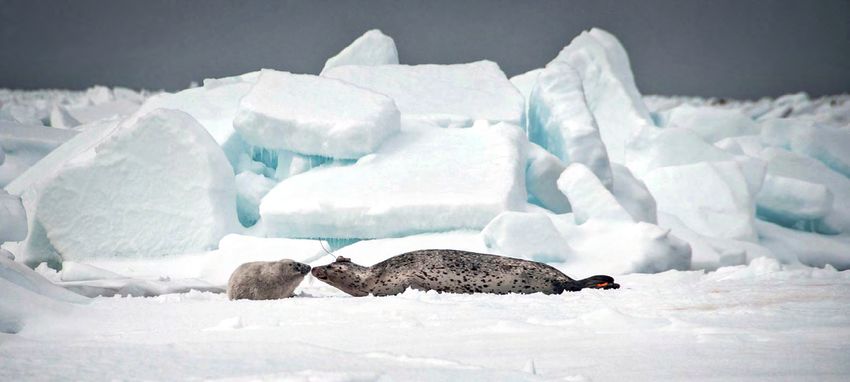
CLIMATE UPDATE
SEA ICE EXTENT      1

Sea ice development was characteristically slow this autumn. Ice did       and Nome had open water until the second week in December. Ice
not cover the Chukchi Sea until mid-December, which is not unusual         cover increased after mid-December. By the start of February, the
in recent years, but is nearly a month later than was typical prior to     ice extent was only about 15 percent below the long-term average
1990. Bering Sea ice extent for November was the lowest since 1978,        but much of the ice was still quite thin.

November 1                         December 1                            January 1                              February 1

   Less than 10% ice cover        10–30% ice cover         40–60% ice cover          70–80% ice cover       90–100% ice cover     Landfast ice

OCEAN TEMPERATURE            2                            AIR TEMPERATURE            3
Ocean temperatures were not as warm as                    Air temperatures were above normal in most areas every month from
the same time in 2019–2020 but were still                 September 2020 to January 2021, and two-thirds or more of days were
well above normal in most areas. Some areas               warmer than normal. The warmth was especially notable in the northern
by Shishmaref, Dillingham and the mouth of                Bering Sea, where Nome had the 5th mildest autumn (September through
the Kuskokwim River were all slightly colder              November) in more than 110 years of observations. While a greater
than normal. As sea ice developed after                   percentage of days were warmer than normal on St. Paul, 2020 was not
January 2021, ocean temperatures beyond                   even in the top 10 warmest autumns.
the ice edge were near normal, though some
areas offshore of the Russian coast remained              Sept 1         Oct 1           Nov 1          Dec 1          Jan 1      Feb 1
warmer than normal.
                                                          Nome 66% of days warmer than normal                                     20°F warmer
Ocean temperature October–December 2020                                                                                            than normal

                                                                                                                                        normal

                                                                                                                                   20°F colder
                                                                                                                                   than normal

                                                          St Paul 71% of days warmer than normal                                       20°F

                                                                                                                                       20°F

                                                          Dillingham 68% of days warmer than normal                                    20°F

3.5°F colder            Normal       3.5°F warmer
than normal                           than normal                                                                                      20°F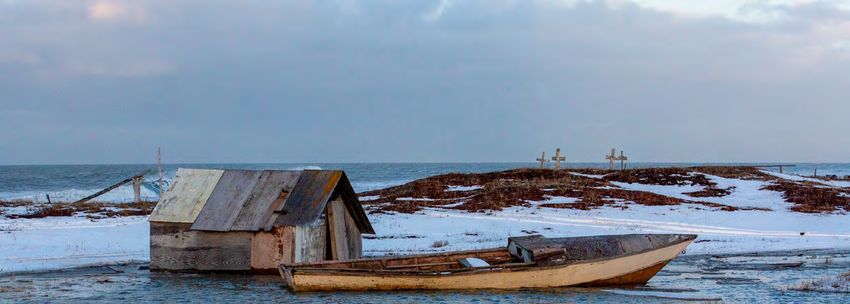
FALL STORMS
Historically, sea ice buffered Chukchi and Bering sea communities from potential damage during winter storms. As ice disappears, high
wind events pose more threat of coastal flooding and erosion. These impacts could increase in the future according to a recent study
by the University of Alaska Fairbanks. By 2099, winds along the coast from Utqiaġvik to Nome are projected to grow stronger. 4

                                                  Fewer storms than normal   Normal number of storms (6–8 storms/fall)   More storms than normal
NUMBER OF STORMS                 5
                                            14 storms
The graph to the right shows                 each fall
the number of fall (September to
                                                                                                                                      2020
November) storms in the Bering
& Chukchi seas. 2020 had nine
fall storms that were potentially
strong enough to produce
coastal flooding somewhere on                   7 storms
the Alaska coast. This is slightly
more storms than the region
normally experiences during
that period.

                                                0 storms
                                                        1950         1960                 1980                    2000                 2020

                                                           August                                     September
FALL WINDS            6
These four maps compare the wind
speeds over Alaska from August to
November 2020 to the 1981–2010
average. Throughout much of the
Bering Sea there was less wind or
near average wind in August and
October. In November, typically a time
of intense storm activity, most of the
Bering Sea was windier than normal.

                                        Below
                                        average
                                        wind

                                        Near               October                                    November
                                        average

                                        Above
                                        average

                                        Much above
                                        average

Coastal flooding after a storm on Shishmaref.
Photo by Dennis Davis, @eskimofixer.                                                                                                           5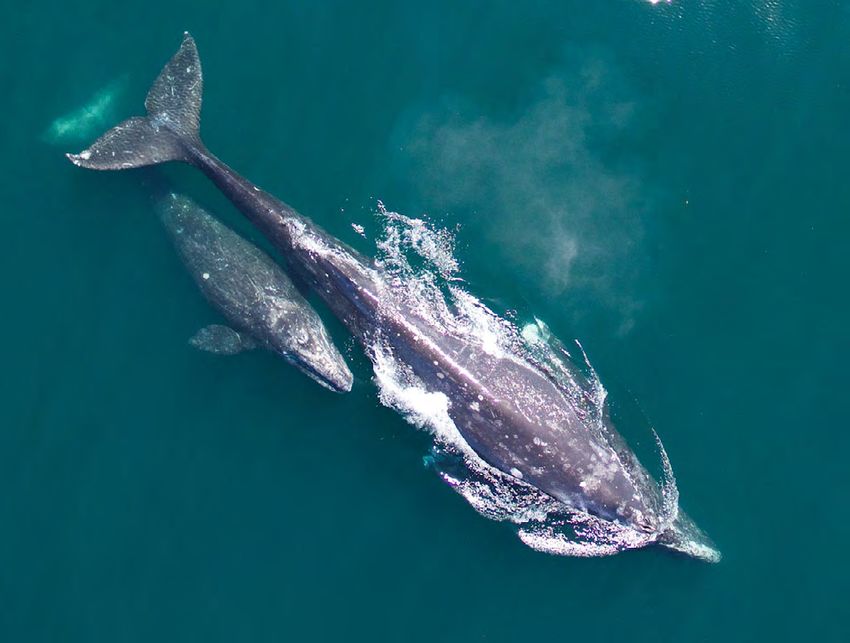
EROSION & FLOODS
Many Alaska coastal communities are
vulnerable to erosion, flooding and permafrost       2020 STORM IMPACTS               8
degradation. To help communities plan and            The 11 communities on this map
communicate with state and federal agencies,         with color dots saw erosion and/
the State of Alaska recently summarized the          or flooding in fall 2020. Dot color
                                                     shows which storms impacted
long-term shoreline change in 48 northern
                                                     each community. Communities
and western Alaska communities. 57 percent           without a dot are shown because
of the communities had erosion rates greater         they are mentioned in the graph at
                                                                                               EROSION IN GOLOVIN
than 3.3 feet per year over the past 60 years.       the bottom of the page.                   Toby Anungazuk Jr. shared this photo with the
                                                                                               Dept. of Natural Resources showing coastal
                                                                             August 30         erosion near Golovin after a November storm.
Regional processes                                                           October 6
Below are examples of how the type of                                        November 5–7
                                                       Shishmaref            November 10 –11
shoreline common in different regions of the
Bering Sea influences erosion and flooding of
coastal communities.

Bering Strait: Many coastal communities are built           Nome
                                                                   Golovin      Shaktoolik
on mixed sand, gravel spits and barrier islands.
This makes them vulnerable to storm surges and                           Unalakleet
flooding, as well as erosion.                                 Alakanuk

Yukon-Kuskokwim Delta: Coastal flooding can                                                    EROSION IN HOOPER BAY
reach 20 miles inland to communities that are           Hooper Bay
                                                                                               William Naneng shared this photo with the Dept.
built along extremely low lying, coastal and                                                   of Natural Resources of a coastal bluff eroding
tidally influenced rivers.                                                                     near Hooper Bay after a November storm.
                                                         Newtok
                                                              Napakiak
Bristol Bay & Alaska Peninsula: Most                Tununak
communities are perched on 20 foot or
higher bluffs. The tall and exposed nature of the           Quinhagak
bluffs makes them vulnerable to groundwater                                     Dillingham
seepage and overland runoff. Waves can erode the
base of the bluffs, destabilizing them and causing                              Ekuk Naknek
slumps. On the Alaska Peninsula, the coastline is
predominantly covered by volcanic materials, like                               Egegik                              Photo by US Coast Guard
pumice-rich bluffs that are easily eroded.
                                                                             Port Heiden       HIGH WINDS IN EKUK
REPORT storms that flood or cause erosion near
your community to the Alaska Water Level Watch                                                 A seafood industry barge broke anchor and
Facebook page https://bit.ly/3jmSdL6.                        Nelson Lagoon                     beached near Ekuk after the August 30 storm
                                                                                               hit the area with 80 mph winds. Nearby at
                                                                                               Naknek, water levels measured five feet above
                                                                                               the highest hide tides.

   80 feet of
                                       EROSION RATES         7
erosion/year
                Newtok
                                       The seven western Alaska coastal communities
                                       in this graph had the greatest erosion rates. In
                                       Newtok the maximum rate of erosion was 72.8
                                       feet per year. Erosion rates alone do not define a
                                       community’s vulnerability. Infrastructure location,
                   Napakiak
40 feet/year                           community capacity, and other factors must be
                                       considered. See a full list of community erosion
                         Port Heiden   rates at https://dggs.alaska.gov/pubs/id/30552.
                                                                                               FLOODING IN NELSON LAGOON
                                Dillingham       Alakanuk                                      Angela Johnson shared this photo with the Dept.
                                                        Egegik                                 of Natural Resources of flooding after a storm
                                       Quinhagak
                                                                                               on November 20 near Nelson Lagoon.
           0                                                                                                                                  6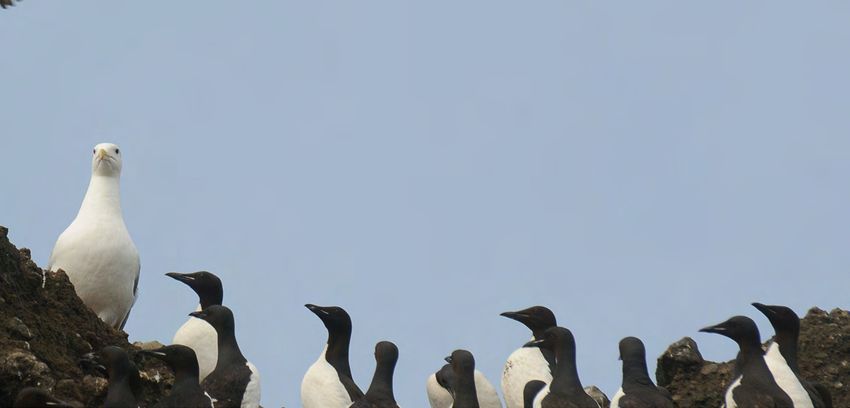
SALMON                                       9
                                                                                           2020 SPECIES OVERVIEW           9
                                                                                           The graph below shows which salmon
                                                                                           species had lower or higher abundance in
CHINOOK, CHUM, COHO                                                                        the Bering Sea during 2020. There were
                                                                                           more sockeye and pink than the past 20
In 2020, salmon abundance throughout Alaska was lower                   More salmon        years, and fewer Chinook, chum and coho.
                                                                        than average
than average for most species and stocks. Chinook salmon
runs have generally been below average to poor since 2008                                                                      Sockeye
                                                                                                                                             Pink
across the entire state including western Alaska, and 2020           20-year average
was no exception. Yukon River Chinook salmon stocks are                                                             Coho
expected to continue to decline in 2021 and 2022.
                                                                                          Chinook
                                                                                                      Chum
Many chum salmon runs in western Alaska were near
average to strong over the past decade, but 2020 runs were             Fewer salmon
consistently poor across all stocks. Similarly, coho salmon             than average
stocks tended to be fairly strong from about 2014–2018 in
western Alaska, but were near average to poor in 2020.

SOCKEYE AND PINKS
                                                                                    YUKON RIVER CHINOOK RUN SIZE               10
One of the few bright spots for salmon abundance in the
state is the continued strong sockeye salmon run sizes for                          The graph below shows the number of Chinook salmon
most, but not all, western Alaska stocks. This trend has been                       in the Yukon River run since 2003. The abundance of
                                                                                    Yukon River juvenile Chinook salmon in the northern
occurring since about 2015. Pink salmon abundance in
                                                                                    Bering Sea has decreased since 2017. Based on this,
western Alaskan was also high in 2020. Odd and even year                            the Yukon River Chinook salmon run size is expected to
pink salmon abundance has been very strong in the region                            continue declining in 2021 and 2022.
                                                               400,000 Yukon
since about 2016.                                             Chinook salmon
                                                                                                                                         Recent trend
                                                                                                                                         expected to
                                                                                                                                          continue in
Advancements despite COVID-19                                                                                                            2021 & 2022
Alaska Department of Fish and Game and NOAA Alaska                        200,000
Fisheries Science Center were unable to survey in the
northern Bering Sea in 2020 due to COVID-19. Even so,
several new analyses furthered our understanding of salmon
ecology in the region. While juvenile Chinook salmon in the
Bering Sea are from western Alaska, biologists have learned                       0
                                                                                   2003        2007          2011      2015          2019          2022
where immature (1+ years at sea) Chinook salmon originated
by analyzing genetic samples taken during fall Bering Sea
surveys from 2003–2019. This new information on immature
Chinook migratory patterns is critical to understanding
ecological processes that impact Chinook stocks.

                                                          Southern Bering Sea                              Northern Bering Sea
WHERE DO CHINOOK COME FROM?                      9
                                                               Middle & Upper                                                             Middle &
91% of the immature Chinook salmon in the                       Yukon River                                                              Upper Yukon
northern Bering Sea come from western                               26%          Northern                                                   River
Alaska rivers, including the Yukon River. In                                      Alaska                                                    29%
the southern Bering Sea, these stocks make                                       Peninsula
                                                                                   11%
up 70% of the immature Chinook salmon
caught, with Gulf of Alaska, British Columbia,       Coastal                                          Coastal
                                                     Western                Coastal Gulf              Western
and Pacific Northwest stocks comprising the
                                                     Alaska                  of Alaska                Alaska
remaining 30%.                                                                                                                  Northern
                                                      33%                       17%                    45%
                                                                                                                                 Alaska
Graphics adapted from Alaska Department of
                                                                       British                                                  Peninsula
Fish & Game
                                                                      Columbia                                                    17%
                                                                        11%
                                                                                                                                    Coastal Gulf
                                                          Washington, Oregon                  Washington, Oregon                     of Alaska
                                                             & California                        & California     British               3%
                                                                 2%                                  3%          Columbia
                                                                                                                    3%
Chinook salmon. Photo by UW FWS.                                                                                                                     7
WALLEYE POLLOCK
POLLOCK & THE COLD POOL                                               11       high densities of adults. This suggests that pollock can move
                                                                               northward into the Chukchi Sea as the ocean warms and sea ice
The eastern Bering Sea “cold pool” is about a 100-foot layer                   diminishes. Whether it will be possible for pollock to colonize
of water that forms near the ocean floor in areas where thicker                these northward regions, will depend on their temperature
sea ice remains late into spring. Water temperatures in the cold               tolerance, water temperatures, prey resources, reproductive
pool are usually 28.5–35°F. Since adult pollock rarely venture                 requirements and predation pressure.
into water colder than 32°F, the cold pool historically created a
natural barrier keeping them from moving northward.                            As these changes continue, collaboration between Russian and
                                                                               U.S. scientists is key to tracking changes in pollock movements
The cold pool was the smallest ever recorded in 2018 and 2019.                 across the entire Bering Sea shelf.
In both years there were strong north/northwestward bottom
currents over the region. These currents affected the distribution
of both adult and age-1 pollock.

New research confirms that the shrinking cold pool allows for
increased mixing of the Russian and U.S. populations of pollock.
The Russian population is moving north and eastward, and the
U.S. population is moving north and westward.

In 2018 and 2019, NOAA surveys found high densities of
juvenile pollock in the southern Chukchi Sea, in both the
U.S. and Russian sectors. Russian scientists also observed

                                                 ADULTS, COLD YEARS                                                   ADULTS, WARM YEARS
                                                 In 2010, a cold year with                                            In 2017–2019, each a
                                                 a normal sized cold pool,                                            warm year with a small
                                                 adult pollock remained                                    Saint      cold pool, adults moved
                                                 further south in a narrow                               Lawrence     north of St. Lawrence Isl.
                                                 band over the outer shelf.                                 Isl.      and spread out where
              Outer

                                                                                                                      bottom temperatures were
                                                                                                                      32–43°F.
                sh
                   elf

                                    Cold pool*

*Rough outline of cold pool location in years mentioned.

                                                 AGE-1, COLD YEARS                                                    AGE-1, WARM YEARS
                                                 In 2010, when currents                                               In 2017–2019, strong north
                                                 were weaker, few juvenile                                            bottom currents allowed
                                                 pollock were observed on                                             juveniles to spread across
                                                 the south middle shelf east                                          the shelf especially to the
                                                 of St. Lawrence Isl.                                                 east. Bottom temperatures
                                                                                                                      were as high as 50°F.

Graphics adapted from NOAA Alaska Fisheries Science Center
                                                                                                                                                    8
CRAB
SNOW CRAB & THE COLD POOL                                             12   With less available cold water habitat, juvenile snow crab numbers
                                                                           dropped substantially across their range. As the barrier of the
Snow crabs need cold water, but how cold depends on the                    cold pool shrank, major crab predators like Pacific cod moved
crab’s life stage. Immature snow crabs live in cooler waters; as           northward potentially gaining access to juvenile crabs.
they mature, they migrate to slightly warmer habitat. Juvenile
snow crabs are associated with the eastern Bering Sea’s cold               Large snow crab
pool (described on page 8). This cold pool provides a thermal
                                                                           Unlike past years, in 2019, snow crabs caught in the northern
barrier protecting snow crab from major groundfish predators.
                                                                           Bering Sea included a substantial number of large crabs —
Historically, immature snow crab dominated catches in the
                                                                           including a 2000% increase in large males from 2018 to 2019. The
colder northern Bering Sea and commercial-sized (greater than
                                                                           origin of these large males remains unclear, though may indicate
3.9 inches) males were rare.
                                                                           that the adult male segment of the population is moving north.
The last NOAA snow crab surveys were conducted in 2019.                    These findings have important management implications and could
During that summer, the cold pool was smaller and water                    suggest the potential for a commercial snow crab fishery in more
temperatures were much warmer than juvenile snow crabs prefer,             northern latitudes.
but they did not appear to relocate in search of colder habitats.          NOAA continues to monitor and study snow crabs to understand
These warm temperatures may have affected juvenile survival.               how vulnerable they are to climate change.

Snow crab. Photo by Erin Fedewa - NOAA.

NORTON SOUND RED KING CRAB                                                  13

Alaska Department of Fish and Game (ADF&G) monitors the red king crab
population in Norton Sound with an annual bottom trawl survey. To estimate                                         0 miles                        30 miles
the population size, they extrapolate the number of crabs captured in the
survey across the total available habitat in Norton Sound.

ADF&G recently began a small pilot study to determine if Norton Sound red king
crab, which are smaller (max ~5.7 inches carapace length) than more southern
populations (max ~7 inches), could be effectively satellite tagged. In July 2020,
biologists placed tags on 16 legal male red king crab (greater than 4 ¾ inch                                            Nome                      Solomon
carapace width) near Nome. The tags were programmed to “pop-up”
on October 6 and 7, 2020. Once reaching the surface they
transmitted their pop-up locations as well as temperature and
depth data, which were recorded hourly while on the crab.
                                                                                                                                            (Blue) Tags
                                                                                                            ound                            placed on
CRAB POPULATION COMPOSITION                13                          (Orange) Crab
                                                                                                    to   nS                                 crab in July
                                                                       locations when          or
The graph below shows the number of male red king crabs                tags “popped-
                                                                                           N

in Norton Sound based on ADF&G’s bottom trawl surveys. In              up” in October
2020, there were 227,854 legal male crabs (blue section of                                           HOW FAR DO CRAB MOVE?                   13
bars). While this is a potential low, biologists are encouraged                                      This map shows where red king crabs were
by the high number of sublegal crab (turquoise and grey) that                                        satellite tagged in Norton Sound compared to
will become legal in 2021 and 2022.                                                                  where their tags “popped-up.” Eight of the 16
                                                  6 million crabs
                                                                                                     crabs tagged carried very accurate, usable
                                                                                                     data. After being tagged the crabs generally
                                                                                                     moved west-southwest. They experienced
                                                       3 million                                     temperatures ranging from 32.9–48.2°F and
                                                                    Legal male crabs                 were consistently in waters 62–128 feet deep.
                                                                                                     A larger study is planned for summer 2021.
                                                                    1 year away from
                                                                    being legal
                                                               0
1976           1988          2002         2014 2017     2020        2 years away
            Surveys every 3 years               annual surveys      from being legal                     Graphics adapted from Alaska Dept. of Fish & Game   9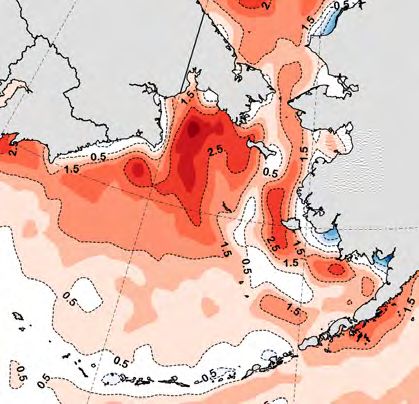
OCEAN ACIDIFICATION
WHAT IS OA?                      14                                       CASE STUDY: BRISTOL BAY RED
Cars, factories and other human activities release carbon dioxide         KING CRAB 15
into the atmosphere. About ¼ of this carbon dioxide is absorbed
by the ocean, where it reacts with seawater in a process called           Ocean acidification and climate change are expected to stress
ocean acidification. Alaska’s waters are already naturally rich in        Bering Sea king crab fisheries within the next few decades. A
carbon dioxide (because cold water holds more carbon dioxide              new study evaluated whether Bristol Bay red king crab already
than warm water) compared to many other regions of the globe.             show signs of environmental stress. Scientists compared
This means that it only takes a little added carbon dioxide to            adult crab movements with modeled ocean acidification and
create water conditions that are less favorable to shell-building         temperature from 2003-2012.
marine animals such as crabs, and can cause stress to other               Normally, crab move to avoid cool temperatures, and this study
marine animals. Because of this, the Bering Sea is vulnerable to          explored whether they also move based on ocean acidification.
ocean acidification.                                                      Scientists found that temperature and ocean acidification often
                                                                          change together (cold water tends to be more acidic), making it
Patterns in the Bering Sea                                                hard to see if ocean acidification impacts crab movements. It is
Scientists use a combination of water samples and computer                good news that ocean acidification did not separately influence
modeling to explore how ocean chemistry changes seasonally                crab behavior. This means that red king crab have some protection
and from year to year. Samples gathered by ships have previously          against current ocean acidification levels. Since crab prefer
identified hotspots in the Bering Sea that are already corrosive          warmer waters, they naturally avoid the most corrosive conditions.
with respect to some minerals that marine organisms use to build          Larval and juvenile red king crab are more sensitive to acidified
their shells. The bottom waters of deeper regions like the middle         waters and are less mobile than adults. For now, scientists
and outer shelves are relatively more acidic, while bottom waters in      don’t know whether young red king crab can avoid unfavorable
shallower nearshore areas are relatively less acidic.                     conditions or adapt to changing ocean chemistry. More research
Scientists are now developing a way to forecast how acidic Bering         is needed to understand the true extent that red king crab are
Sea conditions will be over the coming 4–5 months. These                  resilient to ocean acidification.
experimental forecasts will be made each spring for late summer
water conditions and compared to observed ship-based water
samples collected every other year.
                                                                           Red King Crab. Photo by NOAA
Learn more about Ocean Acidification at https://aoos.org/
alaska-ocean-acidification-network/.

NORMAL OCEAN ACIDIFICATION PATTERN                        14           OCEAN ACIDIFICATION IN 2020         14

This map shows modeled ocean acidification conditions                  This map shows how different 2020 was compared to the
from 2003–2019 in July to September. There is usually more             2003–2019 average (left map). In the 2020 map, the dark
corrosive (yellow on map) bottom water in the middle and               red on the outer Bering Sea shelf means conditions were
outer shelf of the Bering Sea, and less corrosive water along          more corrosive than normal. Few areas were less corrosive
the shallower, inner shelf closer to Alaska’s coastline (blue).        than normal (blue).
More corrosive for                                                     More corrosive than
shelled organisms                                                      2003–2019

                                         Inn
                                   Mi        er
                                     dd          sh
                       Ou              l e          elf
                          ter              s he
                              sh                lf
                                 elf

                                                                                                                 Graphics adapted from
                                                                                                                 NOAA Pacific Marine
                                                                                                                 Environmental Laboratory
Less corrosive to                                                      Less corrosive
shelled organisms                                                      than 2003–2019                                                       10
PLANKTON
MARINE FOOD WEB
Phytoplankton are the base of the marine food web. Like plants on
land, phytoplankton use chlorophyll to carry out photosynthesis,
capturing sunlight and carbon dioxide to produce energy.
Phytoplankton feed zooplankton, like the tiny copepod in this
photo. Zooplankton feed the rest of the food web.
A copepod (zooplankton) species found in
Bering Sea. Photo by Russell Hopcroft.
PHYTOPLANKTON 18 Coccolithophores are a type of phytoplankton covered in calcium
carbonate (chalk). 2020’s coccolithophore bloom over the
There was less chlorophyll, indicating lower biomass of middle shelf was much larger than in recent years. This type of
phytoplankton, in most of the eastern Bering Sea during 2020 bloom clouds the water, making it difficult for visual predators like
than in 2019. Satellite data suggest that chlorophyll has been fish and seabirds to find food. The small size of coccolithophores
below average since at least 2016 over the southeastern shelf, may also make them a less desirable food item for zooplankton.
except on the outer continental shelf where it was above average
in 2020. Low chlorophyll could mean the Bering Sea was less Combined, these indicators suggest that the prey base in
productive and/or there was more grazing by zooplankton. the eastern Bering Sea during 2020 was limited and/or poor
quality. As a result there may have been less energy available to
When conditions are right, phytoplankton populations can grow juvenile fish, seabirds and other marine organisms.
explosively, a phenomenon known as a bloom. The timing of the
2020 peak spring bloom over the southern shelf was about a
week earlier than average.
September 2017 September 2018 September 2019 September 2020
COCCOLITHOPHORES 19
The maps to the right show the
coccolithophore bloom over the
middle Bering Sea shelf from
2017–2020.
Graphics adapted
from NOAA Pacific
Environmental Laboratory
ZOOPLANKTON 20
Phytoplankton and zooplankton make up the most biomass in the ocean and play a necessary role in providing energy to
other marine organisms. Monitoring zooplankton provides an important indicator to evaluate the health of the Bering Sea and
detect changes in the ecosystem. Zooplankton surveys over the southern Bering Sea shelf have been conducted each spring
since 1996, and each late-summer since 1998.
Spring surveys Late-summer
Type of surveys ZOOPLANKTON SURVEY TRENDS 20
zooplankton
Large copepods vary considerably from
Large year-to-year, especially in late summer. Small
copepods copepods do not vary as much. Euphausiids
(e.g. krill) are more abundant and vary more
in spring than in late-summer when their
abundance is very low. This low euphausiid
Small abundance in summer might be because they
copepods
have become adults and are good at avoiding
sampling gear.
Only large copepods in late summer appeared
to correspond to “warm” or “cold” periods.
Euphausiids
Graphics adapted from NOAA Alaska
(e.g. krill)
1996 2004 2012 2019 1998 2004 2012 2019
Fisheries Science Center
11HARMFUL ALGAL BLOOMS
WHAT ARE HABS? 16
In general, more phytoplankton means more food and oxygen for everything
else in the ocean, but occasionally plankton blooms are hazardous to human or
marine life. These are known as harmful algal blooms or HABs. As waters warm 2020 SAMPLE LOCATIONS 17
throughout Alaska, HAB events may increase in frequency and geographic extent. This color-coded map shows
where HAB events occurred or
Although many research cruises scheduled for 2020 were canceled due ships gathered samples in 2020.
to COVID-19, offshore sampling for HABs was conducted during three
cruises. Samples collected during these cruises will be analyzed for the September
presence of the two most common and impactful types of algae: NOAA personnel on the vessel
1. Alexandrium — can produce saxitoxins which cause Oscar Dyson collected surface
paralytic shellfish poisoning that affects humans and and underwater HAB samples in
animals. the Bering Sea.
2. Pseudo-nitzschia — can produce the neurotoxin October
domoic acid which causes amnesic shellfish Maryland Center for Environmental
poisoning that affects humans and animals. Science aboard the R/V
Norseman II collected sediment
plugs to look for Alexandrium
HAB coordination catenella at 29 stations.
Monitoring and adaptation can reduce human and
wildlife health risks associated with HABs. Over the Mid-October
Woods Hole Oceanographic
past five years, regional programs have expanded. Tribal, Institute aboard R/V Sikuliaq
agency and university entities now provide HAB testing 16 Animals – In the
northern Bering Sea and Bering collected HAB samples while
and help alert shellfish harvesters and researchers of Strait, samples were collected sailing north to the Chukchi and
potential blooms to reduce human health risk. from more than 70 animals Beaufort Seas, they also gathered
including marine mammals, fish, water samples in the Bering Strait.
All of these entities are partners in the Alaska Harmful clams, birds, and krill. Results Few Alexandrium were observed
Algal Bloom Network which was formed in 2017 to are not yet available. that late in the season, but
Pseudo-nitzschia was found even
provide a statewide approach to HAB awareness,
under the sea ice in the Beaufort
research, monitoring and response in Alaska. Sea.
Graphic adapted from Woods Hole
See current alerts and learn more about harmful Oceanographic Institute
algal blooms at http://aoos.org/alaska-hab-network/.
Summer 2020 – Aleut Community July 2020 – In Unalaska, 16
of St Paul Tribal Government Ecosystem consumption of blue mussels and
Conservation Office began sampling limpets snails resulted in a fatality. A sample
and water for HABs on Saint Paul Island. of the blue mussels in the area was
140 times the regulatory limit, while
the snails were 3 times the limit.
16 September – A high toxicity HABs
event along Russia’s Kamchatka Peninsula caused
a major die off of octopus, seals, and other animals.
People surfing and/or swimming in the area
experienced sickness and corneal (eye) burns.
16 Summer 2020 – High toxicity HAB events occurred at both ends of the Aleutian
archipelago causing unprecedented levels of paralytic shellfish toxins in shellfish.
Weekly shellfish samples were taken in 17 locations throughout the Aleutian and
Alaska Peninsula region, results are being analyzed. 12GRAY WHALES STRANDING LOCATIONS
From 2019–2020, 388 gray whales stranded
21
along their 12,500 mile migration route from
UNUSUAL MORTALITY EVENT 21 Alaska to Mexico. Fifty fewer strandings were
reported in 2020 (orange bars on map) compared
The gray whale unusual mortality event (UME) declared in 2019 continued. to 2019 (blue bars on map) in the US and
Canada. Strandings increased slightly in Mexico.
In 2020, fewer strandings were reported in the Chukchi Sea possibly because
Graphic adapted from NOAA Fisheries Alaska Region
COVID-19 precautions prevented aerial surveys of Arctic marine mammals. In
2019, the aerial surveys found eight of the 48 Alaska stranding. The geographic Summer
isolation of carcasses and decreased response capability due to COVID-19 also feeding
prevented any necropsies in Alaska during 2020. grounds
48 strandings
Population decline in 2019
The population of gray whales that migrates from Alaska to Mexico has declined 45 strandings
about 24 percent since 2016. A similar 23 percent decline occurred after an in 2020
unusual mortality event 20 years ago, from 1999–2000. The gray whale population
rebounded following that previous UME to greater numbers than before. These
large-scale fluctuations are not rare. The declines represent short-term events that,
migration route
in the past, have not significantly impacted the long-term population status.
POPULATION SIZE 22
This graph shows how gray whale 30,000 gray Canada
whales in the
population size and the number of calves population 11
born each year dropped during the 2019
and 1999 unusual mortality events. 5
n
latio
Graphic adapted from opu
ale p
NOAA Southwest
ray wh
Fisheries Science G Washington
Center
34
15,000 whales
UME UME Oregon 13
1999–2000 2019–present
1,500 calves 6
born annually Gray whale calves 3
born each year
750 calves California
Photo by NOAA *2020 calf count 34
0 * 0 canceled due to
1994 2000 2010 2020 COVID-19. 18
Poor body condition
Mexico
The cause of the UME is still under investigation, however, a new study 23 by a research group from Aarhus
81
University used Unoccupied Aerial Vehicles (aka drones) to photograph and measure over 500 gray whales
on their wintering grounds in Mexico. Calves, juveniles and adults all had lower body condition in 2018 and 87
2019 compared to 2017. The study suggests that poor feeding conditions may have contributed to the UME.
The underlying factors that caused this reduction in body condition are still unknown. Since gray whales
in 2018 and 2019 arrived on their Mexican breeding grounds already in poor condition, the decline likely
occurred either during the previous feeding season in Alaska and/or during the southbound migration. Winter mating &
calving grounds
REPORT dead, injured or
stranded marine mammals
to NOAA’s stranding hotline
(877-925-7773) or through
regional channels like Alaska
Sea Grant (907-434-1149).
A gray whale mother and
calf. Photo by NOAA. 13ICE SEALS 24
Since June 2018, elevated numbers of bearded, ringed and spotted Stebbins surveyed beaches. Opportunistic reports were provided
seals have washed up dead along the Bering and Chukchi coasts. by community members from Elim, Gambell, Golovin, Kivalina,
NOAA classified the strandings as an Unusual Mortality Event. Point Hope, Shaktoolik, Shishmaref, Nome and Utqiaġvik.
In 2020, the number of reported strandings returned to a more See the bottom of page 13 for information on reporting stranded
‘typical’ number of ice seals. Although COVID-19 may have marine mammals.
limited some reporting, people across the region helped
search for stranded seals. Community members in
ICE SEAL STRANDINGS 24
Kotlik, Kotzebue, Nome and
180 180 ice seal
strandings
160
Unidentified
140
Spotted seals
120
Ringed seals
100
90 Bearded seals
80
60
40
A satellite tag on a spotted seal. Photo by NOAA. 20
0 0
2018 2019 2020
2018 2019 2020
Graphics adapted from NOAA Fisheries
MARINE DEBRIS 25 bearded ringed spotted uni denti fied
Starting in July 2020, unusual amounts of marine debris washed Planning for the future
up in communities across the Bering Strait region. The beverage
NOAA is working collaboratively with regional partners and
bottles, food containers, personal product containers, household
responding organizations to find the best way to support immediate
aerosol cans and chemical cleaners were predominantly foreign
removal, disposal and monitoring during future incidents.
in manufacture, with Russian and Korean labeling on many items.
This includes coordinating with government organizations
These were intermixed with items associated with fishing industry
and international groups to identify appropriate international
activities, such as deck boots, bucket liner bags and longline
government-to-government and industry channels for identifying
equipment.
the sources of debris and preventing future events, and capturing
Since the arriving debris appeared to be roughly similar age, these in a report on the event and the response.
type, and contained fresh fruits and vegetables, the best
REPORT marine debris to NOAA, incident.debris@noaa.gov, or
estimate indicates a point source release, such as accidental
through regional channels like Alaska Sea Grant (907-434-1149)
loss or intentional dumping from a vessel. NOAA used hindcast
or Kawerak Inc. (907-443-4265).
modeling to help identify the most likely locations where the
debris could have entered the ocean. Based on wind and current
patterns in late July, the model indicates debris most likely
originated southwest of St. Lawrence Island. DEBRIS SIGHTINGS
Shishmaref August 9, 31,
Coastal residents raised critical
September 2, 3, 9
awareness and reported debris
Little Diomede August 14, sightings. This map shows when
September 11 Wales August 8, debris associated with the July
September 21 point source incident washed up
Port Clarence in specific communities.
August 10
Nome July 30, August 14, 24,
September 20
Gambell July 30 & August 3
Unalakleet August 2
Photo of marine debris clean-up from the point Savoonga July 27 & August 3,
source incident in 2020. Photo by Kawerak. September 17 14SEABIRDS 26
2020 SEABIRD CARCASS LOCATIONS 27
Larger bubbles mean more carcasses. Colors show months.
May (8 carcasses) August (76 carcasses)
The US Fish and Wildlife Service was unable to conduct most of their June (87 carcasses) 41% Murres
63% Horned puffins 29% Northern fulmars
seabird research in the eastern and northern Bering Sea in 2020 due to 16% Short-tailed
COVID-19 travel restrictions. One month-long offshore survey provided 9% Murres
7% Short-tailed shearwaters shearwaters
information on at-sea distribution of seabirds. Otherwise, content from September (28 carcasses)
July (~170 carcasses)
this page came exclusively from the 2020 Ecosystem Status Report and 47% Horned/tufted puffins 55% Crested auklets
32% Murres 45% Puffins
highlights efforts by coastal community members, Tribal governments and
state/university scientists. What information is known about the status of 5% Black-legged Kittiwakes October (2 carcasses)
seabirds in the region during 2020 is due, in large part, to their efforts.
100
The at-sea surveys found fairly average abundances of seabirds. However,
short-tailed shearwater, a long-distance migrant which doesn’t breed in
Alaska, was particularly abundant and widespread. While in Alaska, the
shearwaters feed primarily on euphuasiids, suggesting these prey were widely 50
available in late August – late September of 2020. There were slightly below
average densities of murres, kittiwakes and auklets.
10
Die-off less severe 2
The seabird die-off that began in 2016 continued in 2020, but was much less severe
than in the previous few years. Over 330 seabird carcasses were reported from the
Bering Sea, with most found in the Bering Strait region. In the Bering Strait region,
Tribal, State and Federal partners collected 25 seabird carcasses for examination,
disease and harmful algal bloom testing. The carcasses tested negative for Avian
Influenza. Eighteen received necropsies and the cause of death was determined to be
emaciation. Concentration of saxitoxin in tissues was below detection levels.
REPORT sick or dead birds to US Fish and Wildlife Service (1-866-527-3358, Graphic adapted with permission from Coastal
ak_mbm@fws.gov) or through regional channels. Participate in monitoring your Observation and Seabird Survey Team
local beach for seabirds and marine debris as part of the Coastal Observation and
Seabird Survey Team, which provides training. Visit www.coasst.org.
PRIBILOF ISLANDS 28 NORTHERN BERING SEA 29
Pribilof Islands environmental professionals, known as the Island 2020 St. Lawrence Island seabird data were collected by Punguk
Sentinels, provided the only available seabird breeding data in Shoogukwruk and Jason Annogiyuk, both residents of Savoonga.
2020. Their observations suggest that it was an average, to slightly
Species 2020 reproductive success Food
below average, year for most fish-eating seabird species (black-
legged kittiwakes, common murres). Plankton-eating species Least auklet (Chicks hatched 1 week early) Low. Mostly
Many chicks left nests before fully zooplankton
(least auklets) have been declining in the Pribilof Islands in recent
grown, seen wandering inland and
years, and 2020 continued that trend, at least on St. Paul Is. in ponds. Suggests chicks began
There was a complete lack of parakeet auklets on St. Paul Is. This is starving late in chick rearing period.
troubling because the population was estimated at over 30,000 Crested (Chicks hatched 1 week early) After
birds in the past and they were among the most abundant auklet auklet complete failure in 2018/2019, 2020’s
species on the Island since monitoring began in success was similar to 2016/2017, but
the late 1970s. lower than 2000–2004.
Common Declined compared to 2019 and 2017. Mostly
An environmental professional from St. George murre pelagic fish
Island reported that birds returned to the island Thick-billed Declined compared to 2017 and 2019
at the usual time. Colony abundance was murre (Fewer birds seen at the breeding
typical with good attendance throughout colony than 2019, numbers declining
the summer. since large 2018 die-off).
Black- Consistently low since 2017, but
legged- dropped even lower in 2020.
kittiwakes
Murres and a gull. Photo by Gary Drew US Geological Survey. 15WANT TO LEARN MORE?
# Use this page and the orange circles found throughout the 13 Jenefer Bell, Alaska Department of Fish & Game,
report to find an expert to whom you can send questions about each jenefer.bell@alaska.gov
topic. Each expert is followed by the data or information sources
Ocean acidification
for that item. The information throughout this report was gathered
14* Darren Pilcher, CICOES and NOAA Pacific Marine Environmental
from many sources. Individuals and organizations shared some
Laboratory, darren.pilcher@noaa.gov [From: Eastern Bering Sea
preliminary data from surveys or other activities, while other sections
Ecosystem Status Report, p 39]
were summarized based on scientific papers or published reports.
15* Esther Kennedy, University of California Davis, egkennedy@ucdavis.
Sections using the NOAA Ecosystem Status Reports are denoted by edu [From: Eastern Bering Sea Ecosystem Status Report, p 41]
* and **. Below is contact information for the editor of each report. Harmful algal blooms
See orange numbers for an expert who contributed to that part of the 16** Thomas Farrugia, Alaska Harmful Algal Bloom Network,
Ecosystem Status Report and can answer specific data questions. farrugia@aoos.org [From: Aleutian Islands Ecosystem Status Report,
p 77]
*Siddon, E.C. 2020. Ecosystem Status Report 2020: Eastern Bering
Sea, Stock Assessment and Fishery Evaluation Report, North 17 Don Anderson, Woods Hole Oceanographic Institute,
Pacific Fishery Management Council, 1007 West Third, Suite 400, danderson@whoi.edu
Anchorage, Alaska 99501. Contact: elizabeth.siddon@noaa.gov. Plankton
**Ortiz, I. and Zador, S. 2020. Ecosystem Status Report 2020: 18* Lisa Eisner & Jens Nielsen, NOAA Alaska Fisheries Science
Aleutian Islands, Stock Assessment and Fishery Evaluation Report, Center, lisa.eisner@noaa.gov & jens.nielsen@noaa.gov [From:
North Pacific Fishery Management Council, 1007 West Third, Suite Eastern Bering Sea Ecosystem Status Report, p 74]
400, Anchorage, Alaska 99501. Contact: ivonne.ortiz@noaa.gov. 19* Phyllis Stabeno, NOAA Pacific Marine Environmental Laboratory,
phyllis.stabeno@noaa.gov [From: Eastern Bering Sea Ecosystem
Status Report, p 79]
Climate update
Rick Thoman, Alaska Center for Climate Assessment and Policy, 20* David Kimmel, NOAA Alaska Fisheries Science Center,
University of Alaska Fairbanks, rthoman@alaska.edu [Data source: david.kimmel@noaa.gov [From: Eastern Bering Sea Ecosystem
1 National Snow & Ice Data Center Sea Ice Index, V3; 2 NOAA/PSL/ Status Report, p 82]
ESRL; 3 NOAA/NCEI & National Weather Service] Gray whales
Storms 21 Mandy Keogh, NOAA Fisheries Alaska Region,
4 John Walsh, International Arctic Research Center, University mandy.keogh@noaa.gov [From: https://bit.ly/3thZ3pA]
of Alaska Fairbanks, jewalsh@alaska.edu [From: Redilla, K., et. 22 Dave Weller, NOAA Southwest Fisheries Science Center,
al. (2019). Wind climatology for Alaska: historical and future. dave.weller@noaa.gov [From: https://bit.ly/3pNUYax]
Atmospheric and Climate Sciences] 23 Fredrik Christiansen, Aarhus University, f.christiansen@aias.au.dk
Rick Thoman, Alaska Center for Climate Assessment and Policy, [From: Christiansen, F., et al. (2021). Poor body condition associated
University of Alaska Fairbanks, rthoman@alaska.edu [5 UAF/IARC/P. with an unusual mortality event in gray whales. Marine Ecology
Bieniek; 6 Data source: ERA5 courtesy of ECMWF/Copernicus] Progress Series]
Storm impacts Ice seals
Jacquelyn Overbeck, Alaska Department of Natural Resources, 24 Mandy Keogh, NOAA Fisheries Alaska Region,
jacquelyn.overbeck@alaska.gov [From: 7 Overbeck, J.R., et al. 2020, mandy.keogh@noaa.gov [From: https://bit.ly/2YFmaMX]
Shoreline change at Alaska coastal communities: Alaska Division of Marine debris
Geological & Geophysical Surveys Report of Investigation 2020; 8 25* Peter Murphy, NOAA Marine Debris Program,
https://aoos.org/alaska-water-level-watch/] peter.murphy@noaa.gov; Gay Sheffield, Alaska Sea Grant,
Salmon ggsheffield@alaska.edu [From: Eastern Bering Sea Ecosystem
9 Kathrine Howard, Alaska Department of Fish & Status Report, p 36]
Game, kathrine.howard@alaska.gov Seabirds
10 Sabrina Garcia, Alaska Department of Fish & 26* Robb Kaler & Kathy Kuletz, US Fish and Wildlife Service, robert_
Game,sabrina.garcia@alaska.gov kaler@fws.gov and kathy_kuletz@fws.gov [From: Eastern Bering Sea
Walleye pollock Ecosystem Status Report, p 114]
11 Lisa Eisner, NOAA Alaska Fisheries Science Center, 27* Jackie Lindsey & Tim Jones, Coastal Observation & Seabird
lisa.eisner@noaa.gov [From: Eisner, L. B., et al. (2020). Survey Team, coasst@uw.edu [From: Eastern Bering Sea Ecosystem
Environmental impacts on walleye pollock (Gadus chalcogrammus) Status Report, p 114]
distribution across the Bering Sea shelf. Deep Sea Research Part II: 28* Lauren Divine, Aleut Community of St. Paul Island,
Topical Studies in Oceanography. https://bit.ly/3jfZWKP] lmdivine@aleut.com
Crab 29* Alexis Will, University of Alaska Fairbanks, awill4@alaska.edu
12 Erin Fedewa, NOAA Alaska Fisheries Science Center, [From: Eastern Bering Sea Ecosystem Status Report, p 114]
erin.fedewa@noaa.gov [From: https://bit.ly/2Lgk96B]
www.beringregionoceandata.org
@BeringRegionOceanUpdate (907) 644-6756 beringregion@aoos.orgYou can also read