A subset of CB002 xanthine analogs bypass p53-signaling to restore a p53 transcriptome and target an S-phase cell cycle checkpoint in tumors with ...
←
→
Page content transcription
If your browser does not render page correctly, please read the page content below
RESEARCH ARTICLE

                                     A subset of CB002 xanthine analogs
                                     bypass p53-signaling to restore a p53
                                     transcriptome and target an S-phase cell
                                     cycle checkpoint in tumors with mutated-
                                     p53
                                     Liz Hernandez Borrero1,2,3,4,5, David T Dicker1,2,3,4,5, John Santiago3,
                                     Jennifer Sanders2,3,5,6, Xiaobing Tian1,2,3,4,5, Nagib Ahsan7, Avital Lev2,3,4,
                                     Lanlan Zhou1,2,3,4,5, Wafik S El-Deiry1,2,3,4,5,8*
                                     1
                                       Laboratory of Translational Oncology and Experimental Cancer Therapeutics, The
                                     Warren Alpert Medical School, Brown University, Providence, United States; 2The
                                     Joint Program in Cancer Biology, Brown University and the Lifespan Health System,
                                     Providence, United States; 3Department of Pathology and Laboratory Medicine, The
                                     Warren Alpert Medical School, Brown University, Providence, United States;
                                     4
                                       Molecular Therapeutics Program, Fox Chase Cancer Center, Philadelphia, United
                                     States; 5Cancer Center at Brown University, The Warren Alpert Medical School,
                                     Brown University, Providence, United States; 6Department of Pediatrics, The
                                     Warren Alpert Medical School, Brown University, Providence, United States;
                                     7
                                       COBRE Center for Cancer Research Development, Proteomics Core Facility, Rhode
                                     Island Hospital, Providence, United States; 8Hematology-Oncology Division,
                                     Department of Medicine, Rhode Island Hospital and Brown University, Providence,
                                     United States

*For correspondence:
                                     Abstract Mutations in TP53 occur commonly in the majority of human tumors and confer
wafik@brown.edu                      aggressive tumor phenotypes, including metastasis and therapy resistance. CB002 and structural-
                                     analogs restore p53 signaling in tumors with mutant-p53 but we find that unlike other xanthines
Competing interest: See              such as caffeine, pentoxifylline, and theophylline, they do not deregulate the G2 checkpoint. Novel
page 19
                                     CB002-analogs induce pro-apoptotic Noxa protein in an ATF3/4-dependent manner, whereas
Funding: See page 19                 caffeine, pentoxifylline, and theophylline do not. By contrast to caffeine, CB002-analogs target an
Received: 17 May 2021                S-phase checkpoint associated with increased p-RPA/RPA2, p-ATR, decreased Cyclin A, p-histone
Accepted: 09 June 2021               H3 expression, and downregulation of essential proteins in DNA-synthesis and DNA-repair. CB002-
Published: 29 July 2021              analog #4 enhances cell death, and decreases Ki-67 in patient-derived tumor-organoids without
                                     toxicity to normal human cells. Preliminary in vivo studies demonstrate anti-tumor efficacy in mice.
Reviewing editor: Mone Zaidi,
                                     Thus, a novel class of anti-cancer drugs shows the activation of p53 pathway signaling in tumors
Icahn School of Medicine at
                                     with mutated p53, and targets an S-phase checkpoint.
Mount Sinai, United States
   Copyright Hernandez Borrero
et al. This article is distributed
under the terms of the Creative
Commons Attribution License,
                                     Introduction
which permits unrestricted use       Tumor suppressor p53 responds to cell stress signals from DNA damage, oncogene activation, oxi-
and redistribution provided that     dative stress, and hypoxia. Upon activation by posttranslational modifications and oligomerization,
the original author and source are   p53 signals cell cycle arrest, apoptosis, or DNA repair, according to the extent of the cellular stress,
credited.                            thereby controlling cell fate and preventing tumorigenesis (Riley et al., 2008). Thus, it is not

Hernandez Borrero et al. eLife 2021;10:e70429. DOI: https://doi.org/10.7554/eLife.70429                                               1 of 21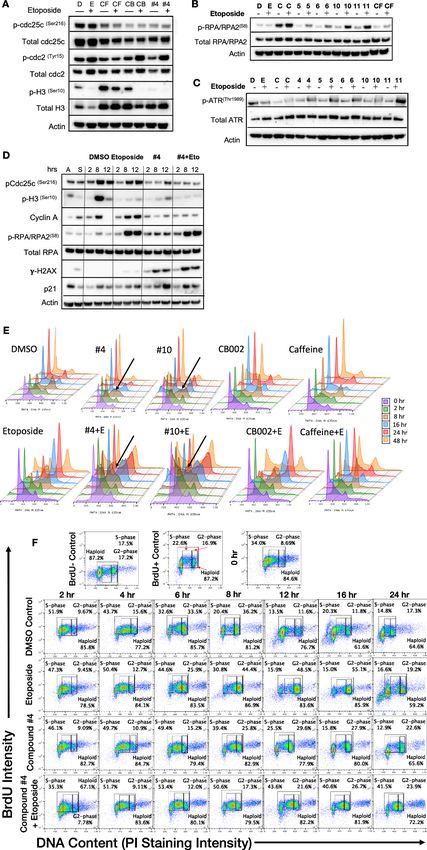
Research article                                                               Biochemistry and Chemical Biology Cancer Biology

                                   surprising that TP53 is the most commonly mutated gene (TCGA, 2020), including in ovarian, colo-
                                   rectal, esophageal, head and neck, lung, and pancreatic cancers that are the most affected sporadic
                                   human cancer types (Olivier et al., 2010). TP53 is mutated in over 50% of human cancers and the
                                   other 50% involve a biological inactivation of its signaling pathway. Like other tumor suppressors,
                                   the mutated p53 protein results in loss-of-function but oligomerization can act in a dominant-nega-
                                   tive fashion with regard to the remaining wild-type p53 allele. Unlike other tumor suppressors,
                                   mutant p53 protein can also acquire a gain-of-function which contributes to aggressive tumor phe-
                                   notypes, including enhanced invasion, genomic instability, and therapy resistance (Muller and Vous-
                                   den, 2014; Dittmer et al., 1993; Lang et al., 2004; Xu et al., 2011). Consequently, patients whose
                                   tumors carry p53 mutations have a poor prognosis and decreased overall survival (Wattel et al.,
                                   1994).
                                      A common feature of cancer cells is genomic instability due to ineffective cell cycle checkpoint
                                   responses. Genomic instability is not necessarily due to defective checkpoints. The checkpoints may
                                   be intact but the repair may be deficient. Upon DNA damage, the normal cell cycle checkpoint
                                   response is to arrest the cell at the G1-phase. In cancer cells, the majority have an ineffective
                                   G1 checkpoint due to p53 mutation but retain a functional G2 checkpoint and thus have the ability
                                   to undergo cell arrest at the G2-phase. Cancer cells depend on bypassing intra-S-phase and G2/M
                                   checkpoints for unrestrained cell proliferation. Stress signal transduction in the p53 pathway is initi-
                                   ated by activation of kinases ataxia-telangiectasia-mutated (ATM), ataxia telangiectasia and
                                   Rad3 (ATR)-related, and downstream checkpoint kinases Chk1/2 that serve as signaling sensors and
                                   mediators of p53 activation. It has been a long-standing dogma that ATM/Chk2 and ATR/Chk1 are
                                   independently activated but recent studies provide evidence of cross-talk between the kinases
                                   (Brown and Baltimore, 2003; Abraham, 2001; Smith et al., 2010). Chk1/2 are kinases that partici-
                                   pate in cell cycle checkpoint control, with Chk1 being active in S-phase and G2-phase, whereas
                                   Chk2 is active throughout the cell cycle (Smith et al., 2010; Zhao and Piwnica-Worms, 2001;
                                   Chehab et al., 2000).
                                      Accumulation of genomic aberrations over time renders cancer cells vulnerable to checkpoint tar-
                                   geting therapy. Since the discovery of checkpoint targets, small molecule inhibitors have been pur-
                                   sued in combination with ionizing radiation and chemotherapy agents in order to deregulate
                                   checkpoints, thereby leading to cancer cell death. For example, combination of caffeine, a xanthine
                                   derivative, with irradiation or chemotherapy agents was found to deregulate the G2 checkpoint
                                   through ATM/ATR inhibition leading to therapy sensitization and enhanced cell death (Russell et al.,
                                   1995; Sarkaria et al., 1999). Nonetheless, translational cancer therapeutics studies were discontin-
                                   ued due to unachievable active concentrations in human plasma (Lelo et al., 1986). Thus, for the
                                   past two decades, the field has focused on the development of Chk1/2 inhibitors, which are in clini-
                                   cal trials (Fracasso et al., 2011; Huang et al., 2012; Rogers et al., 2020).
                                      Another cancer therapeutic approach we and others have pursued involves restoration of p53
                                   pathway signaling in tumors with mutant p53 or tumors that are null for p53. Despite efforts to
                                   restore the p53-pathway, to date, there are no FDA-approved drugs that functionally restore the
                                   p53 in tumors with mutated p53. We previously reported a p53-pathway restoring compound
                                   CB002 whose mechanism of action was not fully elucidated. We showed that CB002 leads to apo-
                                   ptotic cell death mediated by p53 target Noxa, a pro-apoptotic protein (Hernandez-Borrero et al.,
                                   2018). Here, we further evaluated more potent CB002-analog compounds and uncovered a unique
                                   mechanism of action suggestive of a novel class of anti-cancer drugs. Based on their molecular struc-
                                   ture as xanthine derivatives, the novel class of CB002-analogs, unlike caffeine and other established
                                   xanthine derivatives, do not deregulate the G2 checkpoint. By contrast, the novel CB002-analog xan-
                                   thines perturb S-phase and more importantly they restore the p53-pathway, a property not found
                                   with caffeine, pentoxifylline, and theophylline. We sought to characterize and define the new class of
                                   small molecules with anti-tumor properties by transcriptomic and proteomic analysis.

Hernandez Borrero et al. eLife 2021;10:e70429. DOI: https://doi.org/10.7554/eLife.70429                                             2 of 21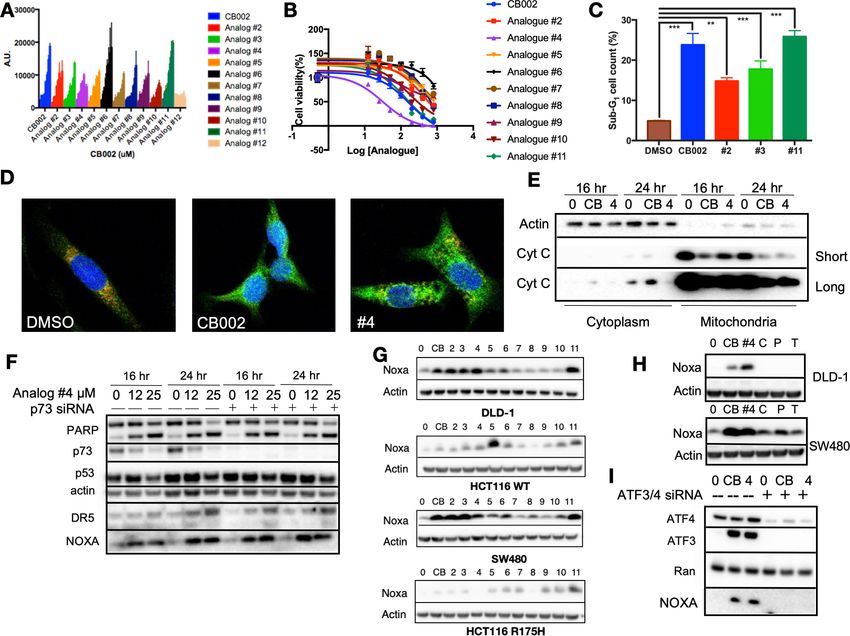
Research article                                                               Biochemistry and Chemical Biology Cancer Biology

                                   Results
                                   CB002 and structural analogs restore the p53 pathway independently
                                   of p53, while xanthines such as caffeine, pentoxifylline, and
                                   theophylline do not
                                   We sought to identify more potent analogs of parental xanthine compound CB002. We tested
                                   CB002-analogs in the ChemBridge library for the capability to induce the luciferase activity using a
                                   p53-regulated luciferase reporter stably expressed in the SW480 colorectal cancer cell line and also
                                   determined the IC50 values for the compounds by a CellTiter glow cytotoxicity assay (Figure 1A–B,
                                   Figure 1—figure supplement 1). The majority of the CB002-analogs tested, with the exception of
                                   analog #12, enhanced p53-reporter activity in a dose-dependent manner within a range of com-
                                   pound concentrations from 0 to 600 mM. We investigated the capability of a set of the CB002-ana-
                                   logs to induce apoptosis as indicated by Propidium Iodide (PI) staining sub-G1 population. As shown
                                   in Figure 1C, the treatment of tumor cells with CB002-analogs at an IC50 concentration (100 mM)
                                   resulted in a significant increase in sub-G1 content in SW480 cells. Moreover, the most potent
                                   CB002-analog #4 was found to increase cleaved-PARP and cytochrome C release from the mitochon-
                                   dria to the cytosol providing further evidence for apoptosis induction in SW480 tumor cells
                                   (Figure 1D–E, Figure 1—figure supplement 2). We investigated whether the p53-family member
                                   p73 may be a mediator of apoptosis and responsible for inducing p53 transcriptional targets by
                                   CB002-analogs.

                                   CB002 and structural analogs induce Noxa in an ATF3/4-dependent
                                   manner, independent of p73
                                   As we previously showed for CB002 (19), p53-targets Noxa and DR5 were induced independently of
                                   p73 and PARP cleavage occurred despite effective p73 knockdown in CB002-analog #4 treated
                                   SW480 tumor cells (Figure 1F). Our previously published CB002 data indicated that Noxa plays a
                                   key role in mediating CB002-induced apoptosis (19). Thus, we sought to determine if CB002-analogs
                                   induce Noxa expression in four human colorectal cancer cell lines. In DLD-1 (p53S241F), SW480
                                   (p53R273H,P309S), HCT116(p53WT), and HCT116 p53 / tumor cells expressing the exogenous R175H
                                   p53 mutant, Noxa protein expression was found to be induced, though some variation across cell
                                   lines was observed (Figure 1G). As these CB002-analogs are xanthine derivatives, we investigated
                                   whether other known xanthine derivatives, that is, caffeine, pentoxifylline, and theophylline can
                                   induce Noxa expression. However, we found that only the p53-pathway restoring CB002-analog xan-
                                   thine compounds and not caffeine, pentoxifylline, and theophylline, induce Noxa protein expression
                                   (Figure 1H). Since Noxa can be transcriptionally activated independently of p53, we sought to
                                   explore other transcription factors involved in Noxa induction. We performed a knockdown of inte-
                                   grated stress response transcription factors ATF3/4 on SW480 cells. Knockdown of ATF3/4 upon
                                   treatment with 100 mM CB002 or 25 mM CB002-analog #4 abrogated Noxa protein induction
                                   (Figure 1I). Hence, our data suggests that ATF3/4 play a role in regulating Noxa expression.

                                   CB002-analog #4 treatment of human tumor cells enriches for cell cycle
                                   genes in addition to genes involved in the p53-pathway including
                                   apoptosis, indicating p53-pathway functional restoration
                                   In order to understand how the CB002-analog molecules restore the p53-pathway, we performed a
                                   transcriptomic and proteomic analysis in SW480 cells treated with analog #4. Raw data from
                                   the transcriptomic and proteomic analysis can be found in Supplementary file 1 and
                                   Supplementary file 3, respectively. To verify the quality of our transcriptomic data, the principal
                                   component (PC) plot was obtained. PC plots show that the factor with most variability within the
                                   samples was the difference between control and treatment (Figure 2—figure supplement 1A–C).
                                   Significant differentially expressed genes (DEGs) were defined by a false discovery rate (FDR)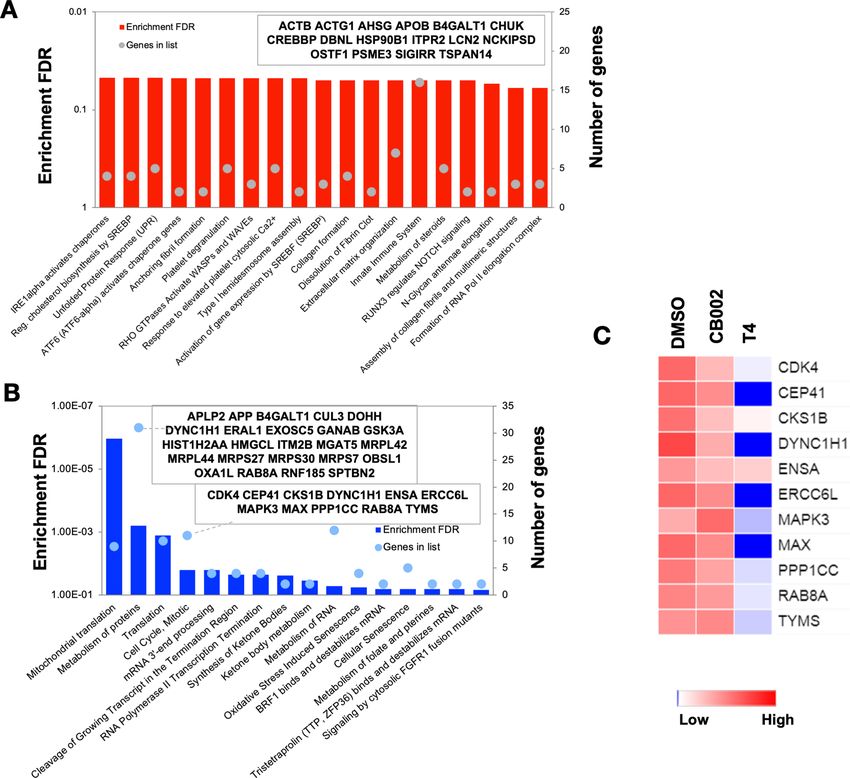
Research article                                                                       Biochemistry and Chemical Biology Cancer Biology

Figure 1. CB002 and structural analogs restore the p53 pathway, whereas other xanthines caffeine, pentoxifylline, and theophylline do not. CB002
structural analogs activate p53 reporter gene activity in SW480 cells in a dose-dependent manner (6 hr) (A). Therapeutic indices for CB002-structural
analogs were determined in SW480 cells (48 hr) (B). Propidium iodide cell cycle analysis was performed to determine sub-G1 population at 48 hr of
treatment with CB002-analogs at 100 mM in SW480 cells. Two-way ANOVA, p
Research article                                                                       Biochemistry and Chemical Biology Cancer Biology

Figure 2. Transcriptomic pathway analysis of analog #4 reveals differentially expressed genes (DEGs) in tumor cells with mutant p53. SW480 cells were
treated with analog #4 for 12 hr. Three-way Venn diagram of all genes tested that met the low expression cutoff (pink), DEGs with an FDR
Research article Biochemistry and Chemical Biology Cancer Biology
Figure 2 continued
Figure supplement 9. Heatmap of genes shown in Figure 2—figure supplement 8 Kyoto Encyclopedia of Genes and Genomes analysis from the
mismatch repair pathway.
Figure supplement 10. Kyoto Encyclopedia of Genes and Genomes (KEGG) for the nucleotide excision repair pathway.
Figure supplement 11. Heatmap of genes shown in Figure 2—figure supplement 10 Kyoto Encyclopedia of Genes and Genomes analysis from the
nucleotide excision repair pathway.
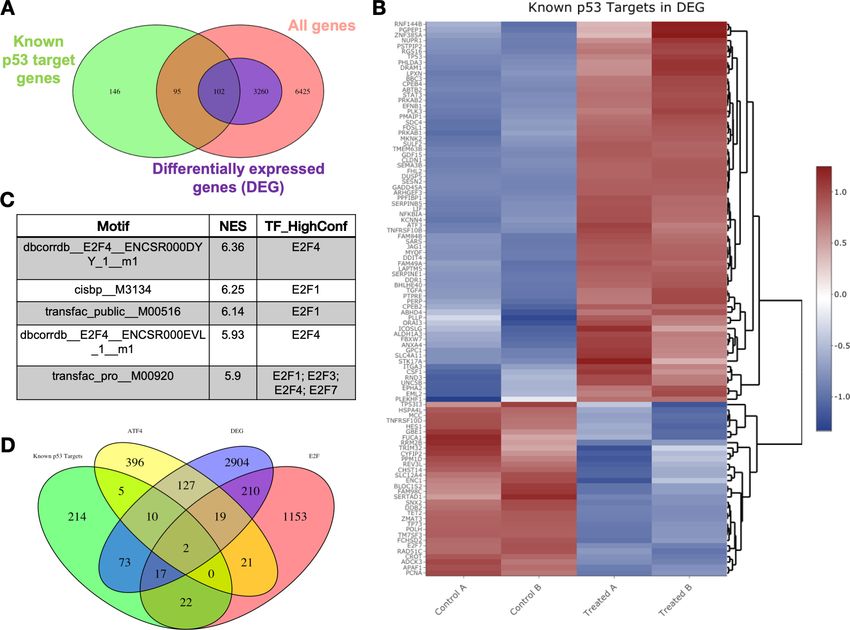
analysis defined by direct binding of predictive binding motifs revealed E2F transcription factors as
having the highest normalized enrichment score (Figure 2C). Because the transcription factor ATF4
was shown to be important for Noxa induction in Figure 1I, we compared a known ATF4 gene set
(Table S3 from Wang et al., 2015), along with an E2F gene set (Table S1 from Ren et al., 2002),
together with the known p53 gene set and the DEGs in our analog #4 treatment (Figure 2D). The
resulting Venn diagram of this comparison shows that both ATF4 and E2F targets genes are not
unique to these transcription factors and also share common targets with p53 (~5%). Analyzing the
ratio of DEGs to the transcription factor gene set did not show an obvious gene enrichment regula-
tion of one transcription factor (Table 2). Despite p53 not being the top predictive transcription
Table 1. Enriched Biological Process Gene ontology (GO) terms in the 102 differentially expressed
genes (DEGs) in CB002-analog #4 treated cells.
GO analysis for the 102 DEGs that are also known p53 target genes. GO term analysis was done
using the R package ‘goseq’ and those genes enriched in particular biological process are described
along with their adjp value. Top 25 enriched GO terms are listed.
GO term ID Name Adjp
GO:0008219 Cell death 4.447579E 08
GO:0010941 Regulation of cell death 4.447579E 08
GO:0012501 Programmed cell death 5.409503E 08
GO:0006915 Apoptotic process 5.466988E 08
GO:0043067 Regulation of programmed cell death 2.902278E 07
GO:0097193 Intrinsic apoptotic signaling pathway 4.205507E 07
GO:0097190 Apoptotic signaling pathway 4.949351E 07
GO:0042981 Regulation of apoptotic process 6.67383E 07
GO:0072331 Signal transduction by p53 class mediator 7.248333E 07
GO:0050896 Response to stimulus 7.321667E 07
GO:0007154 Cell communication 1.104964E 06
GO:0051716 Cellular response to stimulus 1.532609E 06
GO:0023052 Signaling 2.587082E 06
GO:0007165 Signal transduction 2.587082E 06
GO:0009966 Regulation of signal transduction 5.993752E 06
GO:0072332 Intrinsic apoptotic signaling pathway by p53 class 1.671799E 05
GO:0048583 Regulation of response to stimulus 3.853858E 05
GO:2001233 Regulation of apoptotic signaling pathway 3.893307E 05
GO:0010646 Regulation of cell communication 4.168569E 05
GO:0007166 Cell surface receptor signaling pathway 4.430113E 05
GO:0023051 Regulation of signaling 5.136280E 05
GO:0010942 Positive regulation of cell death 8.303541E 05
GO:0043065 Positive regulation of apoptotic process 1.220935E 04
GO:0048584 Positive regulation of response to stimulus 1.220935E 04
GO:0009968 Negative regulation of signal transduction 1.220935E 04
Hernandez Borrero et al. eLife 2021;10:e70429. DOI: https://doi.org/10.7554/eLife.70429 6 of 21Research article Biochemistry and Chemical Biology Cancer Biology
Table 2. Contribution of transcription factors P53, ATF4, and E2F to differentially expressed genes
(DEGs) in CB002-analog #4 treated cells.
The total number of DEGs that overlapped with known genes of each transcription factor was calcu-
lated. This total is reflected in the ‘number of genes in DEG’ column. Using this number, we then cal-
culated the ratio of DEGs divided by the total of genes in the transcription factor data set.
Transcription factor Number of genes in DEG Number in data set Ratio
P53 73+10+2+17=102 343 0.3
ATF4 127+10+19+2=158 559 0.28
E2F 17+2+19+210=248 1444 0.17
factor in our analysis, ingenuity pathway analysis (IPA) determined p53 to be activated as an
upstream regulator with a z-score value of 3.3 and p-value of 2.910 34. A Kyoto Encyclopedia of
Genes and Genomes (KEGG) analysis for the p53-pathway signaling was obtained with an adjusted
p-value (adjp) equal to 1.1810 1 that despite not reflecting a significant enrichment of the p53
pathway, it indicates the presence of a total of 31 DEGs out of the 52 genes tested and present in
the KEGG analysis. Thus, this accounts for 60% of DEGs in the KEGG p53-pathway analysis. DEGs
involved in the KEGG analysis fold change is described by color and additional genes not shown in
the p53-pathway figure and yet involved in the KEGG analysis are shown as a heatmap (Figure 2—
figure supplement 2 and Figure 2—figure supplement 3). In line with the GO terms results, p53
target genes involved in apoptosis such as Noxa, Puma, and DR5 were upregulated by the analog
#4 treatment. Taken together, this data indicates that although a large set of genes differentially
expressed are not predicted to be directly regulated through direct p53 binding, a subset of these
are enriched in the p53-pathway, indicative of p53-pathway restoration.
We determined the enriched pathways in the whole set of DEGs (3362). To this end, a KEGG
analysis was performed. The top four enriched pathways that were obtained from the KEGG analysis
namely included cell cycle, DNA repair, mismatch repair, and nucleotide excision repair. The adjp for
each KEGG pathway was 2.2710 6, 2.2710 6, 5.0510 3, and 2.1810 2, respectively. The adjp
values indicate a significant enrichment score of each pathway. The fold change of DEGs by analog
#4 treatment in the KEGG analysis is reflected by the color legend (Figure 2—figure supplement 4,
Figure 2—figure supplement 6, Figure 2—figure supplement 8, and Figure 2—figure supple-
ment 10). Additional genes not shown in the pathway KEGG figures and yet involved in the KEGG
analysis are shown as a heatmap (Figure 2—figure supplement 5, Figure 2—figure supplement 7,
Figure 2—figure supplement 9, and Figure 2—figure supplement 11). GO terms in biological pro-
cesses also reflected enrichment of genes that participate in cell cycle regulation (Table 3). Taken
together, KEGG analysis and GO ontology both reflected the downregulation of genes involved in
the G1/S-phase of the cell cycle in CB002-analog treated cells. E2F is responsible for the induction
of genes in DNA initiation and replication, such as minichromosome maintenance (MCM) complexes
and origin replication complexes (Bracken et al., 2004). The transcriptomic analysis indicates
the downregulation of these genes and this suggests the inhibition of E2F transcriptional activity. In
addition, downregulation of Cyclin E and Cyclin A genes further confirmed the delay of cells to
S-phase. GADD45, a p53-target gene that can induce cell cycle arrest, was upregulated. Further
study is necessary in order to validate the direct implication of E2F’s and p53 target genes in the
perturbation of the delay in S-phase. Nonetheless, this data suggests that the identified family of
small molecules represent a unique mechanism of action that involves S-phase delay perturbation
and p53-pathway restoration.
In order to show that the stimulation of the p53 pathway at the transcriptional level was restoring
the p53 pathway at the protein level, a comparative label-free quantitative proteomic analysis of
SW480 colon cancer cells in response to DMSO and analog #4 (T4) treated for 24 hr was performed.
Figure 3—figure supplement 1A and E shows close clustering of protein abundance of each repli-
cate under the same group and variability among the treatments. Volcano plots of fold change ver-
sus q-value of the total of 3743 proteins quantified from SW480 cells in response to DMSO, CB002
(CB), and analog #4 (T4) treatments show differentially expressed proteins determined as significant
(pResearch article Biochemistry and Chemical Biology Cancer Biology
Table 3. Enriched biological process Gene ontology (GO) terms in the 3362 differentially expressed
genes (DEGs).
GO analysis for all DEGs by analog #4 treatment. GO term analysis was done using the R package
‘goseq’ and those genes enriched in particular biological process are described along with their adjp
value. Top 20 enriched GO terms are listed.
GO term ID Name Adjp
GO:0022402 Cell cycle process 7.751840E 16
GO:0000278 Mitotic cell cycle 7.751840E 16
GO:0007049 Cell cycle 2.753525E 15
GO:1903047 Mitotic cell cycle process 2.753525E 15
GO:0044770 Cell cycle phase transition 3.654863E 13
GO:0006260 DNA replication 5.207792E 13
GO:0044772 Mitotic cell cycle phase transition 1.192425E 11
GO:0006261 DNA-dependent DNA replication 2.919748E 11
GO:0007059 Chromosome segregation 3.095763E 11
GO:0044786 Cell cycle DNA replication 3.986797E 11
GO:0051301 Cell division 1.520253E 10
GO:0000280 Nuclear division 1.693587E 09
GO:0098813 Nuclear chromosome segregation 1.985723E 09
GO:0033260 Nuclear DNA replication 2.161431E 09
GO:0000819 Sister chromatid segregation 1.299694E 08
GO:0044843 Cell cycle G1/S-phase transition 5.548849E 08
GO:0071103 DNA conformation change 6.704071E 08
GO:0048285 Organelle fission 7.309501E 08
GO:0051726 Regulation of cell cycle 9.496568E 08
GO:0000070 Mitotic sister chromatid segregation 1.696716E 07
did not reflect an enrichment in p53 targets (Figure 3A). Consistent with the microarray data, the
proteomic pathway analysis of the differentially abundant proteins shows the downregulation of pro-
teins involved in cell cycle regulation (Figure 3B). In particular, CDK4, CKS1B, ERCC6L, MAPK3, and
MAX are significantly decreased in analog #4 treatment than in CB002 (Figure 3C).
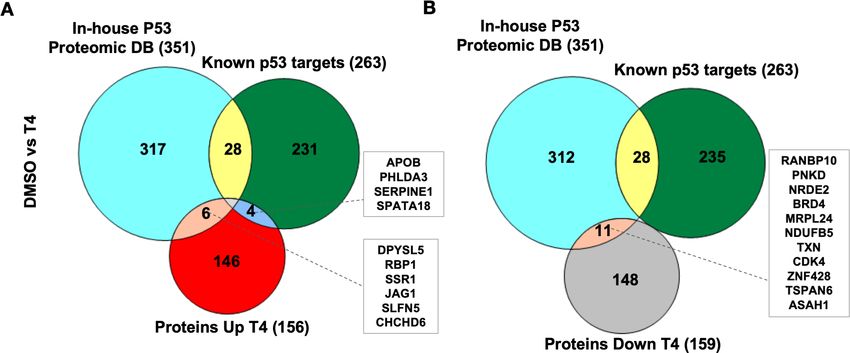
As the CB002-analog molecules were discovered as p53 pathway restoring compounds, we com-
pared the proteomic data, with the known p53 target gene set used in our transcriptomic analysis
(Table S3 from Fisher’s analysis in Fischer, 2017) together with our in-house p53-proteomic data-
base (Tian et al., 2020). Our in-house proteomic database was derived from a comparison of
HCT116 versus HCT116 p53 / cells treated with 5-Fluorouracil (5-FU). Our results show that out of
all significantly upregulated expressed proteins, only four overlapped with the known p53 targets
and six proteins with our in-house p53-proteomics (Figure 4A). Eleven proteins were found to be
downregulated by analog #4 treatment overlapping with the in-house proteomic database and none
with the known p53 target data set (Figure 4B). No upregulated or downregulated proteins were
found to overlap in all three data sets: analog #4 treatment and both reference databases
(Figure 4A–B). Overall, these results suggest that within the proteins tested in the proteomic analy-
sis, those expressed by analog #4 treatment and involved in the p53 pathway were minimal under
the performed experimental conditions. Additional proteins validated by Western blots, such as
Noxa and DR5, were not detected in the proteomic analysis indicating that the proteomic analysis
should be considered as preliminary and warrants further optimization. Moreover, differences were
observed at the level of protein expression between parental compound CB002 and its analog #4
both downregulated and to a lesser extent, upregulated proteins (Figure 4—figure supplement 1).
This indicates that these small molecules can have different effects in tumor cells, albeit they have
>50% homology in their proteomic composition.
Hernandez Borrero et al. eLife 2021;10:e70429. DOI: https://doi.org/10.7554/eLife.70429 8 of 21Research article Biochemistry and Chemical Biology Cancer Biology Figure 3. Proteomic pathway analysis of CB002-analog #4 responsive differentially expressed proteins in SW480 cells. Significantly enriched pathways corresponding to the CB002-analog #4 responsive upregulated (A) and downregulated (B) proteins (in comparison with the DMSO). The heatmap (C) shows the grouped proteins’ expression value of some target pathway proteins highlighted in the box area. Data collected from the proteomic analysis of DMSO versus CB002 and analog #4 treated SW480 cell samples for 24 hr. The online version of this article includes the following source data and figure supplement(s) for figure 3: Source data 1. Protein information of all proteins detected in DMSO vehicle control and analog #4 SW480 treated cells at 24 hr samples analysed by LC-MS/MS. Figure supplement 1. Comparative label-free quantitative proteomic analysis of SW480 cell lines in response to DMSO, CB002 (CB), and analog 4 (T4) treated for 24 hr. Hernandez Borrero et al. eLife 2021;10:e70429. DOI: https://doi.org/10.7554/eLife.70429 9 of 21
Research article Biochemistry and Chemical Biology Cancer Biology
Figure 4. CB002-analog #4 (T4) responsive proteins in comparison with in-house p53-proteomic database and known p53 targets. Three-way Venn
diagram of upregulated (A) and downregulated (B) analog #4 responsive proteins. Data collected from the proteomic analysis of DMSO versus analog
#4 treated SW480 cell samples for 24 hr.
The online version of this article includes the following figure supplement(s) for figure 4:
Figure supplement 1. Proteomic data comparison of proteins increased and/or decreased in abundance with analog #4 (T4) treatment compared to
DMSO and CB002.
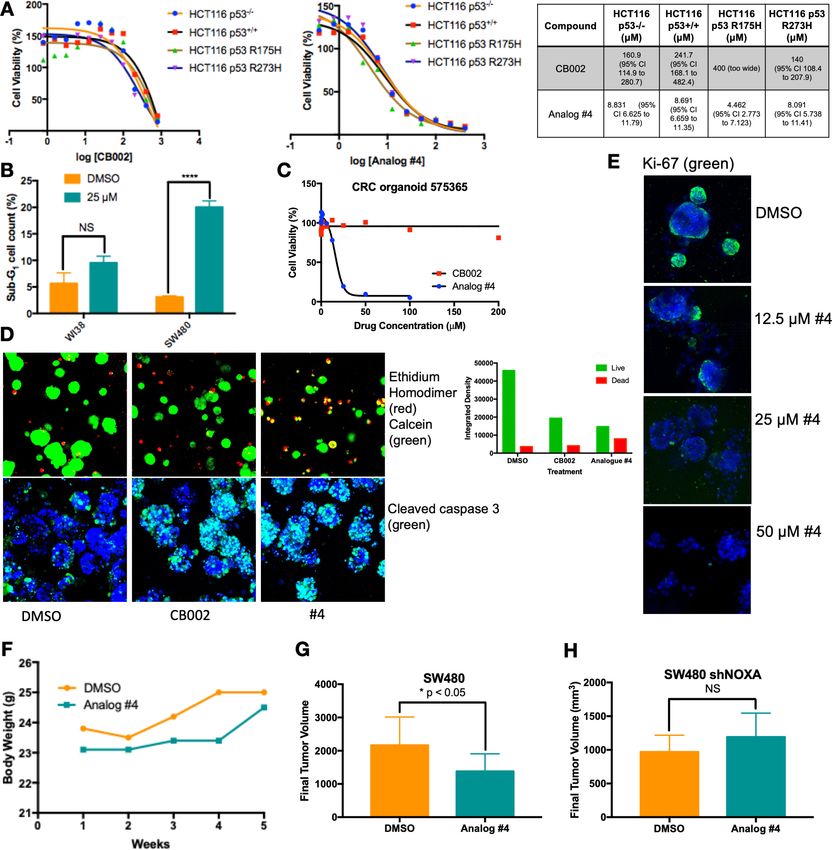
CB002 and analogs perturb an S-Phase but not G2 checkpoint, unlike
other xanthines
Caffeine is a G2 checkpoint deregulator through inhibition of ATM/ATR. Thus, the combination of
chemotherapy agents with caffeine results in enhanced cancer cell cytotoxicity. Nonetheless, it was
not pursued due to caffeine’s lack of achievable required concentrations in plasma. We investigated
whether CB002 and its analogs can deregulate the G2 checkpoint, like caffeine, pentoxifylline, and
theophylline. We synchronized SW480 colon cancer cells using double thymidine block, released and
treated with CB002-analog compound alone or in combination with etoposide, and probed for key
G2/M-phase cell cycle markers. As expected, we observed that etoposide treatment enhances pro-
tein expression of pcdc2(Tyr15) and pcdc25c(Ser16) indicating cell cycle arrest due to DNA damage.
The combination of etoposide with caffeine resulted in G2-deregulation as indicated by decreased
expression of pcdc2(Tyr15) and pcdc25c(Ser16). Similarly, the combination of etoposide with CB002 or
CB002-analog #4 showed a decrease in expression of pcdc2(Tyr15) and pcdc25c(Ser16). Nonetheless,
CB002 or CB002-analog #4 do not increase M-phase marker pH3(Ser10) as would be expected for a
G2-deregulator like caffeine (Figure 5A). This data suggests that CB002 and CB002-analog #4 either
do not deregulate the G2 checkpoint or that these compounds delay cells going into M-phase.
Moreover, CB002 and its analogs increase p-Cdc25c and p-Cdc2 in combination with etoposide indi-
cating cell cycle arrest. A similar experiment was performed as a time course after cell synchroniza-
tion release to further elucidate the cell cycle effects of CB002-analog #4. As seen in Figure 5D, cell
cycle markers pcdc2(Tyr15) and pcdc25c(Ser16) expression decreased in CB002-analog #4 compared to
DMSO and etoposide and their expression over time increased at 12 hr indicative of a delay of cells
in the G2 cell cycle phase. To further elucidate the effect in S-phase, we evaluated Cyclin A and
p-RPA-RPA2(S8), the latter as a marker of single-stranded DNA and replication stress that are poten-
tially caused by stalled or collapsed replication forks. Cyclin A expression did not decrease over time
in CB002-analog #4 treated cells as compared to DMSO and etoposide indicating that cells were
delayed in S-phase. Moreover, p-RPA-RPA2(S8) expression upon CB002-analog #4 treatment was
increased compared to DMSO indicating replication stress. The p53 target p21 was also found to
Hernandez Borrero et al. eLife 2021;10:e70429. DOI: https://doi.org/10.7554/eLife.70429 10 of 21Research article Biochemistry and Chemical Biology Cancer Biology Figure 5. CB002 and its analogs perturbed an S-phase rather than a G2-phase checkpoint like other known xanthines cell cycle effects in SW480 cells. Western blot analysis of synchronized SW480 treated cells as indicated and harvested at 24 hr (A, B, C). Synchronized SW480 cells were treated as indicated and analyzed by Western blot (D), PI staining (E) or PI/BrdU analysis (F). CB002 (C), Caffeine (CF). Experiments from figures (A)–(D) were performed at least twice and a representation of one is shown. Figure 5 continued on next page Hernandez Borrero et al. eLife 2021;10:e70429. DOI: https://doi.org/10.7554/eLife.70429 11 of 21
Research article                                                                   Biochemistry and Chemical Biology Cancer Biology

Figure 5 continued
The online version of this article includes the following figure supplement(s) for figure 5:
Figure supplement 1. Flow cytometry PI/BrdU-CB002-analog #4 perturbs the S-phase rather than the G2 checkpoint, unlike other xanthines.

                                      increase in CB002-analog #4 treated cells indicating cell cycle arrest. Taken together, these analogs
                                      deregulate an S-phase checkpoint and not a G2 checkpoint.
                                         To investigate further the effects of these CB002-analogs on the cell cycle, we probed for S-phase
                                      specific markers and performed PI analysis by flow cytometry upon release of synchronized cells for
                                      a time course of 0–48 hr. CB002 and its structural analogs, unlike caffeine, increase single-strand
                                      DNA marker p-RPA-RPA2(S8) and p-ATR(Thr1989), indicating that these compounds result in replication
                                      stress and activate features of an S-phase checkpoint (Figure 5B–C). PI analysis further confirms that
                                      combination of caffeine and etoposide deregulates the G2 checkpoint and that CB002-analogs #4
                                      and #10 treatment results in S-phase accumulation are particularly observed at 8 hr following release
                                      from synchronization (Figure 5E). PI and BrdU co-staining confirm that CB002-analog #4 increases
                                      by 30% cells in S-phase at 12 hr as compared to DMSO vehicle control and no significant differences
                                      are observed in G2-phase cells between etoposide and CB002-analog #4 at 24 hr (Figure 5F).
                                      S-phase delays with CB002 and CB002-analog #10 occur at 6–8 hr of treatment, particularly a two-
                                      fold difference in combination with etoposide. The caffeine-treated S-phase population is compara-
                                      ble to the DMSO vehicle control at all time points indicating that caffeine does not perturb the
                                      S-phase. As expected, caffeine decreases the G2-population by 2- to 3-fold at 24 hr in combination
                                      with etoposide as compared to etoposide alone, and no other treatment tested decreases the G2-
                                      population when combined with etoposide (Figure 5 and Figure 5—figure supplement 1). Haploid
                                      cell gating indicates the haploid BrdU-positive cells in Figure 5 and Figure 5—figure supplement
                                      1.

                                      CB002-analog #4 has anti-tumor effects in vitro and in vivo
                                      We focused on lead CB002-analog #4 and investigated its therapeutic index in vitro and in vivo. We
                                      treated an isogenic HCT116 cell line panel with varying p53 mutation-status were treated with 100
                                      mM CB002 and 25 mM CB002-analog #4 and established IC50 values by the Cell-Titer glow cytotoxic-
                                      ity assay. Across this panel, CB002-analog #4 has a 20- to 30-fold range in IC50 values, indepen-
                                      dently of the HCT116 p53-status (Figure 6A). Thus, the results indicate that the restoration of the
                                      p53-pathway by CB002 or analog #4 is p53-independent. SW480 cells treated with CB002-analog #4
                                      showed a significant increase of sub-G1 content as compared to vehicle control, whereas treatment
                                      with CB002-analog #4 of normal human WI38 lung fibroblast cells did not significantly increase the
                                      sub-G1 cell population indicating that CB002-analog #4 is safe to normal cells in vitro (Figure 6B).
                                          We further investigated the anti-cancer cytotoxicity potential of CB002-analog #4. We treated a
                                      colorectal cancer patient-derived organoid with CB002-analog #4 and performed cellular cytotoxicity
                                      analysis in vitro and immunofluorescence staining of ethidium homodimer, calcein, caspase-3, and
                                      Ki-67 to distinguish between dead, live, apoptotic, and proliferating cells, respectively. CB002-ana-
                                      log #4 enhances cytotoxicity as compared to the CB002 parent compound in the tested colorectal
                                      cancer patient-derived organoid as indicated by the cell viability response curve (Figure 6C). More-
                                      over, the immunofluorescence assay staining for ethidium homodimer and calcein shows an increase
                                      of ethidium homodimer staining of CB002 and CB002-analog #4 to a larger extent as compared to
                                      vehicle control indicating an enhanced killing of cells. Calcein staining shows that organoids treated
                                      with CB002-analog #4 are smaller in size indicating that CB002-analog #4 decreases the growth of
                                      the patient-derived organoid (Figure 6D). Cleaved caspase-3 staining indicates that both CB002
                                      and CB002-analog #4 treatment at IC50 doses increases apoptotic cells (Figure 6D). CB002-analog
                                      #4 treatment also results in an inverse relationship with Ki-67 staining with respect to drug concen-
                                      tration, indicating that CB002-analog #4 decreases the population of proliferating cells (Figure 6E).
                                          We investigated CB002-analog #4 in vivo for anti-tumor efficacy as well as toxicity in NSG mice.
                                      Mice were xenografted with human SW480 colorectal cancer cells treated with CB002-analog #4 at
                                      50 mg/kg by oral gavage three times per week. Our data suggests that CB002-analog #4 is
                                      well tolerated as indicated by the mouse body weights during the duration of the experiment
                                      (Figure 6F). At 5 weeks of treatment, CB002-analog #4 treated tumors have a statistically significant

Hernandez Borrero et al. eLife 2021;10:e70429. DOI: https://doi.org/10.7554/eLife.70429                                                   12 of 21
Research article Biochemistry and Chemical Biology Cancer Biology Figure 6. CB002-analog #4 has potent anti-tumor effects in vitro and in vivo. HCT116 isogenic panel treated with CB002 or analog #4 for 48 hr and their respective IC50 values shown in the table (A). CB002-analog #4 increases apoptotic cells as indicated by the sub-G1 content in cancer cells but not in normal WI38 cells (48 hr). Two-way ANOVA, p
Research article                                                               Biochemistry and Chemical Biology Cancer Biology

                                   lower tumor volume as compared to vehicle control (Figure 6G). To determine the importance of
                                   Noxa in vivo, mice were xenografted with SW480 cells containing a stable knockdown of Noxa. Mice
                                   xenografted with SW480 shNoxa cells did not have a significant difference in tumor volume after
                                   CB002-analog #4 treatment compared to vehicle control treated tumors indicating that Noxa is
                                   important for reduced tumor volume in vivo (Figure 6H).

                                   Discussion
                                   We describe a novel class of anti-tumor agents with a unique mechanism of action involving restora-
                                   tion of p53 pathway signaling, independently of p53, in tumors with mutated-p53 and characteristics
                                   of an S-phase checkpoint. The defining members of this class that best exemplify the novel mecha-
                                   nistic properties are CB002-analogs #4 and #10. The properties of these CB002-analog xanthine
                                   compounds are different from other xanthines, such as caffeine, pentoxifylline, and theophylline,
                                   that do not restore p53 pathway signaling in tumors with mutant p53 and which deregulate a
                                   G2 checkpoint rather than induce an S-phase checkpoint.
                                      Our approach to discovering p53 pathway restoring compounds involved cell-based screening for
                                   functional restoration of p53-regulated reporter activity, coupled with cell death induction. Thus,
                                   small molecule lead compounds and structural-analogs were not expected to act directly on mutant
                                   p53 or restore binding of mutant p53 to genes normally regulated by p53. In the case of the com-
                                   pounds described here, activation of p53 target genes such as Noxa or DR5 occurred independently
                                   of p53 and this was observed in tumor cells with different p53 mutations. Thus, there is no expecta-
                                   tion that CB002 or analogs #4 or #10 will cause mutant p53 to bind to DNA or chromatin in the reg-
                                   ulatory regions of Noxa or DR5 in a manner that wild-type p53 does. Moreover, the induction of p53
                                   targets occurred independently of p53 family member p73, but in a manner that requires integrated
                                   stress response transcription factor proteins ATF3/4. These results provide a molecular mechanism
                                   for activation of p53 target genes in a manner that substitutes transcription factors such as ATF3/4
                                   for defective p53. This mechanism results in tumor suppression through induction of pro-apoptotic
                                   factors despite p53 mutation, and therefore acts as a bypass mechanism to prevent tumor growth in
                                   drug-treated cells.
                                      CB002-analog #4 is 20–30 times more potent and like the CB002 parental compound restores
                                   the p53-pathway and induces apoptosis independently of p73. The 12 p53 pathway restoring struc-
                                   tural analogs of CB002 tested were similar in that they resemble the structure of a xanthine. Our
                                   transcriptional analysis identified 102 genes involved in the p53-pathway and IPA determined p53 to
                                   be activated as an upstream regulator with a z-score value of 3.3 and p-value of 2.910 34. This
                                   data further validates the novel anti-cancer class of small molecules as p53-restoring drugs. Microar-
                                   ray analysis identified approximately 150 genes involved in cell cycle regulation, DNA synthesis, and
                                   repair that are significantly decreased compared to DMSO control. These genes include, minichro-
                                   mosome maintenance (MCM) proteins, Cyclin E, CDK, E2F, and Cdc2 (Figure 2—figure supple-
                                   ments 4–11). Proteomic analysis also confirmed a decrease in proteins involved in cell cycle
                                   regulation (Figure 3B). Thus, our transcriptomic and proteomic analyses coincide in that CB002-ana-
                                   log #4 significantly reduces key regulators of the cell cycle. Taken together with the fact that known
                                   xanthines such as caffeine deregulate the G2 checkpoint, we examined the effects of the CB002-ana-
                                   logs on the cell cycle. Our data indicate that the p53-restoring CB002-analog compounds, unlike
                                   known xanthines such as caffeine, pentoxifylline, and theophylline, restore the p53 and do not
                                   deregulate the G2 checkpoint. Instead, treatment with these small molecule CB002-analogs results
                                   in activation of an S-phase DNA damage response pathway characterized by the increase in
                                   p-ATR(Thr1989) and we suggest this ultimately leads to a delay of cells in S-phase and this S-phase
                                   perturbation may contribute to cancer cell death. Importantly, the observed S-phase perturbation
                                   may lead to new therapeutic regimens such as synthetic lethality in BRCA-deficient cells and combi-
                                   nation with PARP inhibitors.
                                      We previously reported that pro-apoptotic protein Noxa plays a critical role in CB002-mediated
                                   cell death. Our data shows that CB002-analogs induce Noxa expression across different colorectal
                                   cancer cell lines in vitro. More importantly, we show that Noxa appears to be critical in vivo as
                                   CB002-analog #4 treatment of SW480 shNoxa tumors does not significantly reduce tumor volume as
                                   compared to vehicle control. We have evidence indicating that ATF3/4 play a role in regulating
                                   Noxa as knockdown of ATF3/4 results in the decrease of Noxa protein expression. Our proteomic

Hernandez Borrero et al. eLife 2021;10:e70429. DOI: https://doi.org/10.7554/eLife.70429                                           14 of 21
Research article Biochemistry and Chemical Biology Cancer Biology
data shows activation of the integrated stress response as indicated by the increase of genes
involved in the unfolded protein response, tRNA aminoacylation, and increase of ATF3/4 protein
expression by Western blot (Figure 3A, Figure 1I). Whether the S-phase perturbation is a result of
cellular stress remains to be addressed.
ATF3/4 can regulate similar targets of that of p53, including p21. Our laboratory has identified a
small molecule PG3-Oc which involves the restoration of the p53 pathway independently of p53
through ATF4 (Tian et al., 2021). P53 has been shown to indirectly repress many cell cycle genes
through the induction of p21. P21, in turn, binds to the DREAM repressor complex which represses
genes controlled by E2Fs and CHR transcription factors (Fischer et al., 2016; Engeland, 2018). We
observed many cell cycle genes downregulated at the transcriptional level that are relevant to the
p53 signal pathway. Moreover, our bioinformatic analysis predicted E2Fs as one of the transcription
factors. We have previously shown that CB002 induces p21 expression (Hernandez-Borrero et al.,
2018), as well as analog #4 in this study thus it is possible that the observed S-phase perturbation is
through p53-independent p21 stimulation that binds to DREAM complexes. Therefore, it will be
interesting to see if ATF3/4 regulate p21 expression and the effect of p21 knockdown on cell cycle
genes and affect the S-phase perturbation observed by CB002-analogs.
We show that CB002-analog #4 induces apoptosis in colorectal cancer patient-derived organoid
cells and that it is safe both in vitro and in vivo as indicated by the lack of a statistically significant
increase in the sub-G1 population in normal human fibroblasts and also a healthy NSG mice body
weight throughout treatment, respectively. The observed decrease in tumor volume was statistically
significant at 5 weeks. This effect was suboptimal than desired and further optimization will be
required to reach optimal effects. Importantly, the decrease in tumor volume by CB002-analog #4 is
dependent on Noxa. As Noxa is not commonly mutated in human cancer, its induction by the
CB002-analogs offers a feasible therapeutic advantage leading to tumor cell death and its expres-
sion may be used as a pharmacodynamic biomarker to predict therapeutic response. Taken
together, our data suggests that CB002-analogs #4 and #10 represent a novel class of anti-tumor
agents that provide a unique therapeutic strategy that can be clinically translated.
Materials and methods
CB002-analog small molecule secondary drug screening
CB002 structural analogs were obtained from ChemBridge Library and screening was performed in
the human SW480 colorectal cancer cell line that stably expresses a p53-regulated luciferase
reporter previously generated in our laboratory (Wang et al., 2006). Cells were seeded at a density
of 1104 cells per well in 96-well plates (Greiner Bio-One) and treated with the indicated compound
from 0 to 600 mM. p53 transcriptional activity was imaged using an IVIS imaging system at 6 hr. A
total of three biological replicates per condition were performed.
Cell lines and culture conditions
DLD-1 (p53S241F) (RRID:CVCL_0248), SW480 (p53R273H,P309S) (RRID:CVCL_0546), and HCT116
(p53WT) (RRID:CVCL_0291) colorectal cancer cell lines and WI38 normal lung fibroblast cells were
purchased from ATCC. HCT116 p53 / (obtained from the Vogelstein Laboratory, Johns Hopkins
University), HCT116 R175H p53, and HCT116 R273H p53 were previously described (Hernandez-
Borrero et al., 2018). The SW480 cancer cell line that stably expresses a p53-regulated luciferase
reporter was previously generated in our laboratory (Ren et al., 2002). Cell lines were authenticated
and tested for mycoplasma. Cell lines were maintained in HyClone Dulbecco’s High Glucose Modi-
fied Eagles Medium (DMEM, GE Healthcare), HyClone McCoy’s 5A (GE Healthcare) or Eagle’s Mini-
mum Essential Medium (EMEM, ATCC) containing 10% fetal bovine serum (FBS) and 1% penicillin/
streptomycin (complete media) at 37˚C in 5% CO2, as recommended by ATCC.
CellTiter-Glo luminescent cell viability assay
SW480 cells were seeded in 96-well plates at a density of 5103 cells per well. A total of three bio-
logical replicates per condition were performed. About 20 mL of CellTiter-Glo reagent was added
directly to the wells, according to the manufacturer’s protocol, and bioluminescence signal was
determined using an IVIS imaging system at a period of 48–72 hr after treatment.
Hernandez Borrero et al. eLife 2021;10:e70429. DOI: https://doi.org/10.7554/eLife.70429 15 of 21Research article Biochemistry and Chemical Biology Cancer Biology
Cell synchronization
Where indicated, cells were synchronized by double thymidine block. Cells were treated with 2 mM
Thymidine for 16 hr, drug was removed and replaced by complete growth media for 8 hr. Cells were
treated for the second time with 2 mM Thymidine for 16 hr, at this point, cells were treated and har-
vested as indicated.
Propidium Iodide and BrdU flow cytometry assay
Cells were seeded at a density of 5105 in a six-well plate and treated for 48–72 hr. A total of two
biological replicates per condition were performed. After treatment, floating cells were collected
and adherent cells were trypsinized, pelleted, washed with phosphate-buffered saline (PBS) and
fixed in 70% ethanol overnight. For PI based sub-G1 apoptosis analysis, cells were spun down after
fixation and resuspended in phosphate-citric acid buffer (0.2 M Na2HPO4+0.1 M citric acid, pH 7.8)
at room temperature for 5 min. The cell pellet was resuspended for staining with 50 mg/mL PI and
250 mg/mL ribonuclease (RNase A). For BrdU Chase analysis, a final concentration of 10 mM BrdU
(Sigma-Aldrich, B9285) was added to the cell culture for 30 min at 37˚C prior to cell fixation. Cells
were fixed, spun down, and resuspended in 1 mL of 2 N HCL with 0.5% Triton X-100 for 30 min at
room temperature. Cells were pelleted, washed with PBS, and resuspended in 20 mL BrdU anti-body
(BD Biosciences, cat no. 347580) diluted in 0.5% Tween 20/PBS/5% BSA for 30 min at room temper-
ature. Cells were then spun down and resuspended in 140 mg/mL goat anti-mouse Alexa Fluor 488
(#A-11008, Thermo Fisher Scientific) in 0.5% Tween 20 in PBS/5% BSA for 30 min at room tempera-
ture. Cells were then spun down and resuspended in 5 mg/mL PI: 250 mg/mL RNase A solution. Sam-
ples were analyzed on an Epics Elite flow cytometer (Beckman Coulter).
For BrdU analysis gating, cell aggregates were gated out in the PI Peak versus DNA PI histogram.
BrdU lower limit intensity was set on upper limit of the negative control. No BrdU antibody in
Figure 3E and no goat anti-mouse Alexa Fluor 488 antibody in Figure 5—figure supplement 1
were used as the negative controls. Haploid cell gating indicates the haploid BrdU-positive cells.
S-phase and G2-phase boundaries were determined by PI staining that indicated G1 and G2 as per
DNA content. Gating was held constant throughout the samples within a given experiment.
Immunoblotting
After treatment, floating cells were collected and adherent cells were trypsinized, washed with PBS,
and lysed with RIPA buffer (Sigma-Aldrich) for 30 min to 1 hr at 4˚C. Protein lysates were pelleted
and supernatant was collected. Total protein per sample was determined using a Pierce BCA Protein
Assay Kit (Thermo Fisher Scientific). Proteins were denatured using 1 NuPAGE LDS sample buffer
(Thermo Fisher Scientific) and reduced with 2-Mercaptoethanol (Sigma-Aldrich). Protein lysates were
boiled for 15 min at 95˚C. After protein normalization, samples were loaded into NuPAGE Novex 4–
12% Bis-Tris Protein Gels (Thermo Fisher Scientific) and gel electrophoresis was performed with
NuPAGE MES SDS Running Buffer, with the exception of ATR that was ran using a NuPAGE Novex
3–8% Tris-Acetate Protein Gels (Thermo Fisher Scientific) and NuPAGE Tris-Acetate SDS Running
Buffer. Proteins were transferred onto an Immobilon-P membrane (PVDF, EMD Millipore) using a
Bio-Rad system with a 10% Tris-Glycine and 10% methanol transfer buffer diluted in distilled and
deionized water. Membranes were blocked with 10% milk in TBST solution and then incubated over-
night with primary antibody, washed with TBST, and incubated with secondary antibody for 1 hr. Pri-
mary antibody incubations were performed in 5% milk or 5% BSA in TBST solution as per
manufacturer instructions. Signal was detected using a Chemiluminescent Detection Kit, followed by
autoradiography. The following antibodies were used: cytochrome C (1:1000; #sc-13560; Santa
Cruz; RRID:AB_627383), p53 (1:1000; #sc-126; Santa Cruz; RRID:AB_628082), p73 (1:1000; #A300-
126A; Bethyl Laboratories), Noxa (1:250; #OP180; EMD Millipore; RRID:AB_564933), DR5 (1:1,000;
#3696; Cell Signaling Technology; RRID:AB_10692107), cleaved PARP (1:1,000; #9546; Cell Signaling
Technology; RRID:AB_2160593), ATF3 (1:1000, #sc-188, Santa Cruz; RRID:AB_2258513), ATF4
(1:1,000; #11815; Cell Signaling Technology), p-RPA32/RPA2(Ser8) (1:1,000; #54762, Cell Signaling
Technology), RPA32/RPA2 (1:1000; 52448; Cell Signaling Technology), p-cdc2(Tyr15) (1:1000; #9111;
Cell Signaling Technology), cdc2 (1:1000; #54; Santa Cruz Biotechnology), p-cdc25c(Ser216) (1:1000;
#9528; Cell Signaling Technology; RRID:AB_2075150), cdc25c (1:1000; #13138; Santa Cruz Biotech-
nology; RRID:AB_627227), p-H3(Ser10) (1:1000; #3377; Cell Signaling Technology; RRID:AB_1549592),
Hernandez Borrero et al. eLife 2021;10:e70429. DOI: https://doi.org/10.7554/eLife.70429 16 of 21Research article Biochemistry and Chemical Biology Cancer Biology
H3 (1:1000; #14269; Cell Signaling Technology; RRID:AB_2756816), g-H2AX(Ser139) (1:1000; #2577;
Cell Signaling Technology; RRID:AB_2118010), p-ATR(Thr1989) (1:1000; GTX128145, GeneTex; RRID:
AB_2687562), ATR (1:1000; #1887; Santa Cruz Biotechnology; RRID:AB_630893), Cyclin A (1:1000;
sc-271682, Santa Cruz Biotechnology;), p21 (1:200; #OP64; EMD Millipore; RRID:AB_2335868), Ran
(1:10000; #610341; BD Biosciences; RRID:AB_397731), and b-actin (1:10000, A5441, Sigma-Aldrich;
AB_476744).
Knockdown of expression of p73, ATF3, and ATF4 using siRNA
A total of 1105 cells/well were plated per well in a 12-well plate in a medium with 10% FBS without
antibiotic. Forward transfection of p73 siRNA (s14319, Ambion), ATF3 siRNA (sc-29757), and ATF4
(sc-35112) was performed using the Lipofectamine RNAiMAX Transfection Reagent (Life Technolo-
gies) and incubated for 48 hr before drug treatments.
Microarray analysis
SW480 cells were seeded at a density of 1106 in 10 cm dishes and once adhered, treated with
DMSO vehicle control or CB002-analog #4 for a total of two biological replicates per condition.
Floating cells were collected and adherent cells were trypsinized at 12 hr of treatment. Cells were
pelleted and RNA was isolated using a Quick-RNA MiniPrep (#R1055, Zymo Research) according to
the manufacturer’s instructions. RNA quality was tested using an Agilent Bioanalyzer RNA Kit. Once
RNA quality was sufficient, RNA was amplified and labeled using the Low RNA Input Linear Amplifi-
cation Kit (Agilent). Labeled cDNA was hybridized onto Affymetrix Human Gene 2.0 ST array. Signifi-
cant changes in gene expression were determined as follows: the low expression cutoff of probe
signal intensity was set at 50 (unless at least one sample did not meet these criteria for that particu-
lar probe). Normalization was performed using the RMA method and Limma eBayes for the statisti-
cal method using R studio programming software. Genes with an FDR ofResearch article Biochemistry and Chemical Biology Cancer Biology
at 8.0102 with charge state exclusion of unassigned and z=1, or 6–8 ions and dynamic exclusion
time of 30 s.
Database search and label-free quantitative analysis
Peptide spectrum matching of MS/MS spectra of each file was searched against the NCBI Human
database (TaxonID: 9606, downloaded on 02/19/2020) using the Sequest algorithm within Proteome
Discoverer v 2.4 software (Thermo Fisher Scientific, San Jose, CA). The Sequest database search was
performed with the following parameters: trypsin enzyme cleavage specificity, two possible missed
cleavages, 10 ppm mass tolerance for precursor ions, and 0.02 Da mass tolerance for fragment ions.
Search parameters permitted dynamic modification of methionine oxidation (+15.9949 Da) and static
modification of carbamidomethylation (+57.0215 Da) on cysteine. Peptide assignments from the
database search were filtered down to a 1% FDR. The relative label-free quantitative and compara-
tive among the samples were performed using the Minora algorithm and the adjoining bioinformat-
ics tools of the Proteome Discoverer 2.4 software. To select proteins that show a statistically
significant change in abundance between two groups, a threshold of 1.5-fold change with p-value
(0.05) was selected.
Immunohistochemistry
30,000 cells/well were seeded in eight-chamber slides. Cells were washed with PBS at the harvesting
time point and fixed with 4%parafornaldehyde for 25 min. Cells were then washed with PBS and per-
meabilized with 0.2% Triton X-100 for 5–10 mins. Cells were then washed with PBS and incubated
overnight 1:100 with the indicated primary antibody cytochrome C (#sc-13560; Santa Cruz; RRID:
AB_627383), Tom-20 (#42406, Cell Signaling Technology; RRID:AB_2687663), cells were washed
with PBS and incubated with secondary antibody 1:200 goat anti-mouse Alexa Fluor 488 (#A-11008,
Thermo Fisher Scientific; RID:AB_143165) and Cy3 AffiniPure Donkey anti-rabbit (#711-165-152,
Jackson Immuno Research) for 1 hr followed by PBS washed, 1:400 DAPI staining, washed with PBS
and imaged. Organoid viability imaging was determined by CellTrace Calcein Green (#C34852,
Thermo Fisher Scientific), Ethidium Homodimer-1 (#E1169, Thermo Fisher Scientific), Ki-67 (#9449;
Cell Signaling Technology; RRID:AB_2797703) incubated at 37˚C for 1 hr then washed with PBS and
imaged. Imaging was done using a Leica Confocal Microscope. Experiments were performed at least
twice and more than three technical replicates were obtained, a representation of one is shown.
Drug efficacy using in vivo tumor xenografts
In vivo drug efficacy studies were performed on 10 NSG (RRID:IMSR_JAX:005557) female random-
ized mice per cohort. Mice tested negative for pathogens listed on Indexx Bioanalytics Laboratory
IMPACT I testing including Mycoplasma spp., Mycoplasma pulmonis, mouse hepatitis virus, pneumo-
nia virus, murine norovirus, sendai virus, and Corynebacterium bovis. Tumor inoculation was induced
by subcutaneous injection in the left and right dorsal flank, each with a 150 mL suspension of 1–
5106 human colon cancer cells in PBS with Matrigel (1:1). Once tumor size reached 100 mm3, mice
were treated 3/week with DMSO vehicle or compound #4 via oral gavage (22 gauge 1 in. needle)
in a solution of 10% DMSO, 20% Kolliphor EL (Sigma-Aldrich, cat. no. C5135) and 70% PBS. Mouse
weight and tumor measurements were recorded 1–2 times per week. Tumor volume was calculated
as V=0.5*L*W^2, were L is length and W is width of the tumor. At the end of the experiment, mice
were euthanized by CO2. All in vivo procedures were performed according to an approved Institu-
tional Animal Care and Use Committee (IACUC) protocol #14–17 at Fox Chase Cancer Center.
Statistical analysis
To assess the statistical significance, two-way ANOVA or unpaired t-test for two comparisons was
performed, with pResearch article Biochemistry and Chemical Biology Cancer Biology
Therapeutics and potential conflict of interest to his academic institution/employer and is fully com-
pliant with NIH policies and institutional policies that is managing this potential conflict of interest.
Acknowledgements
This work was presented in part at the annual American Association for Cancer Research (AACR)
meetings in 2017, 2018, 2019, and 2020. LJHB received the AACR Minority Scholar Research Award
in 2017. This work was supported in part by NIH grants CA176289 (WSE-D). WSE-D is an American
Cancer Society (ACS) Research Professor and is supported by the Mencoff Professorship in Medical
Science at Brown University. This work was supported by the American Cancer Society and by the
Teymour Alireza P’98, P’00 Family Cancer Research Fund established by the Alireza Family.
Additional information
Competing interests
Wafik S El-Deiry: Founder and shareholder of p53-Therapeutics, Inc, a biotech company focused on
developing small molecule anti-cancer therapies targeting mutant p53. WSED has disclosed his rela-
tionship with p53-Therapeutics and potential conflict of interest to his academic institution/employer
and is fully compliant with NIH policies and institutional policies that is managing this potential con-
flict of interest; WSED is also a Senior Editor for eLife. The other authors declare that no competing
interests exist.
Funding
Funder Grant reference number Author
American Association for Can- Minority Scholar Research Liz Hernandez Borrero
cer Research Award
National Institutes of Health CA176289 Wafik S El-Deiry
American Cancer Society Wafik S El-Deiry
Teymour Alireza P’98, P’00 Fa- Wafik S El-Deiry
mily Cancer Research Fund
established by the Alireza Fa-
mily
The funders had no role in study design, data collection and interpretation, or the
decision to submit the work for publication.
Author contributions
Liz Hernandez Borrero, Conceptualization, Data curation, Formal analysis, Validation, Investigation,
Visualization, Methodology, Writing - original draft, Writing - review and editing; David T Dicker,
Formal analysis, Methodology; John Santiago, Formal analysis, Visualization; Jennifer Sanders,
Supervision, Writing - review and editing; Xiaobing Tian, Investigation, Methodology; Nagib Ahsan,
Formal analysis, Visualization, Writing - review and editing; Avital Lev, Formal analysis, Investigation,
Methodology; Lanlan Zhou, Formal analysis, Investigation, Visualization; Wafik S El-Deiry, Conceptu-
alization, Resources, Formal analysis, Supervision, Funding acquisition, Investigation, Visualization,
Methodology, Writing - original draft, Project administration, Writing - review and editing
Author ORCIDs
Liz Hernandez Borrero https://orcid.org/0000-0003-4249-5358
Wafik S El-Deiry https://orcid.org/0000-0002-9577-8266
Ethics
Animal experimentation: This study was performed in strict accordance with the recommendations
in the Guide for the Care and Use of Laboratory Animals of the National Institutes of Health. All of
Hernandez Borrero et al. eLife 2021;10:e70429. DOI: https://doi.org/10.7554/eLife.70429 19 of 21You can also read