Monthly Economic Review - August, 2020 - ECONOMIC DIVISION - Department of Economic Affairs
←
→
Page content transcription
If your browser does not render page correctly, please read the page content below

ECONOMIC
                  DIVISION

Monthly Economic
    Review
   August, 2020
Executive Summary

Data now available for the April-June quarter confirms a significant world-wide
year-on-year contraction of output resulting from the COVID-19 pandemic. US economy has
contracted by 9.1 per cent, UK, France, Spain, Italy and Germany by 21.7 per cent, 18.9 per
cent, 22.1 per cent, 17.7 per cent and 11.3 per cent respectively with the overall Euro area
contracting by 15.0 per cent and Japan has contracted by 9.9 percent. Relative to these
advanced nations, India’s GDP contraction at 23.9 per cent is slightly higher. The higher
contraction has resulted from the stringent lockdown that India enforced in the April-June
quarter. India enforced the most stringent lockdown as reflected in the Government
Response Stringency Index developed by Oxford University. The lockdown has enabled India
to restrain the pandemic induced death rate to one of the lowest in the world. India’s case
fatality rate was at 1.78 per cent as on 31st August as compared to 3.04 per cent in US, 12.35
per cent in UK, 10.09 per cent in France, 1.89 per cent in Japan and 13.18 per cent in Italy.

As countries unlocked in the quarter starting in July, recovery is underway globally. India,
too, is witnessing a sharp V-shaped recovery. India’s manufacturing purchasing managers’
index (PMI), at 52.2, has moved into expansionary zone in August for the first time since the
lockdown, presenting much required recovery prospects for the manufacturing sector. The
V-shaped pattern of recovery is seen in the following high-frequency indicators: auto sales,
tractor sales, fertilizer sales, railway freight traffic, steel consumption and production,
cement production, power consumption, e-way bills, GST revenue collection, daily toll
collections on highways, retail financial transactions, manufacturing PMI, performance of
core industries, capital inflows and exports.

Since May, agriculture has persistently been the brightest spot in the revival of growth.
Industrial production is showing definite signs of recovery with year-on-year (YoY) growth
in eight core industries output showing a smaller contraction in July than in June.
Consumption is picking up with passenger vehicle sales rising to their highest level at 1.83
lakh in July as compared to 1.43 lakh in March. Some revival in rural demand is also seen in
growing sales of small cars, two-wheelers and sports utility vehicles and fertilizers. Increase
in registrations for commercial and agricultural tractors from 52,362 in March to 66,061 in
August is further indicative of strengthening rural demand.

Growth in activity since the April-June quarter is further evident in the railway freight traffic
of 95.2 million tonnes in July, closing on to its previous year level of 99.7 million tonnes. In
the first twenty-days of August, railway freight volume at 60.38 million tonnes has now
crossed its previous year level of 56.60 million tonnes. Also creeping up as India unlocks are
railway passenger bookings from -7.92 million in April (cancellation of bookings) to 14.62
million in July and domestic aviation passengers from 2.8 lakh in May to 21.1 lakh in July.
Steel production at 74.02 lakh tonnes and cement production at 242.47 lakh tonnes in July,
as compared to 86.13 lakh tonnes and 280.2 lakh tonnes respectively in the corresponding
month of the previous year suggest revival of construction activity.

                                                 1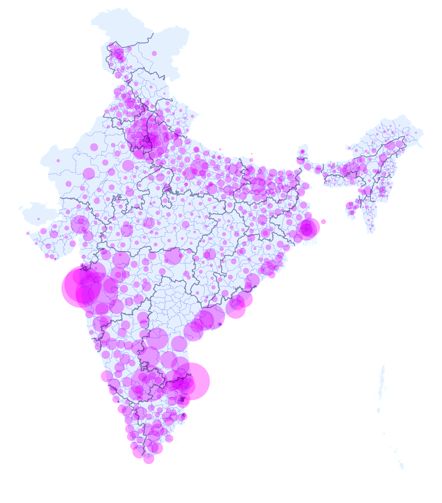
Power consumption is quickly reverting to the last year’s baseline, reaching 97 per cent of
corresponding previous year levels and crossing pre-COVID (February) levels in August,
2020. Sustained impetus in E-way bills generated is reflected in their value at Rs. 13.8 lakh
crore in August, reaching 97.2 per cent of corresponding month of the previous year. E-way
bills are a strong and leading indicator of revenue collections, supply chain corrections and
logistics growth, and thus their significant growth augurs well for early resumption of
economic normalcy. Further, average daily electronic toll transactions and collections in
2020 have sequentially moved in tandem with value of e-way bills, reaching 80 per cent of
pre-COVID (February) levels in August. Growth of electronic toll collections, broadband
subscribers and retail payments transactions via NPCI platforms reflects positive
externalities from the pandemic, apart from economic recovery.

Since the April-June quarter, global activity has entered the expansionary phase with global
composite output index moving to a six-month high of 50.8 in July and global manufacturing
index reaching a twenty one-month high of 51.8 in August. Increase in world demand
continues to pull up India’s economy with YoY growth in merchandize exports showing a
smaller contraction in July than in June. In the domestic space, rising central government’s
consumption spending has been supplementing domestic demand to drive GDP growth. The
growth outlook has improved with YoY contraction in GST collections declining from 38.0
per cent in May 2020 to 11.9 per cent in August 2020.

On the back of robust FDI and FPI inflows and savings from tepid imports, forex reserves, as
on August 21, have risen to an all-time high of USD 537.5 billion. These are capable of
financing more than 13 months of imports, should the need arise from a surge in real sector
activity. The domestic space is flushed with high systemic liquidity. A system flushed with
liquidity is a system ready to absorb a surge in real sector activity which is reflected in the
10-year benchmark bond yields declining from 6.55 per cent at end-April to 6.12 per cent at
end-August, and narrowing of spread in yields of 3-year AAA rated corporate bonds and
equivalent government securities from 246 basis points in end-April to 55 basis points in
end-August. With the MPC in its August meeting further keeping the policy rates unchanged,
the systemic liquidity is well entrenched to supply credit to the real sector.

The world after COVID-19 will be different with structural changes in production,
consumption and work patterns. As India emerges from this crisis, it will be critical to
re-orient the country’s policy matrix towards a calibrated reconstruction of the economy
and building resilience for an uncertain future. Some areas that may require specific
attention include agrarian supply chains, factor markets, infrastructure, ICT, start-ups,
financial inclusion, skilling and health care. Progress in these areas will sustainably boost
economic growth in years to come.

                                                2
Growth Contraction - Inevitable Impact of Lockdown
1. Data now available for the April-June quarter confirms a significant world-wide
year-on-year contraction of output resulting from COVID-19 pandemic. US economy has
contracted by 9.1 per cent, UK, France, Spain, Italy and Germany by 21.7 per cent, 18.9 per
cent, 22.1 per cent, 17.7 per cent and 11.3 per cent respectively with the overall Euro area
contracting by 15.0 per cent and Japan contracting by 9.9 percent. Relative to these
advanced nations, India's GDP contraction at 23.9 per cent is slightly higher.
2. India's GDP contraction in April to June (Q1 FY21) quarter reflects the unparalleled
effect of the Covid pandemic and the containment measures that have been taken to control
the pandemic. The first quarter of FY 2020-21 witnessed the rapid spread of the perplexing
virus, an unparalleled lockdown for two months and a sharp recovery as India unlocked in
June. With the economy brought to a standstill for two complete months, the inevitable effect
was a 23.9 per cent contraction in GDP as compared to previous year’s quarter.
3. India enforced one of the most stringent lockdowns as reflected in the Government
Response Stringency Index measured by Oxford University. Figure 1 shows the correlation
between the intensity of the lockdown and the magnitude of the GDP decline among
countries most affected by the virus. India’s 23.9 per cent decline is consistent with this
effect of the lockdown. The lockdown period gave a respite to ramp up the health and
testing infrastructure in the country. Due to timely tracing, treatment and reporting, the
number of people recovering from the virus is continuously rising and the active cases, as
on date, are 21 per cent of the total cases in the country. This has enabled it to restrain its
pandemic induced death rate to one of the lowest in the world (Table 1). India's case fatality
rate was at 1.78 per cent as on 31st August as compared to 3.04 per cent in US, 12.35 per
cent in UK, 10.09 per cent in France, 1.89 per cent in Japan and 13.18 per cent in Italy.
Figure 1: Stringent Lockdown led to Higher contraction
0
-5
Q2 GDP Growth rate
-10 USA
Germany Brazil
Canada
-15
Italy
-20 France
UK Mexico
-25 Spain India
-30
65 70 75 80 85 90
Intensity of Lockdown
Source: Oxford Covid-19 government response tracker, OECD
3Table 1: Global Stringency Index, Covid -19 Fatality Rate and Growth in Q2 2020
GOVERNMENT
COVID-19
RESPONSE GDP GROWTH
FATALITY
STRINGENCY INDEX RATE Year-on-Year
RATE (As on 31st
(0 TO 100. 100 in Q2 2020
August)
IMPLIES STRICTEST)
G-20 Advanced Economies
Canada 71.5 7.0 -13.0
France 78.1 10.1 -18.9
Germany 67.3 3.8 -11.3
Italy 70.4 13.2 -17.7
Japan 37.9 1.9 -10.0
Spain 72.5 6.3 -22.1
United Kingdom 74.9 12.4 -21.7
United States 72.0 3.0 -9.1
G-20 Emerging Markets
Brazil 77.6 3.1 -11.4
China 71.8 5.3 3.2
India 85.6 1.8 -23.9
Indonesia 69.6 4.2 -5.4
Mexico 78.8 10.7 -18.7
Russia 80.1 1.7 -8.5
South Africa 83.3 2.3
Turkey 72.0 2.4 -9.0
Source: Oxford Covid-19 government response tracker, 2019 Covid-19 Data Repository by Johns Hopkins
CSSE, OECD.
Note:* Average of April-June, 2020
4. Estimates released by the Ministry of Statistics and Programme Implementation
showed that India’s Gross Domestic Product (GDP) growth rate had contracted by 23.9%
for the April to June quarter in FY 2020-21. In Gross Value Added (GVA) terms, the
economy had contracted by 22.8%. On the demand side, private consumption spending fell
by 26.7 per cent, enduring a severe behavioral shock with demand for discretionary items
reducing to negligible levels. Investment demand also declined by 47.1 owing to the
ensuing pandemic-induced uncertainty. This demand contraction was moderately offset
primarily by higher and counter-cyclical government spending by 16.4 per cent. On the
GVA side, the decline was broad-based with deepest fall of 50.3 per cent experienced in
construction followed by services like trade, hotels, transport and communication,
manufacturing and mining. Agriculture emerged as the bright spot, growing at a healthy 3.4
per cent.
4Worst behind us, economy in Q2 witnessing a recovery
5. With India unlocking, the worst seems to be behind us as high-frequency indicators
show an improvement, June onwards, from the unprecedented trough the economy had hit
in the first quarter. Readings of economic data suggest growing convergence with previous
year’s activity levels on several indicators. Broad-based resurgent growth in several high
frequency indicators such as PMI Manufacturing, eight core, E-way bills, Kharif sowing,
power consumption, railway freight, cargo traffic and passenger vehicle sales augurs well
for prospects of growth recovery.
Resurgence in rural demand
6. Passenger vehicles sales grew to the highest levels in July since March, inching very
close to previous year levels. Growth in sales of small cars, two-wheelers and sports utility
vehicles offer early signs of revival in rural demand and tentative urban demand (Figure 2).
Rising sales of fertilizers and registrations for commercial and agricultural tractors from
March to August also are further indicative of strengthening rural demand (Figures 3 and 4).
Figure 2: Auto Sales Figure 3: Growth in Vehicle Registration
120 15 80%
60%
100
40%
80 10 20%
Lakh
0%
'000
60
-20%
40 5 -40%
20 -60%
-80%
0 0 -100%
Jan/20
Mar/20
Feb/20
Apr/20
May/20
Jun/20
Jul/20
-120%
JAN FEB MAR APR MAY JUN JUL AUG
Three Wheelers AGRICULTURAL TRACTOR M-CYCLE/SCOOTER
Sports utility MOTOR CAR TRACTOR (COMMERCIAL)
Passenegr Vehicles (RHS) GOODS CARRIER
Source: IHS Markit Source: SIAM
5Figure 4: Strengthening prospects of rural demand
Tractor Sales Fertilizer Sales
100 60% 30
40%
25
20%
0% 20
Lakh Tonnes
Thousands
50 -20%
15
-40%
-60% 10
-80% 5
0 -100%
Apr/20
Jul/20
Jan/20
Mar/20
Feb/20
May/20
Jun/20 0
Jan/20 Feb/20 Mar/20 Apr/20 May/20 Jun/20 Jul/20
Sales YoY Growth (RHS) Urea DAP NPKS MOP SSP
Source: Tractor and Mechanization Association Source: Department of Fertilizers
Rail freight on an upward trajectory
7. Momentum in railway freight traffic continued as it inched closer to previous year
levels in July (Figure 5). The recovery was driven by movement of steel, iron ore export,
coal, foodgrains, fertilizers and EXIM container services. Cement, petroleum products
(POL) and domestic container services, however, witnessed decline in growth in the month.
August also saw a sustained growth with provisional railway freight volume crossing
previous year levels in the first twenty days of the month. Railway passenger bookings
picked up in July and August, particularly in the Northern zone and sub-urban regions of
Central and Western zones.
Figure 5: Railway Freight Traffic
160 40% 150%
30% 100%
110
20% 50%
60
Million tonnes
10%
0%
10 0%
-50%
Jan Feb Mar Apr May Jun Jul Aug* -10%
-40 -100%
-20%
-90 -150%
-30% Jan/20 Feb/20 Mar/20 Apr/20 May/20 Jun/20 Jul/20
-140 -40% Coal Pig iron & finished steel
Iron ore Cement
2019 2020 Growth (YoY, RHS) Foodgrain Fertilisers
POL Container service (Dom)
Container service (EXIM)
Source: Ministry of Railways, Data till 20th August
6V-shaped recovery in steel sector, uptick in construction activity
8. Indian steel sector demonstrated a V-shaped recovery in July from its April lows with
domestic production and consumption gaining strong pace (Figure 6). Construction activity
also picked up in June with cement production erasing most of the sharp contraction in
April (Figure 7).
Figure 6: Steel Consumption & Figure 7: Cement Production
Production
35 20%
10 100%
30 0%
6
50%
Million Tonnes
25
Million Tonnes
-20%
2
0% 20
-40%
-2
15
-50% -60%
-6 10
5 -80%
-10 -100%
Jan Feb Mar April May June July
0 -100%
Consumption Growth (RHS) Jan Feb Mar Apr May Jun Jul
Production Growth (RHS)
Consumption 2020 2019 Growth (YoY, RHS)
Production
Source: Joint Plant Committee, M/o Steel Source: DPIIT, Ministry of Commerce
Power consumption, E-way bills and highway toll collections reverting to baseline
9. Power consumption appears to be quickly reverting to the last year’s baseline reaching
97 per cent of corresponding previous year levels in August 2020 (Figure 8).
Figure 8: Power Consumption
4500 20.0%
4000
10.0%
3500
Mega Units (MUs)
3000 0.0%
2500
-10.0%
2000
1500 -20.0%
1000
-30.0%
500
0 -40.0%
6/Jul
20/Jan
3/Feb
11/May
25/May
8/Jun
3/Aug
17/Aug
31/Aug
2/Mar
16/Mar
30/Mar
13/Apr
27/Apr
20/Jul
6/Jan
17/Feb
22/Jun
2019 2020 Growth (YoY, RHS)
Source: POSOCO
710. Sustained impetus in E-way bills generated, a strong leading indicator of revenue
collections, supply chain corrections and logistics growth, augurs well for regaining
economic normalcy. In terms of value, e-way bills generated reached Rs. 13.8 lakh crore in
August, reaching 97.2 per cent of corresponding month of the previous year. Number of
e-way bills generated also reached 96.5 per cent of previous year levels with intra-state
e-way bills crossing last year’s count and inter-state e-way bills at 89.5 per cent of the same
(Figure 9).
Figure 9: E-Way Bills – Count and Value
7 18 20%
16 10%
6
14 0%
5 -10%
Rs Lakh Crore
12
4 -20%
Crore
10
-30%
3 8
-40%
2 6
-50%
1 4 -60%
2 -70%
0
0 -80%
Jan/19
May/19
Jul/19
Nov/19
Jan/20
Sep/19
May/20
Jul/20
Mar/19
Mar/20
Jan Feb Mar Apr May Jun July Aug
Intra Inter Total E-Way Bills generated 2020 2019 Growth (YoY, RHS)
Source: Goods and Services Tax Network
11. The growth outlook has improved with YoY contraction in GST collections declining
from 38.0 per cent in May 2020 to 11.9 per cent in August 2020 (Figure 10). GST collections
stood at Rs 86,449 crore during August 2020, 88 per cent of the figure of the same month last
year.
Figure 10: GST Collection
1.2 20%
1.0
0%
Rs. Lakh Crore
0.8
-20%
0.6
-40%
0.4
-60%
0.2
0.0 -80%
Jan feb Mar Apr May Jun Jul Aug
2019 2020 Growth (YoY, RHS)
Source: GSTN
812. Toll collections on highways have also picked up significant pace in the last three
months, reaching 85 per cent of pre-Covid (February) levels in August. However, the
re-imposition of local lockdowns and flood situations in some states interrupted the
recovery in first half of July (Figure 11).
Figure 11: Average Daily ETC Count and Collection
Count (Lakh) Pre Covid Level Collection (Rs Crore) Pre Covid Level
40
35 70
30 60
25 50
20 40
15 30
10 20
5 10
0 0
Feb/20
Apr/20
May/20
Jun/20
Jul/20
Jan/20
Mar/20
Aug/20
Apr/20
Jul/20
Jan/20
Mar/20
Feb/20
May/20
Jun/20
Aug/20
Source: Ministry of Road, Transport and Highways
Upbeat digital retail transactions and broadband services growth, UPI payments at new
highs
13. Retail payment transactions via NPCI platforms rebounded sharply in June and July,
after the dip during the lockdown months of April and May, signalling a larger shift
towards online payments amid the pandemic (Figure 12). UPI payment transactions hit an
all-time high of Rs. 2.9 lakh crore in value and 149 crore in volume terms in July (Figure
13). Broadband subscriber base also grew in May after dipping in April.
Figure 12: NPCI Retail Financial Figure 13: UPI Payment Transactions
Transactions
Rs. Billion Million
Rs. lakh Crore 3500 1600
crore
18 300 1400
3000
16
250 1200
14 2500
12 200 1000
2000
10 800
150
8 1500
600
6 100 1000
4 400
50 500
2 200
- - 0 0
Oct/19
Dec/19
Apr/19
Jun/19
Aug/19
Feb/20
Apr/20
Jun/20
Apr/19
Jun/19
Aug/19
Oct/19
Dec/19
Feb/20
Apr/20
Jun/20
Value Number (RHS) Value Volume (RHS)
Source: NPCI
9Industrial production, the engine of growth, climbing up to recovery
14. Industrial production saw a record decline of 38.1 per cent in Q1 2020-21 owing to the
unprecedented blows of lockdown induced standstill during April and May. As India
unlocked, industrial production witnessed an uptick in June, thereby softening the quarterly
contraction. Consumer non-durables output sharply turned around to double digit growth
likely driven by release of pent-up demand and rebuilding of inventories. Contraction in
consumer durables, capital goods and infrastructure output also significantly eased. This
trend got bolstered in July with contraction in core industries output easing to 9.6 percent in
July relative to 12.9 per cent in June (Figure 14). Manufacturing purchasing managers’
index (PMI), after marginally slipping in July, moved into expansionary zone in August for
the first time since lockdown presenting optimistic recovery prospects for the
manufacturing sector (Figure 15). Output and new orders expanded at the fastest pace since
February.
Figure 14: Core Industries Performance Figure 15: PMI Manufacturing
75
Index
250
200 50
150
25
100
50
0
0
Feb/20
Apr/20
May/20
Jul/20
Jan/20
Mar/20
Jun/20
Aug/20
Jan/20 Feb/20 Mar/20 Apr/20 May/20 Jun/20 Jul/20
Coal Petroleum Ref. Products Output New Orders
Fertilizers Steel
Cement Electricity Employment Suppliers' Delivery Times
Overall Index Stocks of Purchases PMI Manufacturing
Source: DPIIT Source: IHS Markit
15. This is in line with the recovery in global activity for the first time in six months (Figure
16). Global economy edged back into expansionary territory, as output and new orders both
rose slightly during July. Global composite output index moved to a six-month high of 50.8
in July, up from 47.8 in June. Latest data on industrial activity complemented the recovery,
as industrial production in US and China expanded further in July by 3.0 per cent (month on
month basis) and 4.8 per cent (YoY basis) respectively. Additionally, business optimism
recovered globally to its highest in the past 15 months during July, moving back to its
pre-pandemic level. Global manufacturing index reached a twenty one-month high of 51.8 in
August.
10Figure 16: Global PMI Composite Indices
60 60
55
50 50
45 40
40
35 30
30
25 20
20 10
15
10 0
Apr/19
Jul/19
Dec/19
Apr/20
Jul/20
Jan/19
Mar/19
Feb/19
May/19
Jun/19
Aug/19
Sep/19
Oct/19
Nov/19
Jan/20
Mar/20
Feb/20
May/20
Jun/20
China US Eurozone Japan UK Global (RHS)
Source: IHS Markit
Exports recovering faster than imports
16. India’s external sector remains resilient. Merchandise exports witnessed broad-based
rebound in the last three months, inching closer to pre-Covid levels in July. Exports of food
items and pharmaceutical products showed healthy growth momentum in July owing to
higher global demand of these essential products (Figure 17).
Figure 17:Commodity Wise YoY Growth
Exports Imports
40%
100%
50% 0%
0% -40%
-50% -80%
-100% -120%
Dec/19
Feb/20
Apr/20
Jul/20
Mar/20
Oct/19
Nov/19
Jan/20
May/20
Jun/20
Dec/19
Oct/19
Nov/19
Jan/20
Mar/20
Feb/20
Apr/20
May/20
Jun/20
Jul/20
Crude oil & products Non-POL
Ores & minerals Leather & manufactures
Engineering goods Electronic goods
Textiles Readymade garments POL Crude petroleum
Gems & Jewellery Iron ore Non-POL Electronic goods
Agri & Allied Drugs, pharma & chemicals Gold Silver
Source: Department of Commerce, Ministry of Commerce & Industry
17. Recovery in imports remained relatively muted and less uniform in July, suggestive of
weak domestic demand for discretionary items. While crude oil and non-oil imports
continued to show dispirited growth, gold imports sharply rose on rising investor demand
for the safe-haven metal. As a result, India’s merchandise trade balance went back into
deficit in July after a surplus recorded in June (Figure 18).
11Figure 18: Merchandise Trade Balance
5 20%
0 0%
(US$ billion)
-5 -20%
-10 -40%
-15 -60%
-20 -80%
Oct/19
Dec/19
Apr/19
May/19
Jun/19
Jul/19
Aug/19
Sep/19
Nov/19
Jan/20
Feb/20
Mar/20
Apr/20
May/20
Jun/20
Jul/20
Merchandise trade balance Exports growth (RHS) Imports growth (RHS)
Source: Department of Commerce, Ministry of Commerce & Industry.
Robust FDI and FPIs at historic highs
18. On the financing side, net foreign direct investment (FDI) moderated to US$ 4.4
billion in April-May 2020 from US$ 7.2 billion a year ago, though robust in a pandemic era.
On the other hand, India garnered the highest foreign portfolio inflows in the first half of
2020 compared to its emerging market peers. This optimistic foreign investor sentiment
continued in July and August buoyed by record capital raising by leading domestic firms
and low global interest rates. In August, the selling spree in debt markets also reversed,
further bolstering market confidence (Figure 19).
Figure 19: FPI and FDI Flows
10 15
5 10
5
USD Billion
USD billion
0
0
-5
-5
-10
-10
-15 -15
-20 -20
Apr/19
May/19
Jun/19
Jul/19
Aug/19
Sep/19
Oct/19
Nov/19
Dec/19
Jan/20
Feb/20
Mar/20
Apr/20
May/20
Jun/20
Jul/20
Aug/20
Debt Equity Total net FPI Net FDI (RHS) Gross FDI (RHS)
Source: CSDL & RBI
19. Owing to weakening global recovery and dollar index and rising foreign inflows, RBI
actively intervened in forex market to prevent excess rupee appreciation and market
volatility (Figure 20). Rupee remained range bound at the 74.5-75 INR/USD in the first
12three weeks of August and appreciated in the last week to reach 73.59 INR/USD on 31st
August, 2020. India’s foreign exchange reserves continued to climb up to new highs on the
back of purposeful dollar buying by RBI, rise in gold reserves and foreign currency assets.
India’s foreign exchange reserves have increased by US$ 59 billion in 2020-21 so far
(April-August) to US$ 537.5 billion (as on August 21, 2020) – equivalent to more than 13
months of imports.
Figure 20: Net purchase (+)/sale (-) of US dollar
10000
8000
6000
USD Million
4000
2000
0
-2000
-4000
14 ug
21 ug
ug
08 ay
15 ay
22 ay
29 ay
05 y
10 pr
17 pr
24 pr
01 pr
03 ar
12 n
19 n
26 n
03 n
10 l
17 l
24 l
31 l
07 ul
/Ju
/Ju
/Ju
/Ju
a
/Ju
/Ju
/Ju
/Ju
/M
/J
/A
/A
/A
/A
/M
/M
/M
/M
/M
/A
/A
/A
27
Source: RBI
20. The trend in macro-economic indicators elucidated above establishes that India is well
on its path to a V-shaped recovery. Residual uncertainty persists because of the effect
created by the pandemic on the precautionary motive to save which affects sharply the
demand for discretionary goods and services. Unlike previous crises that originated from
economic factors, the uncertainty in the current crisis stems from health factors originating
from the pandemic. As a result, the uncertainty on discretionary items is likely to influence
recovery. The arrival of the COVID vaccine would signal the end of this uncertainty and
bring back discretionary consumption to pre-COVID levels.
Global Macro-economic overview
Inflation
21. Consumer prices rose modestly in most part of the World since June along with core
inflation, signalling petite recovery in demand conditions (Figure 21). PMI survey of July
highlighted that input cost inflation accelerated to its fastest since January. Output charges
rose for the first time in five months, reflecting higher selling prices at manufacturers and
service providers. Prices in major economies remained elevated during July. Crude oil
markets strengthened further in July compared to June with sustained demand from refiners
and gradual improvement in consumption demand for oil products as more countries lifted
13lockdown measures. Europe Brent prices increased moderately by 3.5 per cent in August to
US$ 44.7 per barrel from US$ 43.2 per barrel in July. Australian coal prices declined by 6.1
per cent in July compared to previous month as pace of Chinese coal imports appeared to
have slowed with increase in domestic coal production. The base metal price index rose by
5.3 per cent on month on month basis in July on improving prospects for global
manufacturing, particularly for its largest consumer, China (Figure 22).
Figure 21: Global Inflation Trend Figure 22: Commodity Prices
6% 200 2000
5%
150 1500
Index
4%
100 1000
3%
US$ per troy ounce
50 500
2%
1% 0 0
Jun/19
Jul/19
Sep/19
Oct/19
Dec/19
Feb/20
Apr/20
May/20
Jun/20
Jul/20
Mar/20
Aug/19
Nov/19
Jan/20
0%
Jan/19 Apr/19 Jul/19 Oct/19 Jan/20 Apr/20 Jul/20 All Commodity Base Metals
US China Natural Gas Coal Price
Euro Area Japan Crude Oil (petroleum) Gold (RHS)
Source: Compiled using various agencies Source: IMF
International trade on nascent recovery
22. World trade in volume terms, decelerated by 14.8 per cent (YoY) during second quarter
(Figure 23). Exports experienced greater decline than imports in volume terms with sharper
dip in trade activity across regions of advanced economies like US, Euro area and emerging
economies of Asia excluding China. International trade witnessed a nascent recovery in July
as new export orders observed lowest rate of contraction since January, both in
manufacturing and services sectors. Commercial flights, an indicator of trade activity, have
been rebounding gradually since May and continued to improve further in August (Figure
24). The RWI/ISL container throughput index rose significantly in July, with improved
handling capacity at ports especially outside China.
14Figure 23: International Trade Growth Figure 24: Commercial Flight Activity
4% 5% 120
Thousands
0% 0% 100
80
-4% -5%
60
-8% -10%
40
-12% -15% 20
-16% -20% 0
5/Jul
10/May
24/May
21/Jun
7/Jun
16/Aug
30/Aug
2/Aug
19/Jul
1/Mar
15/Mar
29/Mar
12/Apr
26/Apr
-20% -25%
Jan/19 Apr/19 Jul/19 Oct/19 Jan/20 Apr/20
Number of flights 7-day moving average
Import Growth Export Growth (RHS)
Source: CPB Bureau for Economic Policy Analysis Source: Flightradar24
Financial markets rebounded in August after mixed results in July
23. Global equity performance was mixed in July with a swift rebound in August as
investors weighed the hopes of a vaccine and signs of sharp recovery in some regions against
resurgence of the Coronavirus. US Dow Jones Index (DJI) gained by 2.4 per cent in July and
further by 7.6 per cent in August supported by robust quarterly earnings from leading
technology equities such as Amazon, Apple and Facebook despite unnerving economic data
releases (Figure 25).
Figure 25: Financial Market Performance Figure 26: Exchange Rates
1.4 105
40000
1.2
1 100
30000
0.8
95
20000 0.6
0.4 90
10000
0.2
0 0 85
1/Jan
15/Feb
15/May
30/May
14/Jun
29/Jun
14/Jul
29/Jul
1/Mar
16/Mar
31/Mar
15/Apr
30/Apr
16/Jan
31/Jan
13/Aug
28/Aug
May/19
Jul/19
Sep/19
May/20
Jul/20
Jan/19
Mar/19
Mar/20
Nov/19
Jan/20
Japanese Yen/USD Euro/USD
Nikkei 225 Shanghai Composite Chinese Yuan/USD Dollar Index (RHS)
FTSE 100 Dow Jones
Source: Compiled using various agencies Source: Thomson Reuters
Exchange rates: US dollar weakens against major economies
24. US dollar index has been weakening gradually since April. The US dollar index fell by
4.2 per cent in July, highest in a decade and depreciated further in August, albeit slowly
(Figure 26). Major currencies such as the Euro, British Pound, Japanese Yen and Chinese
Yuan were relatively stronger.
15Risks to Global Economy
25. Output recovery continues to face certain downside risks particularly, rising corporate
and household debt at unsustainable levels in emerging markets. Another risk, in terms of
probable asset price corrections, has emerged with a precarious divergence between market
optimism and evolution of real economy (Figure 27). Equity markets have bounced back
from their March troughs in the economies with systemically developed financial sectors.
Market sentiment has been bolstered by the reopening of some economies and the easing of
COVID-19 related lockdown measures. Fiscal and monetary policy support, in form of
government credit guarantees, restructuring of loans, capital and liquidity buffers to support
lending has further fuelled investor confidence. However, a rebound in global indices
coexists with a decline in consumer confidence indices. This disconnect between markets
and the real economy raises risks of asset price corrections should investor risk appetite fade.
A number of triggers in terms of second wave of virus followed by potential containment
measures or resurgence of trade tension could result in repricing of risk assets, adding to
global financial stress.
Figure 27: Divergence between Equity Market and Consumer Confidence
4000 160 8000 0
3500 140 7000 -5
3000 120 6000 -10
2500 100 5000 -15
2000 80 4000 -20
1500 60 3000 -25
1000 40 2000 -30
500 20 1000 -35
0 0 0 -40
Dec/19
Jul/19
Aug/19
Jan/20
Mar/20
Sep/19
Oct/19
Nov/19
Feb/20
Apr/20
May/20
Jun/20
Jul/20
Aug/20
Jul/19
Aug/19
Sep/19
Oct/19
Nov/19
Dec/19
Jan/20
Feb/20
Apr/20
May/20
Jun/20
Jul/20
Aug/20
Mar/20
S&P 500 Consumer confidence Index(RHS) FTSE 100 Consumer Confidence Index (RHS)
Source: Retrieved from Thomson Reuters
Domestic Macro-economic Review
Agricultural sector: the persistent bright spot
26. The agricultural sector continues to remain a bright and resilient spot supported by a
healthy south-west monsoon. The cumulative monsoon rainfall was 9.2 per cent above the
long-period average (LPA) up to September 2, 2020. Record total area sown under kharif
crops (Figure 28) and healthy live storage in major reservoirs bodes well for the rabi season
(Figure 29). Kharif harvest in the third quarter contributes to almost one-third of the GVA
in agriculture in India. A bumper kharif harvest will, therefore, provide the much needed
boost to GDP in the year 2020-21.
16Figure 28: Area sown - Kharif crops Figure 29: Current live storage
1,200 140
2020 2019 2020 2019
1,000 120
100
Lakh Hectares
800
Billion Cubic
80
600
60
400
40
200
20
0
0
Oilseeds
Sugarcane
Total
Cereals
Pulses
Fibres
Foodgrain
11/Jun
18/Jun
25/Jun
06/Aug
13/Aug
20/Aug
27/Aug
02/Jul
09/Jul
16/Jul
23/Jul
30/Jul
Source: Ministry of Agriculture, as on 28th Aug. 2020 Source: CWC
27. Amid COVID-19 induced supply chain disruptions, harvesting, procurement and
off-take operations sustained their momentum in July with Food Corporation of India (FCI)
and states playing an active part (Figures 30 and 31).
Figure 30: Offtake of wheat and rice Figure 31: Procurement of wheat and rice
600
300 Apr-20 May-20 Jun-20 Jul-20
2019 2020
250 500
Lakh Metric Tonnes
Lakh Metric tonnes
200 400
150 300
100 200
50 100
0 0
Wheat Rice Rice Wheat
Source: Food Corporation of India
Source: FCI
Modest resumption in services
28. PMI services index marginally improved in August to 41.8 over 34.2 in July though
still in contractionary zone (Figure 32). Movement of other high frequency indicators of
services sector activity also suggest modest resumption of economic activity.
17Figure 32: PMI Services Performance
70
60
50
40
30
20
10
0
Jan 20 Feb 20 Mar 20 Apr 20 May 20 Jun 20 Jul 20 Aug 20
Employment Prices Charged New Business Input Prices
Outstanding Business Business Expectations New Export Business PMI Services
Source: IHS Markit
Cargo traffic on an upward trajectory, aviation activity catching up
29. Cargo traffic volumes also rebounded appreciably in July with iron ore, fertilizers, coal
(thermal and steel) and containerised cargo driving the improvement. However, POL traffic
in both cargo and railway freight continued its sombre trends. Domestic civil aviation
activity is also creeping up with the upcoming festive months expected to further boost
growth (Figure 33).
Figure 33: Air and Port Traffic
100% 140
100
50% 60
20
Lakh
0%
-20
-50% -60
-100
-100% -140
Jan Feb Mar Apr May Jun Jul
Domestic Air Cargo Growth (YoY) Port traffic Growth (YoY) Domestic Passengers handled (RHS)
Source: Indian Ports Association, DGCA, AAI
Oscillating recovery in oil markets
30. Global oil markets continued to remain vulnerable to risks of prolonged second wave
of COVID-19 pandemic. Crude oil prices recovery remained volatile in August with easing
OPEC+ supply cuts, dim demand and weather concerns in US markets. India’s crude oil
price rose only moderately from US$ 42.98 per barrel as on 31 July to US$ 44.41 per barrel
as on 31 August (Figure 34). India’s consumption of petroleum products dampened by 3.7
18per cent in July compared to June partly due to seasonal factors such as greater reliance of
agriculture on renewable sources of power during monsoon (Figure 35). Re-imposed
lockdowns and floods also had a debilitating effect on diesel consumption.
Figure 34: Crude oil & Fuel Prices in 2020 Figure 35: Consumption of petroleum
products, diesel and petrol vehicle
registerations
90 70
25 25
80 60
70 20 20
50
Million Tonnes
60
USD/Barrel
Rs/Litre
50 40 15 15
Lakh
40 30
30 10 10
20
20
10 5 5
10
0 0 0 0
19/Jan
19/Feb
19/May
19/Jun
19/Aug
19/Jul
19/Mar
19/Apr
Jan Feb Mar Apr May Jun Jul Aug
Petrol
Diesel
Indian Basket (RHS) Price of Petrol Petroleum Consumption 2020 (RHS)
Price of Diesel Petroleum Consumption 2019 (RHS)
Source: PPAC, MoPNG
Government consumption demand providing necessary pandemic proofing
31. Government consumption spending has provided a measure of relief, with central
government’s revenue expenditure, net of interest payments and major subsidies, having
risen by 33.7 per cent in the first quarter of the year. Public finances have, however, been
stretched by the imperative to mitigate the impact of COVID-19. Gross market borrowings
by the Centre rose to Rs. 5.84 lakh crore upto 21 August, 2020, i.e. 1.72 times the amount
raised in the last year. Gross borrowing of States has increased by 58.7 per cent
year-on-year till 21 August with Karnataka, Maharashtra and Tamil Nadu among the top
borrower states (Figures 36 and 37).
Figure 36: Gross Market Borrowings- Figure 37: State Borrowing- State wise
Centre & States
7 50000 500%
40000 400%
6
300%
Rs Crore
5 30000
Rs Lakh Crore
200%
4 20000
100%
3
10000 0%
2
0 -100%
1
Rajasthan
Aruna.Pradesh
Punjab
MP
Manipur
Bihar
Karnataka
Assam
Mizoram
Telangana
Kerala
Meghalaya
Tamil Nadu
0
3/Jul
3/Apr
12/Jun
19/Jun
26/Jun
1/May
8/May
15/May
22/May
29/May
5/Jun
14/Aug
21/Aug
7/Aug
10/Jul
17/Jul
24/Jul
31/Jul
10/Apr
17/Apr
24/Apr
As on 1 Sept 2020 As on 3rd Sept 2019
GOI State Govt % YoY Change (RHS)
Source: RBI
1932. At the end of July 2020, fiscal deficit stood at Rs. 8.2 lakh crore which is 103.1 per
cent of BE compared to 77.8 per cent during the first four months of fiscal year 2019
(Figure 38). The interruption in economic activity due to COVID-19 has led to shortfall in
revenue collections. Net tax revenue collections stood at 12.4 per cent of BE compared to
20.5 per cent in the corresponding period of previous year. Personal Income Tax collections
upto July end amounted to Rs. 0.91 lakh crore, compared to Rs. 1.29 lakh crore in the
corresponding period of previous year. Non-debt capital receipts declined and stood at Rs.
5458 crore which is 2.4 per cent of BE compared to 14.2 per cent last year. On the
expenditure side, capital expenditure stood at Rs. 1.12 lakh crore, 27.1 per cent of BE as
compared to 31.8 per cent last year. Revenue expenditure was Rs. 9.42 lakh crore, 35.8 per
cent of BE compared to 34.3 per cent in corresponding period of 2019-20. While the
pandemic has constrained the fiscal envelope of the government, the corporate tax cut of
September 2019 has provided necessary relief to businesses to service debt, build-up cash
balances and other current assets in these trying times.
Figure 38: Fiscal Deficit
9.0
8.0
7.0
Rs. Lakh Crore
6.0
5.0
4.0
3.0
2.0
1.0
0.0
Apr/20 May/20 Jun/20 Jul/20
Fiscal Deficit (Actual) Fiscal Deficit (as budgeted)
Source: CGA
Risks of an apparent disconnect between the real and financial sector
33. Risk taking sentiment has returned with global and domestic equity markets on an
untamed recovery path, reaching pre-COVID highs and recouping most of their losses. The
recent gush of liquidity in emerging markets is driven by low interest rates, unprecedented
monetary priming by major global central banks and optimistic prospects of COVID-19
vaccine. Stock markets are deriving their inexplicable buoyancy from this global surplus
liquidity. The Nifty VIX index, a leading indicator of market volatility, has also dropped
sharply from the March highs signalling ebbing investor fears (Figure 39). This, however,
raises concerns of an underlying disconnect between the real and financial sectors. Possible
risks of disruptive market corrections may manifest in terms of capital flight, currency
20volatility and ensuing worsening of balance-sheets of firms, posing negative
macro-implications for global labour markets as well.
Figure 39: Net FII Flows, Nifty and Volatility Index
140 3
120 2
100
USD Billion
1
80
0
60
-1
40
20 -2
0 -3
01/Jan
08/Jan
15/Jan
22/Jan
29/Jan
07/May
14/May
21/May
29/May
05/Jun
12/Jun
19/Jun
26/Jun
07/Aug
14/Aug
21/Aug
28/Aug
04/Mar
12/Mar
19/Mar
26/Mar
03/Apr
15/Apr
22/Apr
29/Apr
03/Jul
10/Jul
17/Jul
24/Jul
31/Jul
04/Feb
11/Feb
18/Feb
26/Feb
FII (RHS) NIFTY 50* VIX
Source: NSDL, NSE. Note: *Nifty 50 rescaled by factor 100
Systemic liquidity continues to be in surplus
34. With conventional and unconventional measures adopted by RBI, domestic financial
conditions have eased substantially and systemic liquidity remains in large surplus (Figure
40). Cumulatively, these measures injected liquidity of the order of Rs. 9.57 lakh crore or
4.7 per cent of GDP. Reflecting these developments, reserve money increased by 14.7 per
cent on a year-on-year basis (as on Aug 21, 2020), driven by a surge in currency demand
(23.5 per cent). Growth in money supply (M3), however, was contained at 12.6 per cent as
on August 14, 2020 (Figure 41).
Figure 40: Liquidity Injection Figure 41: Money Stock and its
(+)/Absorption (-) Components
30 30%
25
20%
20
Rs. Lakh Crore
15
10%
10
5 0%
0
-10%
-5
22/May
5/Jun
14/Aug
13/Mar
27/Mar
10/Apr
24/Apr
3/Jul
17/Jul
31/Jul
17/Jan
31/Jan
14/Feb
28/Feb
8/May
19/Jun
-10
-15
Currency with the public Notes in Circulation
1/Jan
4/Aug
17/Jul
13/Mar
31/Mar
18/Apr
19/Jan
24/May
11/Jun
29/Jun
22/Aug
6/Feb
24/Feb
6/May
Deposit Money of the Public Demand Deposits with Banks
Post Office Savings Deposits Time Deposits with Banks
Money supply(M3)
Source: RBI
21Precautionary demand for cash and time deposits continues to remain high
35. The resultant uncertainty from COVID-19 led to a sharp surge in precautionary
demand for currency and concomitant drawdown in demand deposits in the last quarter of
FY 2019-20. Moderation in deposit growth signalled impact of reduction in interest rates
and subdued deposit mobilisation. Resultantly, currency-GDP ratio increased from 11.3 per
cent in 2018-19 to 12 per cent in 2019-20.
36. With the pandemic effects intensifying, year-in-year growth in cash demand
continued to increase in 2020 with a slight moderation to 22.7 per cent as on August 14.
This rise in currency-in-circulation is a global phenemenon, witnessed not only in emerging
markets but also in advanced economies such as United States, Spain, Italy, Japan and
France where the use of cash is limited. Demand deposit growth has been on a rise since
May reaching a high of 14.6 per cent in the fortnight ending July 31 to subsequently
decline to 10.8 per cent as on August 14. Time deposits have continuously risen possibly
explaining the risk aversion of investors and switch to safer avenues.
Bond yields soften, greater easing at the lower end of the yield curve, moderate uptick in
late August
37. With COVID-19 reorienting the global economy and government finances, bond yields
have been fluctuating since the outbreak of the pandemic. The Indian bond market is no
exception. As the pandemic started its rapid spread in March, investors sold off equities and
other risk assets and sought refuge in the bond market. This led to a bond price rally since
mid-April only to stabilize in July. RBI's response to the pandemic induced financial
market volatility via unprecedented policy rate cuts and massive liquidity operations also
supported the bond price rally. Consequently, 10 year benchmark bond yields, which
climbed to a high of 6.86 percent in mid-April fell drastically to 5.96 percent in
mid-August (Figure 42). Further, RBI’s liquidity infusion through LTROs and TLTROs
brought down short term interest rates, which led to steepening of the yield curve. RBI’s
Monetary Policy Committee (MPC) in its latest bi monthly meeting kept the policy rates
unchanged, citing quickening inflationary pressures. This hint of pause in rate cuts until
price pressures wane inevitably stirred the bond market with 10-year benchmark bond
yields rising back to more than 6 percent in late August. However, RBI's announcement of
OMO of government securities worth Rs. 20,000 crore to be conducted in two tranches on
August 27 and September 3 are expected to soften bond yields.
22Figure 42: G-sec Yields across tenors
8%
7%
6%
5%
4%
3%
2%
1%
0%
Jan Feb Mar Apr May Jun Jul Aug
1 year 3 year 5 year 10 year 15 year
Source: FBIL & CCIL
Upbeat corporate bond market, credit spreads narrow down
38. Borrowings costs on corporate bonds have significantly eased to fifteen year lows after
record global and domestic stimulus measures to mitigate COVID-19’s financial fall out.
Renewed interest has emerged in this market with 91 maiden corporate bond issuers so far
this year (Figure 43). These developments bode well for deepening of the corporate bond
market and providing more choices for investors. At the same time, this optimism is also
driven by the current liquidity flush into emerging bond markets. With illiquidity premia
dissipating under the impact of Operation Twist and TLTRO 1.0, spreads of 3-year
AAA-rated corporate bonds over similar tenor government securities have also declined
from 246 basis points at end-April to 55 basis points in end-August (Figures 44 and 45).
Figure 43: Private Placement of Corporate bond
1.2 120%
100%
1
80%
Rs. Lakh Crore
0.8 60%
40%
0.6
20%
0.4 0%
-20%
0.2
-40%
0 -60%
Jan Feb Mar Apr May June July
2020 2019 Growth (YoY, RHS)
Source: SEBI
23Figure 44: Corporate Bond Yields(AAA) Figure 45: Spread between G sec and
Corporate bond Yields (bps)
250
9%
8% 200
7%
6% 150
5%
4% 100
3%
2% 50
1%
0% 0
Jan-20 Feb-20 Mar-20 Apr-20 May-20 Jun-20 Jul-20 Jan-20 Feb-20 Mar-20 Apr-20 May-20 Jun-20 Jul-20
1 YEAR 5 YEAR 10 YEAR 1 YEAR 5 YEAR 10 YEAR
Source:Extracted from CMIE Source: RBI, CMIE
While overall credit growth continues to remain muted, credit for agriculture, large
industry and Micro & Small Enterprises (MSE) improve, services credit growth robust
39. Credit offtake from banks was muted during FY 2019-20, growing at 6.1 per cent y-o-y
in a sharp loss of pace from 13.3 per cent a year ago (Figure 46). Bank credit growth
continued to moderate in the first five months of this year at 5.5 per cent as on 14th August
2020 mirroring weak credit demand and increased risk aversion in the banking system.
Further, regional lockdowns and the consequent slowing of economic cycle has added to
weak credit off-take.
Figure 46: Credit Growth YoY
8% 60%
7%
50%
6%
40%
5%
4% 30%
3%
20%
2%
10%
1%
0% 0%
3/Jan
5/Jun
3/Jul
13/Mar
27/Mar
17/Jan
31/Jan
14/Feb
28/Feb
19/Jun
8/May
22/May
14/Aug
17/Jul
31/Jul
10/Apr
24/Apr
Non Food Credit Bank Credit Food Credit (RHS)
Source: RBI
40. However, sector-wise credit has improved month-on-month in June compared to April
and May, particularly for agriculture and allied-activities, large industries and MSEs. Credit
to services sector continued to grow at a robust 10.7 per cent YoY in June inching closer to
24previous year levels with month-on-month recovery seen in real estate, NBFCs, trade and
tourism. Personal loans and housing loans in particular, also picked up in June, auguring
well for consumption sentiment (Figure 47).
Figure 47: Sector wise Credit Growth
20% 50%
15% 40%
10% 30%
5% 20%
0% 10%
-5% 0%
-10% -10%
Mar. 27 Apr. 24 May 22 Jun 19
Agri & Allied Activity Industry Micro & Small
Large Services Tourism, Hotels & Restaurants
Trade Commercial Real Estate NBFCs
Personal Loans Housing Priority Sector
Consumer Durables (RHS)
Source: RBI
41. The overall uptick in MSME credit in June may be attributed to the Emergency Credit
Line Guarantee Scheme announced in May under the 20 lakh crore Atma-Nirbhar package
of the Government. As on 12 August, 32.8 per cent of the committed amount under the
scheme has been disbursed in 22.7 lakh MSME loan accounts. 55.4 per cent of the
disbursement came from 12 public sector banks and the remaining from 24 private banks
and 31 NBFCs.
Improving monetary policy transmission, increasing Commercial Paper (CP) issuances for
NBFCs
42. Strong liquidity interventions via LAF route by RBI have enabled improved monetary
policy transmission. Interest rates on instruments like the 3-month Treasury bill, CP and
certificates of deposit have fully priced in the reduction in the policy rate and are, in fact,
trading below it in the secondary market. Commercial paper issuances in FY 2020-21 are at
an all-time high (Figure 48). Effective weighted average yield of CPs has decreased from
5.39 per cent in April to 3.99 per cent in July. Oil and gas and NBFC sector dominated the
CP issuance market with more than 50 per cent share. Market financing conditions for
NBFCs, which had become challenging, have largely stabilised in the wake of targeted
policy measures (Figure 49). CPs yield of NBFCs has softened to reach 3.80 per cent as on
July 31, 2020.
25Figure 48: Monthly issuance of Figure 49: CPs raised by NBFC Sector in
Commercial Paper (CP) FY2021 ( Rs. crore)
Month Financial HFC NBFC MFI Total
2.5 6%
institutions
2 5%
Rs. Lakh Crore
April 7275 4400 4275 - 15950
4%
1.5
3%
May 1000 6950 22033 - 29983
1
2%
0.5 1% June 6000 5000 17963 5 28968
0 0%
July 2650 1775 19406 10 23841
Apr May June July
2020
2019 Aug 16925 18125 63677 15 98742
Weighted Av Yield (WAY,RHS)
Source: CCIL
Mutual funds recover from Franklin Templeton shock
43. Abundant liquidity has supported other segments of financial markets too. In particular,
mutual funds have recovered from the shocks of the Franklin Templeton episode. Assets
under management of mutual funds rose by Rs. 89,812.78 crore to Rs. 27.11 lakh crore in
July over June (Figure 50). Net inflows into debt mutual funds have shown a healthy uptick
in liquid funds, short duration funds, corporate bond funds, and banking and PSU funds
demonstrating revival of market confidence (Figure 51 and 52). Equity mutual funds,
however, witnessed an outflow for the first time in four years in July, possibly exhibiting
profit-booking opportunities in over-valued stocks amid surging foreign equity inflows.
Figure 50: Assets under Management of Mutual funds
30.0 20%
25.0 15%
Rs. Lakh Crore
20.0 10%
15.0 5%
10.0 0%
5.0 -5%
0.0 -10%
Jan Feb Mar Apr May June July
2020 2019 Growth (YoY, RHS)
Source: SEBI
26Figure 51: Debt and Equity Mutual Figure 52: Net inflows into debt mutual
Funds funds
4 1
3
0.5
Rs. Lakh Crore
Rs. Lakh Crore
2
1 0
0 -0.5
-1
-2 -1
-3 -1.5
Jan/20 Feb/20 Mar/20 Apr/20 May/20 Jun/20 Jul/20 Jan/20 Feb/20 Mar/20 Apr/20 May/20 Jun/20 Jul/20
Equity Oriented Schemes Debt Oriented Schemes Short Duration Fund Corporate Bond Fund
Total Flow Banking and PSU Fund Liquid Fund
Source: SEBI
Price pressures emerge amid monsoons and continued clogging of supply chains
44. India’s retail inflation climbed up to 6.93 per cent in July against a revised 6.23 per
cent in June with food prices, accounting for half of the CPI basket, dominating the rise
(Figure 53). CPI core inflation also inched up to a 21 month high of about 5.79 percent,
reflecting underlying price pressures. Persistent supply chain disruptions seem to have
more than offset the impact of weak demand. Food cargo movement was restricted owing
to re-instatement of lockdowns in many cities and heavy rains in agrarian states. While
food inflation remained the dominant factor, rising transport costs due to higher domestic
taxes on petroleum products also contributed to the inflationary trends. As per RBI’s latest
MPC statement, headline inflation is expected to remain elevated in Q2:2020-21, but likely
to ease in H2:2020-21, aided by favourable base effects. A more favourable food inflation
outlook may emerge in the coming months with bumper rabi harvest and improving food
surplus management possibly easing prices of cereals. Price stabilisation in crude and retail
fuels in August is also likely to ease incremental pressures on headline inflation.
Figure 53: Inflation Dynamics
16% 8
14%
12% 6
10% 4
8%
Per cent
6% 2
4%
0
2%
0% (2)
-2%
-4% (4)
Jan/19
May/19
Jul/19
Sep/19
Nov/19
Jan/20
May/20
Jul/20
Mar/19
Mar/20
Jul/19
Sep/19
Jul/20
Jan/19
Mar/19
May/19
Nov/19
Jan/20
Mar/20
May/20
Food Inflation Rural Core Inflation CPI Core - Rural CPI Core - Urban
Combined CPI WPI - Core CPI-Core (Combined)
Source: MoSPI Source: MoSPI, Office of Economic Advisor
27Corporate results: Resilient and stressed sectors
45. Corporate results of Q1 2020-21 show that sectors like Pharma, FMCG and Fertilizers
reported growth in revenue, operating profit and improvement in margins. Some sectors
like Cement, Cement Products and Mining also reported margin improvement over Q1
2019-20, despite a decline in revenue (Figure 54).
Figure 54: Corporate results: YoY Growth in Q1 FY2020-21
500% 80%
400% 60%
300% 40%
200% 20%
100% 0%
0% -20%
-100% -40%
Pharmaceuticals
Cement Products
Mineral products
Cement
Edible Oil
FMCG
Fertilizers
Agro Chemicals
Healthcare
EBIDTA Net Sales (RHS)
Source: SBI Research
46. The ubiquitous impact of COVID-19 may be seen in the broad-based rating
downgrades across sectors in Q1 2020-21. Major sectors that have opted for relief under
moratorium on loan servicing include Metal, Power, Real Estate, Textile, Construction etc.
However, all may not be under stress and some of the entities in the sectors such as Pharma,
FMCG might have opted due to uncertainty and preference to conserve cash during these
times.
Figure 55: Credit Ratios by industry Figure 56: Loan Moratorium & D/E
Ratio- Sector Wise
Realty Rs. Lakh
Crore
Textiles 2 1.4
Fertilizers 1.2
1.6
FMCG 1
Consumer Durables 1.2 0.8
Non Ferrous Metals 0.6
0.8
Healthcare 0.4
Pharmaceuticals 0.4
0.2
IT - Software 0 0
Real Estate
FMCG
Textile
Infrastructure
Power
Construction
Auto & Anciliary
Metal & Products
NBFC
Petrochemicals
Pharmaceuticals
Hotel & Resturants
Gems & Jewellers
Consumer Durable
Auto Ancillaries
Non Electrical Equip.
Electrical Equip
Construction
Steel
0 0.05 0.1 0.15 0.2 0.25 0.3 Rated Amount (RHS) Debt Equity Ratio
Source: SBI Research Source: SBI Research
Note: credit ratio=rating upgrade/rating downgrade
28COVID-19 recoveries steadily increasing but new cases and subsequent sporadic state
lockdowns pose risks to momentum of economic recovery
47. India reports the third highest number of active COVID cases after US and Brazil as
on date. Growth in active cases fell to 1.65 per cent as on 31st August as compared to 3.12
per cent as on 31st July with the recovery rate at 77 per cent as on 2nd September (Figure
57).
Figure 57: Coronavirus Cases in India
4000000 Lockdown 1.0 Lockdown 2.0Lockdown 3.0Lockdown 4.0 25
Unlock 1.0 Unlock 2.0 Unlock 3.0
3500000
20
3000000
Number of Cases
2500000 15
Percent
2000000
1500000 10
1000000
5
500000
0 0
09/Mar/20 09/Apr/20 09/May/20 09/Jun/20 09/Jul/20 09/Aug/20
Deaths Active Cases Recovered Cases Average Daily Growth Rate in Active Cases (Last 5 Days) -RHS
Source: India COVID-19 Tracker
Figure 58: COVID-19 spread widening across States after unlock
As on 30th June As on 31st July As on 31st August
Source: India COVID-19 Tracker (size of bubble=number of cases)
48. Recovery rates have improved across all top-20 states in terms of confirmed cases.
While Delhi and Tamil Nadu reported recovery rate of more than 85 per cent, Tamil Nadu,
Haryana, Gujarat, Rajasthan, Telangana, Madhya Pradesh and Uttar Pradesh reported
29recovery rates greater than 75 per cent. Case fatality rate (CFR) also continued to decline
with Maharashtra, Delhi, Gujarat and Punjab witnessing higher CFR than national average
(Figure 59).
Figure 59: Case fatality rates and Recovery Rates across States
As on 30th July As on 31st August
5% Recovery Rate (RHS) Fatility Rate 100% Recovery Rate (RHS) Fatility Rate
4% 100%
4% 80% 80%
3%
3% 60% 60%
2%
2% 40% 40%
1%
1% 20% 20%
0% 0% 0% 0%
CHHATTIS…
CHHATTIS…
MAHARAS…
WB
TN
KARNATAKA
HARYANA
TN
KARNATAKA
HARYANA
TELANGANA
TELANGANA
ASSAM
ASSAM
GUJARAT
DELHI
DELHI
BIHAR
PUNJAB
WB
BIHAR
PUNJAB
AP
UP
MP
AP
UP
MP
RAJASTHAN
ODISHA
KERALA
JK
JHARKHAND
ODISHA
RAJASTHAN
KERALA
JHARKHAND
J&K
GUJARAT
Source: India COVID-19 Tracker
Policy priorities as India unlocks
49. The world after COVID-19 will look significantly different with structural changes in
production, consumption and work patterns. As India emerges from this crisis, it will be
critical to re-orient the policy matrix towards a calibrated reconstruction of the economy
and to build resilience in an uncertain world.
Enhancing resilience of India’s agriculture, building efficient and sustainable agrarian
supply chains
50. Agriculture has emerged as a resilient silver lining in the current scenario. Policy
priority towards building efficient and sustainable agrarian supply chains for a persistent
increase in farmer incomes has got reinforced more than ever before. Such a dynamic shift
towards promoting deregulation and liberalization of the agricultural sector is already
underway with the Government announcing landmark reforms in this direction.
Deepening structural reforms in factor market and boosting infrastructure to reignite
manufacturing
51. The fundamental change in the world order also invokes realignment in the
conventional perceptions on efficiency versus resilience of the manufacturing sector.
Deep-seated and wide-ranging structural reforms in land, legal, labour and capital markets
to reverse the slowdown in manufacturing and to boost risk appetite are pertinent in this
regard. This warrants fast-tracking of the existing Government initiatives in the factor
30You can also read