A Zebrafish Model of Retinitis Pigmentosa Shows Continuous Degeneration and Regeneration of Rod Photoreceptors - MDPI
←
→
Page content transcription
If your browser does not render page correctly, please read the page content below
cells
Article
A Zebrafish Model of Retinitis Pigmentosa Shows
Continuous Degeneration and Regeneration of
Rod Photoreceptors
Abirami Santhanam 1, * , Eyad Shihabeddin 1,2 , Joshua A. Atkinson 1 , Duc Nguyen 1 ,
Ya-Ping Lin 1 and John O’Brien 1,2, *
 1    Ruiz Department of Ophthalmology & Visual Science, McGovern Medical School, The University of Texas
      Health Science Center at Houston, Houston, TX 77030, USA; Eyad.Shihabeddin.1@uth.tmc.edu (E.S.);
      josh.a.atkinson@gmail.com (J.A.A.); ducmnguyen9@gmail.com (D.N.); Ya-Ping.Lin@uth.tmc.edu (Y.-P.L.)
 2    The MD Anderson Cancer Center/UTHealth Graduate School of Biomedical Sciences,
      Houston, TX 77030, USA
 *    Correspondence: Abirami.Santhanam@uth.tmc.edu (A.S.); John.OBrien@uth.tmc.edu (J.O.);
      Tel.: +1-713-500-5995 (A.S.); +1-713-500-5983 (J.O.)

 Received: 1 July 2020; Accepted: 2 October 2020; Published: 6 October 2020

 Abstract: More than 1.5 million people suffer from Retinitis Pigmentosa, with many experiencing
 partial to complete vision loss. Regenerative therapies offer some hope, but their development is
 challenged by the limited regenerative capacity of mammalian model systems. As a step toward
 investigating regenerative therapies, we developed a zebrafish model of Retinitis Pigmentosa that
 displays ongoing regeneration. We used Tol2 transgenesis to express mouse rhodopsin carrying the
 P23H mutation and an epitope tag in zebrafish rod photoreceptors. Adult and juvenile fish were
 examined by immunofluorescence, TUNEL and BrdU incorporation assays. P23H transgenic fish
 expressed the transgene in rods from 3 days post fertilization onward. Rods expressing the mutant
 rhodopsin formed very small or no outer segments and the mutant protein was delocalized over
 the entire cell. Adult fish displayed thinning of the outer nuclear layer (ONL) and loss of rod outer
 segments, but retained a single, sparse row of rods. Adult fish displayed ongoing apoptotic cell death
 in the ONL and an abundance of proliferating cells, predominantly in the ONL. There was a modest
 remodeling of bipolar and Müller glial cells. This transgenic fish will provide a useful model system
 to study rod photoreceptor regeneration and integration.

 Keywords: retinal degeneration; retinal progenitor cell; transgenic; cone; bipolar cell; Müller cell;
 P23H rhodopsin

1. Introduction
      Retinitis Pigmentosa (RP), a genetically-based retinal degenerative disease, causes the death of rod
photoreceptors and progressive vision loss, leading to blindness in many patients [1,2]. RP affects about
1 in 4000 people worldwide and results in nearly a billion dollars of added healthcare costs annually to
patients in the US alone [3]. RP primarily leads to rod photoreceptor cell death associated with night
blindness and peripheral vision loss referred to as “tunnel vision,” followed by cone photoreceptor
deterioration and loss of central vision. RP is exceptionally heterogeneous at a genetic level, with more
than 66 genes that have been identified to cause RP; this heterogeneity makes RP poorly suitable for
gene-targeted therapies [4]. Different modes of inheritance have been reported, including autosomal
recessive (arRP), dominant (adRP), and X-linked (xRP) genetic traits [5–7]. Among these, rhodopsin
mutations account for 30% of adRP cases among Americans of European origin. The P23H (Proline to
Histidine) opsin mutation is the most common cause of adRP, accounting for ~10% of adRP cases in

Cells 2020, 9, 2242; doi:10.3390/cells9102242                                    www.mdpi.com/journal/cells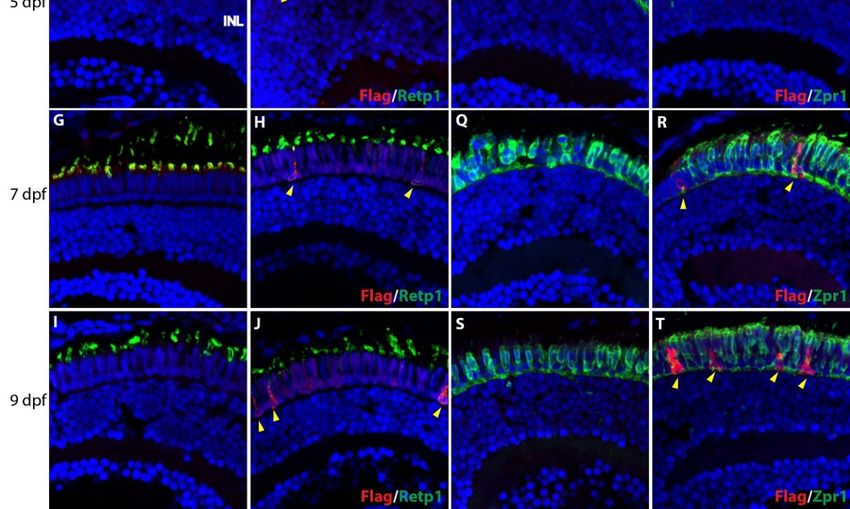
Cells 2020, 9, 2242                                                                                2 of 18

the USA [4,8,9]. The P23H mutation leads to accumulation of misfolded rhodopsin in the endoplasmic
reticulum, activating the unfolded protein response and leading to its proteasomal and lysosomal
degradation [10,11]. This leads to the loss of photoreceptors and eventually results in blindness.
      Several transgenic rodent models of RP have been established to study the molecular mechanisms
involved in the disease progression that leads to the death of photoreceptors [12–17]. With some
variations between models, these animals share common features of progressive rod photoreceptor
degeneration and visual deficits, most with eventual loss of cones as well. A P23H rhodopsin knock-in
mouse model more closely mimicked the human retinopathy, with relatively slow degeneration and
relative sparing of cone function at early ages [18], providing an excellent model system to study the
mechanisms of degeneration.
      A common feature of mammalian model systems is their failure to produce an effective regenerative
response to the presence of disease or injury [19,20]. In these models, at the detection of insult
to retinal neurons, Müller glial cells (MGCs) exhibit signs of reactive gliosis. While this has an
important neuroprotective function in the retina, reactive gliosis inhibits retinal regeneration [21,22].
Unlike mammals, teleost fish have a remarkable capacity to regenerate damaged retina following a
variety of insults that destroy neurons. In the teleost retina, MGCs will detect insults to neurons and
divide asymmetrically to produce multipotent progenitor cells, which then migrate and differentiate to
replace the lost neurons [20,22,23].
      Zebrafish is a very well-established vertebrate model system with several advantages including
rapid development, easy gene manipulation, and high fecundity [24]. Human retinas contain more
rods than cones (∼95% rods and ∼5% cones), which is similar to mice; however, the fovea, the central
area of the retina responsible for visual acuity, is primarily populated by cones [25]. Zebrafish have
a cone-dominated retina (∼65% rods and ∼35% cones) [26], similar to the central human retina.
Furthermore, zebrafish retina displays regional cellular and molecular specializations of cones that
are similar to those of primate fovea [27]. Therefore, the zebrafish retina provides a useful model
system to investigate the molecular mechanisms involved in the development and regeneration of
the central retina, which is most relevant for human vision. Zebrafish retinal degenerative models
provide research studies with opportunities not only to characterize the disease but also to identify
mechanisms of photoreceptor regeneration.
      In the current study we have generated and characterized a P23H rhodopsin transgenic zebrafish
line that recapitulates the clinical model of P23H adRP. The transgenic fish show the expression of
mutant rhodopsin from 3 days post-fertilization through the adult stages of development, providing a
model of chronic rod degeneration similar to RP. We show that rod photoreceptors are continuously
being degenerated and regenerated. There are also some qualitative changes in the cone photoreceptors.
Overall, the current model provides a unique tool to understand the molecular cues driving the
regeneration of photoreceptors in a chronic condition like RP.

2. Materials and Methods

2.1. Animal Husbandry
     Rearing, breeding, and staging of zebrafish (Danio rerio) were performed according to standard
methods [28]. Wild type AB zebrafish were purchased from the Zebrafish International Resource Center
(ZIRC; Eugene, OR, USA), raised, bred, and maintained on a 14 h light/10 h dark cycle. Randomly
selected adult and juvenile fish of both sexes were used for experiments. All procedures employing
animals have been reviewed and approved by the Institutional Animal Care and Use Committee at
the University of Texas Health Science Center at Houston under protocols HSC-AWC-15-0057 and
HSC-AWC-18-0047. Transgenic animals developed in this study are available from the investigators.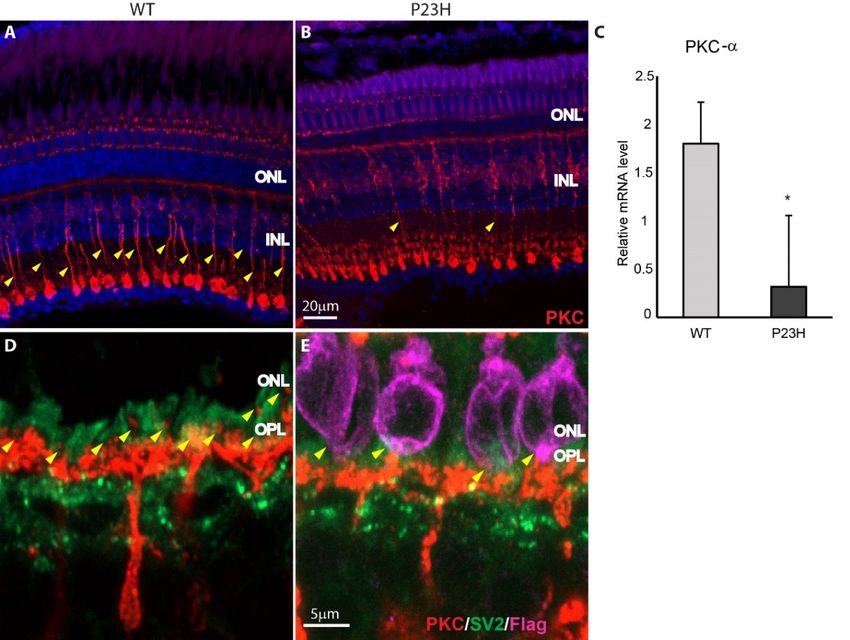
Cells 2020, 9, 2242 3 of 18
Cells 2020, 9, x FOR PEER REVIEW 3 of 19
2.2.
2.2. Transgene Construction and
Transgene Construction and Development
Development of
of Transgenic
Transgenic Fish
Fish
A myc-DDK-tagged mouse
A myc-DDK-tagged mouse Rhodopsin
Rhodopsin cDNA cDNA clone
clone inin pCMV6
pCMV6 vector
vector was
was purchased
purchased from
from
OriGene
OriGene (Rockville, MD, USA). The P23H mutation was inserted in this clone using aa QuickChange
(Rockville, MD, USA). The P23H mutation was inserted in this clone using QuickChange
site-directed mutagenesiskit kit
site-directed mutagenesis (Agilent,
(Agilent, La CA,
La Jolla, Jolla,
USA) CA,andUSA)
primers and primers MsOpsP23H
MsOpsP23H F—TGGTGCGGA F—
TGGTGCGGAGCCACTTCGAGCAGCC and
GCCACTTCGAGCAGCC and MsOpsP23H R—GGCTGCTCGAAGTGGCTCCGCACCA according to MsOpsP23H R—
GGCTGCTCGAAGTGGCTCCGCACCA
the manufacturer’s protocol. The Tol2 transgene according
plasmidto pT2AL200R150G
the manufacturer’s protocol.
[29] and The Tol2
Tol2 transposase
transgene plasmid pT2AL200R150G [29] and Tol2 transposase cDNA plasmid
cDNA plasmid pCS-TP [30] were generously provided by Dr. Koichi Kawakami (National Institute pCS-TP [30] were
of
generously provided by Dr. Koichi Kawakami (National Institute of Genetics,
Genetics, Mishima, Japan). A 1.8 kb Zebrafish rhodopsin promoter clone was generously providedMishima, Japan). A 1.8
by
kb
Dr.Zebrafish
Xinping C. rhodopsin promoterofclone
Zhao (University Texaswas generously
Health Science provided
Center at by Dr. Xinping
Houston). C. Zhao (University
The Zebrafish rhodopsin
of Texas Health Science Center at Houston). The Zebrafish rhodopsin
promoter was amplified with primers JOB316—TCACTTGGGCCCGGCTCGAGCATGTCAGAAGC promoter was amplified with
primers JOB316—TCACTTGGGCCCGGCTCGAGCATGTCAGAAGC
and JOB317—CTCAGGATCGGTCGACCTGCAGGGCGCTCAGCCCCTTCTGC using Phusion and JOB317—
CTCAGGATCGGTCGACCTGCAGGGCGCTCAGCCCCTTCTGC
DNA polymerase (New England Biolabs, Natick, MA, USA) using
andPhusion
clonedDNA into polymerase
XhoI and
(New England Biolabs, Natick, MA, USA) and cloned into XhoI and
PstI sites of pT2AL200R150G using Cold Fusion cloning (System Biosciences, Palo Alto,PstI sites of pT2AL200R150G
using Cold Fusion
CA, USA). Clonescloning
were(System Biosciences,
sequenced on both Palostrands
Alto, CA, to USA).
confirmClones
thewere sequenced
insert. The on both
mouse
strands to confirm the insert. The mouse Rhodopsin cDNA
Rhodopsin cDNA harboring the P23H mutation was amplified by PCR with primers harboring the P23H mutation was
amplified by PCR with
JOB318—CA AAGAATTCCTCGACGGATCCGGTACCGAGGAGATCTG and JOB319—CATGTC primers JOB318—
CAAAGAATTCCTCGACGGATCCGGTACCGAGGAGATCTG
TGGATCATCATCGATCCCGGGATCTGTTCAGGAAACAG using Phusion and
DNA polymerase JOB319—
and
CATGTCTGGATCATCATCGATCCCGGGATCTGTTCAGGAAACAG using
cloned into the Tol2 zebrafish rhodopsin promoter construct at BamHI and ClaI restriction sites using Phusion DNA
polymerase and cloned
Cold Fusion cloning. Theinto
finalthe Tol2 zebrafish
constructs rhodopsin promoter construct
(pT2-Dre-rho:Mmu-Rho(P23H)Flag) wereatsequenced
BamHI and ClaI
on both
restriction
strands. The sites using Cold
transgene Fusioniscloning.
construct Thediagrammatically
illustrated final constructs (pT2-Dre-rho:Mmu-Rho(P23H)Flag)
in Figure 1.
were sequenced on both strands. The transgene construct is illustrated diagrammatically in Figure 1.
Figure
Figure 1.
1. P23H
P23H mutant
mutant rhodopsin
rhodopsin transgene
transgene construct.
construct. Mouse
Mouse rhodopsin
rhodopsin carrying
carrying the
the P23H
P23H mutation
mutation
and a C-terminal Flag tag is driven by a 1.8 kb Zebrafish rhodopsin promoter.
and a C-terminal Flag tag is driven by a 1.8 kb Zebrafish rhodopsin promoter.
To generate transgenic
To generate transgenicfish,
fish,Tol2
Tol2transposase
transposasemRNAmRNAmade made bybyinin vitro
vitro transcription
transcription of of
thethe pCS-
pCS-TP
TP plasmid using the mMessage mMachine kit (Life Technologies, Austin,
plasmid using the mMessage mMachine kit (Life Technologies, Austin, TX, USA) and the finishedTX, USA) and the finished
transgene
transgene DNADNAwere wereco-injected
co-injected into 1 cell
into 1 stage AB strain
cell stage zebrafish
AB strain embryos.
zebrafish The resulting
embryos. The fish were
resulting
grown
fish wereto adulthood, outcrossed to
grown to adulthood, wild-typetoAB
outcrossed zebrafishAB
wild-type and pools ofand
zebrafish embryos
pools screened
of embryos for
transgene transmission by PCR using primers JA1—GCAGCTGGTCTTCACAGTCAAG
screened for transgene transmission by PCR using primers JA1—GCAGCTGGTCTTCACAGTCAAG and JA2—
TTGTAATCCAGGATATCATTTGCTG
and JA2—TTGTAATCCAGGATATCATTTGCTG or JA3—CACTCAAGCCTGAGGTCAACAAC
or JA3—CACTCAAGCCTGAGGTCAACAAC and JA4— and
GAGTTTCTGCTCGAGCGGC.
JA4—GAGTTTCTGCTCGAGCGGC. Both setsBothof sets
primers span the
of primers region
span from mouse
the region rhodopsin
from mouse to the tag
rhodopsin to
sequences and are specific for the transgene. Fish that transmitted the transgene
the tag sequences and are specific for the transgene. Fish that transmitted the transgene to offspring to offspring were
bred further
were to establish
bred further stablestable
to establish transgenic lines.lines.
transgenic
One
One line that displays good transgene expression
line that displays good transgene expression hashas been
been propagated
propagated by incrossing and
by incrossing used
and used
for the studies reported here. Transgenic fish were genotyped by PCR of tail
for the studies reported here. Transgenic fish were genotyped by PCR of tail cut DNA as described cut DNA as described
by
by Meeker
Meeker et et al.
al.[31].
[31].The
Theclipped
clippedtailtailpiece
piecewas
wasdigested
digestedinin
100
100µLµLof of
5050
mM mM Sodium
Sodium hydroxide
hydroxide at 95
at
°C ◦for twenty minutes and neutralized by addition of 10 µL of 1 M Tris-Cl, pH
95 C for twenty minutes and neutralized by addition of 10 µL of 1 M Tris-Cl, pH 8.0. Aliquots of this8.0. Aliquots of this
genomic
genomic DNADNA werewere amplified
amplified byby PCR
PCR with
with primers
primers JA1JA1 and
and JA2
JA2 (Figure
(Figure S1).
S1).
2.3. BrdU
BrdU Labeling
Labeling
Adult Zebrafish of 4–6 months age were anesthetized in 0.02% 3-aminobenzoic acid ethyl ester
(Tricaine/MS222; Millipore-Sigma, St. Louis, MO, USA) until unresponsive
unresponsive to to touch.
touch. Anesthetized
fish were injected intraperitoneally with 5-bromo-2-deoxyuridine (BrdU) 5 µL/0.1 g body weight at a
concentration
concentration of of 55 mg/mL
mg/mLBrdU BrdU(Sigma
(SigmaB-9285)
B-9285)freshly
freshlyprepared
preparedinin sterile
sterile PBS.
PBS. Animals
Animals were
were housed
housed in
in static
static smallsmall
tankstanks
(1.5-L(1.5-L breeding
breeding tanks)tanks)
duringduring treatment
treatment and euthanized
and euthanized after 5 orafter 5 or
24 h by 24 h by
immersion
immersion in 0.15% Tricaine/MS222
in 0.15% Tricaine/MS222 followed byfollowed by decapitation.
decapitation. A sample A sample
size size of 3was
of 3 animals animals
usedwas
for used
each
for
timeeach time point.
point.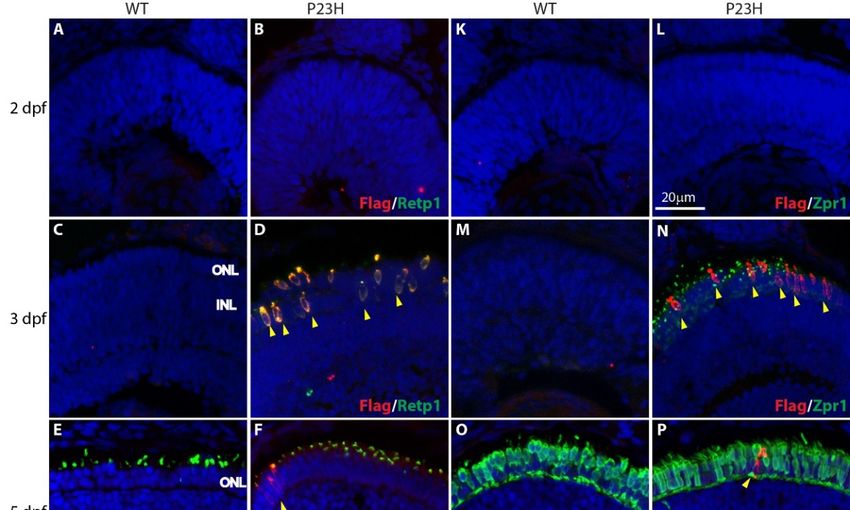
Cells 2020, 9, 2242                                                                                              4 of 18

2.4. Tissue Preparation, Histology, Immunocytochemistry (ICCH) and Imaging
      All fish for tissue analysis were collected during the morning, between nine and eleven a.m.
Two to nine days post-fertilization (dpf) larvae were anesthetized in 0.15% Tricaine/MS222 and fixed in
4% paraformaldehyde (PFA; Electron Microscopy Sciences, Hatfield, PA, USA) in 0.1 M phosphate
buffer, pH 7.4 (PB) for 1 h at room temperature (RT). Afterward, specimens were washed three times at
15 min intervals in PB and infiltrated in 30% sucrose in PB overnight at 4 ◦ C. Larvae were then frozen
in Tissue-Tek O.C.T. compound (4583, Sakura Olympus, Italy) using dry ice and stored at −80 ◦ C.
Adult zebrafish of age 4–6 months were sacrificed by immersion in 0.15% Tricaine/MS222 followed by
decapitation, and their eyes enucleated. Eyes were fixed in either 4% PFA in 0.1 M PB, or ethanolic PFA
at a ratio of 9:1 (9 parts 95% ethanol to 1 part 4% PFA) for 1 h at RT. Afterward, specimens were washed
four times (15 min intervals) in PB and infiltrated in 30% sucrose in PB overnight at 4 ◦ C. Eyes were then
frozen in Tissue-Tek O.C.T. compound using dry ice and stored at −80 ◦ C. Cryostat sections (12 µm thick)
were collected on SuperFrost Plus slides (1255015, Fisher Scientific, Waltham, MA, USA) and used for
immunocytochemistry (ICCH). ICCH on retinal sections was performed by incubation in (i) blocking
solution with 0.3% Triton-X100, 5% of the serum of the species in which the secondary antibody was
generated (Donkey Serum or Goat Serum; Jackson ImmunoResearch, West Grove, PA, USA) and
0.01 M Phosphate Buffered Saline (PBS)(P3813, Millipore-Sigma) for 1 h at RT; (ii) primary antibody
(Ab) diluted in PBS, 0.1% Triton-X100 and 5% serum overnight at RT; (iii) fluorescent secondary Ab,
diluted as the primary Ab, for 1 h at RT. For nuclear counterstaining, retinal sections were mounted
in Vectashield with DAPI (H-1000; Vector Laboratories, Burlingame, CA, USA) and coverslipped.
The primary and secondary antibodies used in this study are listed in Table 1. Images were taken using
a Zeiss LSM 780 laser scanning confocal microscope (Thornwood, NY, USA).

                                     Table 1. List of antibodies used in this study.

                                                                                         Catalog
       Antibody       Host               Antigen                      Source                          Dilution
                                                                                         Number
                                                                 Novus Biologicals
         Retp1        Ms             Rat Rhodopsin                                     NB120-3267-0    1:200
                                                                Centennial, CO, USA
                                                                     Origene
       Flag-DDK       Ms              DYKDDDDK                                           TA50011       1:250
                                                                Rockville, MD, USA
                                                                      ZIRC
      Zpr1/Fret43     Ms       Fixed Zebrafish retinal cells                           AB_10013803      1:10
                                                                 Eugene, OR, USA
                              Protein A-Proliferating Cell           Abcam
         PCNA         Ms                                                                  ab29         1:100
                             Nuclear Antigen fusion protein    Cambridge, MA, USA
                             Synthetic peptide corresponding
         PCNA         Rb      to Human PCNA aa 200 to the             Abcam              Ab18197       1:100
                                        C-terminus
                                                               Developmental Studies
          SV2         Ms       Synaptic Vesicle Protein 2a       Hybridoma Bank            SV2         1:100
                                                                Iowa City, IA, USA
                                                                 Millipore-Sigma
          GS-6        Ms          Glutamine Synthetase                                   MAB302        1:1000
                                                               Burlington, MA, USA
                                                                     Invitrogen
          BU-1        Ms     5-bromo-2-deoxyuridine (BrdU)                               MA3-071       1:100
                                                                 Carlsbad, CA, USA
        PKC-α         Rb           Protein Kinase Cα              Millipore, Sigma        P4334        1:400
                                                                      Jackson
                                Goat Anti-Mouse IgG Fcγ
          Cy3         Gt                                         ImmunoResearch        115-165-206     1:500
                                  subclass 2a specific
                                                                West Grove, PA, USA
      Alexa Flour                                                   Jackson
                      Dk     Donkey Anti-Mouse IgG (H+L)                               715-545-150     1:500
          488                                                    ImmunoResearch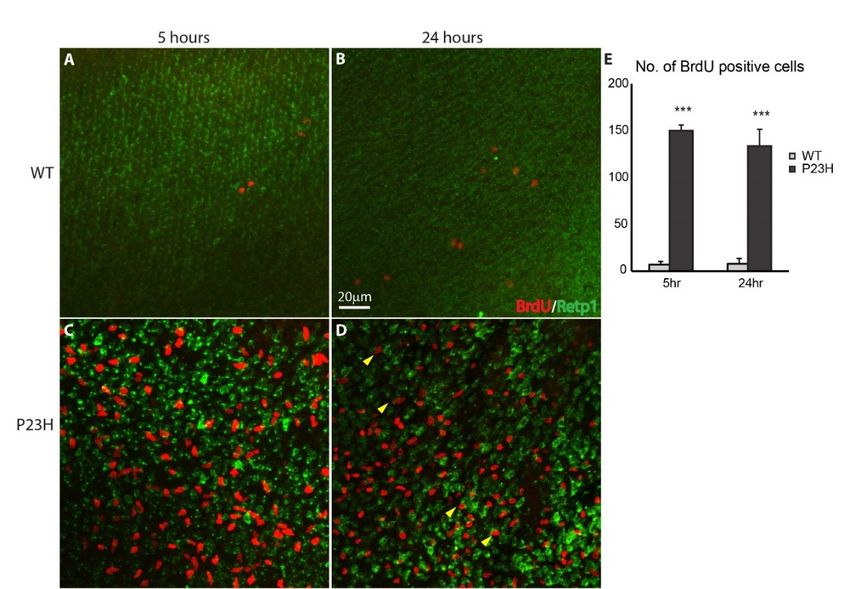
Cells 2020, 9, 2242                                                                                       5 of 18

                                                Table 1. Cont.

                                                                                  Catalog
       Antibody       Host          Antigen                      Source                        Dilution
                                                                                  Number
      Alexa Fluor                                              Jackson
                      Dk     Donkey Anti-Rabbit IgG                              711-545-152    1:500
          488                                               ImmunoResearch
      Alexa Fluor            Goat Anti Mouse IgG Fcγ           Jackson
                      Gt                                                         115-545-205    1:500
          488                   subclass 1 specific         ImmunoResearch
                                                           Vector Laboratories
          DAPI               Nuclear Counterstaining                               H-1000
                                                          Burlingame, CA, USA

     For wholemount immunostaining experiments with BrdU labeling, the eyes were fixed as described
above and an eyecup preparation made as follows. After fixation, a cut was made on the cornea
with micro scissors and the cornea and lens removed, leaving an intact retina accessible for antibody
penetration. The eyecups were treated in 2N HCl for 30 min at RT before incubation with the primary
antibody. The eyecups were incubated with primary antibody for five days at 4 ◦ C in a shaker, followed
by four washes with PBS at 15 min intervals. Afterward, the tissue was incubated with a secondary
antibody overnight at 4 ◦ C, followed by four washes with PBS at 15 min intervals. The eyecups were
transferred to a Petri dish containing 0.5× PBS and processed under a microscope. The retinas were
removed and four cuts were made with micro scissors to flatten the retina. The retinas were mounted
in Vectashield with DAPI. Images were taken using a Zeiss LSM 780 confocal microscope.

2.5. TUNEL Staining
     4% PFA-fixed retinal cryosections of 10–12 µm thickness were washed in PBS for 15 min at RT.
Tissues were permeabilized in 100 mM sodium citrate dissolved in PBTx (PBS plus 0.1% Triton X-100)
at RT for 2 min, followed by the addition of terminal deoxynucleotidyl transferase-mediated
fluorescein-dUTP nick end labeling (TUNEL) mix (in situ cell death detection kit; Roche, Mannheim,
Germany) according to the manufacturer’s instructions. After incubation at 37 ◦ C for 1 h inside
a humidified chamber, retinal sections were mounted in Vectashield with DAPI and coverslipped.
TUNEL-positive cells were visualized by confocal fluorescence microscopy (Zeiss 780).

2.6. Quantitative Real-Time PCR
      RNA was isolated from eyecup tissue using Aurum total RNA mini kit (BioRad, Hercules, CA,
USA), and the total RNA was extracted according to the manufacturer’s instructions. The cDNA for
each retina was synthesized from 75 ng total RNA with the Thermoscript RT–PCR System (BioRad)
using oligo (dT) primers according to the manufacturer’s instructions.
      Primers were designed using Primer3 combined with BLAST from NCBI (Bethesda, MD, USA)
and primers (Table 2) were synthesized by Integrated DNA Technologies (Coralville, IO, USA).
The quantitative measurement of PKC-α (prkca) and Glul-a (glula) mRNA levels from retina tissue was
performed with real-time PCR using a BioRad CFX maestro thermal cycler with the SYBR Green PCR
Master Mix (BioRad) in a one-step reaction according to the manufacturer’s instructions. The relative
mRNA levels where calculated using the reference housekeeping gene GAPDH expression level.
The thermal cycle was programmed for 30 s at 98 ◦ C for initial denaturation, followed by 35 cycles of
10 s at 98 ◦ C for denaturation, 10 s at 59 ◦ C for annealing, 10 s at 72 ◦ C for extension, and 1 min at
72 ◦ C for the final extension. The melting curves and gel electrophoresis of the end products were
obtained to confirm the specificities of the PCR reactions. The relative quantification of target genes
was determined using the ∆∆Ct quantitative RT–PCR method [32]. The primers used are listed in
Table 2.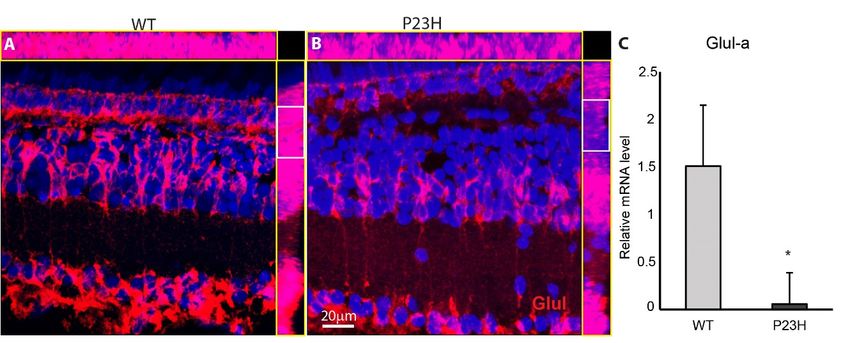
Cells 2020, 9, 2242                                                                                    6 of 18

                                  Table 2. Primers used for real-time PCR.

                  Gene         Primer Sequence (50 -30 )        Size (bp)     GenBank Accession
                prkca-FP     TCCCCAGTATGTGGCTGGTA                  119          NM_001256241.1
                prkca-RP    TTGGCTATCTCAAATTTCTGTCG
                glula-FP    CGCATTACAGAGCCTGCCTA                   212            NM_181559.2
                glula-RP    ATTCCAGTTGCCTGGGATCG
              GAPDH-FP       ATGACCCCTCCAGCATGA                    134            NM_213094.2
              GAPDH-RP       GGCGGTGTAGGCATGAAC

2.7. Statistical Analysis
      A sample size of six animals was used for nuclei count and outer segment length calculation.
An average of measurements from three sections per retina represented one fish. A sample size of three
animals per time point was used for counts of proliferating cells labeled with BrdU. A sample size of
three animals was used for PKC-α and Glul-a relative mRNA level analysis by quantitative RT-PCR.
All samples were prepared in duplicates and the average was used for quantification. All data are
represented as the mean ± SD; statistical significance was determined using a two-tailed Student t-test
from three or more samples. Statistical significance is reported as asterisks in graphs (∗∗∗ for p < 0.001,
∗∗ for p < 0.01, ∗ for p < 0.05).

3. Results

3.1. Mutant Rhodopsin is Expressed in the Rod Photoreceptors
      We developed a Tol2 transgene construct in which a Flag-tagged mouse rhodopsin carrying the P23H
mutation is driven by the zebrafish rhodopsin promoter (see Methods and Figure 1). We established stable
transgenic lines and have propagated an efficiently-expressing line by incrossing. Immunofluorescence
analysis of stable transgenic larvae revealed expression of the P23H mutant rhodopsin, as detected with
antibodies against the Flag tag, from the early stages of development (Figure 2). At 2 dpf (Figure 2A,B,K,L)
we did not detect expression of rod or cone markers in either wild type (WT) or P23H transgenic zebrafish.
At 3 dpf the P23H transgenic fish showed expression of the Flag-labeled mutant rhodopsin, co-labeled with
the Retp1 anti-rhodopsin antibody in numerous cells spread throughout the outer nuclear layer (ONL) of
the central retina (Figure 2D). These cells did not co-label with the Zpr1 antibody that binds to double cone
photoreceptors [33], which instead labeled numerous small structures reminiscent of nascent cone outer
segments throughout the central retina (Figure 2N). In contrast, the WT fish at 3 dpf did not show expression
of either rod (Retp1) or cone (Zpr1) markers. At 5 dpf (Figure 2F,P), only a few cells expressing the P23H
rhodopsin were detected in the ONL near the retinal margin, suggesting that P23H rhodopsin-expressing
cells from the initial wave at 3 dpf had been lost. At this age, the cone antigen labeled by the Zpr1 antibody
was expressed strongly throughout the ONL, and did not co-localize with the Flag-labeled mutant rhodopsin
(Figure 2O,P). At 7 and 9 dpf (Figure 2G–J,Q–T), an increasing number of Flag-labeled cells in the ONL and
expanded distribution toward the central retina was evident. Labeling with the Zpr1 antibody showed that
the Flag-tagged mutant rhodopsin was not expressed in the double cones at any age (Figure 2M–T).
      In 3–9 dpf larvae, the mutant rhodopsin was distributed throughout the labeled cells (Figure 2,
yellow arrowheads), revealing a photoreceptor-like morphology including a soma, synaptic terminal
and sometimes a very small outer segment. This morphology changed from compact and oval with
a centrally-placed nucleus at 3–5 dpf to elongate, with a nucleus placed basally at the border of the
outer plexiform layer (OPL) from 7–9 dpf. Double labeling with the Retp1 monoclonal antibody
against rhodopsin revealed that the stunted outer segments contained additional rhodopsin (see the
yellower color of outer segments, e.g., in Figure 2D,F,H), likely representing the endogenous rhodopsin
in the rod outer segments, although the normal elongate outer segment structure did not develop.
The delocalized distribution of P23H rhodopsin and stunted outer segments is comparable to that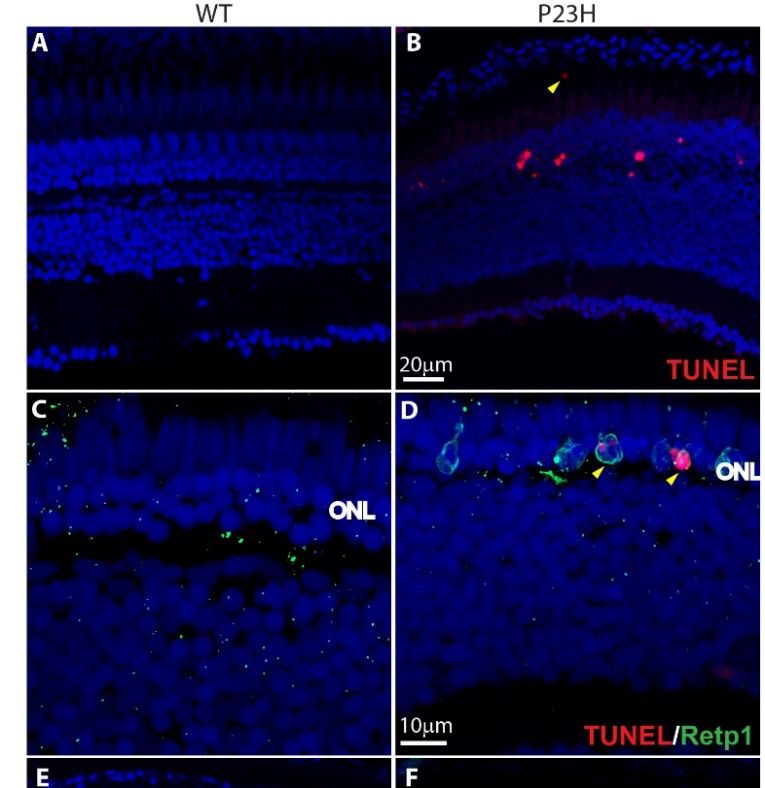
Cells 2020, 9, x FOR PEER REVIEW                                                                             7 of 19
Cells 2020, 9, 2242                                                                                                         7 of 18

     yellower color of outer segments, e.g., in Figure 2D,F,H), likely representing the endogenous
     rhodopsin in the rod outer segments, although the normal elongate outer segment structure did not
observed in other models of RP [14–16,34]. Note that we observed the Retp1 antibody to label outer
     develop. The delocalized distribution of P23H rhodopsin and stunted outer segments is comparable
segments
     to that of one ofinthe
             observed          elements
                            other models of    the[14–16,34].
                                            of RP   double cones,     likely
                                                               Note that  we representing     a cross-reaction
                                                                              observed the Retp1                  with one
                                                                                                    antibody to label
coneouter
      opsin.    This accounts
            segments    of one offor
                                   the the   majority
                                        elements        ofdouble
                                                   of the outer segment      labeling
                                                                  cones, likely        in the a5–9
                                                                                representing         dpf larvaewith
                                                                                                 cross-reaction   shown in
Figure
     one2E–J.
          cone No   rods
                opsin.     were
                        This      detected
                              accounts        that
                                         for the   displayed
                                                 majority       normal
                                                           of outer      outerlabeling
                                                                     segment    segments.
                                                                                       in theAn5–9expanded
                                                                                                   dpf larvae examination
                                                                                                              shown
of the
     inassociation
         Figure 2E–J.of Retp1
                          No rodslabeling
                                     were with    conethat
                                             detected    outer segmentsnormal
                                                             displayed     is shown   in Figure
                                                                                   outer          S2. The
                                                                                          segments.    An Retp1
                                                                                                           expandedantibody
usedexamination
       in this studyof the  association
                        recognizes        of Retp1 labeling
                                       a sequence    in the with
                                                             amino cone outer segments
                                                                      terminal  10 amino is shown   in Figure
                                                                                             acids of         S2. The [35].
                                                                                                       rat rhodopsin
     Retp1 alignment
Sequence    antibody used     in this that
                           showed      study  recognizes
                                            rat rhodopsin a sequence
                                                             shared 9inofthe
                                                                           10amino
                                                                               aminoterminal    10 amino
                                                                                       acids with         acids of
                                                                                                     zebrafish     rat
                                                                                                                rhodopsin
     rhodopsin    [35].  Sequence   alignment    showed    that  rat rhodopsin   shared  9  of 10
and 9 of 10 amino acids with zebrafish green cone opsins (opn1mw1–4), which are localized to doubleamino  acids  with
     zebrafish rhodopsin and 9 of 10 amino acids with zebrafish green cone opsins (opn1mw1–4), which
cone outer segments and could lead to cross-reaction.
     are localized to double cone outer segments and could lead to cross-reaction.

           Figure 2. Expression of P23H Flag-tagged rhodopsin at early stages of photoreceptor development in
      Figure 2. Expression of P23H Flag-tagged rhodopsin at early stages of photoreceptor development
            wild type (WT) and P23H transgenic (P23H) zebrafish. Expression of P23H mutant rhodopsin (Flag;
      in wild type (WT) and P23H transgenic (P23H) zebrafish. Expression of P23H mutant rhodopsin
            red) and rhodopsin (Retp1; green) at 2 dpf (A,B), 3 dpf (C,D), 5 dpf (E,F), 7 dpf (G,H), and 9 dpf (I,J).
      (Flag;  red) and of
            Expression  rhodopsin  (Retp1;
                          Flag-tagged P23Hgreen)
                                            mutantatrhodopsin
                                                       2 dpf (A,B),
                                                                 (red)3 compared
                                                                        dpf (C,D),to5double
                                                                                      dpf (E,F), 7 dpf
                                                                                             cones     (G,H),
                                                                                                   (Zpr1, green)and
                                                                                                                  at 9 dpf
      (I,J). Expression of Flag-tagged P23H mutant rhodopsin (red) compared to double cones (Zpr1, green)
      at 2 dpf (K,L), 3 dpf (M,N), 5 dpf (O,P), 7 dpf (Q,R), and 9 dpf (S,T). Yellow arrowheads denote cells
      expressing P23H mutant rhodopsin. Nuclei labeled with DAPI are blue. ONL: outer nuclear layer;
      INL: inner nuclear layer. Scale bar in L applies to all panels.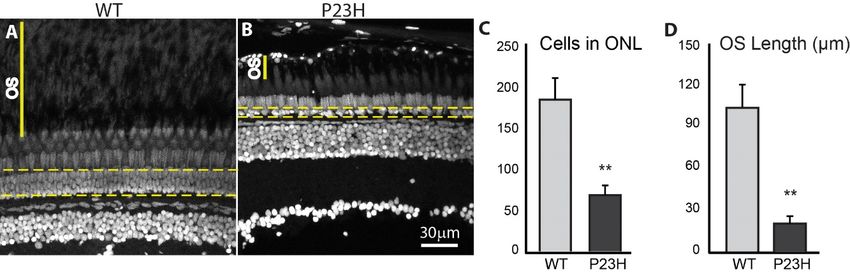
Cells 2020, 9, x FOR PEER REVIEW                                                                         8 of 19

             2 dpf (K,L), 3 dpf (M,N), 5 dpf (O,P), 7 dpf (Q,R), and 9 dpf (S,T). Yellow arrowheads denote cells
Cells 2020, 9, 2242                                                                                                  8 of 18
             expressing P23H mutant rhodopsin. Nuclei labeled with DAPI are blue. ONL: outer nuclear layer;
             INL: inner nuclear layer. Scale bar in L applies to all panels.

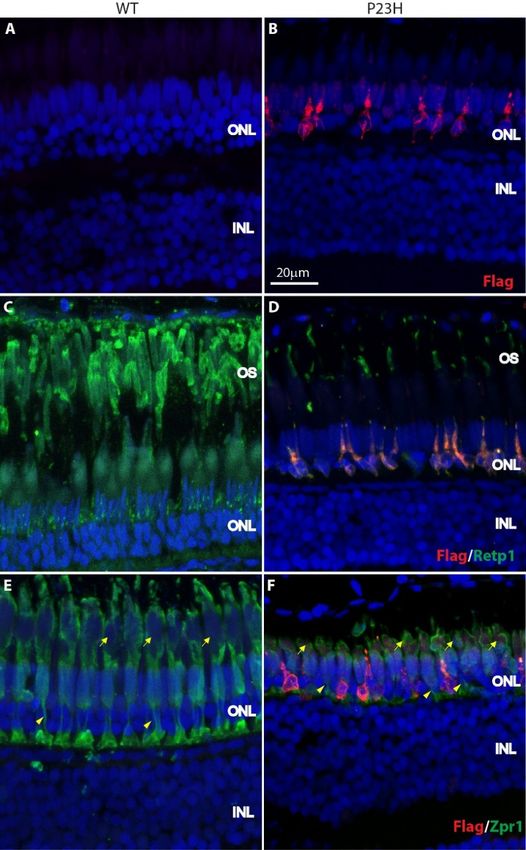
      In adult P23H zebrafish from 4–8 months, expression of mutant rhodopsin was evident in rod-like
           In adult P23H zebrafish from 4–8 months, expression of mutant rhodopsin was evident in rod-
cells throughout    the ONL (Figure 3A,B). Note that the number of cells expressing mutant rhodopsin has
      like cells throughout the ONL (Figure 3A,B). Note that the number of cells expressing mutant
increased   relative
      rhodopsin   hasto the fewrelative
                      increased   cells into
                                           the
                                             theearly  development.
                                                  few cells in the earlyLabeling     with Labeling
                                                                          development.     the Retp1   antibody
                                                                                                      with         to label
                                                                                                           the Retp1
total rhodopsin    showed   that the  number    and  length   of outer  segments    labeled  for rhodopsin
      antibody to label total rhodopsin showed that the number and length of outer segments labeled for       was   greatly
reduced
      rhodopsin was greatly reduced in the P23H transgenic fish compared to the wild type fish (FigureRetp1
          in the P23H   transgenic   fish compared     to the  wild  type  fish (Figure  3C,D).   Once   again, the
      3C,D).toOnce
antibody            again, the
               rhodopsin       Retp1one
                            labeled    antibody
                                           of thetodouble
                                                    rhodopsinconelabeled
                                                                   outerone    of the double
                                                                           segments           cone
                                                                                        (Figure      outer
                                                                                                  S2),     segments the
                                                                                                       confounding
      (Figure of
assessment     S2), confounding
                 whether          the in
                           any rods    assessment
                                          the P23Hoftransgenic
                                                        whether any    rodsform
                                                                    retina    in the  P23H outer
                                                                                   normal   transgenic   retina form
                                                                                                    segments.   However,
      normal   outer segments.  However,    all rods  that expressed   the  mutant   rhodopsin
all rods that expressed the mutant rhodopsin (labeled with anti-Flag antibody) displayed only    (labeled  with anti-small,
      Flag antibody) displayed only small, deformed outer segments (Figure 3B,D,F). These were relatively
deformed outer segments (Figure 3B,D,F). These were relatively enriched for labeling with Retp1,
      enriched for labeling with Retp1, suggesting that the endogenous wild-type rhodopsin traffics
suggesting that the endogenous wild-type rhodopsin traffics properly to the outer segments.
      properly to the outer segments.

           Figure 3. Expression of P23H Flag-tagged rhodopsin in adult zebrafish retina. (A,B) The Flag-tagged
     Figure 3. Expression of P23H Flag-tagged rhodopsin in adult zebrafish retina. (A,B) The Flag-tagged
          P23H mutant rhodopsin (red) is expressed by sparsely-distributed photoreceptors in the adult fish
     P23H mutant rhodopsin (red) is expressed by sparsely-distributed photoreceptors in the adult fish (B);
          (B); there is no labeling in wild type fish (A). (C,D) Mutant rhodopsin (red) colocalizes with rhodopsin
     there is no labeling in wild type fish (A). (C,D) Mutant rhodopsin (red) colocalizes with rhodopsin
     (Retp1, green) in the rods. (E,F) Mutant rhodopsin (red) is expressed only by the rods and not the
     cones, as seen with the cone marker Zpr1 (green). Yellow arrowheads represent the cone axons and
     yellow arrows represent the cone myoids. ONL: outer nuclear layer; INL: inner nuclear layer; OS: outer
     segments. Scale bar in B applies to all panels.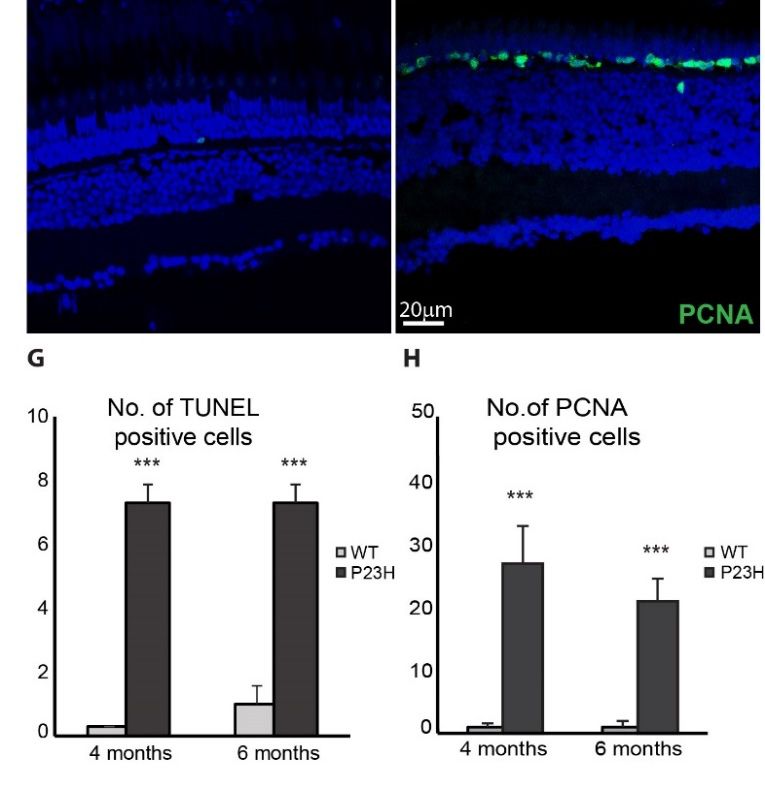
(Retp1, green) in the rods. (E,F) Mutant rhodopsin (red) is expressed only by the rods and not the
cones, as seen with the cone marker Zpr1 (green). Yellow arrowheads represent the cone axons and
yellow arrows represent the cone myoids. ONL: outer nuclear layer; INL: inner nuclear layer; OS:
outer segments. Scale bar in B applies to all panels.
Cells 2020, 9, 2242 9 of 18
In order to see whether there was any change in the cone morphology, we labeled with the Zpr1
antibody. The Zpr1 staining revealed that the length of cone axons was shorter in the P23H transgenic
In order
animals to see whether
compared to the WT there was 3E,F,
(Figure any change in the cone
arrowheads). The morphology,
cone myoids we andlabeled with the Zpr1
outer segments were
antibody. The Zpr1 staining revealed that the length of cone axons was shorter
also shorter in the P23H compared to the WT (Figure 3E,F, arrows). There was no significant change in the P23H transgenic
animals compared
in the number of to the WT
double (Figure
cones 3E,F,with
labeled arrowheads).
Zpr1 in the TheP23H
cone myoids
transgenic andfish
outer segments
with a meanwere also±
of 34.2
shorter
5.6 in the WT vs. 32.4 ± 4.8 in the P23H per ~210 µm image field in the retinal section (p = 0.7; nthe
in the P23H compared to the WT (Figure 3E,F, arrows). There was no significant change in =3
number double cones labeled with Zpr1 in the P23H transgenic fish with a mean of 34.2 ± 5.6 in the WT
fish perofgenotype).
vs. 32.4 ± 4.8 in the P23H per ~210 µm image field in the retinal section (p = 0.7; n = 3 fish per genotype).
3.2. Degeneration of Rod Photoreceptors in the P23H Transgenic Zebrafish
3.2. Degeneration of Rod Photoreceptors in the P23H Transgenic Zebrafish
The delocalization of rhodopsin and stunted outer segments observed in the P23H transgenic
zebrafishdelocalization
The is consistent withof rhodopsin and stunted
characteristics of rod outer segments in
photoreceptors observed
models in of the
RP P23H transgenic
that show retinal
zebrafish is consistent with characteristics of rod photoreceptors
degeneration [15,16,36]. To assess whether the P23H transgenic zebrafish displayed in models of RP that show retinal
rod
degeneration
degeneration,[15,16,36]. To assessthe
we first counted whether
number theofP23Hcellstransgenic
in the ONL zebrafish
of adult displayed rod degeneration,
retina using retinal tissue
we first counted
sections (Figurethe4A,B,
number of cellsareas,
outlined in thewhich
ONL ofexclude
adult retina usingdouble
elongate retinal tissue
cone andsections
long(Figure
single4A,B,
cone
outlined areas, which exclude elongate double cone and long single cone
nuclei, but include short single cones [37]). Figure 4C shows that the number of nuclei in the ONL nuclei, but include shortof
single
the P23Hconesfish
[37]).
wasFigure
almost 4Cthree-fold
shows thatless thethan
number of nuclei
the WT. P23H intransgenic
the ONL offish the had
P23H 67fish
± 11was almost
nuclei per
three-fold
~210 µm imageless than thewhile
field, WT. P23H transgenic
wild type fish had fish had
181 ± 25 ± 11 nuclei
67nuclei per ~210 per µm
~210 µm image
image field infield,
the while
retinal
wild type fish had 181 ± 25 nuclei per ~210 µm image field in the retinal
section (p = 0.005; n = 6 fish per genotype). We usually observe a single irregular layer of nucleisection (p = 0.005; n = 6infish
the
per genotype). We usually observe a single irregular layer of nuclei in
ONL of the P23H fish, unlike the regularly arranged, multilayered ONL in WT. Furthermore, the the ONL of the P23H fish, unlike
the regularly
space between arranged, multilayered
photoreceptor myoids ONL in WT.
and retinal Furthermore,
pigmented the space
epithelium, between
normally photoreceptor
occupied by outer
myoids and retinal pigmented epithelium, normally occupied by outer
segments (OS), was reduced in the P23H to one fifth that of the WT (Figure 4A,B, solid yellow segments (OS), was reduced in
lines).
the P23H
In the WTtotheoneOSfifth thatwas
space of the
100WT± 15(Figure 4A,B, solid
µm, whereas in theyellow
P23H it lines).
was 20 In ±the WT(pthe
5 µm OS space
= 0.005; n = 6was
fish
100 ± 15 µm, whereas
per genotype; Figure 4D). in the P23H it was 20 ± 5 µm (p = 0.005; n = 6 fish per genotype; Figure 4D).
Figure4.4. Photoreceptor loss
Figure loss in
inthe
theP23H
P23Htransgenic
transgeniczebrafish.
zebrafish.DAPI
DAPI label of adult
label retina
of adult sections.
retina The
sections.
yellow
The yellowdotted
dottedlines encompass
lines encompass nuclei
nucleiininthe
theONL
ONLcounted
countedto to assess photoreceptorloss.
assess photoreceptor loss.OS
OSindicates
indicates
thespace
the spacebetween
betweenphotoreceptor
photoreceptor myoids
myoids and and retinal
retinal pigmented
pigmented epithelium.
epithelium. TheThe number
number of cells
of cells in thein
ONL is almost
the ONL threethree
is almost times greater
times in the
greater in WT
the WT(A) (A)
thanthan
in the P23H
in the P23Hmutant
mutant(B),(B),
which usually
which shows
usually showsa
single irregular
a single layerlayer
irregular of nuclei. (C) Quantification
of nuclei. of photoreceptor
(C) Quantification counts in counts
of photoreceptor WT andinP23HWT transgenic
and P23H
= 6 fish per
(ntransgenic (n =genotype;
6 fish pererror bars are
genotype; ± SD;
error pCells 2020, 9, x FOR PEER REVIEW 10 of 19
colocalization of rhodopsin immunolabeling and TUNEL further confirmed that the apoptotic cells
in the ONL of the transgenic fish are the rods (Figure 5D). At 4 and 6 months of age, P23H transgenic
Cells 2020, 9, 2242 10 of 18
fish showed a significantly higher number of TUNEL positive cells in the ONL (per ~210 µm image
field) compared to the WT (Figure 5G). These results show that apoptosis is one of the forms of cell
weredeath happening
also seen in theinP23H
the RP model, although
transgenic we did notspace
in the sub-retinal exclude other 5B,
(Figure forms of cellarrowhead),
yellow death. A fewwhere
TUNEL-positive cells were also seen in the P23H transgenic in the sub-retinal space (Figure 5B,
phagocytic microglia are seen in mammalian RP models [14,38,39]. We also observed a small number
yellow arrowhead), where phagocytic microglia are seen in mammalian RP models [14,38,39]. We
of TUNEL-positive cells in the inner nuclear layer (INL) and in the retinal ganglion cell (RGC) layer of
also observed a small number of TUNEL-positive cells in the inner nuclear layer (INL) and in the
the P23H
retinaltransgenic retina
ganglion cell (RGC)(Figure
layer ofS3),
the suggesting that retina
P23H transgenic a few(Figure
other cells in the retina
S3), suggesting thatalso undergo
a few other cell
death in this model.
cells in the retina also undergo cell death in this model.
Figure 5. 5.Cell
Figure Cell death andcell
death and cell proliferation
proliferation in thein the transgenic
P23H P23H transgenic
zebrafish. zebrafish. (A,B)
(A,B) Cell death Cell death
detection
detection using TUNEL
using TUNEL staining
staining shows shows TUNEL-positive
TUNEL-positive dying cells (red)dying cells zebrafish
in the P23H (red) in retina
the P23H zebrafish
(4 months
retina (4 months
old). old).
The yellow The yellow
arrowhead arrowhead
shows shows a TUNEL-positive
a TUNEL-positive cellspace.
cell in the sub-retinal in the(C,D)
sub-retinal
Yellowspace.
(C,D) Yellow arrowheads show the colocalization of Retp1 (green) with TUNEL labeling in the P23H
transgenic fish. (E,F) PCNA immunostaining shows many PCNA-positive proliferating cells (green) in
the ONL of the P23H zebrafish, but very few in WT. ONL: outer nuclear layer. (G) Numbers of TUNEL
positive cells and (H) PCNA-positive cells per 210 µm image field in 4-month old and 6-month old WT
and P23H retina (n = 6 fish per genotype; error bars are ± SD; *** p < 0.001).of the P23H zebrafish, but very few in WT. ONL: outer nuclear layer. (G) Numbers of TUNEL positive
cells and (H) PCNA-positive cells per 210 µm image field in 4-month old and 6-month old WT and
P23H retina (n = 6 fish per genotype; error bars are ± SD; *** p < 0.001).
3.3. 2020,
Cells Regeneration
9, 2242 in the P23H Transgenic Zebrafish 11 of 18
Proliferating cell nuclear antigen (PCNA) is essential for replication in eukaryotic cells and is
expressed
3.3. in the in
Regeneration nucleus during
the P23H the DNA
Transgenic synthesis phase of the cell cycle [40]. It is commonly used
Zebrafish
as a progenitor cell marker. Since teleost fish are capable of regeneration, we assessed the extent of
Proliferating cell nuclear antigen (PCNA) is essential for replication in eukaryotic cells and is
regeneration happening in the P23H transgenic by labeling for PCNA. Figure 5E and F show a large
expressed in the nucleus during the DNA synthesis phase of the cell cycle [40]. It is commonly used
number of PCNA-positive cells decorating the ONL in the P23H fish, compared to very few PCNA-
as a progenitor cell marker. Since teleost fish are capable of regeneration, we assessed the extent of
labelled cells in the wild type fish. Unlike acute damage models in the zebrafish retina [41,42], we
regeneration happening in the P23H transgenic by labeling for PCNA. Figure 5E,F show a large number
observed very few PCNA-positive cells in the INL compared to the ONL in the P23H transgenic fish.
of PCNA-positive cells decorating the ONL in the P23H fish, compared to very few PCNA-labelled cells
At 4 and 6 months of age, P23H transgenic fish showed a significantly higher number of PCNA
in the wild type fish. Unlike acute damage models in the zebrafish retina [41,42], we observed very few
labeled cells in the ONL compared to the WT (Figure 5H). At any given time point we have observed
PCNA-positive cells in the INL compared to the ONL in the P23H transgenic fish. At 4 and 6 months
the high expression of PCNA in the P23H transgenic zebrafish during adult ages ranging from 4–12
of age, P23H transgenic fish showed a significantly higher number of PCNA labeled cells in the ONL
months (data not shown). The abundance of proliferating cells in the ONL of the P23H transgenic
compared to the WT (Figure 5H). At any given time point we have observed the high expression of
suggests that degenerating rods are being replaced continuously in this model from progenitor cells
PCNA in the P23H transgenic zebrafish during adult ages ranging from 4–12 months (data not shown).
located in the ONL.
The abundance of proliferating cells in the ONL of the P23H transgenic suggests that degenerating rods
5-bromo-2-deoxyuridine (BrdU) is a nucleoside analog that is specifically incorporated into
are being replaced continuously in this model from progenitor cells located in the ONL.
DNA during S-phase [43] and can subsequently be detected with an anti-BrdU specific antibody. We
5-bromo-2-deoxyuridine (BrdU) is a nucleoside analog that is specifically incorporated into DNA
used a short time BrdU injection to label proliferating cells in order to further assess the regeneration
during S-phase [43] and can subsequently be detected with an anti-BrdU specific antibody. We used a short
potential of the P23H transgenic line. As seen in the wholemount immunofluorescence imaging in
time BrdU injection to label proliferating cells in order to further assess the regeneration potential of the
Figure 6, BrdU-positive cells were abundant in the ONL of the P23H transgenic fish 5 and 24 hr after
P23H transgenic line. As seen in the wholemount immunofluorescence imaging in Figure 6, BrdU-positive
BrdU injection (Figure 6C,D), whereas very few cells were labeled in the WT (Figure 6A,B). The large
cells were abundant in the ONL of the P23H transgenic fish 5 and 24 h after BrdU injection (Figure 6C,D),
number of BrdU-labeled cells seen just 5 hr after BrdU injection demonstrates that proliferation is
whereas very few cells were labeled in the WT (Figure 6A,B). The large number of BrdU-labeled cells seen
extensive in the P23H transgenic retina. Furthermore, some BrdU-labeled cells 24 hr after injection
just 5 h after BrdU injection demonstrates that proliferation is extensive in the P23H transgenic retina.
co-label for rhodopsin (Figure 6D, arrowheads), indicating that proliferating cells are differentiating
Furthermore, some BrdU-labeled cells 24 h after injection co-label for rhodopsin (Figure 6D, arrowheads),
into rods in this model. Counts of BrdU-labeled cells revealed that the P23H transgenic had
indicating that proliferating cells are differentiating into rods in this model. Counts of BrdU-labeled cells
significantly more labeled cells than WT: almost 20-fold at 5 hr and almost 17-fold at 24 hr (n = 3, p <
revealed that the P23H transgenic had significantly more labeled cells than WT: almost 20-fold at 5 h and
0.001 for both; Figure 6E).
almost 17-fold at 24 h (n = 3, p < 0.001 for both; Figure 6E).
Figure 6. Continuous cell proliferation in the P23H transgenic zebrafish. Wholemount imaging of BrdU
(red) labeled cells in ONL of the WT (A,B) and P23H transgenic (C,D) 5 and 24 h after BrdU injection
respectively. Retp1 (green) labels rhodopsin. Yellow arrowheads in panel D show BrdU-labeled cells
that co-label with Retp1, indicating their differentiation into rods. Scale bar in B applies to A–D. (E) The
number of BrdU-labeled cells in the P23H transgenic fish is significantly higher than in the WT (n = 3
fish per genotype; error bars are ± SD; *** p < 0.001).Figure 6. Continuous cell proliferation in the P23H transgenic zebrafish. Wholemount imaging of
BrdU (red) labeled cells in ONL of the WT (A,B) and P23H transgenic (C,D) 5 and 24 hr after BrdU
injection respectively. Retp1 (green) labels rhodopsin. Yellow arrowheads in panel D show BrdU-
labeled cells that co-label with Retp1, indicating their differentiation into rods. Scale bar in B applies
Cells 2020, 9, 2242
to A-D. (E) The number of BrdU-labeled cells in the P23H transgenic fish is significantly higher than12 of 18
in the WT (n = 3 fish per genotype; error bars are ± SD; *** p < 0.001).
3.4. Retina Remodeling in the P23H Transgenic Zebrafish
3.4. Retina Remodeling in the P23H Transgenic Zebrafish
Since the rod cells are dying and new cells are produced, we were interested to see the rod bipolar
Since the rod cells are dying and new cells are produced, we were interested to see the rod
cell connections and the synapses they form. The anti-PKC-α antibody was used to label the rod bipolar
bipolar cell connections and the synapses they form. The anti-PKC-α antibody was used to label the
cells and anti-SV2 antibody to label all photoreceptor terminals. Note that the anti-PKC-α antibody
rod bipolar cells and anti-SV2 antibody to label all photoreceptor terminals. Note that the anti-PKC-
is not specific for one single zebrafish conventional PKC, but rather detects a combination of PKC-α
α antibody is not specific for one single zebrafish conventional PKC, but rather detects a combination
and -β variants [44]. PKC staining was generally weaker in the P23H than in the WT (Figure 7A,B),
of PKC-α and -β variants [44]. PKC staining was generally weaker in the P23H than in the WT (Figure
largely as a result of weaker expression in the Mb1 rod bipolar cells. This was particularly apparent in
7A,B), largely as a result of weaker expression in the Mb1 rod bipolar cells. This was particularly
the weaker labeling of the descending axons of the Mb1 bipolar cells (Figure 7A,B arrowheads) that
apparent in the weaker labeling of the descending axons of the Mb1 bipolar cells (Figure 7A,B
connect the large, round axon terminals at the bottom of the inner plexiform layer (IPL). An orthogonal
arrowheads) that connect the large, round axon terminals at the bottom of the inner plexiform layer
projection further confirmed that the PKC immunostaining was less intense in the P23H compared to
(IPL). An orthogonal projection further confirmed that the PKC immunostaining was less intense in
the WT, especially in the IPL region (Figure S4). There was a similar number of Mb1 bipolar cells in the
the P23H compared to the WT, especially in the IPL region (Figure S4). There was a similar number
P23H and WT retina, as assessed by the number of large terminals present at the bottom of the IPL
of Mb1 bipolar cells in the P23H and WT retina, as assessed by the number of large terminals present
(WT: 15.4 ± 2.3 terminals per 210 µm image field, n = 3; P23H: 14.8 ± 1.0 terminals per field, n = 3;
at the bottom of the IPL (WT: 15.4 ± 2.3 terminals per 210 µm image field, n = 3; P23H: 14.8 ± 1.0
t-test, p = 0.68). However, the PKC-α mRNA levels from the whole retina tissue showed a significant
terminals per field, n = 3; t-test, p = 0.68). However, the PKC-α mRNA levels from the whole retina
decrease in P23H compared to WT (n = 3; p = 0.03; Figure 7C).
tissue showed a significant decrease in P23H compared to WT (n = 3; p = 0.03; Figure 7C).
Figure7.7. Bipolar
Figure Bipolar cell
cellsynapses
synapsesininP23H
P23Htransgenic
transgenicretina.
retina. (A,B)
(A,B) Immunolabeling
Immunolabeling for for PKC-α
PKC-α (red)
(red)
shows that rod bipolar cells are morphologically similar, but PKC-α labeling is less
shows that rod bipolar cells are morphologically similar, but PKC-α labeling is less intense in the P23H intense in the
P23H transgenic
transgenic (B) compared
(B) compared to WT
to WT (A). (A).arrowheads
Yellow Yellow arrowheads indicate
indicate the bipolarthecell
bipolar
axons.cell
(C)axons. (C)
Relative
Relative mRNA level of PKC-α is higher in the WT compared to the P23H (n =
mRNA level of PKC-α is higher in the WT compared to the P23H (n = 3 fish per genotype; error bars3 fish per genotype;
error
are bars
± SD; * pare ± SD;(D,E)
< 0.05). * pCells 2020, 9, x FOR PEER REVIEW 13 of 19
rods expressing the P23H rhodopsin (magenta) (E). ONL: outer nuclear layer; INL: inner nuclear
Cells 2020, 9, 2242 13 of 18
layer; OPL: outer plexiform layer.
AAcloser
closerlook
lookatatthe
thephotoreceptor
photoreceptorsynaptic
synapticjunction
junction(Figure
(Figure7D,E)
7D,E)shows
showsthatthatininWT
WTthere
thereareare
manyfine
many finebipolar
bipolarcell
celldendrites
dendritesextending
extendingpast pastcone
coneterminals
terminals(synaptic
(synapticvesicle
vesicleprotein
proteinSV2—green)
SV2—green)
to make small synaptic contacts in the OPL and proximal ONL with rod
to make small synaptic contacts in the OPL and proximal ONL with rod terminals weakly labeled terminals weakly labeledforfor
SV2(Figure
SV2 (Figure7D 7Darrowheads).
arrowheads).These Thesefinefinedendrites
dendriteswerewerenot
notseen
seenininthe
theP23H
P23Htransgenic
transgenic(Figure
(Figure7E),
7E),
althoughshort
although shortbipolar
bipolarcellcellprocesses
processesappeared
appearedtotomakemakecontacts
contactswithwithsome
someofofthe
therods.
rods.This
Thischange
change
ininthe
theimmunostaining
immunostainingofofPKC PKCand andsynaptic
synapticvesicles
vesiclesininthe
theP23H
P23Htransgenic
transgenicisisprobably
probablydue duetotothe
the
reducednumber
reduced numberofofrod rodterminals
terminalsand andthe thecontinuous
continuousremodeling
remodelingofofthe theONL
ONLby bydying
dyingandandnewly
newly
regenerated rod photoreceptors.
regenerated rod photoreceptors.
Glutamine
Glutamine synthetase
synthetase (Glul)
(Glul) is specifically
is specifically highlyhighly enriched
enriched in the glial
in the Müller Müller
cellsglial
and iscells and is
involved
ininvolved in neurotransmitter
neurotransmitter recycling [45].recycling
Examination [45].of Examination of Glul revealed
Glul immunostaining immunostaining
a prominent revealed
change a
prominent change in its expression in P23H compared to the WT. Glul labeling
in its expression in P23H compared to the WT. Glul labeling showed decreased intensity in the outer INL showed decreased
intensity
and OPL ofin P23Hthe transgenics,
outer INL and which OPL of P23H
is seen clearlytransgenics,
in orthogonal which is seen
projections clearly
(Figure 8B,inhighlighted
orthogonal
inprojections
white box).(Figure
This is 8B,
the highlighted in white
area most affected by box). This is the area
the degenerating rodsmost affected by the
and proliferating roddegenerating
progenitor
rodsand
cells, andmay
proliferating rod progenitor
reflect changes in glutamatecells, cycling
and mayinreflect changes
the retina. inwas
This glutamate
furthercycling in theby
confirmed retina.
the
This was further
significantly reduced confirmed
Glul-a mRNA by thelevel
significantly reduced fish
in the transgenic Glul-a mRNA to
compared level
thein
WT the(ntransgenic fish
= 3; p = 0.01;
compared
Figure 8C). to the WT (n = 3; p = 0.01; Figure 8C).
Figure8.8. Glutamine
Figure Glutamine synthetase
synthetase(Glul)
(Glul)immunostaining
immunostaining is weak
is weakin the P23H
in the transgenic
P23H fish. fish.
transgenic (A,B)
Immunolabeling
(A,B) Immunolabeling for Glul (red)
for Glul shows
(red) thethe
shows overall
overallintensity
intensityof of
Glul is is
Glul weak
weak ininthe
theP23H
P23Hcompared
comparedto
toWT.
WT.TheThe top
top and
and side
side yellow
yellow boxes on each each panel
panel show
show the the and
andXXandandYYmaximum
maximumintensity
intensity
orthogonal projections, respectively. Glul immunostaining is much weaker in
orthogonal projections, respectively. Glul immunostaining is much weaker in the OPL and outer ONL the OPL and outer ONL
ofofP23H
P23H transgenic
transgenic compared
compared to to
thethe
WTWT (highlighted
(highlighted in in white
white box).
box). (C)(C) Relative
Relative mRNAmRNA level
level of Glul-
of Glul-a
isahigher
is higher in the
in the WTWT compared
compared to the
to the P23H
P23H (n =(n3 =fish
3 fish
perper genotype;
genotype; error
error barsbars
are are * p *Cells 2020, 9, 2242 14 of 18
Our transgenic model utilizes a 1.8 kb zebrafish rhodopsin promoter and displays initial expression
at 3 dpf in cells scattered through the outer retina. This is essentially the same as zebrafish lines
expressing either GFP or mCFP from a 5.5 kb Xenopus rhodopsin promoter [36,37]. Curiously, at this
age, immunostaining with the Retp1 anti-rhodopsin antibody did not detect expression of rhodopsin
in the wild type fish (Figure 2), suggesting that the transgenes lack regulatory elements that delay
the timing of expression of the native gene. Morris et al. [36] noted that the first-born wave of rods
distributed through the retina expressing the mCFP transgene disappear, with subsequent rods being
inserted near the retinal margins. This closely matches our observations of the expression pattern of
the P23H rhodopsin transgene, and implies a very short lifetime for the rods born in the initial wave.
Intriguing also is the appearance of the antigen labeled by the Zpr1 antibody in nascent outer segments
of cones at 3 dpf in the P23H transgenic retina, but not in the wild type. While this may simply reflect
slight differences in timing of collection of the samples or rate of development in batches of fish, it is
also possible that rods expressing the P23H mutant rhodopsin exert a cell non-autonomous effect on
surrounding cones. This is a topic that warrants further investigation.
Despite the degeneration of rods, the adult retina continues to harbor some regenerated rods and
possibly rods unaffected by the transgene, as well as a largely normal complement of double cones.
This is similar to the mCFP transgenic zebrafish model of RP [36]. Furthermore, proliferating progenitor
cells are abundant, indicating a high rate of rod regeneration. Even though rods are synthesized
continuously, PKC staining of the rod bipolar cells revealed that some contacts were formed with
the regenerated rods in the P23H transgenic, along with retention of synapses with cones (Figure 7).
We do not see a complete or severe loss of PKC staining as in mammalian models [46,47], which may
be because of the continuous regeneration of rods in the zebrafish model. An important question for
future research is whether newly-formed rods make functional synapses with these bipolar cells.
Outside of photoreceptors, the Müller glial cells display the most prominent remodeling that we
observed in the P23H transgenic retina. The noticed decrease in the levels of glutamine synthetase
in the Müller glia might be due to disrupted Müller glial function in the P23H transgenic compared
to the WT. Previous studies have shown that loss of major glutamate-releasing neurons in the retina
can lead to reduced expression of glutamine synthetase in the Müller cells [45,48]. Important Müller
glial cell functions including neurotransmitter recycling, carbon dioxide and potassium siphoning,
visual pigment cycling, glycolysis and water regulation could be affected during a continuous
degeneration-regeneration scenario [49].
A number of retinal degeneration models have previously been established in zebrafish. Forward
genetic screens that exploited visual behavior and light response studies in zebrafish led to the
identification of novel gene mutations involved in retinal degeneration and also established genetic
models to study the pathology [50,51]. The cone-specific phosphodiesterase gene (pde6c) mutant
was first identified in zebrafish by genetic screening and it leads to the rapid degeneration of all
cone photoreceptors soon after their formation [52]. This was followed by the identification of cone
degeneration in mice and humans as pde6c [53]. Photoreceptor degenerations caused by defects in
ciliary transport from the inner to outer segments have been characterized by lines with mutations
to ovl, flr, ift57, ift172, or elipsa genes [54–57]. Other lines identified by genetic screens utilizing
escape response assays were related to night blindness (nba, nbb, nbc, and nbd mutant strains) [58–60].
These strains, however, were lethal as homozygotes and had a variable degree of degeneration in
heterozygous fish, suggesting that the genes had important functions outside of the retina [60].
Multiple mutant and transgenic zebrafish lines with photoreceptor degeneration have been
produced and characterized. An X-linked RP model has been generated and characterized by mutating
the retinitis pigmentosa 2 (RP2) gene. The model revealed that a 12 bp in-frame deletion at the
C-terminal end of the protein led to a loss of RP2 protein structural stability [61]. Protein instability was
found to be the predominating pathogenic consequence for most RP2 mutations [61,62]. Morris et al. [36]
serendipitously developed a transgenic zebrafish XOPS-mCFP line that has selective degeneration of
rods and hence can be used as a model to study rod degeneration and regeneration. This model isYou can also read


