Notch Signaling between Cerebellar Granule Cell Progenitors - eNeuro
←
→
Page content transcription
If your browser does not render page correctly, please read the page content below
Research Article: Confirmation

Development

Notch Signaling between Cerebellar Granule Cell
Progenitors
    Toma Adachi,1,2 Satoshi Miyashita,1 Mariko Yamashita,1,3 Mana Shimoda,1,2
    Konstantin Okonechnikov,4,5 Lukas Chavez,6,7 Marcel Kool,4,5,8 Stefan M. Pfister,4,5,9
    Takafumi Inoue,2 Daisuke Kawauchi,1 and Mikio Hoshino1

https://doi.org/10.1523/ENEURO.0468-20.2021
1
 Department of Biochemistry and Cellular Biology, National Institute of Neuroscience, National Center of Neurology
and Psychiatry, Tokyo 187-8551, Japan, 2Department of Life Science and Medical Bioscience, School of Advanced
Science and Engineering, Waseda University, Tokyo 169-8555, Japan, 3Department of NCNP Brain Function and
Pathology, Graduate School of Medical and Dental Sciences, Tokyo Medical and Dental University, TMDU, Tokyo
113-8510, Japan, 4Hopp-Children’s Cancer Center Heidelberg (KiTZ), 69120 Heidelberg, Germany, 5Division of
Pediatric Neurooncology, German Cancer Research Center (DKFZ) and German Cancer Consortium (DKTK), 69120
Heidelberg, Germany, 6Department of Medicine, University of California San Diego, La Jolla, CA 92093, 7Moores
Cancer Center, University of California San Diego, La Jolla, CA 92093, 8Princess Maxima Center for Pediatric
Oncology, 3584 CS Utrecht, The Netherlands, and 9Department of Pediatric Hematology and Oncology, Heidelberg
University Hospital, 69120 Heidelberg, Germany

Visual Abstract

Cerebellar granule cells (GCs) are cells which comprise over 50% of the neurons in the entire nervous system.
GCs enable the cerebellum to properly regulate motor coordination, learning, and consolidation, in addition to
cognition, emotion and language. During GC development, maternal GC progenitors (GCPs) divide to produce
not only postmitotic GCs but also sister GCPs. However, the molecular machinery for regulating the propor-
tional production of distinct sister cell types from seemingly uniform GCPs is not yet fully understood. Here
we report that Notch signaling creates a distinction between GCPs and leads to their proportional

     Significance Statement
     This study is the first to succeed in visualization of Notch signaling in vivo during cerebellar development.
     Granule cell progenitors (GCPs) in the outermost layer of the developing cerebellum are a seemingly ho-
     mogenous cell population, but this study revealed two types of GCPs; more proliferative Notch-ON-GCPs
     and more differentiative Notch-OFF-GCPs, the latter of which gradually give rise to postmitotic GCs. Our
     experiments suggest that NOTCH2 and HES1 are involved cell-autonomously to suppress GCP differentia-
     tion by inhibiting NEUROD1 expression. In contrast, JAG1-expressing cells non-autonomously upregulated
     Notch signaling activities via NOTCH2-HES1 in surrounding GCPs, suppressing their differentiation. This
     study gives new insights into the mechanisms controlling the differences within homogenous cell popula-
     tions that direct proper and coordinated cell differentiation.

May/June 2021, 8(3) ENEURO.0468-20.2021 1–18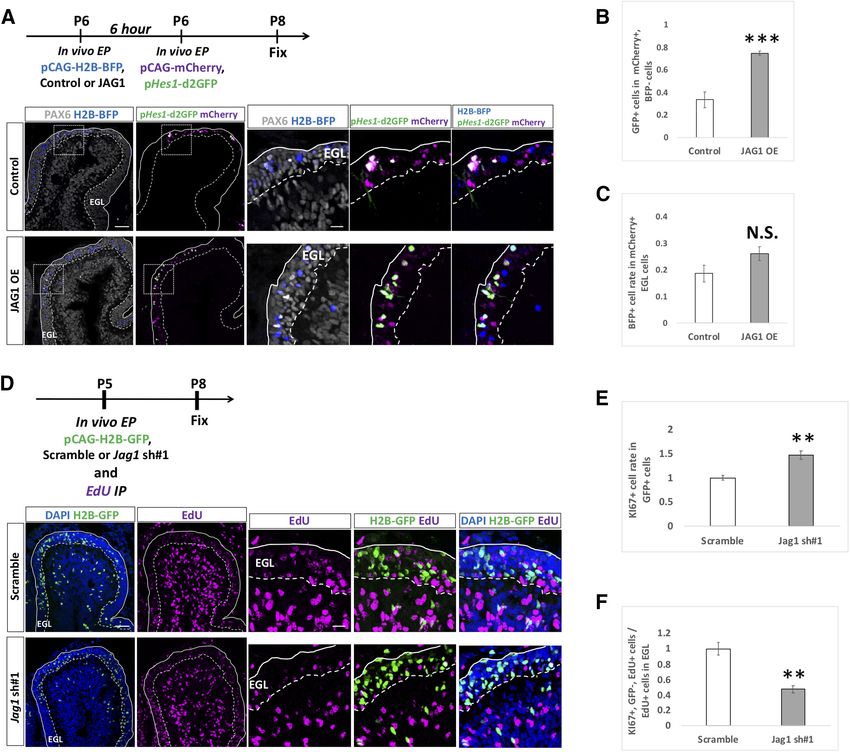
Research Article: Confirmation      2 of 18

differentiation in mice. Among Notch-related molecules, Notch1, Notch2, Jag1, and Hes1 are prominently ex-
pressed in GCPs. In vivo monitoring of Hes1-promoter activities showed the presence of two types of GCPs,
Notch-signaling ON and OFF, in the external granule layer (EGL). Single-cell RNA sequencing (scRNA-seq)
and in silico analyses indicate that ON-GCPs have more proliferative and immature properties, while OFF-
GCPs have opposite characteristics. Overexpression as well as knock-down (KD) experiments using in vivo
electroporation showed that NOTCH2 and HES1 are involved cell-autonomously to suppress GCP differentia-
tion by inhibiting NEUROD1 expression. In contrast, JAG1-expressing cells non-autonomously upregulated
Notch signaling activities via NOTCH2-HES1 in surrounding GCPs, eventually suppressing their differentiation.
These findings suggest that Notch signaling results in the proportional generation of two types of cells, imma-
ture and differentiating GCPs, which contributes to the well-organized differentiation of GCs.
Key words: cerebellar granule cell progenitor; Notch signaling

Introduction                                                                     involved in “lateral inhibition,” by which only a limited num-
   Notch signaling is one of the most important signaling                        ber of cells can differentiate into a neural lineage whereby
pathways involved in many aspects of life (Tsakonas et                           the rest go to an epidermal lineage. Thus, the Notch signal-
al., 1999; Andersson et al., 2011). It is mainly known for                       ing machinery or lateral inhibition system enables uniform
the intercellular signaling between “signal-sending cells,”                      cells to differentiate proportionally into different cell types.
which present the Notch ligand on their cell surfaces and                           Since then, numerous studies on Notch signaling have
“signal-receiving cells,” which present the Notch receptor                       identified identical or similar genes in vertebrates, includ-
(Tsakonas et al., 1999; Andersson et al., 2011). Once the                        ing Notch1-4, Dll1,2,4, Jag1,2, Maml1,2,3, Hes1-7, and
ligand binds to the receptor, the downstream intracellular                       Hey1,2 (Kageyama et al., 2007; Andersson et al., 2011).
pathway is activated in the Notch receptor-presenting                            Notch signaling is involved in various developmental
cells, upregulating expression of Hes and Hey family tran-                       events in various tissues, including the nervous system
scription factors, and subsequently affecting the binary                         not only in invertebrates but also in vertebrates (Louvi and
cell fate of adjacent cells (Tsakonas et al., 1999;                              Tsakonas, 2006). For example, Notch signaling is involved
Andersson et al., 2011).                                                         in the production of neurons and neural progenitors from
   Notch signaling molecules were first identified as neu-                       radial glia of the mammalian cerebral cortex, precisely
rogenic genes in Drosophila via systemic genetic screen-                         regulating the ratio of sister radial glia and sister neuronal
ing by the Campos-Ortega group (Lehmann et al., 1983).                           cells (Shitamukai et al., 2011). Thus, it is believed that one
They identified Notch, d , master mind, Enhancer of Split,                       of the important functions of Notch signaling is to gener-
which later turned out to constitute a very important sig-                       ate different types of cells from uniform cells, which may
naling pathway, the “Notch signaling pathway.” In                                be the universal basis for the development of multicellular
Drosophila embryogenesis, neuroectodermal cells sto-                             organisms that originated from a single cell, that is, an oo-
chastically differentiate into epidermal cells and neuro-                        cyte or an egg.
blasts in the ratio of 4:1 (Campos-Ortega and Hartenstein,                          The cerebellum contains a tremendous number of gran-
1985). However, if a neurogenic gene is disrupted, all neu-                      ule cells (GCs) that comprise over 50% of the neurons in
roectodermal cells differentiate into neuroblasts (Lehmann                       the entire nervous system (Williams and Herrup, 1988).
et al., 1983; Tsakonas et al., 1999). This observation led to                    Numerous GCs enable the cerebellum to properly regu-
the notion that neurogenic genes (or Notch signaling) are                        late motor coordination, motor learning, and consolida-
                                                                                 tion, in addition to cognition, emotion and language
                                                                                 (Lackey et al., 2018). GC progenitors (GCPs) are mitotic
Received November 2, 2020; accepted March 9, 2021; First published March
   24, 2021.                                                                     cells located in the outer external GC layer (oEGL) of the
   The authors declare no competing financial interests.                         developing cerebellum (Chizhikov and Millen, 2003).
   Author contributions: T.A., S.M., L.C., M.K., S.M.P., T.I., D.K., and M.H.    Although GCPs in the oEGL seem to be uniform, they di-
designed research; T.A., S.M., M.Y., and M.S. performed research; T.A., S.M.,    vide to produce two types of sister cells, GCPs and GCs
K.O., and D.K. analyzed data; T.A. and M.H. wrote the paper.
   This work was supported by Japan Society for the Promotion of Science
                                                                                 (Yang et al., 2015). GCs generated from GCPs move to
Grants 18H02538 and 16H06528 (to M.H.), 20K15919 (to S.M.), and 18J20309         the inner EGL (iEGL) and then migrate radially through the
(to T.A.); the Japan Agency for Medical Research and Development Grant           molecular layer (ML) to reach the inner GC layer (IGL;
JP20dm0107085h0001 (to M.H.); Intramural Research Grants 27-7 and 28-4           Schilling, 2018). The proportion of sister GCPs and GCs is
(to M.H.); and the Heidelberg Center for Personalized Medicine Grant H065.       thought to be precisely regulated at each developmental
   Acknowledgements: We thank Dr. R. Kageyama, Dr. I. Imayoshi, and Dr. M.
Yamada (Kyoto University) for pHes1-d2GFP, pHes5-d2GFP, and Hes1p-
                                                                                 stage (Miyashita et al., 2017). Disruption of this regulation
venus vectors and R. Yu for valuable comments.                                   may cause a smaller cerebellum as observed in cerebellar
   Correspondence should be addressed to Satoshi Miyashita at miyasatoshi@       hypoplasia (Basson and Wingate, 2013). It may also lead
ncnp.go.jp or Mikio Hoshino at hoshino@ncnp.go.jp.                               to generation of SHH subgroup medulloblastoma, a
   https://doi.org/10.1523/ENEURO.0468-20.2021                                   tumor derived from GCPs (Goodrich et al., 1997).
Copyright © 2021 Adachi et al.
                                                                                    Several reports have suggested expression of some
This is an open-access article distributed under the terms of the Creative
Commons Attribution 4.0 International license, which permits unrestricted use,
                                                                                 Notch related molecules in GCPs/GCs (Tanaka et al.,
distribution and reproduction in any medium provided that the original work is   1999; Irvin et al., 2001, 2004; Solecki et al., 2001; Stump
properly attributed.                                                             et al., 2002; Tanaka and Marunouchi, 2003; Eiraku et al.,

May/June 2021, 8(3) ENEURO.0468-20.2021                                                                                                   eNeuro.org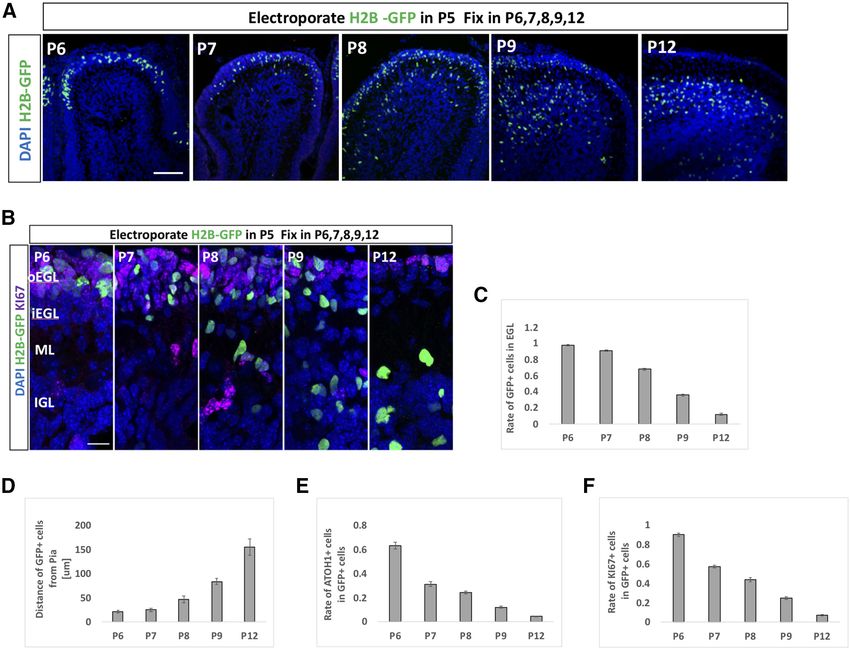
Research Article: Confirmation      3 of 18

2005). The Solecki group showed that overexpression of            Notch2: CCACCTGCAATGACTTCATCGG and TCGAT
NOTCH2 and HES1 suppressed the differentiation of GCs           GCAGGTGCCTCCATTCT,
as was estimated by neurite length in cultured GCPs/GCs           Notch3: GGTAGTCACTGTGAACACGAGG and CAACT
as well as cerebellar explant (Solecki et al., 2001).           GTCACCAGCATAGCCAG,
However, there have been no studies that directly ob-             Notch4: GGAGATGTGGATGAGTGTCTGG and TGGC
served Notch signaling between GCPs or that showed the          TCTGACAGAGGTCCATCT,
significance of Notch signaling between GCPs for GC               Hes1: GGAAATGACTGTGAAGCACCTCC and GAAG
development.                                                    CGGGTCACCTCGTTCATG,
   In this study, we identified Notch signaling molecules         Hes5: CCGTCAGCTACCTGAAACACAG and GGTC
that are abundantly expressed in GCPs. Furthermore, we          AGGAACTGTACCGCCTC,
succeeded in classifying GCPs into Notch-ON and -OFF              Jag1: TGCGTGGTCAATGGAGACTCCT and TCGC
cells, the former of which are more immature and prolifer-      ACCGATACCAGTTGTCTC,
ative, whereas the latter are less proliferative and more         Jag2: CGCTGCTATGACCTGGTCAATG and TGTA
differentiated. Intercellular interaction of JAG1 and           GGCGTCACACTGGAACTC,
NOTCH2 increase HES1 expression in NOTCH2-express-                Dll1: GCTGGAAGTAGATGAGTGTGCTC and CACA
ing cells, which eventually drive the cells to be Notch-ON      GACCTTGCCATAGAAGCC,
cells. NOTCH2 and HES1 are autonomously involved in               Dll3: CCAGCACTGGATGCCTTTTACC and ACCT
keeping GCPs in a proliferative state, while JAG1-expressing    CACATCGAAGCCCGTAGA,
cells had similar effects non-autonomously. We also found         Dll4: GGGTCCAGTTATGCCTGCGAAT and TTCGG
that HES1 suppresses the expression of NEUROD1, an im-          CTTGGACCTCTGTTCAG.
portant factor that promotes GC differentiation, suggesting
that Notch-signaling causes GCPs to remain in a proliferative   Plasmids
state by suppressing NEUROD1 expression. This study re-           Expression vectors of HES1, 5, JAG1, and NEUROD1,
veals a new function of Notch signaling in GC development       and sh vectors for Notch1, Notch2, Hes1, Hes5, Jag1,
and provides insights into the machinery underlying how dif-    and NeuroD1 were constructed as previously reported
ferent cell types are proportionally generated from uniform     (Kawauchi et al., 2006). All cloned expression fragments
cells.                                                          were inserted into a pCAGGS vector (GE Healthcare). The
                                                                primers sequences, used for cloning are, for HES1: 59-
                                                                ATGCCAGCTGATATAATGG-39 and 59-TCATCCTCTG
Materials and Methods                                           GTCCGCT-39, HES5: 59-ATGGCCCCAAGTACCGT-39
Animals                                                         and 59-TCATCCTCTGGTCCGCT-39, JAG1: 59-TCCAC
   All mouse experiments were approved by the Animal            GGAGTATATTAGAGCC-39, 59-GCTAGCACACTCATCGA
Care and Use Committee of the National Institute of             TG-39, 59-AACCCCTGCTTGAATGGG-39and 59-CTATAC
Neuroscience, Japan. Mice were housed in SPF condi-             GATGTATTCCATCCGGTT-39, and NEUROD1: 59-ATGA
tions and maintained on a 12/12 h light/dark cycle with         CCAAATCATACAGCGA-39 and 59-CTAATCGTGAAAGA
free access to food and water. ICR pups were obtained           TGGCAT-39. sh vectors were generated by inserting the
from SLC. In all analyses, we used pups without identify-       double-stranded oligonucleotides into a mU6 pro vector.
ing the sex of each animal.                                     The targeting sequence for each vector was designed by
                                                                siDirect 2.0 (Naito et al., 2009). Sequences are, Notch1:
                                                                #1 59-AAGGTGTATACTGTGAAATCAAC-39, #2 59-CTGTA
Quantitative PCR (qPCR)                                         ACAGTGCCGAATGTGAGT-39, Notch2: #1 59- AGGCCT
  GCP isolation and qPCR was performed as previously            TAATTGTGAAATTAATT-39, #2 59-GAGGTGATAGGC
described (Kutscher et al., 2020). In brief, 5 million GCPs     TCTAAGATATT-39, Hes1: #1 59-GAGGCGAAGGGCAAG
were plated per well in a six-well plate and cultured for 48    AATAAATG-39, #2 59-TTGGATGCACTTAAGAAAGATAG-
h with or without 200 mM smoothened agonist (SAG,               39, Hes5: #1 59-CCGCATCAACAGCAGCATAGAGC-39,
Merck). GCPs were harvested and cDNA was generated              #2 59-CCGTCAGCTACCTGAAACACAGC-39, NeuroD1:
with Superscript IIkit (Invitrogen). Relative gene expres-      #1 59-GCCTAGAACGTTTTAAATTAAGG-39, #2 59-TGGC
sion was compared with the geometric mean of Hrpt1,             AACTTCTCTTTCAAACACG-39. pCAG-H2BGFP vectors
Rpl27, and Rer1 (Thomas et al., 2014). The primer se-           and pCAG-mCherry were a gift from N. Masuyama.
quences used are as following:                                  pHes1-d2GFP, pHes5-d2GFP and Hes1p-venus vectors
  Hrpt1: CAAACTTTGCTTTCCCTGGT and TCTGGCC                       were gifts from R. Kageyama (Kohyama et al., 2005;
TGTATCCAACACTTC,                                                Ohtsuka et al., 2006). pCAG-H2B-BFP (pTagBFP-H2B)
  Rpl27: AAGCCGTCATCGTGAAGAACA and CTTGAT                       was purchased from evrogen (catalog #FP176). Coding
CTTGGATCGCTTGGC,                                                region of Hes1 or Hes5 was inserted into a pEGFP-N3
  Rer1: GCCTTGGGAATTTACCACCT and CTTCGAA                        vector to generate HES1-fusion-GFP and HES5-fusion-
TGAAGGGACGAAA,                                                  GFP vectors.
  Ccnd2: GAGAAGCTGCCCTGATCCGCA and CTTC
CAGTTGCAATCATCATCGACG,                                          Antibodies and immunohistochemistry
  Notch1: GCTGCCTCTTTGATGGCTTCGA and CACA                         Detailed protocols for immunohistochemistry were de-
TTCGGCACTGTTACAGCC,                                             scribed previously (Seto et al., 2014). Briefly, neonatal

May/June 2021, 8(3) ENEURO.0468-20.2021                                                                               eNeuro.org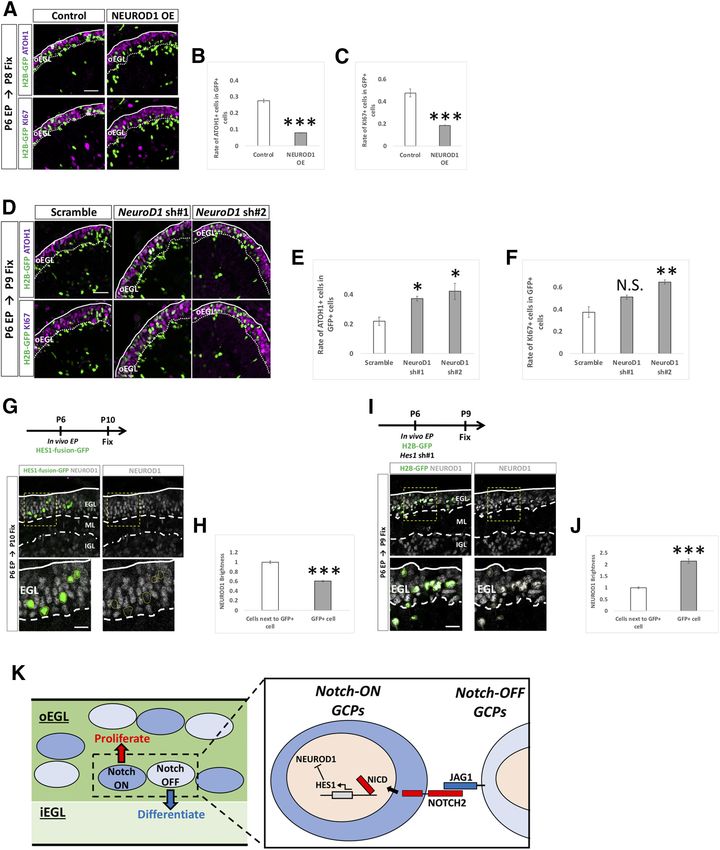
Research Article: Confirmation      4 of 18

mice were fixed with 4% PFA and embedded with O.C.T                Zeiss) and FV3000 (Olympus). Acquired images were ana-
compound (Sakura Finetek). Frozen brains were sagittally           lyzed with ImageJ (RSB). The analyses to calculate the
sectioned into 18-mm slices with a cryostat (CM3050 S;             rate of undifferentiated states of GCPs were done by
Leica). Cryosections were incubated at room temperature            using the “Cell counter in Plugins” in ImageJ. All of the
with 1% normal donkey serum containing 0.2% PBST                   GFP (or mCherry)-positive cells in EGL, ML, and IGL were
(blocking solution) for 1 h. After blocking, sections were         included in the analyses. The analyses to quantify the pro-
incubated with primary antibodies diluted with blocking            tein level of GFP and mCherry in Figure 3, and NEUROD1
solutions at 4° for 16 h. The following primary antibodies         in Figure 10, were done by using “Measures in Analyze” in
were used, goat anti-Notch1 (1:500; sc-6015; Santa Cruz            ImageJ. The NEUROD1 brightness of GFP negative cells
Biotechnology), goat anti-Notch2 (1:500; sc-7423; Santa            located in the next to GFP-positive cells were used as
Cruz Biotechnology), rabbit anti-Jagged1 (1:500; ab7771;           control.
Abcam), chicken anti-GFP (1:1000; GFP-1010; Aves), rab-
bit anti-RFP (1:500; PM005; MBL; RFP antibody was used to
                                                                   Cell culture and transfection
enhance CAG-mCherry signals), rabbit anti-Atoh1 (1:200;
                                                                     Cell culture and transfection were performed as previ-
Yamada et al., 2014), rat anti-Ki67 (1:500; 14-5698-
                                                                   ously reported (Miyashita et al., 2020). Neuro2a (N2a)
82; eBioscience), rabbit anti-Pax6 (1:500; PRB-278P;
                                                                   cells were cultured in DMEM containing 10% FBS and
BioLegend), and goat anti-NeuroD (N-19; 1:200; sc-1084;
                                                                   100 U/ml penicillin-streptomycin. Five million cells were
Santa Cruz Biotechnology). Subsequently, slides were rinsed
                                                                   plated per well in a six-well plate and 24 h after the pas-
with PBS and incubated with secondary antibodies conju-
                                                                   sage, transfection was performed with transfectin reagent
gated with Alexa Fluor 488, Alexa Fluor 568, or Alexa Fluor
                                                                   (Bio-Rad); 1 mg expression vector plasmid DNA and 2 mg
647 (1:400; Abcam) and DAPI (25 mg/ml; Invitrogen) in block-
                                                                   sh plasmid DNA were introduced in each well.
ing buffer in PBS at room temperature for 2 h. Slides were
rinsed with PBS again and mounted with Permafluor.
                                                                   Western blotting
In vivo electroporation                                              N2a cells were harvested 48 h after the transfection.
   in vivo electroporation to neonatal mice was described          Detailed protocols of western blotting were described
previously (Owa et al., 2018). Expression plasmids were di-        previously (Shiraishi et al., 2019). Membranes were incu-
luted to 1 mg/ml, shRNAs to 2 mg/ml and fluorescent protein        bated with primary antibodies at 4° overnight. The follow-
vectors to 0.5 mg/ml in milliQ. pHes1-d2GFP, pHes5-d2GFP           ing primary antibodies were used, rabbit anti- b -actin
and Hes1p-venus vectors were diluted to 1 mg/ml in milliQ.         (1:1000; MBL), rabbit anti-GFP (1:2000; MBL-598; MBL),
Fastgreen was added to visualize the plasmid solution.             and rabbit anti-Jagged1 (1:1000; ab7771; Abcam). After
Pups were anesthetized on ice before electroporation; 10-ml        membranes were incubated with secondary antibodies at
plasmid solutions were injected into P5 or P6 ICR cerebella        room temperature for 1 h, HRP substrate (Millipore) was
over the skull. Electric pulses (50 ms in duration, 80 V, seven    added and immuno-signals were detected by LAS4000
times) were delivered to mice with 150-ms interval using for-      (Fujifilm). In quantification, all of the targeted proteins ex-
ceps-type electrodes (NEPA gene). The pups were kept               pression levels are normalized by the expression level of
warm at 37° until recovered and returned to the litter. Pups       b -actin.
were fixed a few days after electroporation as indicated. For
“double electroporation” experiments (Fig. 9A–C), pups             Smart-Seq [single-cell RNA sequencing (scRNA-seq)]
were temporarily returned to the litter after the first electro-     Cells were prepared from P7 cerebella using Percoll
poration and the procedure was repeated 6 h later. In Figure       density gradient centrifugation as described previously
9D–F, EdU (10 mg/ml) diluted in PBS (50 mg/kg, 20 ml total         (Kawauchi et al., 2012) followed by capturing the cells
volume) was introduced by intraperitoneal injection immedi-        using the C1 Fluidigm systems with 96-well chips. The
ately following electroporation.                                   total RNAs were extracted from single sorted cells and
                                                                   the library was prepared for the subsequent RNAseq.
Slice culture and time lapse imaging
  Cerebellar slice culture was prepared as previously re-          Data processing for scRNA-seq data
ported (Owa et al., 2018). Electroporated postnatal day              The sequencing reads were aligned to mm10 reference
(P)6 or P7 mouse cerebella were sliced into 250-mm sagit-          using STAR 2.4.1d (Dobin et al., 2013). Gene expression
tal sections with a vibratome. Slices were cultured at 37°         counts per cell were computed with HTseq-count tool 0.6.1
for 6 h, and time lapse imaging was taken with a confocal          (Anders et al., 2015). Quality control for the alignments was
microscope, FV3000 (Olympus). Pictures were taken                  performed with Qualimap v2.2.1 (Okonechnikov et al., 2016).
every 5 min. In Figure 2D-F, 1 ml DMSO or g secretase in-          The computed counts were further processed with Seurat v3
hibitor RO4929097 (5 nM, Selleck) were added to the me-            as described (Stuart et al., 2019). All cells belonging to the
dium just before the imaging.                                      cluster 0 (Fig. 4D,F) were categorized by Notch2 expression
                                                                   to Notch2-positive-cells (Notch2 . 0) and Notch2-negative-
Image acquisition and quantification                               cells (Notch2 = 0). Differentially expressed genes (DEG) be-
  All images were acquired from midline vermis region of           tween Notch2-positive-cells and Notch2-negative cells were
Lobules IV–VI with confocal microscopy, LSM780 (Carl               determined with DESeq2 (Love et al., 2014). Genes with

May/June 2021, 8(3) ENEURO.0468-20.2021                                                                                    eNeuro.org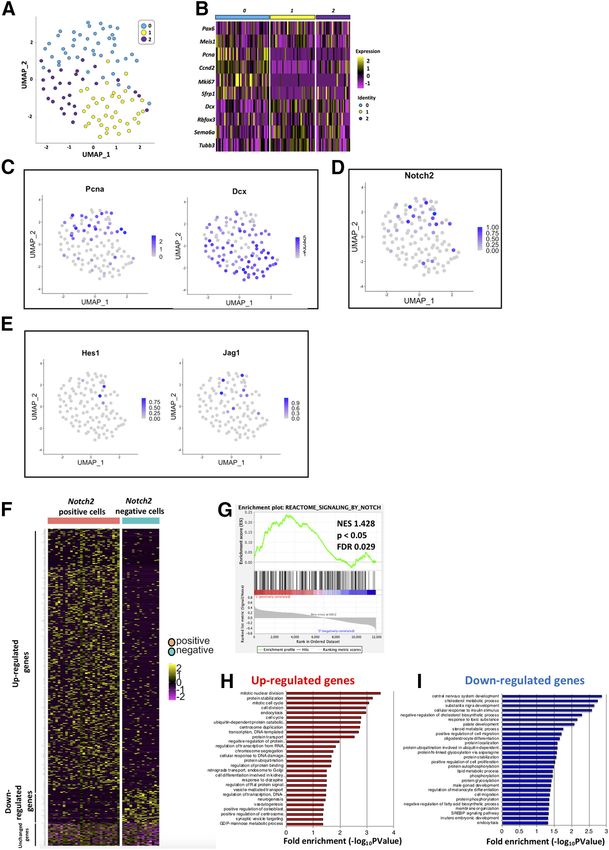
Research Article: Confirmation      5 of 18

Figure 1. Expression of Notch signaling molecules in cerebellar GCPs. A–D, Gene expression of Notch receptors (Notch1,2,3,4), Hes fam-
ily genes (Hes1,5), and ligands (Jag1,2, Dll1,3,4) was estimated by quantitative RT-PCR using GCP-like (SAG1) or GC-like (SAG–) cells that
were purified from P6 cerebella (A). Hrpt1, Rpl27, and Rer1 were used as internal controls (C, D). Ccnd2 expression is a marker of GCPs
used to monitor the culture conditions (B). Data are shown as mean 6 SEM; *p , 0.05, Student’s t test. E–G, Immunostaining with indicated
antibodies on sagittal cerebellar sections. Sections were co-stained with DAPI, a nuclear marker. Within the EGL, nearly all Ki67-positive
cells are GCPs (Chizhikov and Millen, 2003; Yang et al., 2015; Schilling, 2018). Lobule IV/V or VI is shown. Differences were not observed
as to their expression along an anterior-posterior axis. Scale bars: 30 and 15 mm (E–G).

adjusted p , 0.01 were defined as DEGs (582 upregulated,               by NOTCH). DAVID was used to conduct the Gene
74 downregulated).                                                     Ontology (GO) analysis (https://david.ncifcrf.gov).
  Unchanged genes were selected from genes with ad-
justed p . 0.05. GSEA analysis was performed with the                  Data availability statement
identified DEGs against NOTCH-REACTOME dataset                          scRNA-seq data used in this study were available in
(Molecular Signatures Database v7.1, M10189, Signaling                 Gene Expression Omnibus (GSE153313).

May/June 2021, 8(3) ENEURO.0468-20.2021                                                                                          eNeuro.org
Research Article: Confirmation      6 of 18

Code availability                                             d2GFP plus an mCherry-expressing vector (pCAG-
  All the codes used in this study are available from the     mCherry) on GCPs in the EGL at P5 and fixed electro-
lead contact (hoshino@ncnp.go.jp).                            porated cerebella 3 d after electroporation. While
                                                              pHes1-d2GFP gave rise to significant signals in the
Statistical analyses                                          EGL, signals for pHes5-d2GFP were barely observed
                                                              (Fig. 2A–C). This discrepancy in the promoter activities
  Individual animals or trials are regarded as biological
                                                              of Hes1 and Hes5 in the EGL is consistent with that of
replicates. All controls were prepared under the same ex-
perimental conditions. All data are presented as mean 6       the levels of expression strength of Hes1 and Hes5 in
SEM. Statistical tests were performed by Student’s t test     SAG-treated cells (Fig. 1C).
and one-way ANOVA with Bonferroni’s post hoc test; p             We next tried to confirm whether this Hes1 promoter
values were represented as; N.S. for p . 0.05; *p , 0.05,     activity in the EGL is under the control of Notch signaling.
**p , 0.01, ***p , 0.001.                                     For this purpose, we performed time lapse observation of
                                                              cerebellar slices containing a Hes1 promoter monitoring
                                                              vector in the presence or absence of RO4929097.
Results                                                       RO4929097 is a specific g secretase inhibitor that pre-
Expression of Notch-related molecules in cerebellar           vents the cleavage of Notch intracellular domain (NICD),
GCPs                                                          leading to inhibition of its downstream signaling cascades
   Previously, several studies reported that Notch signal-    (Luistro et al., 2009). Of note, we used pHes1-Venus in-
ing-related molecules were expressed in the cerebellar        stead of pHes1-d2GFP because of requirement of stron-
EGL (Tanaka et al., 1999; Irvin et al., 2001, 2004; Solecki   ger fluorescence signals during time-lapse recordings
et al., 2001; Stump et al., 2002; Tanaka and Marunouchi,      (Kohyama et al., 2005). We electroporated pHes1-Venus
2003; Eiraku et al., 2005). However, in all cases, no dis-    plus pCAG-mCherry to P5 cerebella, generated cerebellar
crimination was made between the expression in GCPs           slices at P6 and performed time lapse observations in the
and GCs. Therefore, we isolated GCPs from cerebella at        presence or absence of RO4929097 for .8 h (Fig. 2D–F).
P6 according to our method (Kutscher et al., 2020) and        The kinetics of the fluorescence intensities clearly showed
cultured them for 2 d with or without SAG, an activator of    that RO4929097 gradually but dramatically decreased the
SHH signaling. Under this condition, SAG-treated and          Venus intensity reflecting Hes1 promoter activity, while
non-treated cells possess characteristics very similar to     the Venus intensity was not changed in control (DMSO
those of GCPs and GCs, respectively (Kutscher et al.,         application) slices during the recordings (Fig. 2D,E). Also,
2020). Consistently, Ccnd2, known as a mitotic GCP            the rate of Venus-positive cells in mCherry1 cells were
marker, were expressed highly in SAG-treated cells, and       dramatically decreased only in the RO4929097 applied
expressed very low in non-treated cells (Fig. 1A,B). We       slices (Fig. 2D,F).
performed quantitative RT-PCR (qPCR) to determine the            These results suggest that fluorescence signals for the
expression of Notch signaling-related genes. In SAG-          Hes1 promoter in the EGL are regulated by Notch
treated cells, or GCP-like cells, Notch1, Notch2, Hes1,       signaling.
and Jag1 were all prominently expressed while expres-            Among Notch family genes, Notch1 and Notch2 were
sion of Notch3, Notch4, Hes5, Jag2, Dll1, Dll3, and Dll4      strongly expressed in GCP-like cells (Fig. 1C) and in the
were low (Fig. 1C). In SAG-non-treated cells, we observed     EGL (Fig. 1E,F). Therefore, we aimed to identify which
considerable expression of Notch1, Notch2, Hes5, and          Notch gene is responsible for the Hes1 promoter activity
Jag2 (Fig. 1D). Because our aim was to investigate the im-    in the EGL. For this purpose, we electroporated short hair-
portance of Notch signaling among GCPs in the EGL, we         pin (sh)-RNAs for Notch1 or Notch2 plus pHes1-d2GFP
focused on Notch1, Notch2, Hes1, and Jag1 in this study.      and pCAG-mCherry into P6 cerebella and fixed them at
Next, we performed immunostaining with antibodies             P8 (Fig. 2G). Counting GFP-positive cells in mCherry1
against NOTCH1, NOTCH2, and JAG1 on P6 cerebellum             cells showed that knock down (KD) of Notch2 significantly
along with KI67, a marker for mitotic cells. NOTCH1,          downregulated the Hes1 promoter activity, while KD of
NOTCH2, and JAG1, exhibited honeycomb-like staining           Notch1 did not (Fig. 2G,H), suggesting that Notch2-Hes1
signals in the oEGL and iEGL (Fig. 1E–G), suggesting that     signaling is active in the EGL during cerebellar
those membrane proteins were expressed by GCPs and            development.
GCs in the developing cerebellum.
                                                              Notch signaling-ON and signaling-OFF GCPs in the
Notch2-Hes1 signaling is active in the EGL                    oEGL
  Given that some Notch-related molecules were ex-              We electroporated with pHes1-d2GFP and pCAG-
pressed in GCPs in the developing cerebellum, we tried to     mCherry into P5 EGL and immunostained cerebellar sam-
monitor Notch signaling activities in GCPs in the EGL. To     ples at P8 with KI67. Interestingly, among electroporated
this end, we used vectors, pHes1-d2GFP and pHes5-             (mCherry-expressing) cells, GFP-positive cells were more
d2GFP, which were designed to express short half-life         mitotic (KI67-positive) than GFP-negative cells (Fig. 3A,
GFP (d2GFP) under the control of Hes1 and Hes5 pro-           B). This suggests that Hes1-promoter active cells tend to
moters, respectively (Ohtsuka et al., 2006). We per-          remain as proliferating GCPs in the oEGL compared with
formed in vivo electroporation (Owa et al., 2018;             the negative cells for that activity. In the same experiment,
Chang et al., 2019) with pHes1-d2GFP or pHes5-                we quantified the fluorescence intensity of GFP in each

May/June 2021, 8(3) ENEURO.0468-20.2021                                                                               eNeuro.org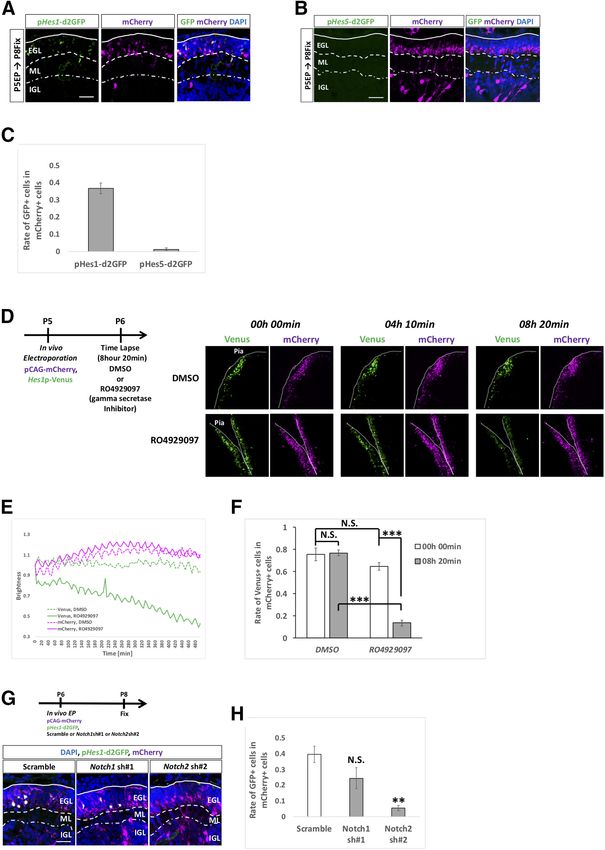
Research Article: Confirmation      7 of 18

Figure 2. Hes1 promoter activity in EGL is reduced by a g secretase inhibitor and Notch2 KD. A–C, To check the activities of Hes1
and Hes5 promoters, pHes1-d2GFP (A) and pHes5-d2GFP (B) were electroporated into P5 EGL with pCAG-mCherry vector. In the
EGL, only Hes1 promoter activities were detected (A–C). Rates of GFP-positive cells in mCherry1 cells were calculated (C). Animal
numbers: N = 7 for pHes1-d2GFP and N = 3 for pHes5-d2GFP. Scale bars: 30 mm (A, B). D–F, pHes1-Venus and pCAG-mCherry
were electroporated to P5 mouse, followed by slice culture at P6 (D). Time lapse images were taken for 8 h 20 min in the presence
of RO4929097 ( g secretase inhibitor) or control DMSO that were administered at the start of the time lapse. Decline of the Venus
brightness and rate of the Venus-positive cells in mCherry1 cells were observed only in the RO4929097 treated slices (D–F). Scale
bars: 80 mm (A). Data are shown as mean 6 SEM; ***p , 0.001, one-way ANOVA with Bonferroni’s post hoc test. Animal numbers:
N = 3 for DMSO and RO4929097. G, H, pHes1-d2GFP and pCAG-mCherry were electroporated with indicated KD vectors to P6 cer-
ebella, followed by fixation at P8. KD for Notch2 but not for Notch1 reduced the rates of GFP1 cells in mCherry1 cells. Animal num-
bers: N = 4 for Notch1 sh#1 and Notch2 sh#2. Scale bars: 30 mm (F). Data are shown as mean 6 SEM; **p , 0.01, Student’s t test.

May/June 2021, 8(3) ENEURO.0468-20.2021                                                                                     eNeuro.org
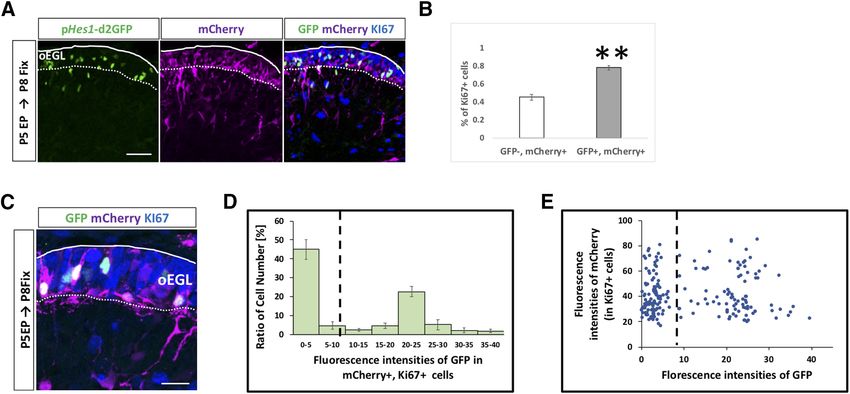
Research Article: Confirmation      8 of 18

Figure 3. GCPs are divided into two subgroups Notch signaling ON and OFF cells in vivo. A–E, Hes1 promoter activity was stronger
in GCPs than GCs (A, B). Heterogeneity was observed in Hes1 promoter activities among (KI67-positive) GCPs in the oEGL (C–E).
The dashed line represents the threshold of intensity visible by eye (D, E). Animal numbers: N = 3 for the analysis of B and N = 7 for
D,E. Scale bars: 45 mm (A) and 20 mm (C). Data are shown as mean 6 SEM; **p , 0.01, Student’s t test.

GCP (KI67-positive cell) in the oEGL (Fig. 3C–E).                    Notch2-positive and Notch2-negative GCPs have quite
Surprisingly, the fluorescence intensities for GFP exhib-            different molecular characteristics. We performed gene
ited a clear bimodal distribution (Fig. 3D,E), while those           set enrichment analysis (GSEA) to test for a potential en-
for control mCherry appeared unimodal (Fig. 3E). This                richment of Notch signaling in Notch2-positive and
suggests that GCPs in the oEGL comprise two types of                 Notch2-negative GCPs by comparing 656 DEG to the
cells, ON and OFF cells, for Notch2-Hes1 signaling.                  “REACTOME_SIGNALING_BY_NOTCH” gene set in the
   Next, we performed scRNA-seq on primary GCPs col-                 Molecular Signatures Database v7.1 (M10189, Signaling
lected from P7 cerebella using the Smart-seq technology.             by NOTCH). As a result, we found that highly expressed
From six independent batches, total 109 cells were suc-              genes in Notch2-positive/negative GCPs in our data
cessfully subjected to RNA-seq. We performed dimen-                  match to the upregulated/downregulated genes in Notch
sional compression of the obtained gene expression data              signaling ON cells, significantly (Fig. 4G). We then per-
into a two-dimensional matrix employing the Seurat soft-             formed GO analysis for these DEGs (Fig. 4H,I). Several of
ware and identified three clusters of single cells (Fig. 4A).        the significant GO categories for upregulated genes in
From the result, it was revealed that GCP and GC markers             Notch2-positive GCPs were related to cell cycle pro-
were highly expressed in the cluster 0 and 1/2 cells, re-            gression (Fig. 4H), while some GOs for upregulated
spectively (Fig. 4B,C). As we found that Notch signaling in          genes in Notch2 negative GCPs implicated cell differen-
GCPs is dependent on Notch2 (Fig. 2G,H), we investi-                 tiation events, including cell migration (Fig. 4I). These
gated Notch2 expression in the single cells. In the GCP              findings suggest that Notch-signaling ON GCPs are a
cluster (cluster 0), 29 cells were Notch2-positive, while 15         more proliferative and less differentiated population,
were negative (Fig. 4D). Although the expression of Jag1             while Notch signaling-OFF GCPs are less proliferative
and Hes1 was detected by quantitative RT-PCR in GCPs                 and more differentiated.
(Fig. 1B), their expression was found only in limited num-
ber of cells in this scRNA-seq analyses, probably because
of the limitation for detecting their transcripts under this         Notch2-Hes1-dependent Notch signaling maintains
experimental condition (Fig. 4E). We further classified the          GCPs in immature and proliferative state
GCPs cluster into two groups, Notch2-positive and                       We and others previously developed an in vivo electro-
Notch2-negative cells, which showed dramatically dis-                poration gene transfer method for GCPs during cerebellar
tinct expression profiles (Fig. 4F).                                 development (Owa et al., 2018; Chang et al., 2019). In this
   In the differential expression analysis using the DESeq2          study, we further characterized the dynamics of differen-
software (Love et al., 2014), we identified 656 DEG be-              tiation and migration processes of electroporated cells
tween Notch2-positive and Notch2-negative GCPs (Fig.                 (Fig. 5). The EGL was electroporated with a nuclear-local-
4F). Expression of 582 genes was upregulated in Notch2-              izing GFP (pCAG-H2B-GFP) at P5 and fixed at P6, P7, P8,
positive GCPs, while that of 74 genes was downregulated              P9, and P12 (Fig. 5A,B). By this method, GCPs facing the
(Fig. 4F). This clearly suggests that these two populations,         cerebellar surface, or the pia mater, were transfected with

May/June 2021, 8(3) ENEURO.0468-20.2021                                                                                       eNeuro.org
Research Article: Confirmation      9 of 18

Figure 4. GCPs are divided into two subgroups Notch signaling ON and OFF cells in silico. A, scRNA-seq (Smart-seq) analysis of
109 GCPs purified from P7 mice. Uniform manifold approximation and projection (UMAP) dimensional reduction were performed
and three clusters were identified (0,1,2). B, Heatmap for expression of GC-lineage markers (Pax6, Meis1), GCP markers (Pcna,
Ccnd2, Mki67, Sfrp1), and GC markers (Dcx, Rbfox3, Sema6a, Tubb3) in cells of distinct clusters. Molecular features of distinct
clusters suggested that cluster 0 corresponded to GCPs and cluster1 and 2 to GCs. C–E, Normalized expression of selected
genes are visualized onto the UMAP-dimension (C). Pcna (a marker for GCPs) are mostly expressed in Cluster 0, while Dcx (a
marker for GCs) is expressed in Cluster1,2. Notch2, Hes1, and Jag1 expressions are also shown (D, E). F, GCPs, which were
extracted from scRNA-seq of P7 mice (Cluster 0 cells), were grouped by Notch2 expression (positive and negative cells, please
also see Materials and Methods). Expression profiles of 656 DEG between Notch2-positive and Notch2-negative GCPs were vi-
sualized by the heatmap. Expression of 582 genes were upregulated in Notch2-positive GCPs, while that of 74 genes were
downregulated. G, GSEA of upregulated genes versus downregulated genes in Notch2-positive cells was performed with the
REACTOME_SIGNALING_BY_NOTCH dataset. NES, normalized enrichment score; FDR, false discovery rate. H, I, GO analysis
was performed for the 582 upregulated genes in Notch2-positive GCPs (H) and for 74 downregulated genes (I).

May/June 2021, 8(3) ENEURO.0468-20.2021                                                                                  eNeuro.org
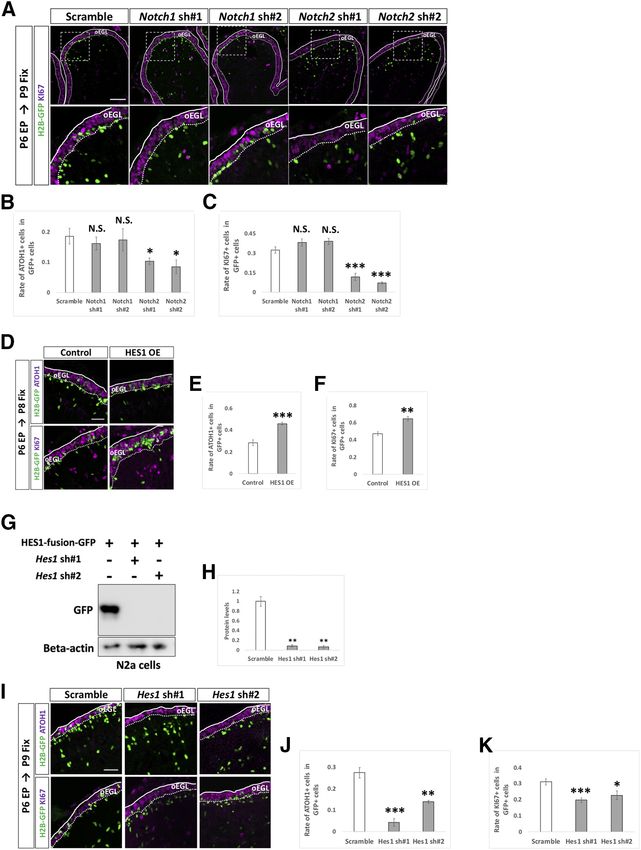
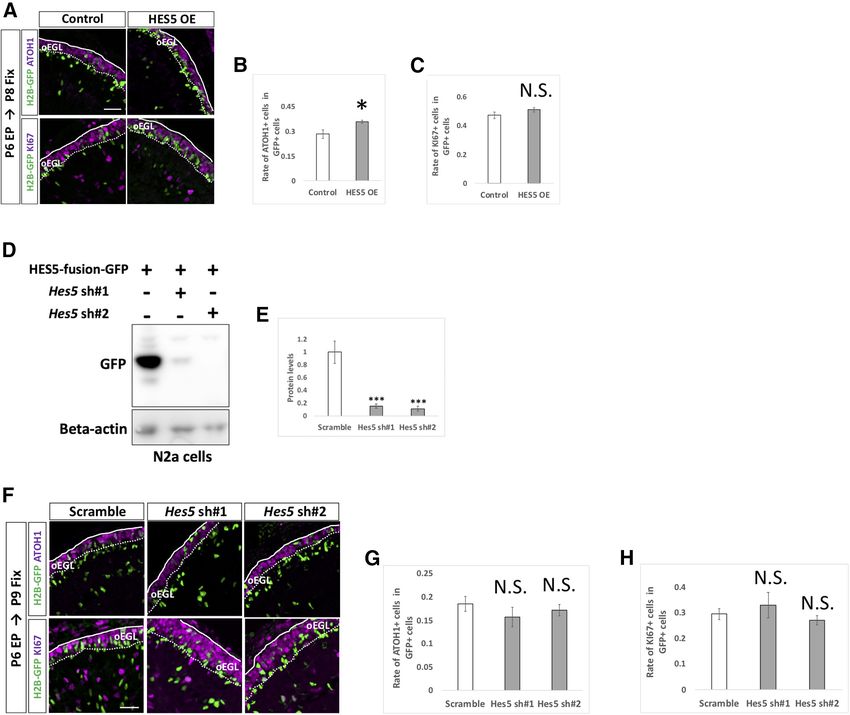
Research Article: Confirmation     10 of 18

Figure 5. Dynamics of electroporated cells in cerebellar development. A–F, pCAG-H2B-GFP was electroporated to P5 mouse EGL.
Electroporated mice were fixed at P6, P7, P8, P9, or P12 and subjected to further analyses (A, B). Since GC-lineage cells migrate
from EGL to IGL during their maturation (Schilling, 2018), we examined the rate of transfected cells in the EGL and distance of the
transfected cell position from the pial matter (C, D). We also checked the rates of ATOH1-positive (E) and KI67-positive (F) cells in
GFP-positive cells. Because plasmids were mainly introduced to Lobule IV/V or VI by electroporation in our experimental condition,
all analyses in this study were conducted in Lobule IV/V or VI. Scale bars: 80 mm (A) and 15 mm (B).

the expression vector and then examined as they mi-                 cerebella, which were fixed at P8 and P9, respectively.
grated inwardly as development proceeds (Fig. 5A–D).                While overexpression of HES1 increased ATOH1-posi-
The rate of ATOH1 or KI67-positive cells in electroporated          tive and KI67-positive cells, KD of Hes1 decreased
cells were gradually decreased (Fig. 5E,F), reflecting grad-        those cells, implicating that HES1 suppresses differ-
ual differentiation from GCPs to GCs.                               entiation from GCPs to GCs presumably in a cell au-
  By this method, we introduced KD vectors for                      tonomous manner. On the other hand, introduction of
Notch1 and Notch2 plus pCAG-H2B-GFP into the P6                     KD vectors for Hes5 did not affect the ATOH1 and KI67
cerebella and analyzed them at P9 by immunostaining                 positivity of GCPs (Fig. 7D–H). This suggests that
with KI67 and ATOH1, markers for GCPs (Fig. 6A–C).                  HES5 may not be involved in suppression of GCP dif-
Interestingly, KD for Notch2 significantly reduced the              ferentiation into GCs, consistent with our finding that
rates of ATOH1-positive cells as well as KI67-positive              Hes5 expression was very low compared with Hes1 in
cells, while KD for Notch1 did not show significant ef-             GCP-like cells (Fig. 1C). Interestingly, introduction of a
fects (Fig. 6B,C). This suggests that Notch2 but not                HES5 overexpression vector succeeded in suppress-
Notch1 is involved in suppressing differentiation of                ing differentiation of GCPs (Fig. 7A–C), similar to the
proliferative GCPs to postmitotic GCs putatively in a               effect of HES1. This led us to believe that, if overex-
cell autonomous manner. Next, we electroporated an                  pressed, HES5 has the ability to suppress GCP differ-
overexpression vector (Fig. 6D–F) or KD vectors (Fig.               entiation, probably via the same downstream pathway
6G–K) for Hes1 plus pCAG-H2B-GFP into the P6                        as that of HES1. However, as the expression of HES5

May/June 2021, 8(3) ENEURO.0468-20.2021                                                                                     eNeuro.org
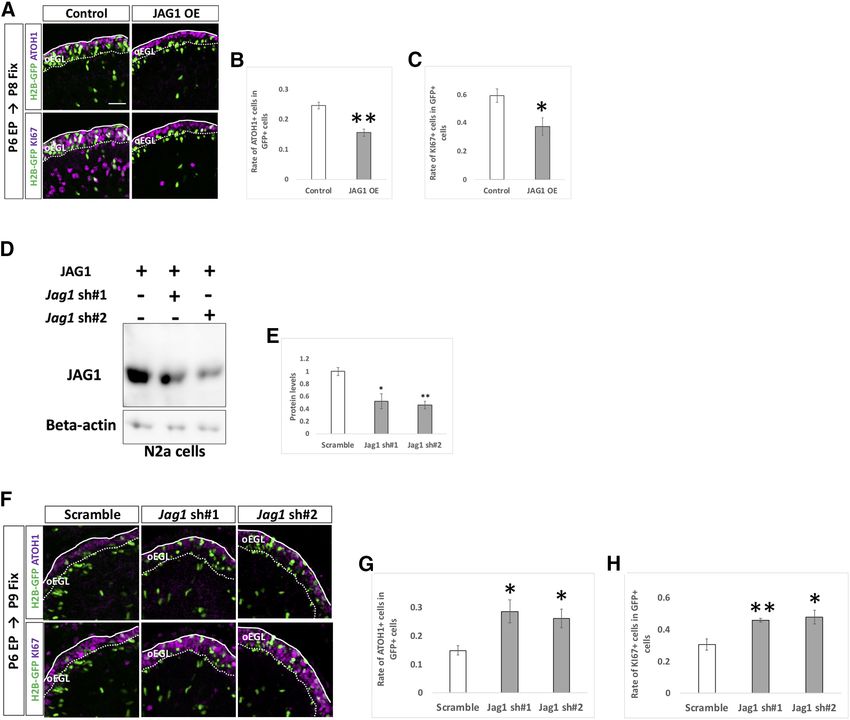
Research Article: Confirmation     11 of 18

Figure 6. NOTCH2 and HES1 tend to maintain GCPs in immature and proliferative state. A–C, Electroporation of Notch1,2 kDa vec-
tors plus pCAG-H2B-GFP into the EGL (A). Differentiation of electroporated cells were evaluated with the expression of ATOH1 and
KI67 (B, C). Animal numbers: N = 4 for pU6-Notch1,2-sh#1, N = 5 for pU6-Notch1,2-sh#2. Scale bars: 80 and 30 mm (A). D–K,
Electroporation with HES1 overexpression (OE) and KD vectors plus pCAG-H2B-GFP to the EGL. The rate of differentiation in elec-
troporated cells was analyzed by immunohistochemistry with ATOH1 and KI67 (E, F, J, K). The pCAG-empty vector (D–F) and the
scrambled shRNA vector (Scramble) were used as controls (I–K). KD vectors for Hes1 were checked the efficiency in vitro (G, H).
CAG-HES1-fusion-GFP were co-transfected with Hes1 KD vectors to Neuro2a cells and the protein level were checked by Western
blotting with GFP antibody (G, H). b -Actin was used as a reference. Animal numbers: N = 5 for (D–F), N = 4 for (I–K). Sample num-
bers: N = 3 for (G, H). Scale bars: 30 mm (D, I). Data are shown as mean 6 SEM; *p , 0.05, **p , 0.01, ***p , 0.001, Student’s t test.

in GCPs is very low, endogenous HES5 is unlikely to be in-           JAG1 cell non-autonomously upregulates Notch
volved in that process. Altogether, these findings suggest           signaling in surrounding GCPs
that Notch2-dependent and Hes1-dependent Notch signal-                 Among the ligands for Notch signaling, we found that
ing is involved in maintaining GCPs in a proliferative and im-       Jag1 was strongly expressed in GCP-like cells compared
mature state in the developing cerebellum.                           with Jag2, and Dll1,3,4 (Fig. 1C) and in the EGL (Fig. 1G).

May/June 2021, 8(3) ENEURO.0468-20.2021                                                                                      eNeuro.org
Research Article: Confirmation     12 of 18

Figure 7. Endogenous HES5 is not physiologically involved in the differentiation of GCPs. A–H, Overexpression (A–C) and KD (F–H)
vectors for HES5 plus pCAG-H2B-GFP were electroporated to P6 cerebella, followed by fixation at indicated stages. Samples were
immunostained with indicated antibodies and analyzed as in Figure 6E,F,J,K. The pCAG-empty vector (A–C) and Scramble (F–H)
were used as controls. KD vectors for Hes5 were checked the efficiency in vitro (D, E). CAG-HES5-fusion-GFP were co-transfected
with Hes5 KD vectors to Neuro2a cells and the protein level were checked by Western blotting with GFP antibody (D, E). b -Actin
was used as a reference. Animal numbers: N = 5 for pCAG-HES5 OE, N = 4 for pU6-Hes5-sh. Sample numbers: N = 3 for (D, E).
Scale bars: 30 mm (A, F). Data are shown as mean 6 SEM; *p , 0.05, Student’s t test.

Therefore, we performed overexpression and KD experi-            test whether JAG1 increases Notch-signaling activity in
ments for Jag1 with the same experimental strategy used          surrounding cells, we performed a “double electropora-
for Notch and Hes genes (Fig. 6). While overexpression of        tion” experiment. We first electroporated JAG1 overex-
JAG1 decreased rates of ATOH1 and KI67 positivity in the         pression or control vector plus pCAG-H2B-BFP (nuclear
transfected cells (Fig. 8A–C), KD of Jag1 led to the oppo-       localizing BFP) to P6 cerebella and performed the second
site results (Fig. 8D–H). This suggests that Jag1 acceler-       electroporation with pHes1-d2GFP plus pCAG-mCherry
ates differentiation of Jag1-expressing GCPs into GCs,           to the same cerebella at 6 h after the first electroporation.
thus exhibiting contrasting effects to those of Notch2 and       The animals were killed, and cerebella were fixed at P8.
Hes1.                                                            Under this experimental condition, some cells were singly
   It is known that, in many tissues, JAG1 acts as a ligand      transfected by the first or the second electroporation and
for Notch receptor proteins to increase Notch signaling in       some were doubly labeled by the both electroporations
surrounding cells (Gomi et al., 2016). In addition, we           (Fig. 9A). Among cells transfected by the second electro-
showed that Notch signaling activity can be monitored by         poration (mCherry1 cells), the rates of doubly electropo-
pHes1-d2GFP in GCPs (Figs. 2A,G, 3A,C). Therefore, to            rated cells (BFP-positive cells) were not significantly

May/June 2021, 8(3) ENEURO.0468-20.2021                                                                                  eNeuro.org
Research Article: Confirmation     13 of 18

Figure 8. JAG1 cell autonomously promotes differentiation of GCPs. A–H, Electroporation with overexpression (A–C) and KD (F–H)
vectors for JAG1 plus pCAG-H2B-GFP into the P6 EGL. Electroporated cells were estimated by immunostaining for ATOH1 and
KI67 at indicated developmental stages. The pCAG-empty vector (A–C) and Scramble (F–H) were used as controls. KD vectors for
Jag1 were checked the efficiency in vitro (D, E). CAG-JAG1 were co-transfected with Jag1 KD vectors to Neuro2a cells and the pro-
tein level were checked by Western blotting with JAG1 antibody (D, E). b -Actin was used as a reference. Animal numbers: N = 4 for
pCAG-JAG1 OE, pU6-Jag1-sh#1, n = 5 for pU6-Jag1-sh#2. Sample numbers: N = 3 for (D, E). Scale bars: 30 mm (A, F). Data are
shown as mean 6 SEM; *p , 0.05, **p , 0.01, Student’s t test.

different between the control and JAG1 introduced sam-            in GCPs of P5 mice with a simultaneous intraperitoneal in-
ples (Fig. 9C). We quantified GFP-positive cells in               jection of EdU and then fixed the samples at P8 for immu-
mCherry1 cells that had been transfected in the second            nostaining (Fig. 9D). In this experiment, EdU-positive/
electroporation but not in the first electroporation (BFP-        GFP-negative cells could be regarded as progeny cells of
negative). Interestingly, GFP-positivity among those cells        proliferative GCPs that had not been introduced with the
was increased when JAG1 was introduced at the first               Jag1 KD vector at P5. Furthermore, because GFP-posi-
electroporation (Fig. 9A,B). This suggests that the JAG1          tive cells were observed very densely in the electropo-
expression in GCPs increases Notch-signaling activity of          rated EGL area (Fig. 9D), most or many of EdU-positive/
surrounding GCPs.                                                 GFP-negative cells in the electroporated area are likely
   Next, to examine the cell non-autonomous effect by KD          offspring cells of non-transfected GCPs that had a con-
for Jag1, we designed an experiment that combined elec-           tact with Jag1 KD GCPs. As observed in Figure 8F–H,
troporation and EdU-incorporation techniques. We elec-            KI67-positive cells were also increased in Jag1 KD cells
troporated the KD vector for Jag1 plus pCAG-H2B-GFP               (GFP-positive cells) in this experiment (Fig. 9D,E). In

May/June 2021, 8(3) ENEURO.0468-20.2021                                                                                   eNeuro.org
Research Article: Confirmation     14 of 18

Figure 9. JAG1 cell non-autonomously upregulates Notch-signaling and suppresses differentiation of surrounding cells. A–C,
Double electroporations with a 6-h interval were performed to P6 EGL according to the indicated schedule. Rate of GFP1 cells in
mCherry1 cells was drastically increased in JAG1-overexpressed (OE) mice compared with control (A, B). Rates (20–30%) of the
co-electroporated cells (BFP1 cells in mCherry1 cells) were not significantly different in control and JAG1 OE (A, C). BFP-double
positive and mCherry-double positive co-electroporated cells were excluded in the analysis of Figure 5B. Animal numbers: N = 4.
Scale bars: 80 and 30 mm (A). D–F, Electroporation with indicated vectors and intraperitoneal administration of EdU were performed
in P5 mice, followed by fixation at P8. GFP1 cells were Jag1-downregulated cells and EdU1 GFP– cells were presumed neighbor-
ing cells. In the Jag1 KD mice, the rate of GCPs in the signal sending cells were increased (D, E). In contrast, differentiation of GCPs
was accelerated in Jag1 KD mice compared with control mice (D, F). Animal numbers: N = 4. Scale bars: 80 and 30 mm (D). Data are
shown as mean 6 SEM; **p , 0.01, ***p , 0.001, Student’s t test.

contrast, the rate of KI67-positive cells was decreased in            proliferative state via NOTCH2-HES1 pathway-dependent
EdU-positive/GFP-negative cells (Fig. 9D,F). This implies             Notch signaling (Fig. 10K).
that Jag1 KD promotes differentiation of surrounding
cells. Furthermore, together with the findings that                   Hes1 is involved in downregulating NEUROD1
JAG1 overexpression enhances Notch activity of sur-                   expression
rounding cells (Fig. 9A–C) and that Notch2-Hes1-de-                     It has been suggested that the transcription factor,
pendent Notch signaling keeps GCPs in an immature                     NEUROD1, is required for differentiation of GCs in the de-
and proliferative state, this suggests that JAG1-ex-                  veloping cerebellum (Pan et al., 2009). Consistent with
pressing GCPs may maintain surrounding GCPs in a                      this, in our experimental conditions, overexpression of

May/June 2021, 8(3) ENEURO.0468-20.2021                                                                                       eNeuro.org
Research Article: Confirmation     15 of 18

Figure 10. HES1 downregulates NEUROD1 in GCPs/GCs lineage. A–F, Overexpression and KD vectors plus pCAG-H2B-GFP were
electroporated to P6 cerebella, followed by fixation at indicated stages. Samples were immunostained with indicated antibodies
and analyzed as in Figure 3E,F,H,I. Animal numbers: n = 4 for pCAG-NEUROD1 OE, pU6-NeuroD1-sh#1,2. Scale bars: 30 mm (A, D).
Data are shown as mean 6 SEM; *p , 0.05, **p , 0.01, ***p , 0.001, Student’s t test. G, H, HES1-fusion-GFP was electroporated
into P6 EGL and cerebella fixed at P10 (G). The fluorescence intensities for NEUROD1 were estimated in transfected (GFP-positive)
cells (H). Animal numbers: N = 4. Scale bars: 30 and 10 mm (A). I, J, Hes1 KD and pCAG-H2B-GFP were co-electroporated into P6
EGL, followed by immunostaining at P9 (I). Immunofluorescence intensities for NEUROD1 were estimated (I, J). Animal numbers:
N = 4. Scale bars: 30 and 10 mm (A). Data are shown as mean 6 SEM; ***p , 0.001, Student’s t test. K, A schematic model for Notch
signaling in GCPs. In the oEGL of the developing cerebellum, there are two types of GCPs, Notch-signaling ON (signal receiving)
and OFF (signal sending) GCPs. JAG1 expressed on the signal-sending GCPs interacts with NOTCH2 on the signal-receiving
GCPs. This interaction induces cleavage of NICD by a g secretase to upregulate Hes1 expression in the signal-receiving GCPs.
HES1 suppresses expression of NEUROD1, eventually maintaining GCPs at immature and proliferative status. Signal-sending GCPs
express only a small amount of HES, resulting in expression of NEUROD1 and subsequent differentiation into GCs.

May/June 2021, 8(3) ENEURO.0468-20.2021                                                                                   eNeuro.org
Research Article: Confirmation     16 of 18

NEUROD1 significantly decreased ATOH1-positive cells            GCP/GC-related phenotypes were not assessed in those
and KI67-positive cells (Fig. 10A–C). Introduction of KD        reports. In cKO mice for Jag1 in the whole cerebellum,
vectors for NeuroD1 caused the opposite results to the          generated by crossing with an En2-Cre line, the position
overexpression experiment (Fig. 10D–F). These observa-          and morphology of BGs were also impaired. In those
tions confirmed that NEUROD1 is involved in promoting           mice, the EGL was abnormally retained until P20, be-
the differentiation of GCPs to GCs. To investigate the          cause of the aberrant GC migration (Weller et al., 2006).
relationship between Notch signaling and NEUROD1 ex-            However, since Jag1 is expressed in both BGs and
pression, we electroporated pCAG-HES1-fusion-GFP                GCPs/GCs, it was unclear whether Jag1 expression in
(HES1-GFP fusion protein) into GCPs at P6 and fixed the         BGs or GCPs/GCs were responsible for the phenotype. In
cerebella at P10. HES1-GFP overexpression reduced the           this study, by in vivo electroporation KD experiments, we
immunofluorescence signals for NEUROD1 in the EGL               clearly showed that Jag1 expression in GCPs is involved
(Fig. 10G,H). In contrast, Hes1 KD displayed the opposite       in GCP differentiation. Another group analyzed conven-
results (Fig. 10I,J). These observations suggest that Hes1      tional KO mice for Dner, a non-canonical ligand for Notch
maintains the proliferative and immature states of GCs via      signaling, expressed in Purkinje cells (PCs) as well as GCs
regulation of NEUROD1.                                          in the iEGL (Eiraku et al., 2002, 2005). In the mutant cere-
                                                                bellum, localization and morphology of BGs are impaired,
Discussion                                                      while GC migration was delayed. The authors suggest
   During cerebellar development, numerous GCPs,                that Notch signaling via DNER on PCs and NOTCH1 on
packed in the oEGL, seem to constitute a uniform popula-        BGs might be involved in BG differentiation, although
tion. However, the molecular regulatory machinery under-        there still remains the possibility that DNER expressed in
lying how maternal GCPs produce proportional numbers            GCs are responsible for the phenotype. In another in vitro
of sister GCPs and GCs has not been well understood. In         cell and explant culturing study, it was reported that overex-
this study, we found that there are two populations of          pression of NOTCH2 and HES1 suppressed process exten-
GCPs in the oEGL, Notch-signaling ON and OFF cells.             sion of GCs (Solecki et al., 2001). Although this data showed
The former possess more immature and proliferative              the ability of these molecules to affect GC differentiation, their
characteristics, while the latter have more differentiative     physiological requirement remained unknown because of the
and less proliferative features. Expression of JAG1 in          lack of loss of function experiments.
GCPs affects surrounding cells to become Notch-signal-             Despite these previous reports on Notch signaling mol-
ing ON cells via the Notch2-Hes1 pathway. HES1 de-              ecules, Notch activity has not been detected in postnatal
creases NEUROD1 expression in the ON-GCPs that                  cerebellar development. By monitoring promoter activ-
eventually differentiate into GCs.                              ities, we found the presence of Hes1-dependent, but not
   Several studies have reported that Notch-related tran-       Hes5-dependent, Notch signaling activity in GCPs of the
scripts and proteins are expressed in the postnatal cere-       oEGL. This is the first report to directly show the presence
bellum by means of RT-PCR (Solecki et al., 2001), in situ       of Notch signaling in the cerebellar EGL. Around half of
hybridization (Tanaka et al., 1999; Irvin et al., 2001, 2004;   GCPs are Notch-ON GCPs, while the others are Notch-
Solecki et al., 2001; Stump et al., 2002; Eiraku et al.,        OFF GCPs. In silico analyses suggested that the former
2005), and immunostaining (Tanaka and Marunouchi,               were more immature and proliferative, while the latter
2003). However, some of the data from these studies             possessed opposite features. KD and overexpression ex-
were contradictory. This might be caused by differences         periments by electroporation showed that NOTCH2 and
of experimental conditions and/or differences in the cell       HES1 are cell-autonomously required for Notch activity in
population purity. In this study, we aimed to distinctly in-    GCPs. On the other hand, JAG1 cell non-autonomously
vestigate the gene expression in GCPs and GCs with the          upregulates the Notch activities of surrounding GCPs.
hypothesis that Notch-related molecules might be differ-        Despite its expression in GCPs, NOTCH1 was not in-
entially expressed between the two cell types. We suc-          volved in the Hes1-dependent Notch signaling activity. It
cessfully purified GCP and GC-like cells (Kutscher et al.,      might be possible that NOTCH1 activates different down-
2020). By quantitative RT-PCR analyses as well as immu-         stream Hes-family genes, such as Hey.
nohistochemistry, our results suggest that Notch1,                 In early neural development, Hes1 is known to maintain
Notch2, Hes1, and Jag1 were prominently expressed in            stemness of mouse neural progenitor cells (NPCs) by sup-
GCPs, while Hes5, Jag2, and Dll1 were significantly ex-         pressing the expression of proneural genes, such as
pressed in GCs. This differential expression between            Ascl1 (Achaete-scute family bHLH transcription factor 1)
GCPs and GCs seems to partly explain the previous con-          and Ngn2 (Neurogenin 2; Kageyama et al., 2007). In
tradictory findings.                                            mouse ventral telencephalon NPCs, there is oscillating
   Several studies have previously reported phenotypes of       expression of bHLH transcriptional genes Hes1, Ascl1,
knock-out (KO) mice for Notch-related genes (Eiraku et          and Olig2 (Imayoshi et al., 2013). Once the fluctuation is
al., 2005; Weller et al., 2006; Komine et al., 2007; Hiraoka    lost and the expression of the genes are sustained, cell
et al., 2013) during postnatal cerebellar development.          fates are determined to be astrocytes, neurons or oligo-
Conditional KO (cKO) of Notch1, Notch2, RBPJ, or Dll in         dendrocytes (Imayoshi et al., 2013). This oscillation sys-
astroglial cell lineage with a GFAP-Cre line resulted in dis-   tem may enable creation of minor differences within a
organized positioning and morphology of Bergmann glia           uniform cell population, and eventually generate plural
(BG; Komine et al., 2007; Hiraoka et al., 2013), although       cell fates. Although we do not have any direct evidence, it

May/June 2021, 8(3) ENEURO.0468-20.2021                                                                                 eNeuro.org
Research Article: Confirmation 17 of 18
is possible that Notch signaling also fluctuates among EGF-like repeat-containing protein targeted to dendrites of devel-
cerebellar GCPs during development. However, even if oping and adult central nervous system neurons. J Biol Chem
this was the case, the transition from ON to OFF or OFF to 277:25400–25407.
Eiraku M, Tohgo A, Ono K, Kaneko M, Fujishima K, Hirano T,
ON might occur very quickly, as we can barely detect the Kengaku M (2005) DNER acts as a neuron-specific Notch ligand
transient state GCPs, or intermediate promoter activities during Bergmann glial development. Nat Neurosci 8:873–880.
for Hes1 as visualized by pHes1-d2GFP (Fig. 3D,E). In ad- Fan X, Mikolaenko I, Elhassan I, Ni XZ, Wang Y, Ball D, Brat DJ, Perry
dition, since Hes1 promoter activities were not detected A, Eberhart CG (2004) Notch1 and Notch2 have opposite effects
in mature GCs in the IGL, Notch signaling is thought to be on embryonal brain tumor growth. Cancer Res 64:7787–7793.
fixed in the OFF state after GC differentiation. Gomi K, Staudt MR, Salit J, Kaner RJ, Heldrich J, Rogalski AM,
Arbelaez V, Crystal RG, Walters MS (2016) JAG1-mediated Notch
The SHH subgroup of medulloblastoma, one of the
signaling regulates secretory cell differentiation of the human air-
major pediatric brain tumors, is known to be derived from way epithelium. Stem Cell Rev Rep 12:454–463.
the GC lineage, that is, GCPs/GCs (Goodrich et al., 1997). Goodrich LV, Milenkovic L, Higgins KM, Scott MP (1997) Altered
The Eberhart group previously showed that expression of neural cell fates and medulloblastoma in mouse patched mutants.
Notch2 but not Notch1 was upregulated in medulloblas- Science 277:1109–1113.
toma compared with normal pediatric cerebella, although Hiraoka Y, Komine O, Nagaoka M, Bai N, Hozumi K, Tanaka K (2013)
they did not discriminate between SHH and the other sub- Delta-like 1 regulates Bergmann glial monolayer formation during
groups (Fan et al., 2004). They also showed that Notch2 cerebellar development. Mol Brain 6:25.
Imayoshi I, Isomura A, Harima Y, Kawaguchi K, Kori H, Miyachi H,
and Hes1 are involved in the proliferation of medulloblas-
Fujiwara T, Ishidate F, Kageyama R (2013) Oscillatory control of
toma-derived cell line. These observations, at least in factors determining multipotency and fate in mouse neural pro-
part, seem to be consistent with our finding that the Jag1- genitors. Science 342:1203–1208.
Notch2-Hes1 pathway maintains GCPs in a proliferative Irvin DK, Zurcher SD, Nguyen T, Weinmaster G, Kornblum HI (2001)
state by upregulating Notch signaling. Therefore, this Expression patterns of Notch1, Notch2, and Notch3 suggest mul-
study may provide clues to understanding the mecha- tiple functional roles for the Notch-DSL signaling system during
nisms underlying tumorigenesis or growth of medulloblas- brain development. J Comp Neurol 436:167–181.
toma and to finding potential therapeutic vulnerabilities. Irvin DK, Nakano I, Paucar A, Kornblum HI (2004) Patterns of
Jagged1, Jagged2, delta-like 1 and delta-like 3 expression during
In this study, we first visualized Notch-signaling in late embryonic and postnatal brain development suggest multiple
GCPs. NOTCH2 and HES1 are involved in Notch-signal- functional roles in progenitors and differentiated cells. J Neurosci
ing to maintain GCPs in an immature and proliferative Res 75:330–343.
state in a cell autonomous manner. This system may gen- Kageyama R, Ohtsuka T, Kobayashi T (2007) The Hes gene family:
erate two distinct types of GCPs, NOTCH-ON and OFF, repressors and oscillators that orchestrate embryogenesis.
and contribute to production of an appropriate balance of Development 134:1243–1251.
Kawauchi T, Chihama K, Nabeshima Y, Hoshino M (2006) Cdk5
sister GCPs and GCs from mother GCPs, eventually lead-
phosphorylates and stabilizes p27kip1 contributing to actin orga-
ing to the formation of the normal cerebellum. We believe nization and cortical neuronal migration. Nat Cell Biol 8:17–26.
that this study gives insights into understanding the basic Kawauchi D, Robinson G, Uziel T, Gibson P, Rehg J, Gao C,
machinery to produce different cell types from a seem- Finkelstein D, Qu C, Pounds S, Ellison DW, Gilbertson RJ, Roussel
ingly uniform cell population in normal cerebellar develop- MF (2012) A mouse model of the most aggressive subgroup of
ment and also the pathology of medulloblastoma. human medulloblastoma. Cancer Cell 21:168–180.
Kohyama J, Tokunaga A, Fujita Y, Miyoshi H, Nagai T, Miyawaki A,
Nakao K, Matsuzaki Y, Okano H (2005) Visualization of spatiotem-
References poral activation of Notch signaling: live monitoring and signifi-
cance in neural development. Dev Biol 286:311–325.
Anders S, Pyl PT, Huber W (2015) HTSeq—a Python framework to Komine O, Nagaoka M, Watase K, Gutmann DH, Tanigaki K, Honjo
work with high-throughput sequencing data. Bioinformatics T, Radtke F, Saito T, Chiba S, Tanaka K (2007) The monolayer for-
31:166–169. mation of Bergmann glial cells is regulated by Notch/RBP-J signal-
Andersson ER, Sandberg R, Lendahl U (2011) Notch signaling: sim- ing. Dev Biol 311:238–250.
plicity in design, versatility in function. Development 138:3593– Kutscher LM, Okonechnikov K, Batora NV, Clark J, Silva PBG, Vouri
3612. M, van Rijn S, Sieber L, Statz B, Gearhart MD, Shiraishi R, Mack N,
Basson MA, Wingate RJ (2013) Congenital hypoplasia of the cerebel- Orr BA, Korshunov A, Gudenas BL, Smith KS, Mercier AL, Ayrault
lum: developmental causes and behavioral consequences. Front O, Hoshino M, Kool M, et al. (2020) Functional loss of a non-ca-
Neuroanat 7:29. nonical BCOR-PRC1.1 complex accelerates SHH-driven medullo-
Campos-Ortega J, Hartenstein AV (1985) The embryonic develop- blastoma formation. Genes Dev 34:1161–1176.
ment of Drosophila melanogaster. Berlin; Heidelberg: Springer. Lackey EP, Heck DH, Sillitoe RV (2018) Recent advances in under-
Chang CH, Zanini M, Shirvani H, Cheng JS, Yu H, Feng CH, Mercier standing the mechanisms of cerebellar granule cell development
AL, Hung SY, Forget A, Wang CH, Cigna SM, Lu IL, Chen WY, and function and their contribution to behavior. F1000Res 7:1142.
Leboucher S, Wang WJ, Ruat M, Spassky N, Tsai JW, Ayrault O Lehmann R, Jiménez F, Dietrich U, Campos-Ortega JA (1983) On the
(2019) Atoh1 controls primary cilia formation to allow for SHH-trig- phenotype and development of mutants of early neurogenesis in
gered granule neuron progenitor proliferation. Dev Cell 48:184– Drosophila melanogaster. Wilehm Roux Arch Dev Biol 192:62–74.
199.e5. Louvi A, Tsakonas SA (2006) Notch signaling in vertebrate neural de-
Chizhikov V, Millen KJ (2003) Development and malformations of the velopment. Nat Rev Neurosci 7:93–102.
cerebellum in mice. Mol Genet Metab 80:54–65. Love MI, Anders S, Huber W (2014) Differential analysis of count data
Dobin A, Davis CA, Schlesinger F, Drenkow J, Zaleski C, Jha S, – the DESeq2 package. Genome Biol 15:550.
Batut P, Chaisson M, Gingeras TR (2013) STAR: ultrafast universal Luistro L, He W, Smith M, Packman K, Vilenchik M, Carvajal D,
RNA-seq aligner. Bioinformatics 29:15–21. Roberts J, Cai J, B-Fessler W, Hilton H, Linn M, Flohr A, Røtne RJ,
Eiraku M, Hirata Y, Takeshima H, Hirano T, Kengaku M (2002) Delta/ Jacobsen H, Glenn K, Heimbrook D, Boylan JF (2009) Preclinical
Notch-like epidermal growth factor (EGF)-related receptor, a novel profile of a potent g -secretase inhibitor targeting Notch signaling
May/June 2021, 8(3) ENEURO.0468-20.2021 eNeuro.orgYou can also read