Genome-wide identification of GH3 genes in Brassica oleracea and identification of a promoter region for anther-specific expression of a GH3 gene ...
←
→
Page content transcription
If your browser does not render page correctly, please read the page content below
Jeong et al. BMC Genomics       (2021) 22:22
https://doi.org/10.1186/s12864-020-07345-9

 RESEARCH ARTICLE                                                                                                                                 Open Access

Genome-wide identification of GH3 genes
in Brassica oleracea and identification of a
promoter region for anther-specific
expression of a GH3 gene
Jiseong Jeong, Sunhee Park, Jeong Hui Im and Hankuil Yi*

  Abstract
  Background: The Gretchen Hagen 3 (GH3) genes encode acyl acid amido synthetases, many of which have been
  shown to modulate the amount of active plant hormones or their precursors. GH3 genes, especially Group III
  subgroup 6 GH3 genes, and their expression patterns in economically important B. oleracea var. oleracea have not
  been systematically identified.
  Results: As a first step to understand regulation and molecular functions of Group III subgroup 6 GH3 genes, 34
  GH3 genes including four subgroup 6 genes were identified in B. oleracea var. oleracea. Synteny found around
  subgroup 6 GH3 genes in B. oleracea var. oleracea and Arabidopsis thaliana indicated that these genes are
  evolutionarily related. Although expression of four subgroup 6 GH3 genes in B. oleracea var. oleracea is not induced
  by auxin, gibberellic acid, or jasmonic acid, the genes show different organ-dependent expression patterns. Among
  subgroup 6 GH3 genes in B. oleracea var. oleracea, only BoGH3.13–1 is expressed in anthers when microspores,
  polarized microspores, and bicellular pollens are present, similar to two out of four syntenic A. thaliana subgroup 6
  GH3 genes. Detailed analyses of promoter activities further showed that BoGH3.13–1 is expressed in tapetal cells
  and pollens in anther, and also expressed in leaf primordia and floral abscission zones.
  Conclusions: Sixty-two base pairs (bp) region (− 340 ~ − 279 bp upstream from start codon) and about 450 bp
  region (− 1489 to − 1017 bp) in BoGH3.13–1 promoter are important for expressions in anther and expressions in
  leaf primordia and floral abscission zones, respectively. The identified anther-specific promoter region can be used
  to develop male sterile transgenic Brassica plants.
  Keywords: Brassica oleraceea var. oleracea, TO1000, Gretchen Hagen 3, GH3, Anther, Promoter

* Correspondence: hankuil.yi@cnu.ac.kr
Department of Biological Sciences, College of Biological Science and
Biotechnology, Chungnam National University, Daejeon 34134, Republic of
Korea

                                      © The Author(s). 2021 Open Access This article is licensed under a Creative Commons Attribution 4.0 International License,
                                      which permits use, sharing, adaptation, distribution and reproduction in any medium or format, as long as you give
                                      appropriate credit to the original author(s) and the source, provide a link to the Creative Commons licence, and indicate if
                                      changes were made. The images or other third party material in this article are included in the article's Creative Commons
                                      licence, unless indicated otherwise in a credit line to the material. If material is not included in the article's Creative Commons
                                      licence and your intended use is not permitted by statutory regulation or exceeds the permitted use, you will need to obtain
                                      permission directly from the copyright holder. To view a copy of this licence, visit http://creativecommons.org/licenses/by/4.0/.
                                      The Creative Commons Public Domain Dedication waiver (http://creativecommons.org/publicdomain/zero/1.0/) applies to the
                                      data made available in this article, unless otherwise stated in a credit line to the data.
Jeong et al. BMC Genomics   (2021) 22:22                                                                      Page 2 of 14

Background                                                    [7, 10, 12, 22]. However, only Group I and II GH3 genes
The Gretchen Hagen 3 (GH3) gene was first identified in       have been identified in Gramineae genomes [23–25].
Glycine max (soybean) as an early response gene, which        Using GH3 enzymes in various plant species, preferential
is transcriptionally induced in less than 30 min by treat-    substrates of GH3 enzymes in terms of acyl acids and
ment of auxin plant hormone [1]. Later studies have           amino acids have been determined [8, 14, 18, 22, 26–
found that GH3 genes are found in diverse plant species       30]. In addition, a systematic evaluation of sixty GH3 en-
including mosses and fern, but not in two model algae,        zymes from Arabidopsis, grape, rice, Physcomitrella, and
Chlamydomonas reinhardtii or Volvox carteri [2–7].            Selaginella also revealed that not all the enzymes
Like acyl CoA synthetases, non-ribosomal peptide syn-         encoded by Group I GH3 genes are involved in JA sig-
thetases, and luciferases in ANL superfamily proteins,        naling and 12 out of 16 enzymes encoded by Group II
GH3 proteins conjugate combinations of amino acids            GH3 genes display clear substrate preferences for IAA
and acyl acids in two-step reactions [8, 9]. In the first     among three acyl acid substrates - jasmonate, IAA, and
half-reaction involving ATP and acyl acid, adenylated         4 hydroxybenzoate (4-HBA) [31]. In case of Group III
acyl acid is produced and pyrophosphate is released. In       GH3 enzymes, which are encoded by the largest GH3
the second half-reaction, adenylated acyl acid intermedi-     group in the plant genomes, no clear substrate prefer-
ate reacts with amino acids, resulting in the release of      ences were established, except AtGH3.9 or OsGH3.13
acyl acid-amino acid amido conjugate and adenosine            for IAA and Arabidopsis PBS3 for 4-HBA. In case of
monophosphate. For example, Arabidopsis thaliana              Group III subgroup 6 GH3s, only AtGH3.15 in Arabi-
(Arabidopsis) GH3.11, jasmonate (JA) resistant 1 (JAR1),      dopsis was shown to have substrate preference for indole
and Arabidopsis GH3.17, reversal of sav 2 (VAS2),             butyric acid (IBA), the auxin precursor [28]. Although
catalyze the production of JA-isoleucine and indole           decrease in IBA-mediated root elongation inhibition and
acetic acid (IAA)–glutamate, respectively [10, 11].           lateral root formation were observed in transgenic plants
  GH3 proteins are involved in various developmental          constitutively expressing AtGH3.15, in vivo function(s)
processes and environmental responses in plants, by           of other subgroup 6 GH3 genes have yet to be deter-
modulating the activities or availabilities of plant hor-     mined. In rapeseed (Brassica napus) and its diploid an-
mones and related compounds, including precursors of          cestors, Chinese cabbage (Brassica rapa) and cabbage
plant hormones [12]. Abnormal expressions caused by           (Brassica oleracea var. capitata), up to sixty-six GH3-
null mutation or hyper- and mis-expression lead to vari-      coding genes have been identified [32, 33]. However, de-
ous phenotypic defects. In Arabidopsis, atgh3.11 (jar1)       tailed study of GH3-coding genes in kale-type Brassica
mutant does not produce bioactive JA-Isoleucine and           species (Brassica oleracea var. oleracea), TO1000, which
defective in JA signaling, while atgh3.17 (vas2) mutant       serves as an excellent model for important vegetable
over-accumulates free IAA at the expense of IAA-              crops in Brassica oleracea with various morphological
glutamate [11, 13]. In addition, atgh3.12 (avrPphB sus-       and phytochemical traits [34], have not been performed
ceptible 3 (pbs3)) mutant was found to be more suscep-        yet.
tible to bacterial pathogens because production of               The anther is a part of the stamen, the male repro-
isochorismoyl glutamate, the precursor of salicylic acid      ductive organ in plants, and is connected to the flower
(SA), catalyzed by PBS3, is compromised [14]. Over-           receptacle by a filament, which is the other part of the
expression of AtGH3.6 (Dwarf in Light 1 (DFL1)) or            stamen [35, 36]. Anther development is divided into two
AtGH3.2 (Yadokari 1 (YDK1)), which are induced by             phases, culminating in the release of pollen grains, the
auxin, causes hyper-sensitivity to light treatment leading    male gametophytes in plants. Microsporogenesis, the
to dwarfism [15, 16]. Over-expression of AtGH3.5              first phase, includes establishment of anther morph-
(WES1), which is induced by treatment of abscisic acid        ology, cell and tissue differentiation, and meiosis of
and SA, as well as auxin, leads to auxin resistant pheno-     microspore mother cells. Tetrads of haploid microspores
types [17]. In various plants, important roles played by      produced by meiotic divisions of diploid pollen mother
plant GH3 enzymes have also been demonstrated: nod-           cells are released as distinct unicellular microspores into
ule numbers and sizes in soybean [18], resistance to          locules by a mixture of enzymes produced from tapetum
Xanthomonas bacteria in citrus [19], drought and salt         cells, which also provide nutrients and pollen wall mate-
tolerance in cotton [20], and fruit softening in kiwi [21],   rials for developing pollens [37, 38]. During microgame-
were shown to be affected by GH3 gene expressions.            togenesis, the second phase, differentiation of
  Phylogenetic analyses show that plant GH3 genes can         microspores into pollen grains and tissue degeneration
be clustered into 3 groups (GroupI~ III) based on overall     occur for the release of pollens. Microgametogenesis
amino acid sequences or 8 subgroups (subgroup 1 ~ 8)          starts with the expansion of the microspore, which is
based on acyl acid-binding site sequences of Arabidopsis,     often found with the formation of one large vacuole
rice, soybean, maize, Selaginella, and moss GH3 proteins      [39]. This involves movement of the microspore nucleus
Jeong et al. BMC Genomics   (2021) 22:22                                                                     Page 3 of 14

from the center of the cell to a position close to the cell   showing different protein sequences between two data-
wall, where the microspore produces two unequal cells,        bases, such as BoGH3.12–2 and BoGH3.17–1, NCBI
a large vegetative cell and a small generative cell, in a     protein models were adopted in our study because they
process called pollen mitosis (PM) I. Then, the genera-       are supported by RNA-seq data in NCBI. While 34 GH3
tive cell, which is spatially separated from the pollen       protein-coding genes were identified from B. oleracea
grain wall and engulfed by the vegetative cell, undergoes     var. oleracea in our study, 25 and 29 GH3 protein-
another round of cell division, called PM II [37]. De-        coding genes were previously reported for cabbage-type
pending on whether PM II happens before or after              B. oleracea var. capitata in the comparison with B.
pollen dispersal from the anther, the pollens are called      napus genes by two independent studies, respectively
tricellular or bicellular pollen [40]. Plant hormones - JA,   [32, 33].
auxin, gibberellic acid (GA), and ethylene – are known          Similar to previous phylogenetic analyses of GH3 pro-
to play important roles in stamen maturation, locule          teins including cabbage-type B. oleracea var. capitata,
opening, anther dehiscence, and pollen viability during       phylogenetic clustering of Arabidopsis and BoGH3 pro-
stamen and pollen development [35, 41–43].                    teins demonstrated that BoGH3 proteins can be divided
   To expand our knowledge on the regulation and mo-          into three groups (Group I, II, and III) (Fig. 1a) [6, 10,
lecular functions of Group III GH3 genes in plants – es-      32, 33]. It was found that Group I consists of two Arabi-
pecially those in subgroup 6 whose functions are still        dopsis and four BoGH3 proteins, while Group II consists
elusive – GH3 genes in kale-type B. oleracea var. olera-      of eight Arabidopsis and 11 BoGH3 proteins. In the case
cea were identified genome-wide, and expression pat-          of Group III, nine Arabidopsis GH3s and 19 BoGH3
terns of subgroup 6 GH3 genes were investigated. It was       proteins were clustered together. In general, exon/intron
found that subgroup 6 GH3 genes in B. oleracea var.           structures of BoGH3 genes were same to closely related
oleracea, composed of four genes showing synteny with         counterparts in Arabidopsis with some exceptions
closely related Arabidopsis subgroup 6 GH3 genes, are         (Fig. 1b). For example, four protein-coding exons were
not induced by auxin, GA, and JA treatment, but have          detected for BoGH3.1 in Group II, based on the distribu-
different organ expression patterns. BoGH3.13–1, a sub-       tion of RNA-seq reads in NCBI database, while three
group 6 GH3 gene, is specifically expressed in tapetal        protein-coding exons of AtGH3.1 is reported in TAIR
cells in anther and pollens when microspores, polarized       JBrowse (https://jbrowse.arabidopsis.org/). In case of
microspores, and bicellular pollens are produced, as well     BoGH3.11–2 and BoGH3.11–3, which are closely related
as in leaf primordia and floral abscission zones. Pro-        to AtGH3.11 (JAR1) with four protein-coding exons,
moter bash experiments revealed that a 62 base pairs          only three exons supported by RNA-seq reads were ob-
(bp) DNA sequence, − 340 to − 279 bp upstream of              served. Structural differences were also observed for five
BoGH3.13–1 start codon, is required for anther-specific       BoGH3 genes (BoGH3.8–2, BoGH3.8–5, BoGH3.13–3,
expression, while a ~ 450 bp region (− 1489 to − 1017) is     BoGH3.18–1, and BoGH3.18–7) that were identified only
necessary for expression in leaf primordia and floral ab-     in Ensembl Plants.
scission zones.
                                                              Synteny is observed for group III subgroup 6 GH3 genes
Results                                                       between Arabidopsis and B. oleracea var. oleracea
Thirty-four GH3-encoding genes (BoGH3s) are present in        In B. oleracea var. oleracea, 4 out of 34 Group III
B. oleracea var. oleracea                                     BoGH3        proteins   (BoGH3.13–1,     BoGH3.13–2,
In the Ensembl Plants database (http://plants.ensembl.        BoGH3.13–3, and BoGH3.13–4) show a close relation-
org/index.html), protein sequences of 55 GH3 candidate        ship with Arabidopsis subgroup 6 GH3 proteins (Fig. 1a).
genes in kale-type B. oleracea showed similarities to the     While the four BoGH3 genes are found on different
19 Arabidopsis GH3 proteins [10]. Among these, 34             chromosomes, four Arabidopsis GH3 genes (AtGH3.13,
GH3 proteins were found to have intact GH3 domains            AtGH3.14, AtGH3.15, and AtGH3.16) in the same sub-
(pfam03321) and considered as GH3 proteins (Table S1;         group are located within 15,000 bp genomic region on
Figure S1). Although identical genomic sequences were         Arabidopsis chromosome 5 (Fig. 2a). When genes lo-
used for annotation, only 30 B. oleracea GH3 candidate        cated around Arabidopsis and B. oleracea var. oleracea
proteins, including two with truncations in GH3 do-           subgroup 6 GH3 genes were compared, syntenies were
mains, were found to have significant similarities to Ara-    detected around the AtGH3.13 ~ AtGH3.16 cluster and
bidopsis GH3s in NCBI database (NCBI, http://ncbi.nlm.        three BoGH3 genes (BoGH3.13–1, BoGH3.13–2, and
nih.gov) [34]. The 34 BoGH3 proteins with the intact          BoGH3.13–4) (Fig. 2 b-d). In the upstream of three
GH3 domains in Ensembl Plants database include all 28         BoGH3 genes, Bo2g011200 (Fig. 2b), Bo3g009120
putative GH3 proteins with the intact GH3 domains             (Fig. 2c), and Bo9g167820 (Fig. 2d) showing sequence
identified in NCBI database (Table S1). For proteins          similarities to At5g13330, an RAP2.6 L transcription
Jeong et al. BMC Genomics (2021) 22:22 Page 4 of 14
Fig. 1 Phylogenetic relationships and exon/intron structures of GH3 proteins in Arabidopsis and B. oleracea var. oleracea. a Phylogenetic analysis
of GH3 family members in Arabidopsis and B. oleracea var. oleracea. The percentage of trees in which the associated taxa clustered together is
shown next to the branches. The phylogenetic tree is drawn to scale, with branch lengths measured in the number of substitutions per site.
Bootstrap test percentages of 1000 replicates are shown next to the branches. b Gene structures for Arabidopsis and BoGH3 proteins were
generated by gene structure display servers (http://gsds.cbi.pku.edu.cn/Gsds_about.php). Note that exons indicated here do not contain
untranslated regions. Astertisks indicate exon/intron structures of genes, which were annotated only in Ensembl Plants. The black boxes and lines
represent exons and introns in B. oleracea var. oleracea GH3 genes, while the gray boxes and lines represent exons and introns in Arabidopsis GH3
genes. Groups (I~ III) and subgroups (4 & 6) of GH3 proteins were designated based on the Staswick et al. (2002) and Westfall et al. (2012),
respectively [10, 12]
factor found upstream of the AtGH3.13 ~ AtGH3.16 that 15 more BoGH3 genes have syntenic relationships
cluster, were identified (Fig. 2a). Moreover, BoGH3.12–1, with AtGH3 genes (Fig. 2e).
BoGH3.12–2, and BoGH3.12–3, which are clustered with
AtGH3.12 (PBS3) in the phyologenetic tree as Group III Subgroup 6 BoGH3 genes are not induced by auxin
subgroup 4 GH3 genes, were also found further up- treatment in the seedling stage
stream, same to AtGH3.12 (PBS3) located upstream of In Arabidopsis, auxin treatment can induce transcription
the AtGH3.13 ~ AtGH3.16 cluster. Consistent with the of some GH3 genes, such as AtGH3.2 (YDK1), AtGH3.5
syntenic relationships in these genomic regions, se- (WES1), and AtGH3.6 (DFL1) [15–17]. However, expres-
quence similarities were also observed downstream of sion conditions and functions of GH3 genes in other
the Arabidopsis GH3 cluster and the three BoGH3 genes plants are largely unknown. To gain insights on the ex-
on different chromosomes (Fig. 2b–d): Bo2g011240 and pression patterns and functions of four B. oleracea var.
Bo9g166790 show sequence similarity to At5g13390, No oleracea subgroup 6 GH3 identified in this study, we de-
Exine Formation 1. In addition to six subgroup 4 and termined whether these genes can be induced by plant
subgroup 6 BoGH3 genes showing synteny (Fig. 2b – hormones and found that none of subgroup 6 BoGH3
2D), analyses for remaining 28 BoGH3 genes revealed genes were significantly induced by auxin (synthetic 2,4-
Dichlorophenoxy acetic acid (2,4-D) or natural IAA),Jeong et al. BMC Genomics (2021) 22:22 Page 5 of 14
Fig. 2 Syntenies are found between genomic regions around Arabidopsis AtGH3.13 and corresponding regions in B. oleracea var. oleracea. Each
panel shows gene organization, in which GH3 and non-GH3 genes from start to stop codons are indicated by black and gray arrows, respectively.
Direction of each arrow shows that of gene transcription. a The gene organization on Arabidopsis chromosome 5 around AtGH3.12. b-d The gene
organizations of B. oleracea var. oleracea chromosome 2 near BoGH3.12–1, chromosome 3 near BoGH3.12–2, and chromosome 9 near BoGH3.12–4.
Arabidopsis genes showing sequence similarities to BoGH3 genes are indicated in parenthesis below B. oleracea var. oleracea gene names. The
BoGH3 genes similar to Arabidopsis AtGH3.13 ~ AtGH3.16 gene cluster are indicated with sharp (#) symbols. Bo2g011230 in (B) encodes a
truncated protein with a sequence similarity to Arabidopsis GH3 genes in the cluster. e Syntenic relationships detected between other BoGH3
genes in B. oleracea var. oleracea and Arabidopsis
GA or JA treatment at the seedling stage, except open flowers. For the other three subgroup 6 BoGH3
BoGH3.13–2 that is weakly induced by JA (Fig. 3). One genes, the strongest expression was commonly found in
of subgroup 4 BoGH3 gene, BoGH3.12–1, also did not siliques (Fig. 4 b-d), while comparable expressions in
show expression changes responding to hormone treat- floral bud and open flower were also observed for
ments. In contrast, transcriptional inductions by auxin BoGH3.13–2 (Fig. 4b). For auxin-inducible BoGH3.2 and
were evident for BoGH3 genes included as positive con- BoGH3.5–1, which were included as comparison, distinct
trols (BoGH3.2 and BoGH3.5–1), which are closely re- relative expression patterns were detected: BoGH3.2 and
lated auxin-inducible Arabidopsis GH3 genes [16, 17]. BoGH3.5–1 were found to be most strongly expressed in
root and floral bud, respectively (Fig. 4 e & f). For three
BoGH3.13–1 is strongly expressed in stamen at a specific subgroup 4 BoGH3 genes, stronger expressions were
stage during flower development commonly observed in roots (Figure S2).
For four subgroup 6 and two auxin-inducible GH3 genes For BoGH3.13–1 and BoGH3.5–1, which show strong
in B. oleracea var. oleracea, relative expression patterns preferential expressions in floral bud (Fig. 4 a & f), it
in six different organs - root, leaf, stem, floral bud, was also determined whether expressions of these genes
opened flower, and silique - were determined. Among are temporally regulated during floral bud development.
four subgroup 6 BoGH3 genes, BoGH3.13–1 was found When the expression levels were monitored for develop-
to be most strongly expressed in floral bud, although ing floral buds sorted by lengths (Figure S3), which re-
significant expression was also observed in silique com- flect the progress of flower development [44], both
pared to that in leaf (Fig. 4a). Only negligible expressions genes showed stronger expression when bud lengths are
of BoGH3.13–1 were detected in other organs, including about 2 to 6 mm, although BoGH3.13–1 in subgroup 6Jeong et al. BMC Genomics (2021) 22:22 Page 6 of 14 Fig. 3 Subgroup 6 BoGH3 genes are not induced by auxin at the seedling stage. Relative expression levels of four subgroup 6 BoGH3 genes and three selected GH3 genes in other subgroups in response to treatments of 5 μM 2,4-D (a), 1 μM IAA (b), 1 μM GA (c), and 1 μM JA (d) were determined by qRT-PCR experiment with Actin control. The expression level of mock condition was set to value 1 and used as reference to compare expression level changes after hormone treatments. Bar graphs show average relative expression values with standard errors (SE). Averages values of two independent results for 2,4-D or JA treatments are shown, while representative results are shown for IAA or GA treatments. Bar graphs for genes without any significant amplification are not included Fig. 4 qRT-PCR results showing expression patterns of selected BoGH3 genes, including four subgroup 6 BoGH3 genes. Relative expression levels of BoGH3.13–1 (a), BoGH3.13–2 (b), BoGH3.13–3 (c), BoGH3.13–4 (d), BoGH3.2 (e), and BoGH3.5–1 (f) were determined by qRT-PCR experiment with Actin control in different organs and/or developmental stages. Bar graphs show average relative expression values with SEs. The expression level of leaf was set to value 1 and used as reference to compare expression levels in different organs
Jeong et al. BMC Genomics (2021) 22:22 Page 7 of 14
GH3 showed more dramatic expression changes by de- floral organ abscission regions of petals, sepals, and sta-
velopmental progress than BoGH3.5–1 (Fig. 5 a & b). In mens (Fig. 6 i & j). In addition, GUS expression was de-
4 ~ 6 mm-long floral buds, where the two genes are tected in leaf primordia of BoGH3.13–1 (− 1489 ~ − 1)::
most strongly expressed, almost exclusive expression GUS seedlings (Fig. 6 k & l). In BoGH3.5–1 (− 1496 ~ −
was detected in stamen among sepal, petal, stamen, and 1)::GUS, GUS expression was detected in developing an-
pistils (Fig. 5 d & e). In contrast, no significant develop- thers and unfertilized ovule or aborted seeds (Fig. 6m-q),
mental and organ-specific expression differences were but not in seedling leaf primordia (Fig. 6r). To further
observed for BoGH3.13–2, another subgroup 6 BoGH3 define the spatial expression patterns of BoGH3.13–1
that are constitutively expressed in floral buds, open and BoGH3.5–1 in anther, cross-sectioned floral buds
flowers, and siliques (Figs. 4b, 5c & f). were examined and specific expression in tapetum cells
and pollen grains were detected for both genes (Fig. 6u-
BoGH3.13–1 and BoGH3.5–1 are expressed in tapetum x). In BoGH3.13–1 (− 1489 ~ − 1)::GUS, GUS staining
and pollen grains seems to appear in the tapetum first and pollens later
To narrow down spatial expression patterns of stamen- (Fig. 6u & v).
expressed BoGH3.13–1 and BoGH3.5–1, we generated
transgenic plants, in which GUS (β-glucuronidase) re- BoGH3.13–1 and BoGH3.5–1 are most strongly expressed
porter genes are expressed under the control of about around when polarized microspores are generated
1500 bp putative promoter sequences of these BoGH3 To investigate which milestone events in microsprogen-
genes. BoGH3.13–1 (− 1489 ~ − 1)::GUS and BoGH3.5–1 esis or microgametogenesis occur in pollens when
(− 1496 ~ − 1)::GUS are two transgenic plants, in which BoGH3.13–1 and BoGH3.5–1 are expressed (Fig. 5), de-
− 1489 ~ − 1 and − 1496 ~ − 1 bp DNA sequences veloping pollens were collected from floral buds and
upstream of BoGH3.13–1 and BoGH3.5–1 start codon, open flowers. Based on the numbers and organization of
respectively, are fused to GUS reporter genes. In 4′,6-diamidino-2-phenylindole (DAPI)-stained nuclei, it
BoGH3.13–1 (− 1489 ~ − 1)::GUS, GUS expression was was found that tetrads and microspores are observed in
observed in anthers of developing floral buds (Fig. 6 f & less than 2 mm floral buds (Fig. 7 a & d), in which the
g), consistent with the qRT-PCR (quantitative reverse two anther-expressed GH3 genes, BoGH3.13–1 and
transcription polymerase chain reaction) results (Figs. 4 BoGH3.5–1, are weakly expressed (Fig. 5). In 2 ~ 6 mm
& 5). Weak GUS stainings in some stigmas were found floral buds, in which the two anther-expressed GH3
to be caused by stigma-attached pollens (Fig. 6h). GUS genes are most strongly expressed, microspores, polar-
staining was also observed in siliques, but only in the ized microspores, and bicellular pollens were observed
Fig. 5 BoGH3.13–1 and BoGH3.5–1 are strongly expressed in anther. Steady-state expression levels of BoGH3.13–1 (a), BoGH3.5–1 (b), and
BoGH3.13–2 (c) in developing floral buds and those of BoGH3.13–1 (d), BoGH3.5–1 (e), and BoGH3.13–2 (f) in sepal, petal, stamen, and pistil of 4 ~
6 mm floral buds were determined with qRT-PCR. Bar graphs show average relative expression values with SEs. The expression level of 0 ~ 2 mm
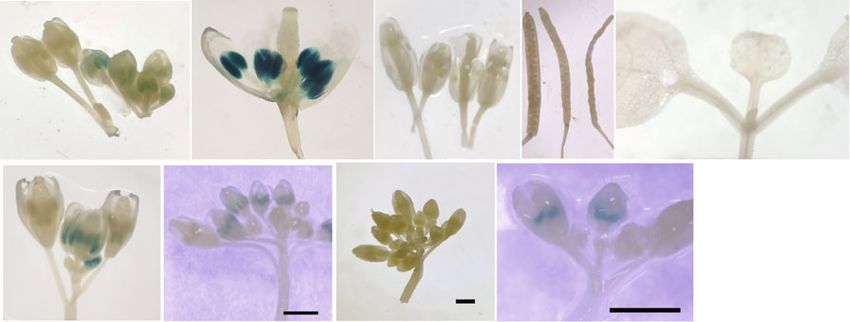
buds (a-c) and that of sepal (d-e), which were normalized to that of ACTIN, were set to value 1 and used as referenceJeong et al. BMC Genomics (2021) 22:22 Page 8 of 14 Fig. 6 GUS staining patterns in Arabidopsis transgenic plants with two BoGH3 promoter::GUS transgene. a-e Samples from wild-type Arabidopsis plants (WT) - floral buds (a), a dissected floral bud (b), open flowers (c), siliques (d), and 8-day old seedling (e). f-l Samples from BoGH3.13–1 (− 1489 ~ − 1)::GUS transgenic plants - floral buds (f), a dissected floral bud (g), open flowers (h), siliques (i-j), and 8-day old seedling (k-l). m-r Samples from BoGH3.5–1 (− 1496 ~ − 1)::GUS transgenic - floral buds (m), a dissected floral bud (n), open flowers (o), siliques (p-q), and 8-day old seedling (r). Transverse sections of GUS-stained floral buds of WT plants (s-t). Transverse sections of GUS-stained floral buds of BoGH3.13–1 (− 1489 ~ − 1)::GUS (u-w). Transverse sections of GUS-stained floral buds of BoGH3.5–1 (− 1496 ~ − 1)::GUS (x). Dividends and denominators of fractions in the pictures are transgenic plants with the GUS staining and all the transgenic plants examined, respectively. Arrows indicate GUS stained parts. Scale bars in (a-r): 1 mm. Scale bars in (s-x): 20 μm Fig. 7 DAPI-stained developing pollen grains in B. oleracea var. oleracea floral buds. Bright-field images of pollens in less than 2 mm floral buds (a), 2 ~ 4 mm buds (b), 4 ~ 6 mm buds (c), 6 ~ 8 mm buds (g), 8 ~ 10 mm buds (h), and open flowers (i). Fluorescence images of DAPI-stained pollens in less than 2 mm floral buds (d), 2 ~ 4 mm buds (e), 4 ~ 6 mm buds (f), 6 ~ 8 mm buds (j), 8 ~ 10 mm buds (k), and open flowers (l). Scale bar: 20 μm
Jeong et al. BMC Genomics         (2021) 22:22                                                                             Page 9 of 14

(Fig. 7b-c & e-f). While bicellular and tricellular pollens                  sequence is important for anther-specific expression of
were observed in 6 ~ 8 mm buds, only tricellular pollens                     BoGH3.13–1 (Fig. 8 i & j).
were observed in 8 ~ 10 mm buds and opened flowers
(Fig. 7g- l). These data show that BoGH3.13–1 and                            Discussion
BoGH3.5–1 are strongly induced when polarized micro-                         Thirty-four GH3-coding genes of kale-type B. oleracea
spores are mainly produced during early microgameto-                         var. oleracea, which have intact GH3 domains, were
genesis [45, 46].                                                            identified from Ensembl plants database (Fig. 1a).
                                                                             Among these, 28 gene models were also found in NCBI
                                                                             database, which had used the identical genomic se-
One hundred eighty-six bp region upstream of                                 quence for annotation [34]. The discrepancy in BoGH3
BoGH3.13–1 is sufficient for anther-specific expression                      gene numbers between Ensembl plants and NCBI data-
DNA sequences responsible for tissue-specific expres-                        base may result from the use of different gene prediction
sion of BoGH3.13–1 was investigated with different                           algorithms or validations. Recently, twenty-nine GH3
DNA regions upstream of the start codon (Fig. 8a).                           protein-coding gene models related to cabbage-type B.
When P1, in which − 1017 ~ − 1 bp region was fused                           oleracea var. capitata GH3 genes were identified from
upstream of GUS reporter gene, was used to generate P1                       the investigation of genomic sequence of B. napus [32,
transgenic plants, GUS expressions in anthers and                            33], and twenty-eight genes were found to have intact
pollens were still detected (Fig. 8b-d), but those in floral                 GH3 domains and meet our criteria, while Bol042635
abscission zones and leaf primordia were lost, except                        was found to encode a truncated GH3 domain with only
one case showing GUS staining in the floral abscission                       224 amino acids (Table S2) [33]. Among 34 BoGH3
zone (Fig. 8 e & f). When P2 (− 418 ~ − 1) and P3 (− 340                     coding-genes reported in this study, putative orthologs
~ − 155), without − 155 ~ − 1 bp putative 5′ untranslated                    of cabbage-type B. oleracea were identified for 19 genes,
region based on RNA-seq reads in SRX209697 (NCBI),                           but clear orthologous relationship could not be deter-
were used, anther-specific GUS expressions were found                        mined for the other 15 B. oleracea var. oleracea GH3
to be maintained (Fig. 8 g & h). While P4 (− 278~ − 155)                     genes, based on amino acid sequence identities of over
did not show GUS expression in all twelve lines, five out                    95%. Considering 6 B. oleracea var. oleracea GH3 genes,
of twelve P5 (− 418 ~ 279) showed GUS expression, sug-                       whose expression could not be confirmed in NCBI data-
gesting sixty-two bp region (− 340 ~ − 279) in P3                            base, are included in these 15 cabbage-type GH3 genes
                                                                             without putative orthologs, we speculate these 6 genes
                                                                             are pseudogenes and lost in B. oleracea var. capitata. In
                                                                             addition, orthologs of 9 cabbage-type B. oleracea GH3
                                                                             genes could not be determined in B. oleracea var. olera-
                                                                             cea (Table S2).
                                                                               Group III subgroup 6 GH3 genes in B. oleracea var.
                                                                             oleracea and Arabidopsis seem to have evolved by dupli-
                                                                             cations. Four Arabidopsis GH3 genes in subgroup 6 are
                                                                             located within 15 kbp region on the same Arabidopsis
                                                                             chromosome, while 4 BoGH3 genes in the same sub-
                                                                             group are located on 4 different chromosomes of B. oler-
                                                                             acea var. oleracea (Fig. 2). Syntenies found between
                                                                             genomic regions around the subgroup 6 AtGH3 and
                                                                             BoGH3 genes suggest that AtGH3.13 ~ AtGH3.16 cluster
                                                                             in Arabidopsis was generated by tandem duplication
 Fig. 8 Representative GUS staining patterns to define a promoter
 region directing anther-specific expression of BoGH3.13–1. a                after Brassica lineage-specific whole genome triplication
 Genomic DNA regions used in transgenic lines for promoter analysis.         and/or other BoGH3 genes around BoGH3.13–1,
 Names of transgenic plants used are written in italic and different         BoGH3.13–2, and BoGH3.13–4 might have been lost
 regions upstream of BoGH3.13–1 start codon to direct GUS reporter           after divergence of Arabidopsis and Brassica lineages
 expression are indicated in parentheses. b-f GUS staining of floral
                                                                             [47]. Consistent with this idea, one intact and one trun-
 buds (b), a dissected floral bud (c), open flowers (d), siliques (e), and
 8-day old seedling (f) of P1 transgenic plants, and floral buds from        cated form of GH3 genes in subgroup 6, BoGH3.13–1
 P2 (g), P3 (h), P4 (i), and P5 (j) are shown. Arrows indicate GUS-          and B02g011230, were identified within 15 kb region on
 stained pollen (d) or floral abscission zones in a silique (e). Dividends   the chromosome 2 of B. oleracea var. oleracea (Fig. 2b).
 and denominators of fractions in the pictures are numbers of                Members in gene family in plants are known to evolve
 transgenic plants with the GUS staining and all the transgenic plants
                                                                             through both tandem (local) duplication and whole gen-
 examined, respectively. Scale bars: 1 mm
                                                                             ome duplication, which were followed by gene loss or
Jeong et al. BMC Genomics (2021) 22:22 Page 10 of 14 gene retention leading to functional diversification [48]. the periods when AtGH3.13 and AtGH3.16 are expressed Nonetheless, close genomic locations of subgroup 4 and (Fig. 7 & S2). Although BoGH3.5–1, a group II BoGH3 subgroup 6 GH3 genes in Arabidopsis and B. oleracea gene, is also specifically expressed in stamen like var. oleracea indicate both AtGH3.12-like and AtGh3.13- BoGH3.13–1 (Figs. 3a-b & 6u-x), BoGH3.5–1 seems to like GH3 genes were present in proximity before the be expressed in a longer time period compared to separation of Arabidopsis and Brassica lineages. For BoGH3.13–1 (Figs. 5a - b, 6h & o). Different from exon/intron structures of BoGH3 and AtGH3 genes, BoGH3.13–1, neither in floral abscission zones nor in overall similarities were observed for the evolutionarily leaf primordia is expression of BoGH3.5–1 observed related genes. However, distributions of RNA-seq reads (Fig. 6 p & r). It needs to be determined which sub- in NCBI database revealed that protein-coding exons of strate(s) are preferentially used by BoGH3.13–1 and BoGH3.1, BoGH3.11–2, and BoGH3.11–3 are differently BoGH3.5–1. organized compared to those of related Arabidopsis BoGH3.13–1 is not induced by auxin (IAA or 2,4-D), GH3 genes (Fig. 1b). Differences in the structures ob- JA, or GA, but expressed in a tissue-specific manner. served for five BoGH3 genes (BoGH3.8–2, BoGH3.8–5, Different from many GH3 genes in other plants, which BoGH3.13–3, BoGH3.18–1, and BoGH3.18–7) and re- have been found to be induced by various plant hor- lated Arabidopsis genes might result from deletions/in- mones [1, 17, 33, 51, 52], no expression changes for sertions and incorrect annotations, considering that BoGH3.13–1 and 3 other subgroup 6 BoGH3 genes these five BoGH3 genes are identified only in Ensembl were detected in our experimental conditions (Fig. 3). Plants, not supported by RNA-seq data in NCBI data- In contrast, expression levels of BoGH3.2 was found to base, and encode predicted GH3 proteins with multiple be elevated upon exposure to auxin in the same condi- deletions (Fig. 1b & S1). tion. Similar to our findings, all subgroup 6 GH3 genes Four subgroup 6 BoGH3 genes, which seem to be gen- in B. napus, an allotetraploid carrying chromosomes erated from same ancestor gene(s), show distinct expres- with B. oleracea origin, did not show any significant ex- sion patterns. At the organ level, BoGH3.13–1 is almost pression changes in response to IAA treatment in exclusively detected in floral buds by qRT-PCR, while leaves [33]. Although BoGH3.13–1 expression is not in- the strongest expressions of BoGH3.13–3 and duced by auxin in our experimental condition, tissues BoGH3.13–4 are observed in siliques (Fig. 4 a, c & d). In or cells, in which BoGH3.13–1 promoter activity is de- case of BoGH3.13–2, no significant expression prefer- tected, largely overlap with the regions where auxin- ence is found among different organs and constitutively responsive DR5 promoter is activated in Arabidopsis expressed in all parts of flowers (Figs. 4b, 5 c & f). In de- and rice (Figs. 3 & 6) [53–56]. We do not exclude the veloping floral buds, BoGH3.13–1 is strongly expressed possibility that BoGH3.13–1 promoter is less sensitive in stamen when floral buds are about 2 ~ 6 mm long to auxin treatment than BoGH3.2, but we prefer the (Fig. 5). However, investigation of BoGH3.13–1 pro- idea that expression of BoGH3.13–1 is induced by a moter activity using GUS reporter revealed that transcription factor that is activated in tissue-specific BoGH3.13–1 is also expressed in abscission zones in si- manners downstream of auxin signaling pathway. liques and leaf primordia, in addition to tapetal cells in When expression patterns of BoGH3 genes were probed stamen and pollen grains (Fig. 6f–l). Relatively weak de- at the organ level using EMBL-EBI expression atlas tection of BoGH3.13–1 in siliques by qRT-PCR may be (https://www.ebi.ac.uk/gxa/experiments/E-GEOD-4289 related to the facts that the gene is expressed only in a 1/Results), BoGH3.13–1 was found to be specifically small portion of siliques cells, although we do not ex- expressed in floral buds, similar to our qRT-PCR results clude the possibility that the expression level is also (Fig. 4 & Table S3). However, expression levels of lower in siliques than in stamen. In 2 ~ 6 mm floral BoGH3.5–1 was found to be higher in silique than in buds, in which BoGH3.13–1 is most strongly expressed, floral bud, different from our results. Although differ- microspores, polarized microspores, and bicellular pol- ences in growth conditions and sampling times might lens are mainly observed in anthers (Fig. 7). Similar to have affected gene expressions, transcription profiling BoGH3.13–1, two syntenic subgroup 6 Arabidopsis GH3 based on RNA-seq could have been confounded by se- genes, AtGH3.13 and AtGH3.16, are expressed in flower quence reads produced from highly homologous stage 9 ~ 11 floral buds and flower stage 12, respectively BoGH3 gene family members. Given that expressions of [49]. More specifically, AtGH3.16 is expressed in BoGH3.13–1 in leaf primordia and floral abscission polarized microspore and AtGH3.13 is expressed bicellu- zone could not be detected by transcription profiling, lar pollens. Based on the numbers of pollen nuclei and complete understanding of some BoGH3 expression floral bud phenotypes [50], the flower stages, when patterns seem to require both qRT-PCR and investiga- BoGH3.13–1 is strongly expressed, roughly correspond tion of promoter activity using promoter-reporter to stages 8 ~ 12 of Arabidopsis flower and overlap with system.
Jeong et al. BMC Genomics   (2021) 22:22                                                                        Page 11 of 14

   Anther-specific expression of BoGH3.13–1 is directed          (Haarlem, Netherlands). Plants were grown under a 16 h
by 62 bp DNA sequence, from − 340 to − 279 bp from               (hr) light/8 h dark photoperiod at 22 C°. Organ samples
the start codon. Determination of promoter regions im-           of Brassica oleracea var. oleracea were collected from
portant for tissue-specific expressions revealed that            50-day old soil-grown plants.
about 180 bp P3 region (− 340 ~ − 155) close to the tran-          Transgenic Arabidopsis plants (ecotype Columbia) car-
scription start site is sufficient for anther-specific expres-   rying     β-glucuronidase     (GUS)-coding     sequences
sion (Fig. 8). The observation that P4 region (− 278 ~ −         expressed by GH3 promoter sequences were selected on
155) does not supports anther-specific expression sug-           half-strength solid MS media containing 0.8% Duchefa
gests that cis-acting element necessary for anther-              Plant agar P1001 (Haarlem, Netherlands) and 20 μg/ml
specific expression is included by 62 bp DNA sequence            Kanamycin, and transferred to soil for flowering.
from − 340 to − 279 bp. GUS expression detected in 5
out of 12 P5 transgenic lines containing − 418 to − 279          Identification of genes encoding putative GH3 family
bp region further supported this idea. We suspect that           proteins in Brassica oleracea var. oleracea
deletion of promoter sequences (− 278 ~ − 155) close to          To identify putative GH3-coding genes in Brassica olera-
the transcription start site makes anther-specific expres-       cea var. oleracea, 19 Arabidopsis GH3 protein sequences
sion depend on the genomic positions where transgene             downloaded from The Arabidopsis Information Re-
is inserted. In Arabidopsis, Male Sterility 1, a plant           source (TAIR, http://www.arabidopsis.org/) were used
homeodomain-finger, and MYB99 transcription factors              for BLAST search in the Ensembl Plants database
functioning in anther and pollen development pathway             (http://plants.ensembl.org/index.html) and the National
are expressed in microspores, polarized microspores,             Centre for Biotechnology Information (NCBI, http://
and bicellular pollens [49, 57]. The findings (1) that           ncbi.nlm.nih.gov). In the Ensembl Plants and NCBI data-
BoGH3.13–1 is strongly expressed when microspores,               base search, E-value thresholds for candidates were set
polarized microspores, and bicellular pollens are pro-           on 1e− 1 and 0.1, respectively. BoGH3 proteins were fur-
duced and (2) that MYB core cis-acting element (CTGT             ther determined by the presence of the intact GH3 do-
TA) is located at − 293 ~ − 288 raises a possibility that        mains, and their exon/intron structures were determined
Brassica oleracea var. oleracea ortholog of Arabidopsis          based on RNA-seq exon coverage and RNA-seq intron
MYB99 plays an important role for anther-specific ex-            spanning reads from NCBI B. oleracea annotation Re-
pression of BoGH3.13–1 [58]. Because GUS expressions             lease 100. Similarly, GH3 protein sequences in B. olera-
in leaf primordia and floral abscission zones are lost           cea var. capitata were identified using the sequence in
without any obvious effect on anther-specific expression,        Bolbase      (http://ocri-genomics.org/bolbase/blast/blast.
cis-acting element important for leaf primordia and              html) [59].
floral abscission zone expressions must be located in the
− 1489 to − 1017 region in BoGH3.13–1 promoter and               Multiple sequence alignment and construction of
independent of cis-acting element for anther-specific ex-        phylogenetic tree
pression (Fig. 8a – f).                                          The multiple sequence alignment of GH3 proteins was
                                                                 performed using Clustal Omega and visualized using Jal-
Conclusions                                                      view [60, 61]. Phylogenetic analysis was performed using
In this study, we identified 34 GH3 genes in Brassica            the molecular evolutionary genetics analysis (MEGA)
oleracea var. oleracea, including four subgroup 6 GH3            software [62]. The evolutionary history was inferred by
genes, and a critical promoter region for anther-specific        using maximum likelihood method based on the JTT
expression of a subgroup 6 BoGH3 gene, BoGH3.13–1.               matrix-based model [63]. All positions with less than
The information will broaden our understanding of tran-          90% site coverage were eliminated. There were a total of
scriptional regulations during anther development and            549 positions in the final dataset. The bootstrap test was
can be used to develop transgenic male sterile lines for         repeated 1000 times. An orthologous relationship for
economically important Brassica plants.                          synteny between B. oleracea var. oleracea and Arabidop-
                                                                 sis was determined using gene information in the
Methods                                                          Ensembl database (https://plants.ensembl.org/Brassica_
Plant growth                                                     oleracea/Info/Index).
Brassica oleracea var. oleracea (TO1000 seeds, stock
number CS29002) were obtained from the Arabidopsis               Hormone treatment
Biological Resource Center. Brassica oleracea var. olera-        For hormone treatment, surface sterilized Brassica olera-
cea and Arabidopsis plants were grown on soil or a half-         cea var. oleracea seeds were germinated and grown in
strength liquid Murashige and Skoog (MS) media (pH               24 well plates containing 1 ml half-strength liquid MS
5.7) with vitamins made with Duchefa Biochemie M0222             media for 5 days. 2,4-D (D0901), IAA (I0901), GA
Jeong et al. BMC Genomics (2021) 22:22 Page 12 of 14
(G0907) and JA (J0936) from Duchefa (Haarlem, pBI101.1 vector between SalI and BamHI sites. The con-
Netherlands) were treated to whole seedlings, after the struct was transformed into Arabidopsis by the floral dip
seedlings were further grown in 2 ml fresh liquid media method [64].
for 6 h.
Histochemical GUS staining and paraffin section of GUS-
Sample collection stained samples
Five-day-old seedlings were used to determine whether Histochemical GUS staining was performed with 0.5 mg/
the BoGH3 gene of interest is induced by hormone treat- ml MBcell 5-bromo-4-chloro-3-indolyl-beta-D-glucur-
ment. For gene expression analysis by qRT-PCR, root, onic acid-cyclohexylammonium salt (Seoul, Republic of
leaf, stem, floral bud, open flower, and silique were ob- Korea), as previously described [65]. The floral buds of
tained from 3 individual plants: more specifically, 11th T1 or T2 transgenic plants carrying a GH3 promoter::
to 13th leaves, fifth to seventh node for stems, a mix of GUS fusion transgene were immersed in GUS reaction
unopened floral buds without white petals exposed (bud buffer in the dark condition for 1 day at 37 °C, after
length less than about 8 mm), a mix of open flowers which samples were washed in 95% ethanol for 1 ~ 2 h.
(bud length larger than 8 mm) with white petals ex- At least 7 individual transgenic lines were used to
posed, and siliques with various sizes were collected. analyze GUS expression patterns.
Samples for floral buds were further divided into 5 cat- To perform the paraffin section, GUS-stained samples
egories by lengths: 0 ~ 2, 2 ~ 4, 4 ~ 6, 6 ~ 8, and 8 ~ 10 were fixed in FAA solution (Formaline: ethanol: glacial
mm sizes (Figure S3). Sepals, petals, anthers, and pistils acetic acid: water = 10: 50: 5: 35) for at least 24 h and
were collected from 4 ~ 6 mm -long unopened floral washed in water for 24 ~ 48 h. Then the samples were
buds. After collection, samples were frozen in liquid ni- dehydrated in 50, 60, 70, 80, 90% ethanol series for 20
trogen and stored at − 80 C° until RNA isolation. Sam- min once, and 100% ethanol for 20 min twice. The sam-
ples for GUS staining were collected when transgenic ples were incubated in a series of ethanol:xylene mix (75:
Arabidopsis seedlings were 8 days old, or later when in- 25, 50:50, and 25:75) for 30 min in each mix, and to a
florescence and siliques were mature enough. series of xylene:paraffin mix (2:1, 1:1, and 1:2) for 1 h
twice in each mix. The samples were incubated in mol-
RNA isolation, reverse transcription, and qRT-PCR analysis ten paraffin for 24 h and poured into blocks on a slide
Total RNA was extracted using PhileKorea E-Zol RNA warmer at 70 °C and cooled down to 25 °C. Eight μm-
Reagent (Seoul, Korea) or Ambion TRIzol® Reagent thick transverse sections of paraffin-embedded samples
(Austin, USA) following the manufacturer’s instructions. were made with a microtome. Ribbons of serial sections
For silique samples, Invitrogen Plant RNA Purification floated on warm water (50 °C) were transferred to slide
Reagent (Carlsbad, USA) was used to. cDNA was syn- glasses on the slide warmer at 70 °C and cooled down to
thesized from RNA with 260/280 ratios between 1.8 and 25 °C. Paraffin in the sections was removed with xylene.
2.1. First stand cDNA was synthesized with Toyobo
ReverTra Ace -α (Osaka, Japan) and 1.0 μg of total RNA, DAPI staining of pollen grains
according to the manufacturer’s instructions. In case of For DAPI staining, pollen in 0 ~ 2 mm, 2 ~ 4 mm, 4 ~ 6
hormone-treated seedlings, 0.5 μg of total RNA was mm, 6 ~ 8 mm, and 8 ~ 10 mm TO1000 floral buds were
used. As described in Nam et al. (2019), qRT-PCR was put on microscope slides and stained with several drops
performed with a two-step reaction: 3 min (min) at of DAPI-staining solution, as described [66]. The pollen
95 °C, followed by 50 cycles of 10 s at 95 °C and 30 s at nuclei were inspected under an Olympus BX51 fluores-
60 °C. Primer sequences used are listed in Table S4. For cence microscope (Tokyo, Japan) with a DAPI filter.
each analysis, three technical replicates of at least two
independent biological replicates were used.
Supplementary Information
The online version contains supplementary material available at https://doi.
Construction of GH3 promoter-GUS reporter vector and org/10.1186/s12864-020-07345-9.
plant transformation
DNA regions upstream of the start codon of GH3 genes Additional file 1: Supplementary Table 1 Protein identifiers and
genomic locations of kale-like type B. oleracea var. oleracea GH3 proteins
used for promoter analyses are as follows: − 1489 ~ − 1, identified in Ensembl Plants and NCBI database.
− 1017 ~ − 1, − 500 ~ − 1, − 418 ~ − 1, − 340 ~ − 155, − Additional file 2: Supplementary Table 2 GH3 proteins in B. oleracea
278 ~ − 155 bp of BoGH3.13–1, and − 1496 ~ − 1 bp of var. oleracea and putative orthologs in B. oleracea var. capitata.
BoGH3.5–1. Putative promoter regions were PCR- Additional file 3: Supplementary Table 3 Transcription profiling
amplified with specific primers with SalI or BamHI rec- calculated from high throughput sequencing results.
ognition sequence for cloning (Table S5). After SalI and Additional file 4: Supplementary Table 4 Sequences of qRT-PCR
primers.
BamHI digestion, the PCR fragments were cloned intoJeong et al. BMC Genomics (2021) 22:22 Page 13 of 14
Additional file 5: Supplementary Table 5 Sequences of primers used Received: 12 August 2020 Accepted: 22 December 2020
to clone putative promoter regions of BoGH3.13–1.
Additional file 6: Supplementary Figure 1. Multiple sequence
alignment of thirty-four B. oleracea var. oleracea and nineteen Arabidopsis References
GH3 proteins. 1. Hagen G, Kleinschmidt A, Guilfoyle T. Auxin-regulated gene expression in
Additional file 7: Supplementary Figure 2. qRT-PCR results showing intact soybean hypocotyl and excised hypocotyl sections. Planta. 1984;162:
expression patterns of three subgroup 4 BoGH3 genes. qRT-PCR results 147–53.
showing expression patterns in different organs. Relative steady-state ex- 2. Hsieh HL, Okamoto H, Wang M, Ang LH, Matsui M, Goodman H, Deng XW.
pression levels of BoGH3 genes were determined by qRT-PCR experiment FIN219, an auxin regulated gene, defines a link between phytochrome a
with Actin control. Bar graphs show average relative expression values and the downstream regulator COP1 in light control of Arabidopsis
with SEs. The expression level of leaf was set to value 1 and used as refer- development. Genes Dev. 2000;14:1958–70.
ence to compare expression levels in different organs. 3. Ludwig-Müller J, Jülke S, Bierfreund NM, Decker EL, Reski R. Moss
(Physcomitrella patens) GH3 proteins act in auxin homeostasis. New Phytol.
Additional file 8: Supplementary Figure 3. Morphology of B. oleracea 2009;181:323–38.
var. oleracea floral buds used in this study. Upper panels show 4. Okrent RA, Wildermuth MC. Evolutionary history of the GH3 family of acyl
representative intact floral buds. Lower panels show representative adenylases in rosids. Plant Mol Biol. 2011;76:489–505.
anthers and pistils after sepals and petals were removed. Scale bar shown 5. Roux C, Perrot-Rechenmann C. Isolation by differential display and
with fully opened flower is 1 cm. characterization of a tobacco auxin-responsive cDNA Nt-gh3, related to
GH3.FEBS Lett. 1997;419:131-36.
Abbreviations 6. Yuan H, Zhao K, Lei H, Shen X, Liu Y, Liao X, Li T. Genome-wide analysis of
GH3: Gretchen Hagen 3; bp: Base pairs; qRT-PCR: Quantitative reverse the GH3 family in apple (Malus × domestica). BMC Genomics. 2013;14:297.
transcription polymerase chain reaction; GUS: β-glucuronidase; DAPI: 4′,6- 7. Zhang C, Zhang L, Wang D, Ma H, Liu B, Shi Z, Ma X, Chen Y, Chen Q.
diamidino-2-phenylindole; 2,4-D: 2,4-Dichlorophenoxy acetic acid; Evolutionary history of the glycoside hydrolase 3 (GH3) family based on the
IAA: Indole-3-acetic acid; GA: Gibberellic acid 3; JA: Jasmonic acid sequenced genomes of 48 plants and identification of jasmonic acid-related
GH3 proteins in Solanum tuberosum. Int J Mol Sci. 2018;19:1850.
8. Chen Q, Westfall CS, Hicks LM, Wang S, Jez JM. Kinetic basis for the
Acknowledgements
conjugation of auxin by a GH3 family indole-acetic acid-amido synthetase. J
The authors appreciate Yoonkang Hur, Jeong-Won Nam, Yeon Lee, Byug-
Biol Chem. 2010;285:29780–6.
wook Kang, Jinouk Yeon, and Jaebeom Lim for their helpful discussions.
9. Gulick AM. Conformational dynamics in the acyl-CoA synthetases,
adenylation domains of non-ribosomal peptide synthetases, and firefly
Authors’ contributions
luciferase. ACS Chem Biol. 2009;4:811–27.
JJ and HY designed experiments and wrote manuscript. JJ, SP, and JI
10. Staswick PE, Tiryaki I, Rowe ML. Jasmonate response locus JAR1 and several
conducted experiments. All authors read and approved the final manuscript.
related Arabidopsis genes encode enzymes of the firefly luciferase
superfamily that show activity on jasmonic, salicylic, and indole-3-acetic
Funding acids in an assay for adenylation. Plant Cell. 2002;14:1405–15.
This work was supported by a grant (2017–1902-01) from Chungnam 11. Zheng Z, Guo Y, Novák O, Chen W, Ljung K, Noel JP, Chory J. Local auxin
National University in Republic of Korea. metabolism regulates environment-induced hypocotyl elongation. Nat
Plants. 2016;2:16025.
Availability of data and materials 12. Westfall CS, Zubieta C, Herrmann J, Kapp U, Nanao MH, Jez JM. Structural
The accession numbers of BoGH3 genes, which were retrieved from Ensembl basis for prereceptor modulation of plant hormones by GH3 proteins.
Plants repository (http://plants.ensembl.org/index.html) and analyzed during Science. 2012;336:1708–11.
the current study, are indicated in parenthesis after gene names: BoGH3.2 13. Staswick PE, Tiryaki I. The oxylipin signal jasmonic acid is activated by an
(Bo1g004760), BoGH3.3 (Bo8g100590), BoGH3.5–1 (Bo1g048130), BoGH3.5–2 enzyme that conjugates it to isoleucine in Arabidopsis. Plant Cell. 2004;16:
(Bo7g111320), BoGH3.6–1 (Bo2g041710), BoGH3.6–2 (Bo3g022080), BoGH3.8–2 2117–27.
(Bo3g023700), BoGH3.8–3 (Bo1g008000), BoGH3.8–5 (Bo7g116230), BoGH3.10 14. Torrens-Spence MP, Bobokalonova A, Carballo V, Glinkerman CM, Pluskal T,
(Bo9g007560), BoGH3.11–1 (Bo4g009300), BoGH3.11–2 (Bo3g039200), Shen A, Weng JK. PBS3 and EPS1 complete salicylic acid biosynthesis from
BoGH3.12–1 (Bo2g011190), BoGH3.12–3 (Bo9g167830), BoGH3.13–1 isochorismate in Arabidopsis. Mol Plant. 2019;12:1577–86.
(Bo2g011210), BoGH3.13–2 (Bo3g009140), BoGH3.13–3 (Bo7g011450), 15. Nakazawa M, Yabe N, Ichikawa T, Yamamoto YY, Yoshizumi T, Hasunuma K,
BoGH3.13–4 (Bo9g166800), BoGH3.17–3 (Bo8g039460), BoGH3.18–1 Matsui M. DFL1, an auxin-responsive GH3 gene homologue, negatively
(Bo4g164910), BoGH3.18–2 (Bo9g052150), BoGH3.18–3 (Bo9g117680), regulates shoot cell elongation and lateral root formation, and positively
BoGH3.18–5 (Bo8g109440), BoGH3.18–6 (Bo8g109480), and BoGH3.18–7 regulates the light response of hypocotyl length. Plant J. 2001;25:213–21.
(Bo8g109490). The accession numbers of BoGH3 proteins, which were 16. Takase T, Nakazawa M, Ishikawa A, Kawashima M, Ichikawa T, Takahashi N,
retrieved from NCBI repository (https://www.ncbi.nlm.nih.gov/) and analyzed Shimada H, Manabe K, Matsui M. ydk1-D, an auxin-responsive GH3 mutant
during the current study, are indicated in parenthesis after protein names: that is involved in hypocotyl and root elongation. Plant J. 2004;37(4):471–83.
BoGH3.1 (XP_013608568.1), BoGH3.8–1 (XP_013619802.1), BoGH3.8–4 17. Park JE, Park JY, Kim YS, Staswick PE, Jeon J, Yun J, Kim SY, Kim J, Lee YH,
(XP_013596331.1), BoGH3.9 (XP_013632208.1), BoGH3.11–3 (XP_013632135.1), Park CM. GH3-mediated auxin homeostasis links growth regulation with
BoGH3.12–2 (XP_013623633.1), BoGH3.17–1 (XP_013583597.1), BoGH3.17–2 stress adaptation response in Arabidopsis. J Biol Chem. 2007;282:10036–46.
(XP_013594064.1), and BoGH3.18–4 (XP_013603489.1). Accession numbers of 18. Damodaran S, Westfall CS, Kisely BA, Jez JM, Subramanian S. Nodule-enriched GRET
BoGH3 proteins with additional information are also found in Table S1. CHEN HAGEN 3 enzymes have distinct substrate specificities and are important for
RNA-seq data for transcription profiling shown in Table S3 was retrieved proper soybean nodule development. Int J Mol Sci. 2017;18:E2547.
from GEO repository (https://www.ncbi.nlm.nih.gov/geo/query/acc.cgi?acc= 19. Zou X, Long J, Zhao K, Peng A, Chen M, Long Q, He Y, Chen S.
GSE42891). Overexpressing GH3.1 and GH3.1L reduces susceptibility to Xanthomonas
citri subsp. citri by repressing auxin signaling in citrus (Citrus sinensis Osbeck).
Ethics approval and consent to participate PLoS One. 2019;14:e0220017.
Not applicable. 20. Kirungu JN, Magwanga RO, Lu P, Cai X, Zhou Z, Wang X, Peng R, Wang K,
Liu F. Functional characterization of Gh_A08G1120 (GH3.5) gene reveal their
Consent for publication significant role in enhancing drought and salt stress tolerance in cotton.
Not applicable. BMC Genet. 2019;20:62.
21. Gan Z, Fei L, Shan N, Fu Y, Chen J. Identification and expression analysis of
Competing interests Gretchen Hagen 3 (GH3) in Kiwifruit (Actinidia chinensis) during postharvest
The authors declare that they have no competing interests. process. Plants (Basel). 2019;8:473.You can also read