Role of a local transcription factor in governing cellular carbon/nitrogen homeostasis in Pseudomonasfluorescens
←
→
Page content transcription
If your browser does not render page correctly, please read the page content below
Nucleic Acids Research, 2021 1
doi: 10.1093/nar/gkab091
Role of a local transcription factor in governing
cellular carbon/nitrogen homeostasis in
Pseudomonas fluorescens
*
Naran Naren and Xue-Xian Zhang
Downloaded from https://academic.oup.com/nar/advance-article/doi/10.1093/nar/gkab091/6155939 by guest on 20 March 2021
School of Natural and Computational Sciences, Massey University at Albany, Auckland 0745, New Zealand
Received November 21, 2020; Revised February 01, 2021; Editorial Decision February 01, 2021; Accepted February 02, 2021
ABSTRACT predominantly carried out by two-component systems
(TCSs) consisting of a sensor kinase (SK) and a response
Autoactivation of two-component systems (TCSs) regulator (RR) (1–3). SK responds to the presence of
can increase the sensitivity to signals but inherently a stimulatory ligand and regulates phosphorylation of
cause a delayed response. Here, we describe a its cognate RR. Most RRs possess a transcriptional
unique negative feedback mechanism enabling the regulator output domain and determine the expression
global NtrB/NtrC regulator to rapidly respond to levels of downstream target genes. Interestingly, many
nitrogen starvation over the course of histidine phosphorylated RRs activate their own expression (4,5).
utilization (hut) in Pseudomonas fluorescens. NtrBC This phenomenon (known as autoactivation or positive
directly activates transcription of hut genes, but autoregulation) is widespread for transcription factors in
overexpression will produce excess ammonium bacteria. Autoactivation can increase the sensitivity to
leading to NtrBC inactivation. To prevent this from signals and exert history-dependent hysteretic responses (6–
8). However, both experimental and theoretical analysis
occurring, the histidine-responsive repressor HutC
indicated that autoactivation causes an inherent delayed
fine-tunes ntrBC autoactivation: HutC and NtrC bind response as more time is required for protein synthesis
to the same operator site in the ntrBC promoter. (9,10). A slow response is potentially disadvantageous for
This newly discovered low-affinity binding site bacteria living in ever-changing environmental conditions,
shows little sequence similarity with the consensus i.e. nutrient fluctuation. To overcome the fitness cost of
sequence that HutC recognizes for substrate- TCS autoactivation, a coupled negative feedback loop is
specific induction of hut operons. A combination predicted to be necessary but only a few mechanisms have
of genetic and transcriptomic analysis indicated been uncovered thus far, including autorepression at a
that both ntrBC and hut promoter activities cannot secondary weak binding site (11–13).
be stably maintained in the hutC background A typical example of TCS autoactivation concerns the
when histidine fluctuates at high concentrations. NtrBC nitrogen (N) regulator, the first TCS described
in enteric bacteria (14,15). Under N-excess conditions,
Moreover, the global carbon regulator CbrA/CbrB
there is very little NtrB and NtrC in the cell. When
is involved in directly activating hut transcription N becomes limiting, intracellular glutamine levels decline
while de-repressing hut translation via the CbrAB- relative to ␣-ketoglutarate. This causes the NtrB kinase
CrcYZ-Crc/Hfq regulatory cascade. Together, our to catalyze NtrC phosphorylation (NtrC∼P) coupled with
data reveal that the local transcription factor HutC PII uridylation. The NtrC∼P then activates 54 -RNA
plays a crucial role in governing NtrBC to maintain polymerase holoenzyme leading to expression of a LysR-
carbon/nitrogen homeostasis through the complex type transcriptional regulator NAC (plus other genes
interactions between two TCSs (NtrBC and CbrAB) and the ntrBC operon itself). NAC in turn activates the
at the hut promoter. expression of many N catabolic pathways from a 70
promoter (16), including histidine utilization (hut) genes.
Histidine is a good source of nutrient (17), but its utilization
INTRODUCTION poses a significant challenge as it delivers excess nitrogen
All living organisms have evolved the ability to recognize over carbon. Overspeed of the hut catabolism would lead
internal and external environmental stimuli and produce to the buildup of intracellular ammonium and subsequent
appropriate physiological responses. In bacteria, signal inactivation of the NtrBC system (18,19). If that happens,
transduction mediated by protein phosphorylation is a transition period occurs to enable cells to physiologically
* To whom correspondence should be addressed. Tel: +64 9 213 6593; Fax: +64 9 441 8142; Email: x.x.zhang1@massey.ac.nz
C The Author(s) 2021. Published by Oxford University Press on behalf of Nucleic Acids Research.
This is an Open Access article distributed under the terms of the Creative Commons Attribution-NonCommercial License
(http://creativecommons.org/licenses/by-nc/4.0/), which permits non-commercial re-use, distribution, and reproduction in any medium, provided the original work
is properly cited. For commercial re-use, please contact journals.permissions@oup.com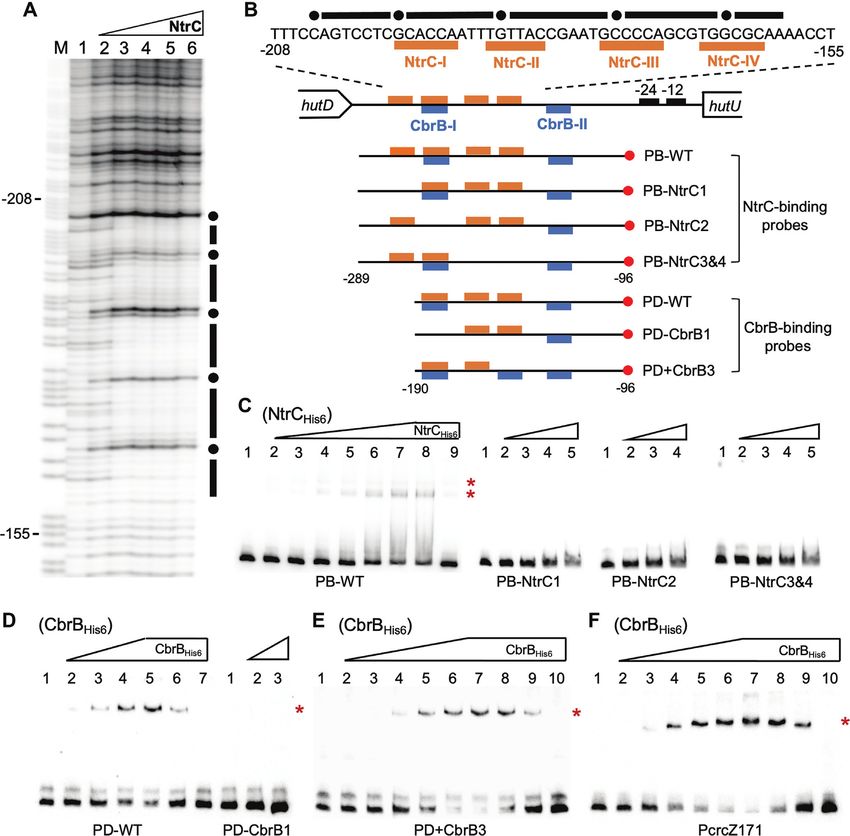
2 Nucleic Acids Research, 2021
shift back to N-limiting status and then ‘jump start’ the represses hut translation through the CbrAB-CrcYZ-
NtrBC system (20). Extra time will be required to produce Crc/Hfq regulatory cascade. When growing on histidine
NtrBC and then NAC proteins to sufficient levels for hut as a source of sole N but alternative C (i.e. a minimal
activation. Therefore, expression of hut enzymes must be salt medium supplemented with succinate and histidine),
tightly regulated to circumvent the potential metabolic the CbrAB-mediated promoter activity is weak, and the
shifts associated with ntrBC autoactivation. global nitrogen regulator NtrBC plays the dominant role
Historically, the hut pathway has been a model for in activating hut transcription. Subsequent genetic and
studying gene regulation, particularly the coordination of biochemical analysis led to an unexpected finding that
C/N metabolism (20). Early studies in enteric bacteria led HutC and NtrC target the same operator DNA (Pntr)
to the concept of catabolite repression, which explains the in the PntrBC promoter. This implies HutC represents a
Downloaded from https://academic.oup.com/nar/advance-article/doi/10.1093/nar/gkab091/6155939 by guest on 20 March 2021
inhibitory effects of glucose on the utilization of alternative transcription factor that can recognize two distinct DNA-
C sources, such as histidine and lactose (21). In summary, binding motifs (Phut and Pntr) that share little sequence
hut transcription is activated by the catabolite-activating similarity. Finally, experiments were designed to test the
protein (CAP) charged with cAMP and the aforementioned hypothesis that the histidine-responsive repressor HutC
NtrBC/NAC cascade when histidine is used as a source fine-tunes ntrBC expression, acting as an essential negative
of C and N, respectively (20). However, this well-defined feedback loop for maintaining C/N homeostasis during
paradigm does not hold for many non-enteric bacteria, bacterial growth on histidine at high concentrations.
including those of the closely related genus Pseudomonas
(22). The Pseudomonas genome does contain homologues MATERIALS AND METHODS
of CAP and NAC, but their involvement (and also the role
of cAMP) in hut activation has been eliminated (23–25). Bacterial strains and culture conditions
Pseudomonads are metabolically versatile but use P. fluorescens SBW25 is a plant growth-promoting
succinate as one of the most preferred C sources. Succinate- bacterium originally isolated from the phyllosphere of
induced carbon catabolite repression (CCR) of hut enzymes sugar beet grown at the University of Oxford farm,
was first reported in 1960s in various Pseudomonas species, Wytham, Oxford, UK (32). Wild-type SBW25 and its
but a molecular explanation is still lacking (22,26). Recent derived mutants were routinely grown in lysogeny broth
progress showed that CCR in Pseudomonas occurs at (LB) medium at 28◦ C. When growth was examined in
the post-transcriptional level with the Crc/Hfq protein the M9 minimal salt medium, succinate and histidine
complex as the principal mediator (27–29). In the presence were added at the final concentration of 20 and 10 mM,
of succinate, Crc/Hfq represses the expression of catabolic respectively (except where otherwise specified). To ensure
genes through specific binding to target mRNAs. When that strains being compared were physiologically equal,
succinate is consumed, Crc/Hfq is sequestrated by bacterial cells in overnight LB culture were washed twice
ncRNAs (CrcY and CrcZ) whose expression is activated and then subjected to starvation in M9 salt solution at
by the CbrAB two-component system. However, previous 28◦ C for 2 h. When necessary, antibiotics were added at
work with P. putida suggested that the crc gene was not the following concentrations (g/ml): ampicillin (Ap), 100;
involved in the CCR control of hut enzymes (30). tetracycline (Tc), 15; spectinomycin (Sp), 100; kanamycin
Expression of hut genes is shown to be controlled (Km), 50; gentamicin (Gm), 25 and nitrofurantoin (NF),
by substrate-specific induction in addition to the 100. Bacterial strains and plasmids used in this study are
general induction mediated by global regulators. Like listed in Supplementary Table S1.
in enteric bacteria, histidine-induced expression of hut in
Pseudomonas is negatively regulated by the HutC repressor,
Strain construction
which is a representative member of the GntR/HutC
family of transcriptional regulators (23,31). It possesses a Escherichia coli DH5␣pir was used for general gene
N-terminal winged helix-turn-helix (wHTH) DNA-binding cloning and subsequent conjugation into Pseudomonas.
domain and a C-terminal substrate-binding domain. HutC Standard DNA recombination techniques were used
binds to operator sites (Phut) of hut promoters, and the following manufacturers’ recommendations. The splicing
repression is relieved by urocanate (the first intermediate of by overlapping extension PCR (SOE-PCR) strategy was
the histidine degradation pathway). In regard to positive adopted for introducing mutations into the probe DNAs
regulation of hut, previous gene deletion analysis showed and also for the construction of Pseudomonas mutant
that cbrAB and ntrBC are functionally required for strains (33). Briefly, two pairs of oligonucleotide primers
bacterial growth on histidine, but it remains unclear how were designed to amplify two DNA fragments of similar
they mediate the regulatory effects (18). sizes flanking the target region. Complementary sequences
We hereby describe the mechanisms of hut activation carrying the desired mutation were incorporated into the
mediated by the CbrAB and NtrBC systems in P. fluorescens primers, hence the two PCR products were joined via
SBW25. Our study began with genetic characterization of an additional PCR. A summary of the oligonucleotide
the hut promoters and in vitro protein-DNA interactions primers is provided in Supplementary Table S2. As a
using purified CbrBHis6 and NtrCHis6 proteins. Results general practice, the PCR product was cloned into plasmid
consistently indicated that both CbrAB and NtrBC activate vector pCR8/GW/TOPO from Invitrogen (Auckland, New
hut expression in a direct manner. Furthermore, we Zealand), and sequence identity was confirmed using
present empirical evidence showing that CbrAB activates Sanger’s method of DNA sequencing. The resulting
hut transcription in response to C-limitation and de- recombinant plasmid can be used as the template for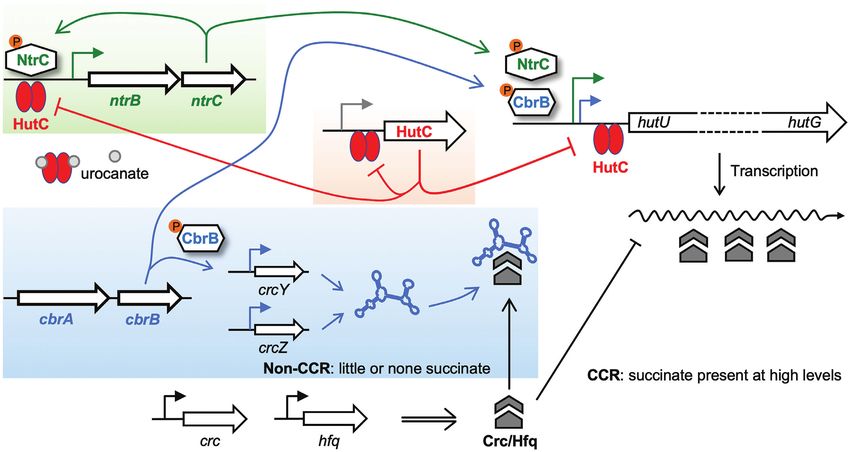
Nucleic Acids Research, 2021 3
preparing DNA probes using PCR with a biotin-labeled of 20 nM probe, 1 g salmon sperm DNA, 10 mM HEPES,
primer. To construct mutant strains, the DNA insert 50 mM KCl, 5 mM MgCl2 and 1 mM dithiothreitol (DTT)
was sub-cloned into an integration suicide vector pUIC3 (pH 7.5). After 30 min of incubation at room temperature,
(34), and the recombinant plasmid was mobilized into DNA or RNA probes were subject to 6% polyacrylamide
Pseudomonas by conjugation with the help of pRK2013. gel electrophoresis (PAGE) in half-strength Tris–borate–
Allelic exchange mutants were selected using a modified EDTA (TBE) buffer at low temperatures (∼4◦ C). Probes
procedure of D-cycloserine enrichment (23). in the gel were then transferred to a positively charged
Whatman Nytran SuPerCharge nylon membrane (Sigma-
Aldrich) and were heat immobilized at 80◦ C for 30 min.
Assays for gene expression
Finally, the Pierce’s LightShift Chemiluminescent EMSA
Downloaded from https://academic.oup.com/nar/advance-article/doi/10.1093/nar/gkab091/6155939 by guest on 20 March 2021
To construct a transcriptional lacZ fusion, an error-free kit (Thermo Fisher Scientific) was used for probe detection,
DNA fragment in pCR8/GW/TOPO was subcloned into and the image was visualized with a LAS-4000 luminescent
either pUIC3 (34) or pUC18-mini-Tn7T-Gm-lacZ (35). imager equipped with the ImageQuant LAS 4000 software
The obtained pUIC3 recombinant plasmid was mobilized (Fujifilm). Equilibrium dissociation constant (Kd ) was
into Pseudomonas and integrated into the target locus of calculated by plotting the fractions of bound DNA against
the chromosome via a homologous recombination event of protein concentrations in GraphPad Prism v7.
insertion-duplication. In contrast, the recombinant plasmid DNase I analyses were performed under the same
of pUC18-mini-Tn7T-Gm-lacZ was electroporated into condition described for EMSA but in a 50 l reaction
Pseudomonas together with the helper plasmid pUX- containing 2 M probe. After 30 min incubation, the
BF13 (35,36). The mini-Tn7 element containing the lacZ reaction mixture was mixed with 50 l co-factor solution (5
reporter fusion was integrated into a unique chromosome mM CaCl2 and 10 mM MgCl2 ), and then treated with 0.02
site located downstream of glmS. Gene expression at unit of DNase I (Invitrogen) for 5 min at room temperature.
the translational level was estimated using lacZ fusion Next, 100 l stop buffer containing 200 mM NaCl, 20
cloned in pXY2, a modified version of pUC18-mini- mM EDTA and 1% (w/v) SDS was added to terminate
Tn7T-Gm-lacZ (37). -Galactosidase activity was assayed the enzymatic reaction. The DNAs were then subjected to
using 4-methylumbelliferyl--D-galactoside (4MUG) as the purification with 1:1 phenol–chloroform, and precipitation
enzymatic substrate. The fluorescent product, 7-hydroxy-4- with three volumes of ethanol with the addition of 1 l
methylcoumarin (4MU), was detected at 460 nm with an glycogen (20 mg/ml), 1/10 volume of 3 M sodium acetate
excitation wavelength of 365 nm using a Synergy 2 plate (pH 5.2). After centrifugation, DNAs were dissolved in 8
reader (Bio-Tek). The enzyme activity was expressed as l loading buffer containing 95% (v/v) formamide, 0.05%
the amount of 4MU (M) produced per minute per cell (w/v) bromophenol blue and 20 mM EDTA. DNAs were
(A600 ). Statistical analyses were performed using tools in denatured by heat treatment (95◦ C, 10 min) before they were
GraphPad Prism v7. loaded onto a 6% urea–polyacrylamide gel (21 by 40 cm)
in 1× TBE buffer using the Sequi-Gen GT electrophoresis
EMSA and DNase I footprinting assays system (Bio-Rad Laboratories Pty). The DNAs were then
transferred from the gel to a positively charged nylon
The coding regions of CbrB and NtrC were amplified by membrane by contact blotting and detected using the
PCR from the genomic DNA of P. fluorescens SBW25 LightShift Chemiluminescent EMSA kit as described above
with the integration of His6 tag at the N-terminal. The for EMSA. The DNA sequence ladder was obtained by the
PCR product was first cloned into pCR8/GW/TOPO, G + A chemical sequencing reaction with the same biotin-
and the error-free DNA fragment was subcloned into labeled probe, and it was included in the gel to identify the
the protein expression vector pTrc99A at the NcoI protein-protected DNA regions (38).
and HindIII sites. The recombinant plasmids were
then transformed into E. coli BL21(DE3). Protein
RNA-seq analysis
expression was induced by 1 mM IPTG (isopropyl--D-
thiogalactopyranoside) and it was subsequently purified Transcriptomes of the cbrB and ntrC mutants were
using the Talon metal affinity resin (Clontech Laboratories performed in parallel with wild-type P. fluorescens
Inc.) according to the manufacturer’s protocol. Of note, SBW25 and the derived hutC mutant as described
HfqHis6 purification involved an additional washing step previously (31). Cells were harvested from bacteria grown
with a high concentration of imidazole (70 mM) whereby in mid-exponential phase in M9 minimal salt medium
the effects of residual HfqE.coli were eliminated (27). supplemented with succinate (20 mM) and histidine (10
Probe DNAs were prepared by PCR using a biotinylated mM) as the sources of C and N. Total RNAs were prepared
primer. The single-stranded RNA probes were synthesized using the Promega SV Total RNA Isolation System
by IDT (Integrated DNA Technologies, Inc.) with a 5’- (Thermo Fisher Scientific, Auckland, New Zealand).
biotin modification. The protein–DNA/RNA interactions Quality of the RNA samples was determined using an
were examined in vitro as previously described (27,31). The Agilent 2100 Bioanalyzer (Agilent Technologies, Inc.),
protein–RNA interaction was assayed in a 20 l reaction and sequencing was performed on an Illumina HiSeq
containing 0.1 M biotin-labeled probe and varying 4000 platform using the services provided by Novogene
concentrations of HfqHis6 in addition to 10 mM HEPES Technology Co. Ltd. (Beijing, China). Data of the obtained
(pH 7.9), 35 mM KCl and 2 mM MgCl2 . Yeast tRNA (1 g) 150-bp paired-end reads were processed using Geneious
was added as a control agent for nonspecific binding. For 9.0.5 (Biomatters Ltd, Auckland, New Zealand). Reads
EMSA with a DNA probe, the 20 l reaction was composed were mapped to the reference genome of P. fluorescens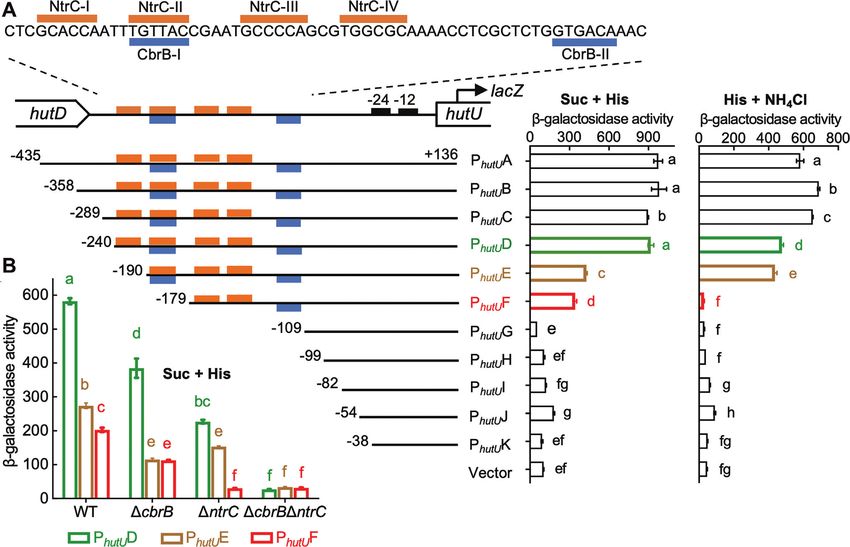
4 Nucleic Acids Research, 2021
Downloaded from https://academic.oup.com/nar/advance-article/doi/10.1093/nar/gkab091/6155939 by guest on 20 March 2021
Figure 1. Genetic analysis of PhutU promoter showing the direct regulatory roles of cbrAB and ntrBC. (A) Putative NtrC and CbrB target sites are indicated
by orange and blue bars, respectively. -Galactosidase activities were measured for wild-type SBW25 containing chromosomally integrated lacZ fusions
to eleven PhutU variants (named PhutU A to PhutU K). The empty mini-Tn7 element was included as a negative control. Bacteria were grown in minimal salt
medium supplemented with succinate (Suc) + histidine (His) or histidine + NH4 Cl. (B) Expression of three PhutU -lacZ variants was assessed in wild-type
(WT) and three mutant backgrounds (cbrB, ntrC, cbrB ntrC) in minimal medium supplemented with succinate and histidine (Suc + His). Data are
means and standard errors of four independent cultures. Bars that are not connected by the same letter (shown above each) are significantly different (P <
0.05) by Tukey’s HSD.
SBW25 (NC 012660.1). Next, reads per kilobase per our expectations, PhutU expression was reduced by half
million (RPKM) and transcripts per million (TPM) with the deletion of NtrC-I (PhutU E), and the promoter
were subsequently calculated for each assembly, and activity ceased completely when the second NtrC target site
differentially expressed genes were determined based on (NtrC-III/IV) was further deleted (PhutU G). A small but
transcript comparison normalized using the Median of significant reduction was noted between PhutU E and PhutU F
Gene Expression Ratios method. with the deletion of the NtrC-II (or CbrB-I) half site (Figure
1A). This result was initially surprising, as NtrC-II would
have negligible effects on NtrC-mediated PhutU activation
RESULTS in the absence of the primary NtrC-I half site. However,
Genetic identification of NtrC and CbrB target sites in the the data was consistent with the functional involvement
PhutU promoter of CbrB in activating PhutU when histidine is the sole N
source (Supplementary Figure S1A). The role of CbrB
The hut genes of P. fluorescens SBW25 are organized in was further confirmed by comparing the expression levels
three transcriptional units, but only one promoter (PhutU ) of PhutU D, PhutU E and PhutU F in mutants devoid of cbrB
was involved in the CbrAB- and NtrBC-mediated positive and/or ntrC (Figure 1B). Significant difference between
regulation (Supplementary Figure S1). Interrogation of the PhutU E and PhutU F was detected in the wild-type but not in
PhutU sequence identified two overlapping DNA regions, the cbrB mutant background (with remaining activity in
which are potentially targeted by NtrC and CbrB (Figure cbrB attributable to the second NtrC binding site NtrC-
1A). To map the PhutU promoter, eleven PhutU variants with III/IV, as PhutU F expression was abolished in the ntrC
variable 5 -ends were fused to a promoterless lacZ reporter background). Together, the genetic data implicate that
gene, and then integrated into the mini-Tn7 site of wild-type NtrBC and CbrAB coordinate PhutU expression in a direct
SBW25 (Figure 1A). -Galactosidase activities were first manner.
examined for cells grown in minimal medium with histidine
as the sole C source (Figure 1A). Results indicate that the
NtrC and CbrB bind in vitro with PhutU promoter
11 nt sequence harboring the CbrB-I site (PhutU E versus
PhutU F) was functionally required for PhutU expression. To determine the direct interactions between NtrC and
Next, we measured promoter activities in minimal PhutU , His6 -tagged NtrC from P. fluorescens SBW25 was first
medium of succinate + histidine (Figure 1A). In line with subjected to DNase I footprinting analysis with a biotin-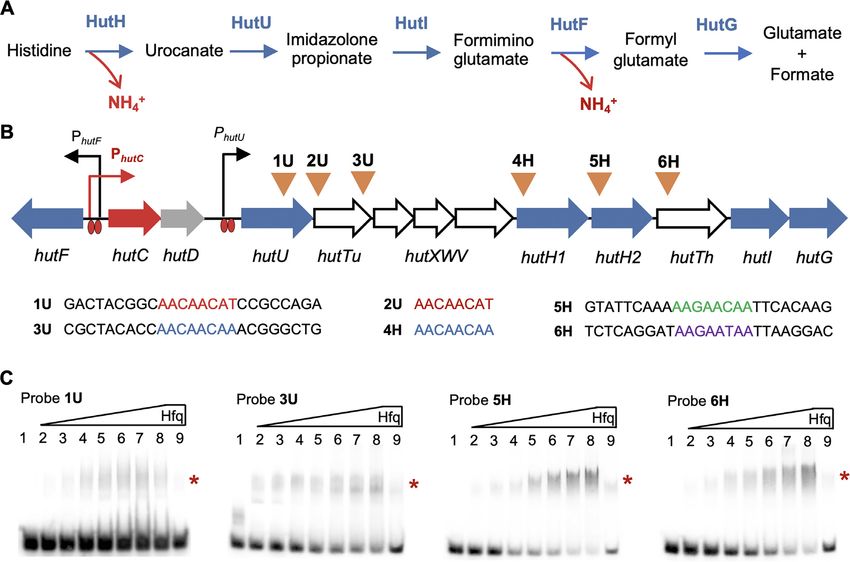
Nucleic Acids Research, 2021 5
Downloaded from https://academic.oup.com/nar/advance-article/doi/10.1093/nar/gkab091/6155939 by guest on 20 March 2021
Figure 2. In vitro protein–DNA interactions showing the direct roles of CbrAB and NtrBC in PhutU expression. (A) DNase I footprinting was performed
using purified NtrCHis6 and a 194 bp biotin-labeled DNA probe PB-WT. Lane M is G+A marker; Lane 1–6, NtrCHis6 added at an increasing concentration
of 0, 0.2, 0.6, 1.6, 3.2 and 5 M respectively. The protected region is indicated by black bars with hypersensitive residues being marked with filled circles.
(B) The hutD - hutU intergenic region showing NtrC-protected DNA sequence and locations of the probe DNAs. The biotin-labeled 3 -ends are marked
with red circles. (C) EMSA with NtrCHis6 . For wild-type probe PB-WT, NtrC was added at 0, 1.25, 2.5, 5, 10, 15, 20, 25 and 25 M from lane 1 to 9. In lane
9, the unlabeled probe was added at 60-fold molar excess. For the three mutant probes, NtrC was added at 0, 5, 15, 25 and 37.5 M from lane 1 to 5. (D)
EMSA with CbrBHis6 and PhutU probes. For PD-WT, CbrB was added at 0, 7.83, 11.75, 15.66, 19.58, 19.58 and 19.58 M from lanes 1 to 7. In lanes 6 and
7, unlabeled probe (competitor DNA) was added at 10- and 60-fold molar excess, respectively. For PD-CbrB1, CbrB was added at 0, 15.66 and 19.58 M
from lane 1 to 3. (E) EMSA with the PD+CbrB3 probe. CbrB was added at 0, 1.31, 3.92, 7.83, 11.75, 15.66, 19.58, 19.58, 19.58, 19.58 M from lane 1 to
10. Competitor DNA (unlabeled PD+CbrB3) was added at 10-, 20- and 60-fold molar excess in lanes 8–10. (F) EMSA of CbrBHis6 with PcrcZ171 probe.
CbrB was added in lanes 1–10 at 0, 1.31, 3.92, 6.53, 9.14, 11.75, 14.36, 14.36, 14.36, 14.36 M, respectively. Lanes 8–10 contained unlabeled probe at 10-,
20- and 60-fold molar excess. Of note, the NtrC-I, NtrC-II/CbrB-I, NtrC-III and NtrC-IV sites were altered to random sequences of TTCAAG, AACCGT,
TAAAGC and AACCGT, respectively. The CbrB-III artificial site ‘GTAACA’ was introduced into the PD+CbrB3 probe sequence at the original NtrC-IV
site. Asterisks on right-hand side of each gel denote positions of the shifted bands.
labeled PhutU probe (PB-WT). Results showed that a 44-bp NtrCHis6 . However, DNA retardation was not observed
DNA region was protected from DNase I digestion, and it for the three mutant probes (Figure 2C). The data thus
contains the two NtrC-binding sites genetically identified suggest that NtrC-I, NtrC-II and NtrC-III/IV sites are all
above (Figure 2A and B). Next, EMSA was conducted with functionally required for stable binding of NtrCHis6 to the
PB-WT and three mutant probes carrying substitutions of PhutU promoter.
NtrC-I, NtrC-II and NtrC-III/IV sites, respectively (Figure Next, we performed EMSA with purified CbrBHis6 from
2C). A significant shift of the wild-type PB-WT probe was P. fluorescens SBW25 (Figure 2D). A significant shift of the
observed in the presence of increasing concentrations of wild-type PhutU probe PD-WT was observed in the presence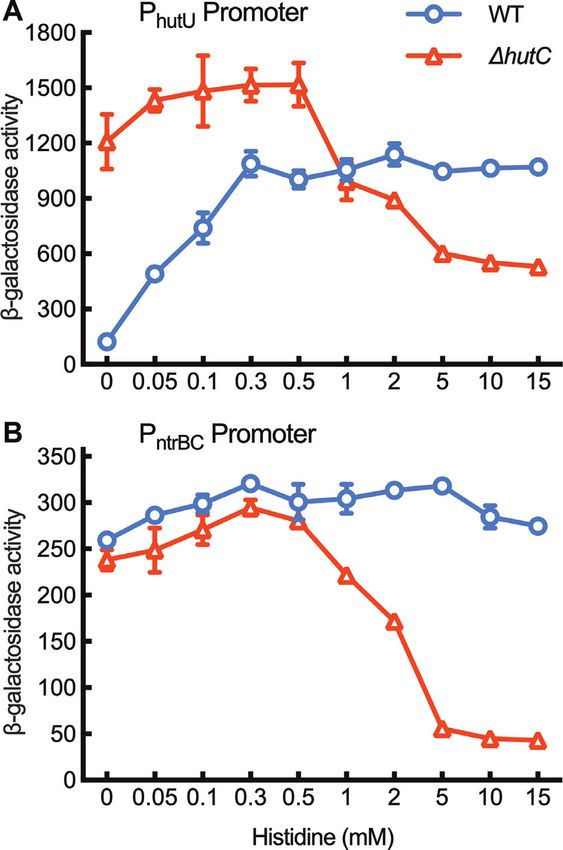
6 Nucleic Acids Research, 2021

                                                                                                                                                                Downloaded from https://academic.oup.com/nar/advance-article/doi/10.1093/nar/gkab091/6155939 by guest on 20 March 2021
Figure 3. Specific interactions between Hfq and its target hut mRNAs. (A) Histidine is sequentially broken down by the following five enzymes: HutH,
histidine ammonia lyase or histidase; HutU, urocanase; HutI, imidazolone propionate (IPA) amidohydrolase; HutF, formiminoglutamate (FIGLU)
iminohydrolase; HutG, formylglutamate (FG) amidohydrolase. (B) Locations of the six putative Crc/Hfq-binding sites are indicated by inverted triangles
above the hut genes. The four oligoribonucleotide probes (1U, 3U, 5H and 6H) are 25 nt in length centred by the predicted Crc/Hfq-binding sequences.
Histidine- and urocanate-induced expression of the three hut operons (hutF, hutCD and hutU-G) is mediated by HutC targeting operator sites located in
the front of hutU and the hutF-C intergenic region. hutTu and hutTh encode the high-affinity transporter for urocanate and histidine, respectively. hutXWV
encodes a high-affinity ABC-type transporter. The hut locus contains two hutH homologues, but hutH1 was not required for bacterial growth on histidine.
The function of hutD remains unknown. (C) EMSA was performed using purified HfqHis6 and each of the four RNA probes labeled with biotin at the
5 -ends. HfqHis6 was added at 0, 55, 110, 220, 330, 440, 550, 660 and 660 nM in lanes 1–9, respectively. A 200-fold molar excess of the same unlabeled probe
was added in lane 9 as a specific competitor for RNA binding. Asterisks on right-hand side of each gel denote positions of the shifted bands.

of increasing concentrations of CbrBHis6 (lanes 2–5). DNA                        mutant probe containing an introduced CbrB-III site in
retardation was eventually abolished with the addition                           PhutU (PD+CbrB3). Indeed, CbrB-binding was increased
of competitor DNAs from low to high concentrations                               though the difference was not significant from the estimated
(lanes 6–7). More importantly, DNA retardation was not                           Kd values (Figure 2E, Supplementary Figure S2). DNA
observed with the mutant probe PD-CbrB1 lacking the                              retardation was eventually abolished by adding competitor
CbrB-I half site (Figure 2D). The data thus confirmed the                        DNA at an increasing concentration from lanes 8 to 10
direct interaction between CbrB and PhutU . Furthermore,                         (Figure 2E). Together, the EMSA data confirmed the results
EMSA was performed with a PcrcZ probe (PcrcZ171), and                            of genetic analysis that NtrC and CbrB directly activate hut
significant shifts were observed when CbrBHis6 was added                         transcription.
at an increasing concentration from lanes 2 to 7 (Figure
2F). PcrcZ is a well-characterized promoter under the direct
                                                                                 hut expression is subject to CCR control mediated by the
control of CbrB in Pseudomonas, including P. fluorescens
                                                                                 CbrAB-CrcYZ-Crc/Hfq cascade
SBW25 (27). CrcZ is also the key mediator for CbrAB to
control hut expression at the post-transcriptional level (see                    The hut locus contains six putative Crc/Hfq-binding sites
details below). CbrB appears to bind PcrcZ with a relatively                     (AAnAAnAA) with four types of sequence variants (Figure
higher affinity than the PhutU promoter (Supplementary                           3B). They are present in hutTh and hutTu genes (encoding
Figure S2). The precise modes of CbrB interaction with                           the histidine- and urocanate-specific transporters), and
DNA is currently poorly understood. It was thus interesting                      also in hutH2 (histidase) and hutU (urocanase) responsible
to note that PcrcZ promoters from different Pseudomonas                          for the enzymatic breakdown of histidine and urocanate,
species contain a third highly conserved CbrB half site                          respectively. This suggests that CCR occurs for histidine
(CbrB-III) (Supplementary Figure S3), which is absent in                         (and urocanate) utilization by targeting substrate uptake
PhutU promoters (Supplementary Figure S4). This suggested                        and the first two enzymes of the histidine catabolic
that CbrB has evolved a low-affinity interaction with                            pathway. To test the predicted molecular interactions
PhutU promoter due to the lack of this CbrB-III site.                            in vitro, we performed EMSAs with HfqHis6 and four
To test this hypothesis, we performed EMSA with a                                oligoribonucleotide probes (25 nt) centred on the putative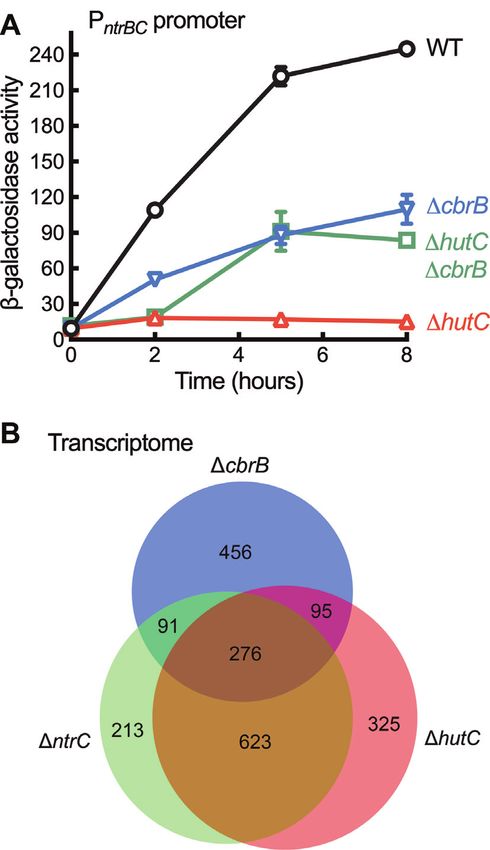
Nucleic Acids Research, 2021 7
Downloaded from https://academic.oup.com/nar/advance-article/doi/10.1093/nar/gkab091/6155939 by guest on 20 March 2021
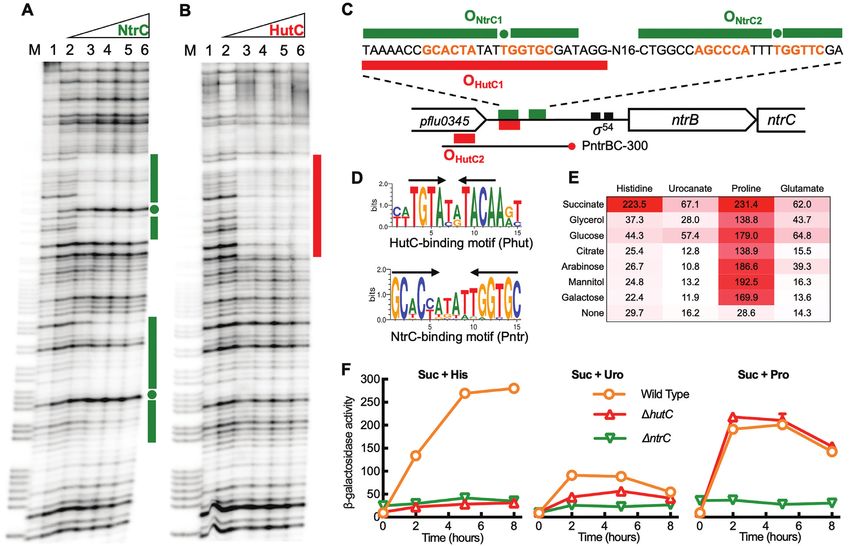
Figure 4. Biochemical and genetic characterization of the ntrBC promoter. (A) Identification of NtrC target sites by DNase I footprinting. Lane M, G+A
marker; lanes 1–6, NtrCHis6 added at an increasing concentration from 0, 0.07, 0.2, 0.54, 1.1 to 1.7 M. NtrC-protected regions are indicated by green
bars, and hypersensitive residues are marked with filled circles. (B) DNase I analysis showing specific interactions between HutCHis6 and PntrBC promoter.
Lane M, G+A marker; lanes 1–6, HutCHis6 added at an increasing amount from 0, 1.16, 2.32, 4.64, 7.54 to 10.44 M. HutC protected region is marked
by a red bar on the right side of the gel image. (C) A schematic map of the PntrBC promoter showing DNA sequences that were protected by NtrC and
HutC from DNase I cleavage. The footprinting assays were performed by using the PntrBC-300 probe with a biotin-labeled 3 -end. (D) Sequence logos
were generated from separate comparative analysis of PhutU and PntrBC promoter regions across 30 Pseudomonas species. Inverted repeats are marked with
arrows. (E) A heat map showing variation in PntrBC promoter activities under different combinations of carbon and nitrogen sources. Bacteria were grown
in minimal salt media supplemented with one of the seven C substrates (20 mM) and an amino acid (10 mM) as the sole N source, as indicated in the
figure. -Galactosidase activity was measured at 0, 2, 5 and 8 h after inoculation, but only mean values at 5 h are shown here for clarity. (F) Levels of PntrBC
expression in wild type, hutC and ntrC backgrounds. Bacteria were grown on succinate (20 mM) plus histidine, urocanate or proline (10 mM). Data
are means and standard errors of six independent cultures.
target sequence (Figure 3C). A significant shift of biotin- hut transcription while de-repressing its expression at
labeled RNA was observed for all four probes (1U, 3U, the translational level through the CrcYZ-Crc/Hfq
5H and 6H) in the presence of increasing concentrations of cascade; NtrBC plays the dominant role in activating hut
HfqHis6 (lanes 2–8). RNA retardation was nearly eliminated transcription. However, an analogous negative feedback
with the addition of excess unlabeled competitor RNA, loop was lacking with regard to homeostatic ntrBC
i.e. the same but unlabeled probe (lane 9). The data thus regulation of hut.
confirm that Hfq specifically targets the hutU-G transcript
(Figure 3B).
Subsequent assays of urocanate consumption, Identifying HutC as a direct regulator for ntrBC expression
gene expression and growth kinetics (summarised in ntrB and ntrC are overlapped by four nucleotides (ATGA),
Supplementary Figures S5–S9) consistently revealed and the promoter region contains a typical 54 -binding
the regulatory interplay between CbrAB and NtrBC. site and two NtrC-binding motifs (designated Pntr) (Figure
Especially in the ‘succinate + histidine’ medium, bacteria 4C). These suggest that ntrBC are co-transcribed and
face an obvious physiological dilemma in regard to hut subject to autoactivation. Results of DNase I footprinting
enzymes. hut expression ought to be maximized as histidine showed that NtrCHis6 has a strong binding affinity
is the sole N source. However, the physiological demand with ONtrC1 (Figure 4A). This is consistent with the
for C is low due to the presence of succinate, and hence prediction that ONtrC1 is the primary target site for ntrBC
hut expression ought to be repressed. Our data showed autoactivation. A relatively weak binding affinity was noted
that under this nutrient condition CbrAB weakly activates for ONtrC2 (Figure 4A).8 Nucleic Acids Research, 2021
Interestingly, the ntrBC locus possesses a typical HutC compared with wild type. More importantly, PntrBC was
binding motif (designated Phut), which is located at expressed normally in hutC when bacteria were grown
the 3 -end of pflu0345 upstream of the ntrBC operon on succinate + proline (Figure 4F). From these datasets
(Figure 4C). This Phut site (OHutC2 ) was shown to have we conclude that the direct HutC/PntrBC interaction is not
negligible effects on ntrBC expression (31). However, in involved in the transcriptional activation of PntrBC . When
the process of OHutC2 functional analysis we surprisingly growing on succinate + histidine, hutC is truly required for
found that HutC was bound to an unexpected DNA PntrBC activation, but the influence most likely be exerted
region containing the dominant Pntr site (ONtrC1 ) for indirectly through effects on the NtrC activator.
NtrC interaction (Figure 4B). The Phut and Pntr sites
share little sequence similarity (Figure 4D). The HutCHis6 -
Downloaded from https://academic.oup.com/nar/advance-article/doi/10.1093/nar/gkab091/6155939 by guest on 20 March 2021
protected region was 3 bp longer than that of NtrCHis6 , HutC acts as a governor of histidine catabolism
and it did not show the hypersensitive bands observed Available data led to a governor’s model which posits
with NtrCHis6 , highlighting the structural difference when that the low-affinity HutC/PntrBC interaction functions
the same probe DNAs (PntrBC-300) were bound with as a negative feedback loop for ntrBC autoactivation,
NtrCHis6 and HutCHis6 (Figure 4A and B). Furthermore, setting an upper bound to the level of hut pathway
we showed that the protein-DNA interaction between activity when histidine fluctuates at high concentrations
HutCHis6 and the PntrBC-300 probe was disrupted by (Figure 5). Hence, the local transcription factor HutC
urocanate (Supplementary Figure S10A). Substitution of plays a previously unrecognised coordinating role in
the Pntr site with random sequence eliminated the HutCHis6 controlling histidine catabolic rate, ensuring that bacterial
binding activity (Supplementary Figure S10B). The binding cells maintain a N-starved physiological condition that is
affinity of HutC with a probe DNA containing the essentially required for NtrC functionality.
Pntr site (PntrBC-196) was measured to be 922.6 nM To further test the governor model, we first investigated
(Supplementary Figure S11), which is relatively much how PntrBC responds to fluctuating C/N ratios in
lower than the Kd with PhutU promoter (44.6 nM) (31). extracellular nutrients. Bacteria were grown in minimal
Together, the in vitro data indicate that HutC is capable media with varying concentrations of succinate relative to
of binding to the primary NtrC operator site (ONtrC1 ), histidine or urocanate (Supplementary Figure S12). The
and thus, it has the potential to directly inhibit ntrBC data revealed a significant positive correlation between
transcription. PntrBC activities and C/N ratios (Spearman’s rho = 0.976,
P < 0.0001 for histidine; rho = 0.891, P = 0.0011 for
urocanate). Next, we tested PntrBC expression in response to
HutC is functionally required for ntrBC expression
intracellular dynamics of hut catabolism. Results described
To test the hypothesis that HutC fine-tunes ntrBC above show that PntrBC expression was abolished in hutC
expression, we first compared PntrBC -lacZ promoter cells grown on succinate (20 mM) and histidine (10 mM).
activities in wild type and two isogenic mutants hutC The governor model posits that NtrC-inactivation was
and ntrC in succinate + histidine medium (Figure 4F). caused by over-expression of hut genes and the consequent
PntrBC was not expressed in ntrC background, which is build-up of excess N. Therefore, if we introduce a cbrB
consistent with the predicted role of NtrC in activating mutation into hutC background, hut expression will be
PntrBC . However, PntrBC expression was also abolished in greatly reduced as a result of strong CCR in addition to
the hutC background. This result was initially surprising the lack of CbrB-mediated weak promoter activity; and
as it cannot be explained by the known function of HutC consequently, PntrBC expression should be restored in the
as a transcriptional repressor. double deletion mutant (cbrB hutC). Indeed, PntrBC
Next, we systematically assessed PntrBC activities when expression was detected in cbrB hutC background from
the wild-type strain was grown on seven different carbon five hours after inoculation (Figure 6A).
sources (succinate, glycerol, glucose, citrate, arabinose, Given that ntrBC is not expressed in hutC for cells
mannitol and galactose) and five nitrogen sources (histidine, grown on succinate (20 mM) and histidine (10 mM), we
urocanate, proline, glutamate and NH4 Cl). Results indicate would expect a large set of genes in the NtrC regulon
that PntrBC was not expressed in NH4 Cl-containing media to be affected by hutC deletion. This has been evidenced
(data not shown). PntrBC was expressed at high levels on by a comparative transcriptome (RNA-seq) analysis of
proline regardless of the carbon sources (Figure 4E). When three mutants (ntrC, hutC and cbrB) relative to wild
histidine was the sole N source, only succinate can greatly type. The ntrC and hutC mutants shared a total of
enhance PntrBC expression. Despite the fact that histidine 899 differentially expressed genes (DEGs), which represents
breakdown generates one more ammonium than urocanate, 68.16% DEGs detected for the hutC mutant (Figure
PntrBC was generally expressed at higher levels on histidine 6B and Supplementary Figure S13). These include genes
than on urocanate (Figure 4E). involved in nitrogen metabolism, siderophore production
With this knowledge, we proceeded to compare PntrBC and the synthesis of exopolysaccharides and flagella
expression in wild type and hutC by growing bacteria (Supplementary dataset 1).
on succinate-containing media with histidine, urocanate or Finally, we measured PntrBC and PhutU activities by
proline as the sole N source (Figure 4F). In the hutC growing wild type and hutC mutant in minimal salt
background, PntrBC was not expressed on histidine, but it medium supplemented with 20 mM succinate and varying
was expressed on urocanate albeit at reduced levels when concentrations of histidine. The model posits that PntrBCNucleic Acids Research, 2021 9
Downloaded from https://academic.oup.com/nar/advance-article/doi/10.1093/nar/gkab091/6155939 by guest on 20 March 2021
Figure 5. C/N homeostatic regulation of hut genes by CbrAB, NtrBC and HutC. When histidine is utilized as a N source, transcription of hut genes is
predominantly activated by NtrBC whose expression is autoactivated and involves repression by HutC as a negative feedback loop. HutC thus coordinates
the expression of hut genes, hutC itself and the NtrBC activator in a histidine concentration-dependent manner. Utilization of histidine as a C source
is subject to succinate-induced CCR control. In succinate-deplete media, CbrAB activates hut transcription while de-repressing the translation of hut
mRNA mediated by the Crc/Hfq complex, which is sequestrated by the CbrAB-activated ncRNAs (CrcY and CrcZ). Of note, the CbrA sensor kinase can
potentially detect histidine availability (52,54).
ought to be expressed at constant high levels in wild help prevent the expression levels of ntrBC and hut genes
type, and the expression cannot be maintained in hutC, from exceeding their critical upper limits.
particularly in histidine-replete environments. As for PhutU , HutC is a typical substrate-specific transcriptional
it ought to display a typical pattern of concentration- regulator, controlling the expression of hut genes for
dependant induction along with the increase of histidine histidine uptake and breakdown (23,31,42). HutC de-
abundance. In the hutC background, PhutU should be repression involves a positive feedback loop, which means
fully expressed at low histidine concentrations as we would that the activity of hut enzymes scales as a function
normally expect for a substrate-specific transcriptional of histidine availability (Figure 5). This is problematic
repressor, but the expression cannot be maintained in in two accounts: first, excessive intracellular ammonium
histidine-replete environments without HutC fine-tuning is poisonous to the cell; and second, ammonium sends
the PntrBC promoter activities. The results shown in Figure a ‘N-replete’ signal to the NtrBC system leading to its
7 are fully consistent with these predictions. inactivation. This physiological challenge is more serious
for Pseudomonas strains as they use the 5-step hut pathway
DISCUSSION producing an additional ammonium compared with the
four-step pathway adopted by most enteric bacteria (Figure
Cells, like engines, are complex machines. Proper function 3A) (16).
of an engine requires the activity of individual parts to Available evidence suggest that at least four distinct
be maintained within acceptable bounds. A critical device mechanisms are involved in the speed control of hut
in this regard is the governor - an element that measures catabolism in Pseudomonas. First, hutD (a gene co-
and regulates the speed of an engine, protecting it from transcribed with hutC encoding a hypothetical protein)
damage due to excessive rotational speed. While parallels has an implicated function to prevent the accumulation
in the design of machines and living systems are not of hut intermediates (i.e. formylglutamate) (43). Deletion
uncommon (39), the governor-mode of regulatory control of hutD resulted in hut expression at higher levels and
has rarely been observed in living cells (40,41). Here, we caused a significant fitness reduction for bacterial growth
describe a new function for the HutC repressor whose on histidine (23). Secondly, at the present study we revealed
behaviour is analogous to a governor. More specifically, that NtrBC activates hut expression in a direct manner. This
HutC detects histidine availability, and meanwhile regulates is different from enteric bacteria wherein NtrBC indirectly
the rate of hut catabolism through directly targeting the activates hut genes through the NAC regulator (20). The
ntrBC promoter DNA. This negative feedback loop can direct control mode is thus likely evolved in Pseudomonas10 Nucleic Acids Research, 2021
Downloaded from https://academic.oup.com/nar/advance-article/doi/10.1093/nar/gkab091/6155939 by guest on 20 March 2021
Figure 6. Role of hutC in determining PntrBC promoter activities and the
Figure 7. Role of hutC in maintaining PhutU and PntrBC expression in
global profiles of gene expression. (A) PntrBC -lacZ expression in wild type
histidine-replete environments. Wild-type and hutC mutant cells were
(WT) and three isogenic mutants devoid of hutC and/or cbrB. Data are
N-starved for 2 hours in minimal salt medium supplemented with 20
means and standard errors of three independent cultures on succinate
mM succinate (A600 = ∼0.1). Bacterial growth started with the addition
(20 mM) and histidine (10 mM). Two-way ANOVA revealed significant
of histidine at varying concentrations shown in x-axis in a nonlinear
differences between genotypes (F3,8 = 678.6, P < 0.0001). (B) A Venn
scale. -Galactosidase activities were measured at 5 hours after addition
diagram showing the numbers of DEGs in mutants cbrB, ntrC and
of histidine. Data are means and standard errors of three independent
hutC. Total RNA was prepared from three biological replicates of
cultures. (A) PhutU promoter activities. Two-way ANOVA revealed a
bacterial cells exponentially grown on succinate (20 mM) and histidine
significant interaction between genotype and medium (F9,40 = 99.92, P <
(10 mM). Expression was detected by RNA-seq analysis for ∼97% of the
0.0001). Differences between wild type and hutC were highly significant
predicted genes in the SBW25 genome.
(P < 0.001) in all mediums except 1 mM histidine. (B) PntrBC promoter
activities. Two-way ANOVA revealed a significant interaction between
genotype and medium (F9,40 = 141.3, P < 0.0001). Multiple t-tests show
as a strategy to improve the response time to the N status that differences between genotypes were highly significant (P < 0.001)
of the cell. when histidine was added at 1 mM or above.
The third potential mechanism involves ntrBC
autorepression. Like many other TCSs, the ntrBC system
is subject to autoactivation (4,14), and it has been well activity when the intracellular NtrC∼P is high (41).
established that such a positive feedback loop is associated A coupled autorepression has been described in other
with a delayed response (44,45). Hence, P. fluorescens must positively autoregulated TCSs, such as PhoB/PhoR (47).
have evolved additional mechanisms to overcome the fitness Gao and Stock (13) has recently demonstrated that a
cost of autoactivation ensuring that ntrBC is expressed high-affinity activation site of phoBR allows a fast response
at optimal levels. In E. coli, ntrBC (also called glnLG) is at low transcription factor (TF) levels, while the low-
located downstream of the glnA gene encoding glutamine affinity site enables repression at high TF levels and ensures
synthetase. NtrC∼P activates ntrBC expression from a that expression of the TF does not exceed the optimal
strong 54 -dependent promoter (glnAp2), while repressing levels. In the present study, we identified a low-affinity
the expression of two weak 70 -dependent promoters NtrC-binding site in the PntrBC promoter of P. fluorescens
(glnAp1 and glnLp) (15). Moreover, the CAP-cAMP SBW25 (Figure 4A) and revealed similar patterns of
complex plays an inhibitory role in the NtrBC-mediated strong and weak NtrC-binding sites in the ntrBC loci of
glnAp2 activity (46). The complex interactions between Pseudomonas spp. including P. aeruginosa and P. putida
NtrC∼P and CAP-cAMP allow the integration of both C (Supplementary Figure S14). Therefore, autorepression at
and N nutrient signals into ntrBC expression. Interestingly, the low-affinity site is most likely a mechanism also adopted
Atkinson et al. identified a low-affinity NtrC-binding site by Pseudomonas for preventing ntrBC over-expression.
in the glnAp2 promoter region, constituting a ‘governor’ Such an autorepression mechanism is seemingly crucial
responsible for setting the upper boundary of the promoter for NtrBC to play its general role as a master nitrogenNucleic Acids Research, 2021 11
regulator, but it appears to be insufficient for maintaining of the CbrA sensor kinase. Its C-terminal autokinase
C/N homeostasis for the utilization of histidine. To prevent domain is connected to a putative transporter in the
NtrBC from ‘stalling’, the hut catabolic rate signal ought sodium/solute symporter family (SSSF, TC 2A.21). In a
to be integrated into the transcriptional control of ntrBC. previous work, we genetically characterised the cbrA gene of
The fourth mechanism concerns HutC acting as an ideal P. fluorescens SBW25, and the results suggested that the N-
governor of hut catabolism. HutC allows the NtrBC system terminal SSSF domain of CbrA plays a dual role in histidine
to directly sense histidine availability in addition to the uptake and sensing (52). Interestingly, the histidine-specific
general C/N status of the cell. A key piece of evidence transport activities have recently been demonstrated for
leading to the governor’s model was the specific binding of CbrA in P. putida KT2440 (54). The transporter domain
HutC with the PntrBC promoter DNA as revealed by DNase is not essentially required for phosphoryl transfer between
Downloaded from https://academic.oup.com/nar/advance-article/doi/10.1093/nar/gkab091/6155939 by guest on 20 March 2021
I footprinting (Figure 4B). Given that hutC expression CbrA and CbrB, but it is likely involved in modulating the
is subject to autoregulation, the low-affinity HutC-PntrBC CbrA autokinase activity (54). If CbrA is capable of sensing
interaction is functionally significant only when histidine is histidine availability by itself, it then makes sense that
present at high concentrations (and HutC is consequently HutC is not involved in fine-tuning the expression of CbrA
abundant within the cell). When there is little or no and CbrB. Together, the new modes of gene regulation
histidine in the environment, the HutC-PntrBC interaction revealed in this study highlight the functioning principles
will be negligible and produce no significant effects on that are commonly found in living systems and artificial
the expression of other nitrogen catabolic genes in the machines, and have important practical implications in
NtrBC regulon. This was evidenced by PntrBC expression in synthetic biology (55).
succinate + proline medium (Figure 4F).
It is interesting to note that the 28-bp HutC-protected
region contains the highly conserved NtrC-binding site DATA AVAILABILITY
(Pntr) but shows little sequence similarity with the HutC The RNA-seq data have been deposited in NCBI’s Gene
consensus sequence (Phut) previously identified from the Expression Omnibus with accession number GSE160152.
alignment of hut promoters (31). This finding is seemingly
against the general concept that each TF recognizes a single
consensus DNA sequence (or binding-site motif) (48). SUPPLEMENTARY DATA
However, recently it has been found that some eukaryotic Supplementary Data are available at NAR Online.
TFs have evolved the ability to recognize multiple DNA
binding-site motifs (49). Eukaryotic TFs can potentially
read the shape of the DNA molecule (not just the base ACKNOWLEDGEMENTS
sequence) as a major source of information for specific We thank Paul Rainey for his mentorship, Jacob Malone
site recognition (50). For prokaryotic TFs, they typically and Tim Cooper for helpful discussions, and Kiran
recognize longer DNA sequences, which are considered Jayan, Yunhao Liu and Jonathan Gauntlett for technical
sufficient to ensure specificity in small genomes (48). Given assistance. N.N. was a recipient of a Massey University
that TFs usually display some degrees of low-affinity DNA Doctoral Scholarship. X.-X.Z. acknowledges support from
binding, it is highly possible that prokaryotic TFs, such the Massey University Research Foundation (MURF) and
as HutC, may have evolved specific binding to distinct MBIE Catalyst Fund, New Zealand (project no. 92846082).
DNA sites conferring new functions to be integrated into
a sophisticated regulatory network (51).
Finally, we have resolved the CCR mechanism for FUNDING
histidine utilization in P. fluorescens SBW25. CbrAB is Massey University Research Foundation (MURF); New
directly involved in activating hut transcription while Zealand Ministry for Business, Innovation and
indirectly de-repressing hut translation through the CbrAB- Employment (MBIE) Catalyst Fund [92846082 to X.-
CrcYZ-Crc/Hfq cascade in response to the availability of X.Z.]. Funding for open access charge: Massey University
C sources. Unlike ntrBC, expression of cbrA/cbrB and Research Foundation.
their modes of action remain largely rudimentary (52). Conflict of interest statement. None declared.
cbrB is likely transcribed from its own promoter (18,19),
whereas the expression of cbrA is translationally coupled
with the preceding gene called cbrX (53). There has been REFERENCES
no evidence suggesting that NtrBC is directly involved in 1. Stock,A.M., Robinson,V.L. and Goudreau,P.N. (2000)
cbrAB expression (and vice versa). Therefore, the C/N Two-component signal transduction. Annu. Rev. Biochem., 69,
homeostasis is mainly maintained through the interplay 183–215.
between CbrB∼P and NtrC∼P at the operator sites of 2. Zschiedrich,C.P., Keidel,V. and Szurmant,H. (2016) Molecular
the PhutU promoter. More importantly, various feedback mechanisms of two-component signal transduction. J. Mol. Biol.,
428, 3752–3775.
loops are involved in fine-tuning the CbrAB- and NtrBC- 3. Igo,M.M., Slauch,J.M. and Silhavy,T.J. (1990) Signal transduction in
mediated hut activation (Figure 5), which includes HutC bacteria: kinases that control gene expression. New Biol., 2, 5–9.
acting as a governor for the positively autoregulated NtrBC 4. Groisman,E.A. (2016) Feedback control of two-component
system. regulatory systems. Annu. Rev. Microbiol., 70, 103–124.
5. Goulian,M. (2010) Two-component signaling circuit structure and
However, it appears that CbrAB is not subject to direct properties. Curr. Opin. Microbiol., 13, 184–189.
control by the HutC governor and one may wonder why. A 6. Bourret,R.B. (2017) Learning from adversity? J. Bacteriol., 199,
possible explanation resides in the unique domain structure e00420–00417.12 Nucleic Acids Research, 2021
7. Mitrophanov,A.Y. and Groisman,E.A. (2008) Positive feedback in 30. Hester,K.L., Lehman,J., Najar,F., Song,L., Roe,B.A.,
cellular control systems. Bioessays, 30, 542–555. MacGregor,C.H., Hager,P.W., Phibbs,P.V. and Sokatch,J.R. (2000)
8. Gao,R., Godfrey,K.A., Sufian,M.A. and Stock,A.M. (2017) Crc is involved in catabolite repression control of the bkd operons of
Counterbalancing regulation in response memory of a positively Pseudomonas putida and Pseudomonas aeruginosa. J. Bacteriol., 182,
autoregulated two-component system. J. Bacteriol., 199, e00390-17. 1144–1149.
9. Hermsen,R., Erickson,D.W. and Hwa,T. (2011) Speed, sensitivity, 31. Naren,N. and Zhang,X.X. (2020) Global regulatory roles of the
and bistability in auto-activating signaling circuits. PLoS Comput. histidine-responsive transcriptional repressor HutC in Pseudomonas
Biol., 7, e1002265. fluorescens SBW25. J. Bacteriol., 202, e00792-19.
10. Maeda,Y.T. and Sano,M. (2006) Regulatory dynamics of synthetic 32. Silby,M.W., Cerdeno-Tarraga,A.M., Vernikos,G.S., Giddens,S.R.,
gene networks with positive feedback. J. Mol. Biol., 359, 1107–1124. Jackson,R.W., Preston,G.M., Zhang,X.X., Moon,C.D., Gehrig,S.M.,
11. Stein,B.J., Fiebig,A. and Crosson,S. (2020) Feedback control of a Godfrey,S.A. et al. (2009) Genomic and genetic analyses of diversity
two-component signaling system by an Fe-S-binding receiver domain. and plant interactions of Pseudomonas fluorescens. Genome Biol., 10,
Downloaded from https://academic.oup.com/nar/advance-article/doi/10.1093/nar/gkab091/6155939 by guest on 20 March 2021
mBio, 11, e03383-19. R51.
12. Ray,J.C. and Igoshin,O.A. (2010) Adaptable functionality of 33. Horton,R.M., Hunt,H.D., Ho,S.N., Pullen,J.K. and Pease,L.R.
transcriptional feedback in bacterial two-component systems. PLoS (1989) Engineering hybrid genes without the use of restriction
Comput. Biol., 6, e1000676. enzymes: gene splicing by overlap extension. Gene, 77, 61–68.
13. Gao,R. and Stock,A.M. (2018) Overcoming the cost of positive 34. Rainey,P.B. (1999) Adaptation of Pseudomonas fluorescens to the
autoregulation by accelerating the response with a coupled negative plant rhizosphere. Environ. Microbiol., 1, 243–257.
feedback. Cell Rep., 24, 3061–3071. 35. Choi,K.H., Gaynor,J.B., White,K.G., Lopez,C., Bosio,C.M.,
14. Ninfa,A.J. and Magasanik,B. (1986) Covalent modification of the Karkhoff-Schweizer,R.R. and Schweizer,H.P. (2005) A Tn7-based
glnG product, NRI, by the glnL product, NRII, regulates the broad-range bacterial cloning and expression system. Nat. Methods,
transcription of the glnALG operon in Escherichia coli. Proc. Natl. 2, 443–448.
Acad. Sci. U.S.A., 83, 5909–5913. 36. Bao,Y., Lies,D.P., Fu,H. and Roberts,G.P. (1991) An improved
15. Schumacher,J., Behrends,V., Pan,Z.S., Brown,D.R., Heydenreich,F., Tn7-based system for the single-copy insertion of cloned genes into
Lewis,M.R., Bennett,M.H., Razzaghi,B., Komorowski,M., chromosomes of Gram-negative bacteria. Gene, 109, 167–168.
Barahona,M. et al. (2013) Nitrogen and carbon status are integrated 37. Liu,Y., Rainey,P.B. and Zhang,X.X. (2014) Mini-Tn7 vectors for
at the transcriptional level by the nitrogen regulator NtrC in vivo. studying post-transcriptional gene expression in Pseudomonas. J.
Mbio, 4, e00881-13. Microbiol. Methods, 107, 182–185.
16. Bender,R.A. (2010) A NAC for regulating metabolism: the nitrogen 38. Maxam,A.M. and Gilbert,W. (1980) Sequencing end-labeled DNA
assimilation control protein (NAC) from Klebsiella pneumoniae. J. with base-specific chemical cleavages. Methods Enzymol., 65,
Bacteriol., 192, 4801–4811. 499–560.
17. Lonergan,Z.R., Palmer,L.D. and Skaar,E.P. (2020) Histidine 39. Alberts,B. (1998) The cell as a collection of protein machines:
utilization is a critical determinant of Acinetobacter pathogenesis. preparing the next generation of molecular biologists. Cell, 92,
Infect. Immun., 88, e00118-20. 291–294.
18. Zhang,X.X. and Rainey,P.B. (2008) Dual involvement of CbrAB and 40. Noakes,T.D., Peltonen,J.E. and Rusko,H.K. (2001) Evidence that a
NtrBC in the regulation of histidine utilization in Pseudomonas central governor regulates exercise performance during acute hypoxia
fluorescens SBW25. Genetics, 178, 185–195. and hyperoxia. J. Exp. Biol., 204, 3225–3234.
19. Nishijyo,T., Haas,D. and Itoh,Y. (2001) The CbrA-CbrB 41. Atkinson,M.R., Pattaramanon,N. and Ninfa,A.J. (2002) Governor of
two-component regulatory system controls the utilization of multiple the glnAp2 promoter of Escherichia coli. Mol. Microbiol., 46,
carbon and nitrogen sources in Pseudomonas aeruginosa. Mol. 1247–1257.
Microbiol., 40, 917–931. 42. Allison,S.L. and Phillips,A.T. (1990) Nucleotide sequence of the gene
20. Bender,R.A. (2012) Regulation of the histidine utilization (hut) encoding the repressor for the histidine utilization genes of
system in bacteria. Microbiol. Mol. Biol. Rev., 76, 565–584. Pseudomonas putida. J. Bacteriol., 172, 5470–5476.
21. Magasanik,B. (1961) Catabolite repression. Cold Spring Harb. Symp. 43. Gerth,M.L., Liu,Y., Jiao,W., Zhang,X.X., Baker,E.N., Lott,J.S.,
Quant. Biol., 26, 249–256. Rainey,P.B. and Johnston,J.M. (2017) Crystal structure of a bicupin
22. Rojo,F. (2010) Carbon catabolite repression in Pseudomonas: protein HutD involved in histidine utilization in Pseudomonas.
optimizing metabolic versatility and interactions with the Proteins, 85, 1580–1588.
environment. FEMS Microbiol. Rev., 34, 658–684. 44. Gao,R. and Stock,A.M. (2017) Quantitative kinetic analyses of
23. Zhang,X.X. and Rainey,P.B. (2007) Genetic analysis of the histidine shutting off a two-component system. mBio, 8, e00412-17.
utilization (hut) genes in Pseudomonas fluorescens SBW25. Genetics, 45. Mitrophanov,A.Y., Hadley,T.J. and Groisman,E.A. (2010) Positive
176, 2165–2176. autoregulation shapes response timing and intensity in
24. Phillips,A.T. and Mulfinger,L.M. (1981) Cyclic adenosine two-component signal transduction systems. J. Mol. Biol., 401,
3’,5’-monophosphate levels in Pseudomonas putida and Pseudomonas 671–680.
aeruginosa during induction and carbon catabolite repression of 46. Mao,X.J., Huo,Y.X., Buck,M., Kolb,A. and Wang,Y.P. (2007)
histidase synthesis. J. Bacteriol., 145, 1286–1292. Interplay between CRP-cAMP and PII-Ntr systems forms novel
25. Suh,S.J., Runyen-Janecky,L.J., Maleniak,T.C., Hager,P., regulatory network between carbon metabolism and nitrogen
MacGregor,C.H., Zielinski-Mozny,N.A., Phibbs,P.V. and assimilation in Escherichia coli. Nucleic Acids Res., 35, 1432–1440.
West,S.E.H. (2002) Effect of vfr mutation on global gene expression 47. Diniz,M.M., Goulart,C.L., Barbosa,L.C., Farache,J., Lery,L.M.,
and catabolite repression control of Pseudomonas aeruginosa. Pacheco,A.B., Bisch,P.M. and von Kruger,W.M. (2011) Fine-tuning
Microbiology, 148, 1561–1569. control of phoBR expression in Vibrio cholerae by binding of phoB to
26. Hug,D.H., Roth,D. and Hunter,J. (1968) Regulation of histidine multiple pho boxes. J. Bacteriol., 193, 6929–6938.
catabolism by succinate in Pseudomonas putida. J. Bacteriol., 96, 48. Todeschini,A.L., Georges,A. and Veitia,R.A. (2014) Transcription
396–402. factors: specific DNA binding and specific gene regulation. Trends
27. Liu,Y.H., Gokhale,C.S., Rainey,P.B. and Zhang,X.X. (2017) Genet., 30, 211–219.
Unravelling the complexity and redundancy of carbon catabolic 49. Siggers,T. and Gordan,R. (2014) Protein-DNA binding: complexities
repression in Pseudomonas fluorescens SBW25. Mol. Microbiol., 105, and multi-protein codes. Nucleic. Acids. Res., 42, 2099–2111.
589–605. 50. Inukai,S., Kock,K.H. and Bulyk,M.L. (2017) Transcription
28. Sonnleitner,E., Abdou,L. and Haas,D. (2009) Small RNA as global factor-DNA binding: beyond binding site motifs. Curr. Opin. Genet.
regulator of carbon catabolite repression in Pseudomonas aeruginosa. Dev., 43, 110–119.
Proc. Natl. Acad. Sci. U.S.A., 106, 21866–21871. 51. Nakagawa,S., Gisselbrecht,S.S., Rogers,J.M., Hartl,D.L. and
29. Moreno,R., Marzi,S., Romby,P. and Rojo,F. (2009) The Crc global Bulyk,M.L. (2013) DNA-binding specificity changes in the evolution
regulator binds to an unpaired A-rich motif at the Pseudomonas of forkhead transcription factors. Proc. Natl. Acad. Sci. U. S. A., 110,
putida alkS mRNA coding sequence and inhibits translation 12349–12354.
initiation. Nucleic. Acids. Res., 37, 7678–7690.You can also read