Genome wide identification of potential biomarkers in multiple myeloma using meta analysis of mRNA and miRNA expression data - Nature
←
→
Page content transcription
If your browser does not render page correctly, please read the page content below
www.nature.com/scientificreports

                OPEN              Genome‑wide identification
                                  of potential biomarkers in multiple
                                  myeloma using meta‑analysis
                                  of mRNA and miRNA expression
                                  data
                                  Amit Katiyar1,2,3, Gurvinder Kaur4,5, Lata Rani4,5, Lingaraja Jena4, Harpreet Singh2,
                                  Lalit Kumar6, Atul Sharma6, Punit Kaur1,3* & Ritu Gupta4,5*

                                  Multiple myeloma (MM) is a plasma cell malignancy with diverse clinical phenotypes and molecular
                                  heterogeneity not completely understood. Differentially expressed genes (DEGs) and miRNAs
                                  (DEMs) in MM may influence disease pathogenesis, clinical presentation / drug sensitivities. But these
                                  signatures overlap meagrely plausibly due to complexity of myeloma genome, diversity in primary
                                  cells studied, molecular technologies/ analytical tools utilized. This warrants further investigations
                                  since DEGs/DEMs can impact clinical outcomes and guide personalized therapy. We have conducted
                                  genome-wide meta-analysis of DEGs/DEMs in MM versus Normal Plasma Cells (NPCs) and derived
                                  unified putative signatures for MM. 100 DEMs and 1,362 DEGs were found deranged between MM
                                  and NPCs. Signatures of 37 DEMs (‘Union 37’) and 154 DEGs (‘Union 154’) were deduced that shared
                                  17 DEMs and 22 DEGs with published prognostic signatures, respectively. Two miRs (miR-16–2-3p,
                                  30d-2-3p) correlated with survival outcomes. PPI analysis identified 5 topmost functionally connected
                                  hub genes (UBC, ITGA4, HSP90AB1, VCAM1, VCP). Transcription factor regulatory networks were
                                  determined for five seed DEGs with ≥ 4 biomarker applications (CDKN1A, CDKN2A, MMP9, IGF1,
                                  MKI67) and three topmost up/ down regulated DEMs (miR-23b, 195, let7b/ miR-20a, 155, 92a). Further
                                  studies are warranted to establish and translate prognostic potential of these signatures for MM.

                                  Abbreviations
                                  BP	Biological process
                                  DAVID	Database for annotation, visualization and integrated discovery
                                  DEG	Differentially expressed genes
                                  DEM	Differentially expressed miRNAs
                                  FDR	False discovery rate
                                  GEO	Gene expression omnibus
                                  GO	Gene ontology
                                  IPA	Ingenuity pathway analysis
                                  KEGG	Kyoto encyclopedia of genes and genomes
                                  MM	Multiple myeloma
                                  miRNA	MicroRNA
                                  NCBI	National Center for Biotechnology Information
                                  PPI	Protein–protein interaction

                                  1
                                   Bioinformatics Facility, Centralized Core Research Facility, All India Institute of Medical Sciences, Ansari Nagar,
                                  New Delhi 110029, India. 2ICMR‑AIIMS Computational Genomics Centre, Division of Biomedical Informatics, Indian
                                  Council of Medical Research, Ansari Nagar, New Delhi 110029, India. 3Department of Biophysics, All India Institute
                                  of Medical Sciences, Ansari Nagar, New Delhi 110029, India. 4Laboratory Oncology Unit, Dr B. R. A. Institute Rotary
                                  Cancer Hospital, All India Institute of Medical Sciences, New Delhi 110029, India. 5Genomics Facility, Centralized
                                  Core Research Facility, All India Institute of Medical Sciences, Ansari Nagar, New Delhi 110029, India. 6Department
                                  of Medical Oncology, Dr B. R. A. Institute Rotary Cancer Hospital, All India Institute of Medical Sciences, Ansari
                                  Nagar, New Delhi 110029, India. *email: punitkaur1@hotmail.com; drritugupta@gmail.com

Scientific Reports |   (2021) 11:10957                | https://doi.org/10.1038/s41598-021-90424-y                                                  1

                                                                                                                                               Vol.:(0123456789)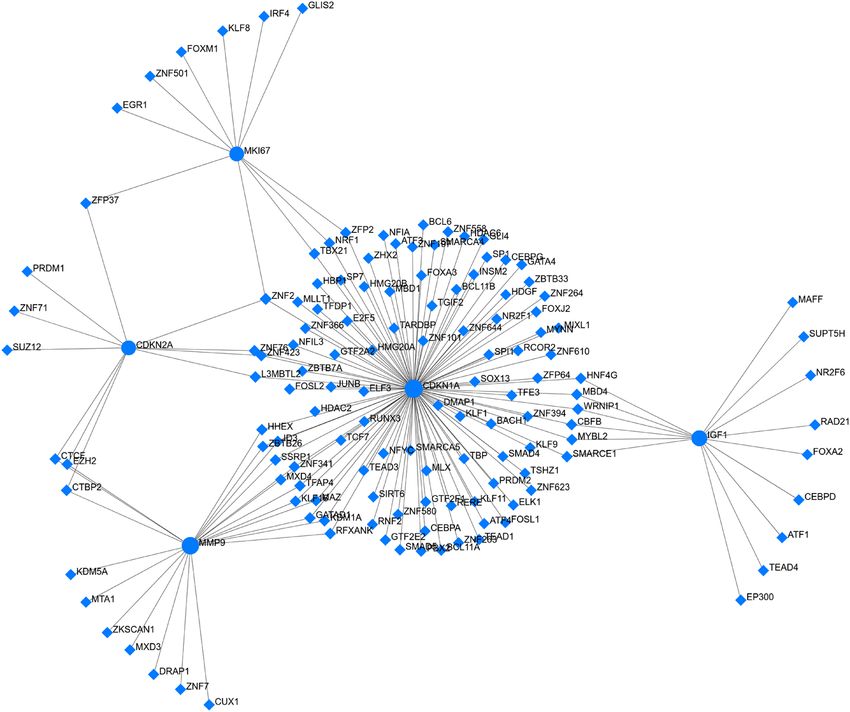
www.nature.com/scientificreports/
Multiple myeloma (MM) is a neoplasm of plasma cells with heterogeneous clinical symptoms, complex cytoge-
netic aberrations, multiple copy number variations (CNVs), single nucleotide variations (SNVs), alternate splic-
ing events and epigenetic modifications. Nearly 50% of the MM patients have hyperdiploid k aryotypes1 with
trisomy of chromosomes 3, 5, 7, 9, 11, 15, 19 or 21 while most of the nonhyperdiploid patients develop recur-
rent translocations between IgH locus and multiple partner genes (such as t(4;14) involving MMSET/FGFR3,
t(6;14) CCND3, t(11;14) CCND1, t(14;16) MAF and t(14;20) MAFB). The frequently encountered CNVs in
MM include gains (1q22, 2p14, 3p24.3, 3q26.2, 5q35.2, 6p24.3, 7q22.1, 8q24.2, 9q34.13, 11q13.2, 12q34.21,
15q24.2, 17q23.2, 19p13.2, 20q11.22, 22q13.1) and losses (1p21.3, 4p15.31, 4q13.1, 6q25.3, 7q11.22, 8p22, 9p24.1,
10q24.33, 12p13.1, 12q21.33, 13q21.33, 14q32.32, 16p13.3)1,2. In addition, a number of driver mutations occur
in genes such as KRAS, NRAS, FAM46C, BRAF, TP53, MYC and others that drive disease progression from
premalignant Monoclonal Gammaopathy of Undetermined Significance (MGUS) / Smouldering MM (SMM)
to active MM3–5. Single base substitution based mutation signatures have also been identified in the myeloma
genomic landscape that are useful in understanding evolutionary clonal trajectories and other disease aspects
in precedence6.
Expression profiles of differentially expressed genes (DEGs) are of paramount importance and have provided
critical prognostic insights in MM. Recent transcriptome based studies have reported gene expression prognos-
tic (GEP) signatures associated with tumor classification, survival risk p rediction7,8, progression of M M7,9–12,
response to d rugs13, chromosome instbility14 and others. The DEGs included in GEP signatures are diverse but
closely connected to similar pathways. These genes may relate to k inome15, autophagy16, cell c ycle10,17, stemness18,
cytogenetic abnormalities9,19, chromosome 120, homozygous deletions, cell death21 and immune7 subnetworks. At
least 8 to 10 molecular subgroups of MM based on the genomic and transcriptomic patterns have been reported
that tend to correlate with different clinical o utcomes8. Computational and functional analysis of hub genes,
nodes, networks and pathways in MM have led to the development of risk scoring systems, relating to the seven
genetic subgroups22, 70 genes UAMS70 risk s ignatures20, IFM15 risk stratification17, 5 gene stemness s core18,
UAMS 1723, CINGLEC 21414, HOVON-65/GMMG-HD4 EMC 9 29, HZD 9 721, M3CN10 and others.
However, the prognostic scores derived from GEP signatures have low prediction accuracy and limited
power to predict risk or response23 perhaps due to MM heterogeneity and complex interactions between malig-
nant plasma cells and bone marrow environment. A landmark study reported GEP prognostication could be
improved when a combination of EMC92 + HZDCD24 was used. A similar integrative M3CN network s tudy10
on MMRF-CoMMpass cohort unified eight prognostic gene signatures and demonstrated significantly improved
prognostic performance.
Alterations in expression profiles of genes and small non-coding RNAs, especially, the miRNA, are frequently
encountered in MM. Global miRNA expression s tudies25–28 have elucidated a multitude of DEMs in MM. DEMs
have been associated with pathogenesis of MM, drug resistance, clinical presentation of disease and clinical
outcomes29–34. For instance, IL6 inducible miR-21 has been observed at higher expression levels in MM than
normal PCs (NPCs)33. Similarly, miR-106b, miR-181a, miR-181b, miR-1, miR-133a are upregulated in MGUS
while miR-17, miR-32 are upregulated exclusively in MM33. Another study30 reported decreased levels of let-7a,
let-7b, miR-15a, miR-16, miR-20a, and miR-106b both in bone marrow and blood plasma of MM as compared
to controls. Aberrant levels of let-7i, miR-15a, miR-16 and miR-106b were found in serum of MGUS while miR-
21, miR-223 and miR-361 were deranged exclusively in MM, indicating their roles in early and later events in
progression respectively30. Correlations of miRs with drug resistance such as miR-29b, miR-202, miR-451 with
Bortezomib, miR-125b, miR-137 with Dexamethasone and; miR-140, miR-451 and miR- 152 with Melphalan
have been r eported35,36. Some of the DEMs occur in association with specific cytogenetic subgroups of M M37. For
example, 1q gain has been correlated with overexpression of miR-1231, 205, 215, 488; 19q gain with upregulation
of miR-520a-5p, miR-518d-5p, miR-498, miR-520 g; del13q with downregulated miR15a/16 cluster, miR-17–92
family (miR-17, miR-19a, miR-20a); and 17pdel with reduced expression of miR-22. Similarly, deregulation
of miR-133b, miR-135b, miR-155,miR-193a, miR-203, miR-146a, miR-215, miR-342, miR-375, miR-650 have
been correlated with t(4;14), miR-95, miR-125a, miR-184, miR-199a, miR-215, miR-375, miR-650, miR-99 with
t(11;14), and miR-1, miR-99b, miR-125a, miR-133a, miR-135b, miR-196b, miR-214, miR-375, miR-642 with
t(14;16)32–34,38,39. In addition, aberrant miRs have been associated with inferior (miR-19a, miR-16, miR-19b)
or superior survival (miR-194, miR-153, miR-455) outcomes in MM35. Recent studies have established the
prognostic, predictive and diagnostic potential of not only cellular but also circulating miRNAs in plasma and
other body fluids in M M40.
Even though a series of MM associated potential DEM/DEG signatures have been identified across several
studies over the years, these remain mostly heterogeneous and challenging to interpret in clinics. There are still
unresolved questions such as their mutual interdependencies, interactions with microenvironment and their
combinatorial synergistic prognostic and therapeutic potentials. There are still lacunae in our knowledge and
more studies are needed to understand the signatures that are best valued in clinics for fast and early prognos-
tication of newly diagnosed MM patients. It is thus postulated that a comprehensive analysis of individual GEP
identifiers in MM PCs as compared to normal PCs across multiple studies will help unfold common signatures
with potential prognostic significance. In this regard, we have performed a meta-analysis of available multiple
datasets of DEGs and DEMs in MM patients to derive a unified set of core GEP signatures. We have identified
a combination of ‘Union 154’ DEGs and ‘Union 37’ DEMs that may aid in achieving improved prognosis and
clinical applicability.
Scientific Reports | (2021) 11:10957 | https://doi.org/10.1038/s41598-021-90424-y 2
Vol:.(1234567890)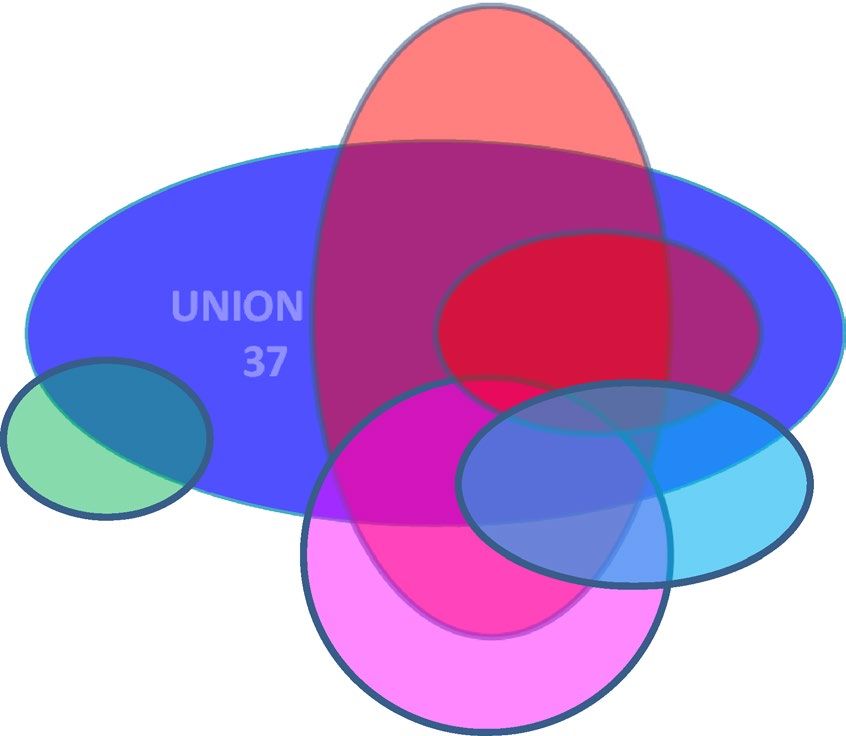
www.nature.com/scientificreports/
Methods
Inclusion and exclusion criteria for published datasets. The keyword “multiple myeloma” with
“homo sapiens” was used to mine the publicly available datasets from the Gene Expression Omnibus (GEO)
database41,42 of NCBI (http://www.ncbi.nlm.nih.gov/geo/) for miRNA and mRNA expression profiles found in
Multiple Myeloma (MM) patients and healthy controls. Datasets obtained from Monoclonal Gammopathy of
Undetermined Significance (MGUS), Smoldering Multiple Myeloma (SMM) and Plasma Cell Leukemia (PCL)
patients were excluded since the data size was limited. Data emerging from cells or cell lines that were cultured
in vitro and/or treated with drugs too were omitted in this study.
miRNA and mRNA expression datasets. Expression profiles from nine publicly available datasets of
mRNAs (GEO accession: GSE125361, GSE13591, GSE16558 and GSE39754), and miRNAs (GEO accession:
GSE125363, GSE16558, GSE17306, GSE17498, GSE24371 and GSE49261) associated with MM were retrieved
from publicly available GEO repository (Table S1 in Supplementary File 1) as per the inclusion and exclu-
sion criteria. Among these, two datasets of miRNA and mRNA expression profiles (44 newly diagnosed MM
patients and 4 controls) were generated in-house by Agilent arrays. These miRNA and mRNA datasets have
been submitted to GEO and assigned with accession numbers GSE125363 and GSE125361, respectively. In this
study, miRNA expression profiles corresponding to 247 MM and 31 healthy control plasma cell samples in
total, whereas mRNA expression profiles representing 407 MM and 20 healthy plasma cell samples in total were
collated and analyzed (Table S1 in Supplementary File 1). Datasets obtained from GEO repository were not
subjected to any additional normalization, as all the data obtained had already been processed/ normalized and
were cross-comparable.
Preprocessing and mining of DEMs/DEGs from GEO repository. GEO2R42 (http://www.ncbi.nlm.
nih.gov/geo/geo2r/) web tool was used to identify DEGs and DEMs among MM and control plasma cell samples.
GEO2R compared two or more groups of samples in a GEO profile using the GEOquery and Limma (Linear
Models for Microarray Analysis) R package43. Limma used linear model statistics to find genes that were differ-
entially expressed between the patient and control groups. The t-test and the Benjamini and Hochberg method
were used to calculate the p-values and false discovery rate (FDR), respectively44. The adjusted (adj.) p ≤ 0.05 and
|logFC|≥ 1.5 were set as the cut-off criterion for identifying DEGs and DEMs.
Genome‑wide miRNA and mRNA expression profiling. Total RNA was isolated from CD138 + plasma
cells enriched with MACS beads (Miltenyi Biotech, Germany), collected from 44 newly diagnosed treatment
naïve MM patients diagnosed as per IMWG guidelines45 (Table S2 in Supplementary File 1) and 4 controls
(pooled from 10 Hodgkin’s disease bone marrow samples). Total RNA was extracted using the miRVana miRNA
isolation kit (Thermofisher Scientific, MA, USA).
For the genome wide miRNA expression profiling, RNA was labeled and hybridized to an unrestricted human
microRNA v19 Microarray slide (Agilent 046,064, GPL18044) (Agilent Technologies, Santa Clara, CA, USA)
according to the manufacturer’s protocol. Briefly, 100 ng of total RNA was labeled with Cyanine3 (Cy3) using
miRNA Complete Labeling and Hybridization Kit (Agilent Technologies, Santa Clara, CA, USA). The Cy3-
labeled samples were resuspended in hybridization buffer and hybridized onto Human miRNA 8X60K format
microarrays (Agilent Technologies, Santa Clara, CA, USA) at 55 °C for 20 h. After hybridization, microarrays
were washed with gene expression wash buffer and the fluorescent signals were scanned using SureScan micro-
array scanner D (Agilent Technologies, Santa Clara, CA, USA) using one colour scan settings (Scan resolution
3 μm, Dye channel set to Green, Green PMT = 100%). The data generated on miRNA expression in MM using
microarrays has been submitted to GEO database with accession no GSE125363.
To correlate whether the miRNA alteration affects gene expression, mRNA expression array analysis was also
performed on 44 MM patient samples and 4 controls (pooled from 10 Hodgkin’s disease bone marrow samples).
Double-stranded cDNA was generated from 200 ng total RNA (isolated with miRVana kit) using the low input
quick amp labelling kit (Agilent Technologies, Agilent Technologies, Santa Clara, CA, USA) using T7 primer,
dNTPs and affinity script RNase block. Next, cDNA was transcribed to cRNA using T7 RNA polymerase and
NTP mix and labeled with Cyanine3 using Cy3-CTP. The labeled cRNA was purified according to manufacturer’s
protocol using RNAeasy extraction kit (Qiagen, Hilden, Germany). The concentration of Cyanine3 and cRNA
was measured using NanoDrop ND1000 spectrophotometer. Samples with specific activity ≥ 6 pmol Cy3/µg
cRNA were hybridized onto a SurePrint G3 human GE v3 8 × 60 K microarray slide (Agilent 072,363, GPL20844)
(Agilent technologies, Santa Clara, CA, USA), and incubated for 17 h at 65 °C in a hybridization oven. The slides
were washed and scanned in SureScan microarray scanner D (Agilent technologies, Santa Clara, CA, USA) with
scan settings (Scan resolution 3 μm, Dye channel set to Green, Green PMT = 100%). The data generated on mRNA
expression in MM has been submitted to GEO database with accession no. GSE125361.
Preprocessing and mining of DEMs/DEGs from Agilent array. Microarray images (*.tiff) obtained
from SureScan scanner were quantified using Agilent Feature Extraction Software (version 11.5.1.1) (Agilent
Technologies, Santa Clara, CA, USA). The raw data obtained (tab-delimited text file per hybridisation) was
subsequently processed with the Limma R package available in the Bioconductor repository (http://www.bioco
nductor.org). Limma used linear model statistics to find genes that were differentially expressed between the
patients and controls. The raw intensity data were background corrected using normexp method and subse-
quently normalized using quantile method for one-color. Expression level variations between replicates were
analyzed by pairwise comparisons using the lmFit function. The fitted model object was further processed by
the eBayes function to produce empirical Bayes test statistics for each gene, including moderated t-statistics,
Scientific Reports | (2021) 11:10957 | https://doi.org/10.1038/s41598-021-90424-y 3
Vol.:(0123456789)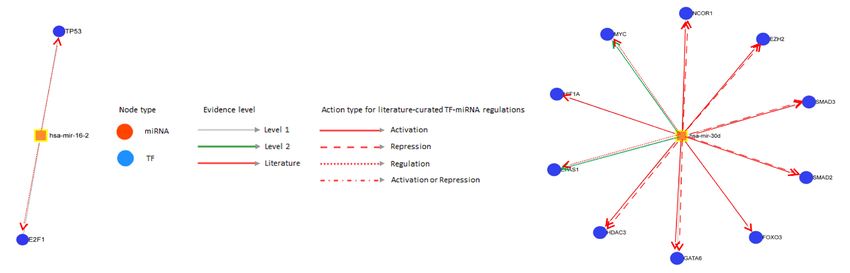
www.nature.com/scientificreports/
p-values and log-odds of differential expression. The t test and Benjamini and Hochberg method were used to
calculate the p-values and false discovery rate (FDR)44. The adjusted p ≤ 0.05 and |logFC|≥ 1.5 were set as the
cut-off criterion for identifying DEGs and DEMs.
Meta‑analysis of DEGs/DEMs datasets. A widely used meta-analysis approach46–48 was applied to
integrate the gene/miRNA expression profiles obtained independently from GEO repository as well as datasets
generated at our centre following microarray hybridization (Table S1 in Supplementary File 1). The gene and
miRNA probes were assigned as per HGNC (HUGO Gene Nomenclature Committee) and miRBase-22.1 identi-
fiers, respectively using the g:Profiler49 (https://biit.cs.ut.ee/gprofi ler/). The differentially expressed genes/miR-
NAs obtained through R/Bioconductor limma package43 from these individual studies were merged by taking
the union across them. When multiple probes referred to the same gene/miRNA, the expression values obtained
from these probes were minimized to a single value by averaging the expression value (when in the same direc-
tion of expression) or were discarded (when had diverse directions of expression). The probes with unknown
gene or unknown miRNA identifiers or annotated as antisense RNA, chromosomes, hypothetical loci, non-cod-
ing RNAs, non-functional proteins, non-protein coding genes, pseudo-genes and uncharacterized genes were
discarded. The DEGs identified were mapped in DisGeNET50 to determine their known disease associations.
miRNA‑mRNA target interactions. The target genes of potential DEMs were predicted using miR-
Net-2.0 (https://www.mirnet.ca/) according to eleven different miRNA databases (TarBase, miRTarBase,
miRecords, miRanda, miR2Disease, HMDD, PhenomiR, SM2miR, PharmacomiR, EpimiR and starBase). The
miRNA-mRNA pairs with inverse correlation expression trends were filtered for downstream analysis.
Core analysis using IPA. Ingenuity Pathway Analysis (IPA, Ingenuity Systems, USA; www.qiagen.com/
ingenuity) was used to identify the biological functions, diseases, canonical pathways, and regulatory net-
works of the functional miRNA-mRNA target interactions. Tab-delimited text files containing gene/miRNA
IDs, expression data (fold change), and p-values were uploaded into IPA for their core analysis. The statistical
significance of the enrichment was calculated using hypergeometric test and adjusted by FDR method (adj.
p-value ≤ 0.05). The top functions (molecular, cellular and biological), diseases, toxicology, and gene signaling
networks were calculated using IPA-generated negative logarithm p-values i.e., -log10(p-value) and associated
Z- and network scores.
Construction of protein–protein interaction (PPI) network. To examine the interactive associations
among the DEGs at the protein level, MM related genes were mapped on protein–protein interaction (PPI) data
using NetworkAnalyst51 (version 3.0; http://www.networkanalyst.ca). The network was built based on the origi-
nal seed proteins through executing the minimum interaction network by trimming the first-order network to
keep only those nodes that are necessary to connect the seed nodes. Literature-curated comprehensive PPI data
was used to predict interaction n etwork52. Network modules containing densely connected group of proteins
were predicted using the random walk approach. The significant p-value of a given module was calculated with
Wilcoxon rank-sum test53. The enriched pathways of DEGs in significant modules (≥ 10 DEGs) were analysed
with a threshold of p ≤ 0.05 using DAVID (database for annotation, visualization and integrated discovery) func-
tional annotation tool.
Biomarker candidates and TF regulatory network. The candidate gene biomarkers were predicted using Inge-
nuity Pathway Analysis (IPA-biomarkers analysis; http://www.ingenuity.com). The adjusted (adj.) p ≤ 0.05 and
|logFC|≥ 1.5 were set as the cut-off criterion. Upstream regulators (TFs) of biomarker candidates were predicted
using NetworkAnalyst (http://www.networkanalyst.ca). TF-gene interaction analysis was performed using the
ENCODE database. The miRNA-disease association was predicted by HMDD v3.2 (Human microRNA Disease
Database; http://www.cuilab.cn/hmdd) and miRNet 2.0 (https://www.mirnet.ca/). The regulatory associations
between TFs and miRNAs were predicted using TransmiR v2.0 (http://www.cuilab.cn/transmir). Functional and
pathway enrichment analyses of upstream regulators were investigated using DAVID (https://david.ncifcrf.gov/)
with adjusted (adj.) p ≤ 0.05 and |logFC|≥ 1.5 cut-off criteria.
Survival analysis. Sigmaplot 14.0 was used to estimate Kaplan–Meier plots for overall survival (OS) and pro-
gression free survival (PFS). The survival analysis was carried out on 35 patients in whom clinical data was
available. Comparisons between DEMs were analyzed using means of log-rank test and p ≤ 0.05 as cut-off for
statistical significance.
Ethical clearance. The study on 44 MM patients collected from the outpatient department of the All India
Institute of Medical Sciences (AIIMS), New Delhi was conducted in compliance with ethical guidelines of the
AIIMS and after obtaining approval from the AIIMS ethics committee. Study individuals were enrolled follow-
ing their voluntary written informed consent.
Results
Identification of DEGs/DEMs in MM compared with NPCs. Following consolidation of data and
its meta-analysis, a total of 100 DEMs and 1,362 DEGs were identified between multiple myeloma (MM) and
normal plasma cells (NPC) with FDR ≤ 0.05 and logFC ≥ 1.5 threshold values (Supplementary Tables S3-S4).
Among these DEMs, 43 miRNAs were upregulated, and 57 miRNAs were downregulated, whereas 708 DEGs
Scientific Reports | (2021) 11:10957 | https://doi.org/10.1038/s41598-021-90424-y 4
Vol:.(1234567890)
www.nature.com/scientificreports/
a 1362
708 DEG 654 102
60
Over Under
590 648 Expression Expression 592 496
Regulatory Regulatory
58 Network Network 96
Candidate mRNA Candidate
Biomarker FDR ≤ 0.05, logFC ≥ 1.5 Biomarker
b 100
43 DEM 57 12
3
Over Under
22 40 Expression Expression 45 26
Regulatory Regulatory
18 Network Network 19
Candidate miRNA Candidate
Biomarker FDR ≤ 0.05, logFC ≥ 1.5 Biomarker
Figure 1. Analysis flow of (a) DEGs and (b) DEMs in MM showing number of genes/ miRNAs with
upregulated expression on left hand side and downregulated expression on the right side. (a) Out of 1,362 DEGs,
708 were over-expressed, out of which 648 were found to be involved in regulatory network with miRNA and 58
DEGs ultimately showed up as possible candidate biomarker in MM. Similarly, 96 of downregulated DEGs were
found to have the possible potential to be investigated further as candidate biomarkers. (b) Expression of 45 and
40 out of 100 DEMs was downregulated or upregulated respectively, and ultimately 19 and 18 subsets of these
turned up to be possible candidate biomarkers for MM.
were upregulated and 654 genes were downregulated in MM (Tables S3-S4 in Supplementary File 1). The DEGs
identified from this study were mapped across the available data of MM present in DisGeNET which established
their known associations with MM (Table S5 in Supplementary File 1).
MicroRNA–mRNA regulatory network analysis. To verify the targets of differentially expressed miR-
NAs in MM datasets, miRNA–mRNA regulatory network was constructed using the 100 DEMs and 1,362 DEGs.
The analysis showed an association of 85 DEMs, including 40 upregulated and 45 downregulated miRNAs,
with 1,240 target genes, including 592 downregulated and 648 upregulated DEGs in MM (Fig. 1). The observed
targets were statistically significant with p-value ≤ 0.05 and fold change ≥ 1.5. The most significantly upregu-
lated and downregulated miRNAs in MM were observed to be hsa-miR-191-5p (4.80 logFC) and hsa-miR-
155-5p (− 4.69 logFC), respectively, whereas the most significantly upregulated and downregulated DEGs were
TNFRSF17 (4.91 logFC) and DEFB1 (− 4.56 logFC), respectively (Table 1; Table S6 and S7 in Supplementary File
1). hsa-miR-155-5p (-4.69 logFC) was predicted to target maximum number of genes (315 upregulated DEGs),
whereas hsa-miR-602 (2.20 logFC) was predicted to target the least number of genes (2 downregulated DEGs)
(Table S8 in Supplementary File 1). Conversely, several genes were predicted to be the common targets of differ-
ent miRNAs (Table S9 in Supplementary File 1).
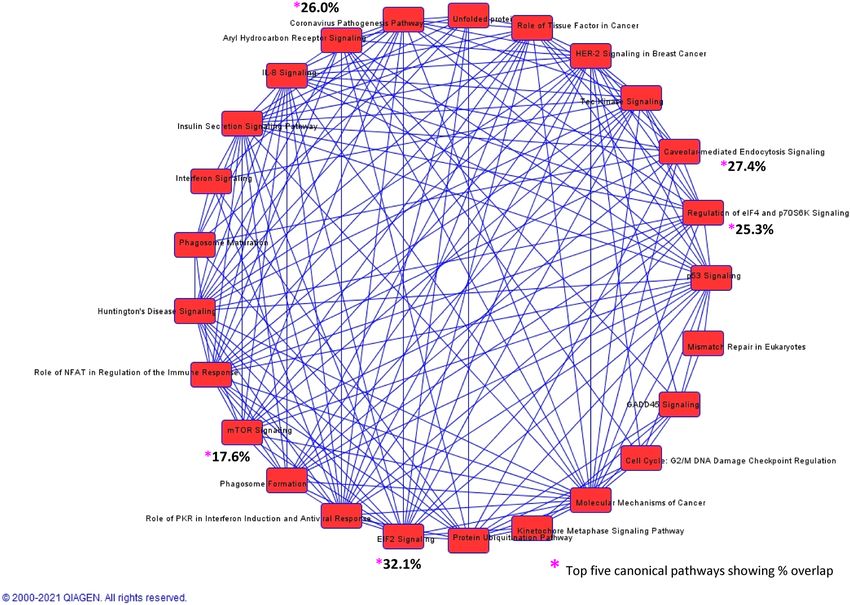
Correlation between canonical pathways, diseases and functions. To gain further insights into
the pathogenesis of MM, all significant MM-correlated genes/miRNAs were investigated by IPA core analysis
that revealed 555 human canonical pathways significantly enriched for 698 overlapping genes associated with
MM (Table S10 in Supplementary File 1).The top five significant enriched pathways based on their significance
(lowest BH-adjusted p-value ≤ 0.05) were EIF2 signaling (9.90E-34), regulation of eIF4 and p70S6K signaling
(5.62E-16), coronavirus pathogenesis pathway (2.31E-15), mTOR signaling (2.49E-09), and caveolar-mediated
endocytosis signaling (5.46E-09) (Fig. 2).
DEGs and DEMs were further investigated for their involvement in most enriched diseases and for their func-
tions in multiple myeloma. On annotation, most of the DEGs were found to be involved in cancer, organismal
injury and abnormalities, immunological disease, connective tissue disorder, inflammatory disease (Figure S1a in
Supplementary File 2), whereas DEMs were found to be enriched in cancer, organismal injury and abnormalities,
reproductive system disease, inflammatory disease, and inflammatory response (Figure S1b in Supplementary
File 2). The topmost significant diseases and biofunctions identified for DEMs and DEGs are shown in Table 2.
Besides the leading pathways and cellular functions, gene networks were constructed to connect key genes and
enriched categories of diseases and functions based on the correlation between DEGs. Core analysis-based net-
work revealed 25 significant networks and each individual network had a maximum of 35 focus genes. Top ranked
Scientific Reports | (2021) 11:10957 | https://doi.org/10.1038/s41598-021-90424-y 5
Vol.:(0123456789)www.nature.com/scientificreports/
Accession no miRNA name (miRBase-22.1) adj.P.Val logFC Regulation
MIMAT0000440 hsa-miR-191-5p 1.72E-03 4.80 Up
MIMAT0000420 hsa-miR-30b-5p 1.27E-02 4.78 Up
MIMAT0003326 hsa-miR-663a 3.07E-04 4.58 Up
MIMAT0000243 hsa-miR-148a-3p 5.66E-13 4.38 Up
MIMAT0000433 hsa-miR-142-5p 3.07E-04 4.20 Up
MIMAT0000646 hsa-miR-155-5p 2.97E-03 -4.69 Down
MIMAT0000753 hsa-miR-342-3p 1.57E-05 -3.74 Down
MIMAT0000085 hsa-miR-28-5p 4.57E-09 -3.13 Down
MIMAT0003320 hsa-miR-650 2.97E-02 -3.10 Down
MIMAT0000266 hsa-miR-205-5p 3.29E-09 -3.07 Down
Accession no Gene name adj.P.Val logFC Regulation
HGNC:11,913 TNFRSF17 0.00E + 00 4.91 Up
HGNC:13,310 GPRC5D 0.00E + 00 4.49 Up
HGNC:2318 CPNE5 0.00E + 00 4.29 Up
HGNC:21,063 MOXD1 2.00E-02 4.02 Up
HGNC: 17,825 PLA2G16 0.00E + 00 3.99 Up
HGNC:2766 DEFB1 2.00E-02 -4.56 Down
HGNC:1990 CKAP2 0.00E + 00 -4.00 Down
HGNC:11,763 TFRC 2.00E-02 -3.95 Down
HGNC:26,260 TMEM156 7.65E-04 -3.93 Down
HGNC:1036 BEX1 1.00E-02 -3.75 Down
Table 1. List of top 5 up- and down-regulated miRNAs and genes in multiple myeloma.
network (network 1) with an IPA score of 49 contained 35 focus molecules. Top functions of genes associated
with network 1 were mainly connected to cellular assembly and organization, energy production, nucleic acid
metabolism. Likewise, miR-network consisted of 8 major networks with a maximum of 24 focus genes. Most
of the genes in miRNA network 1 were mainly connected to cancer, organismal injury and abnormalities and
reproductive system disease. Gene/miRNA networks and their related top diseases and functions are listed in
Table 3 and Table S11 in Supplementary File 1.
Identification of functional modules in PPI network. Protein–protein interactions (PPI) network
was constructed using aberrantly expressed genes identified in MM to predict biologically significant modules
containing a group of proteins that execute similar functions. The minimum interaction network scattered in
1–3 sub-networks including one big network with highest nodes and edges. The network analysis disclosed 1,136
seeds (91.61% of DEGs) associated with 1,937 nodes in the network. The modules containing a group of proteins
with identical functions were detected using the random walk approach. A total of 22 significant independent
functional modules were observed, whereas 13 modules (module no: 0, 1, 2, 3, 4, 5, 6, 7, 9, 11, 12, 13, and 16)
were highly connected with more than 10 nodes and p ≤ 0.05 (Table 4; Table S12 in Supplementary File 1). Out
of 1,136 seed nodes, a total of 34.68% (n = 394) nodes were observed with ≥ 10 degrees or connections with other
nodes (Table S12 in Supplementary File 1). The betweenness centrality of nodes ranged between of 13.37 to
741,529.3 in the constructed network. All 394 nodes were observed to be targeted by at least one MM-associated
DEMs (Table S13 in Supplementary File 1).
The top five highly connected hub nodes included UBC, ITGA4, HSP90AB1, VCAM1 and VCP (Table S12 in
Supplementary File 1). Module-wise distribution of top three highly connected hub nodes encompassed BRCA1,
CDKN1A and PCNA in module 0 (Figure S2a), UBC, ITGA4 and VCAM1 in module 1 (Figure S2b) and JUN,
STAT1 and EGR1 in module 2 (Figure S2c in Supplementary File 2).
Identification of biomarker candidates for multiple myeloma. The common molecular biomarker
candidates among DEGs and DEMs for diagnosis, disease progression, efficacy, prognosis, response to therapy
and safety were identified using the IPA software and HMDD/miRNet database, respectively (Table 5). The
analysis revealed 154 (12.42%) potential biomarkers out of 1,240 observed DEGs that could bear clinical value
for MM and were designated as ‘Union 154’ signature (Fig. 3a). These included common biomarker candidates
predominantly with diagnosis (n = 82; 63.25%), efficacy (n = 90; 58.44%), prognosis (n = 56; 36.36%), disease
progression (n = 21; 13.64%), response to therapy (n = 23; 14.94%), and safety (n = 9; 5.84%) (Tables S14 and
S15 in Supplementary File 1). Among the target gene candidate biomarkers, 42.21% (n = 65) of targets qualified
for more than one role (Supplementary Tables S14 and S15). For example, gene CDKN2A was observed to be
implicated in six biomarker applications including diagnosis, disease progression, efficacy, prognosis, response
to therapy and safety.
In addition, miRNA disease databases such as HMDD and miRNet revealed 37 aberrantly expressed miRNAs
as potential biomarkers with clinical utility for MM (Table S16 in Supplementary File 1) and were designated
Scientific Reports | (2021) 11:10957 | https://doi.org/10.1038/s41598-021-90424-y 6
Vol:.(1234567890)www.nature.com/scientificreports/
Figure 2. Overlapping canonical pathways generated by IPA (QIAGEN IPA; http://www.ingenuity.com). The
figure shows overlapping canonical pathways associated with differential proteins. The nodes represent pathways
and edges are labeled with the number of common proteins connecting each node. Top 5 significant pathways
are marked with * followed by % overlap across pathways.
as ‘Union 37’ signature (Fig. 3b). A systematic literature review of ‘Union 37’ signatures disclosed that 29.73%
(n = 11) miRNAs were known circulating biomarkers for diagnostics and prognostics in MM. Some of these
miRNAs were identified as epigenetically regulated miRNAs (n = 4), as therapeutic targets (n = 7) and dysregu-
lated miRNAs that resulted in MM disease phenotype (n = 7) and are given in Table 6.
Effect of DEGs/DEMs on clinical outcomes. A significant correlation of differential expression of miR-
30d-3p with PFS (p = 0.05) and of miR-16–2-3p with OS (p = 0.03) and PFS (p < 0.001) was observed (Fig. 4a–c).
The miR-16–2-3p interacted with two predominant transcription factors (P53, E2F1) (Fig. 4d) while miR-30d-3p
interacted with multiple transcription factors (EPAS1, EZH2, FOXO3, GATA6, HDAC3, HIF1A, MYC, NCOR1,
SMAD2, SMAD3) (Fig. 4e) (Table S17 in Supplementary file 1).
TF‑gene/miRNA coregulatory networks. We further investigated the TF-miRNA-target gene regu-
latory network for meta-signature gene/miRNAs identified in this study. The gene-TF regulatory network of
5 gene (≥ 4 biomarkers applications) revealed 164 interaction pairs among 5 seed genes (CDKN1A, MMP9,
CDKN2A, MKI67, and IGF1) and 139 transcription factors (TFs) (Table S18 in Supplementary File 1). Among
them, upregulated gene CDKN1A was found to be regulated by 87 TFs, CDKN2A was regulated by 12 TFs and
IGF1 was regulated by 10 TFs (Fig. 5). Similarly, the downregulated gene MMP9 interacts with 20 TFs, and
MKI67 interacts with 10 TFs (Fig. 5). TF-gene interactions are shown in Table S17 in Supplementary File 1.
TF-miRNA regulatory analysis of top 3 up- and downregulated miRNA biomarkers based on the number
of targets showed an association with 339 TFs (Table S19 in Supplementary File 1). From the data of TransmiR,
downregulated DEMs such as hsa-miR-20a, hsa-mir-155, and hsa-mir-92a were found to be regulated by 143,
114 and 11 TFs, respectively (Figure S3a-c). Likewise upregulated DEMs including hsa-mir-23b, hsa-mir-195
and hsa-let-7b were found to be regulated by 140, 63 and 58 TFs, respectively (Figure S3d-f in Supplementary
File 2; Table S17 in Supplementary File 1).
The top 5 enriched biological functions of TFs were investigated and subsequently compared for up-and
downregulated meta-signature gene/ miRNAs (Table S20 in Supplementary File 1). TFs of upregulated genes were
enriched in pathway namely “transcriptional misregulation in cancer”, whereas TFs of downregulated genes were
Scientific Reports | (2021) 11:10957 | https://doi.org/10.1038/s41598-021-90424-y 7
Vol.:(0123456789)www.nature.com/scientificreports/
Name (miRNA) p-value range Focus molecules
Diseases and Disorders
Cancer 4.96E-02—3.57E-30 52
Organismal Injury and Abnormalities 4.96E-02—3.57E-30 60
Reproductive System Disease 1.62E-02—3.57E-30 42
Inflammatory Disease 4.00E-02—2.49E-25 39
Inflammatory Response 4.00E-02—2.49E-25 33
Molecular and Cellular Functions
Cellular Development 4.96E-02—3.34E-14 42
Cellular Growth and Proliferation 4.96E-02—3.34E-14 39
Cellular Movement 4.52E-02—3.96E-08 24
Cell Cycle 4.52E-02—3.48E-07 10
Cell Death and Survival 4.11E-02—6.36E-06 24
Physiological System Development and Function
Organismal Development 4.96E-02—3.06E-11 19
Digestive System Development and Function 1.02E-08—1.02E-0 6
Hepatic System Development and Function 1.02E-08—1.02E-0 6
Organ Development 1.02E-08—1.02E-0 6
Cardiovascular System Development and Function 4.96E-02—2.94E-07 14
Name (genes) p-value range Focus molecules
Diseases and Disorders
Cancer 1.70E-09—1.90E-62 1324
Organismal Injury and Abnormalities 1.70E-09—1.90E-62 1339
Immunological Disease 1.04E-09—1.45E-39 630
Connective Tissue Disorders 1.03E-10—2.35E-35 258
Inflammatory Disease 1.42E-09—2.35E-35 337
Molecular and Cellular Functions
Cell Death and Survival 1.70E-09—1.24E-47 594
Protein Synthesis 6.71E-13—6.21E-41 257
RNA Damage and Repair 9.02E-35—2.44E-35 54
Cellular Compromise 3.75E-18—2.72E-33 189
Cellular Development 8.50E-10—3.16E-27 490
Physiological System Development and Function
Organismal Survival 3.14E-22—6.61E-28 411
Immune Cell Trafficking 1.54E-09—1.81E-26 259
Lymphoid Tissue Structure and Development 1.24E-09—3.59E-26 273
Hematological System Development and Function 1.54E-09—1.10E-25 403
Tissue Morphology 1.03E-09—1.37E-22 315
Table 2. Top five diseases and bio functions identified by IPA analysis of miRNA and mRNA in MM.
ID Associated Network Functions (miRNAs) Score Focus Molecules
1 Cancer, Organismal Injury and Abnormalities, Reproductive System Disease 58 24
2 Glomerular Injury, Inflammatory Disease, Inflammatory Response 43 19
3 Neurological Disease, Organismal Injury and Abnormalities, Psychological Disorders 32 15
Digestive System Development and Function, Gastrointestinal Disease, Hepatic System Development
4 19 10
and Function
5 Glomerular Injury, Inflammatory Disease, Inflammatory Response 2 1
ID Associated Network Functions (genes)
1 Cellular Assembly and Organization, Energy Production, Nucleic Acid Metabolism 49 35
2 RNA Post-Transcriptional Modification, Nucleic Acid Metabolism, Small Molecule Biochemistry 46 34
3 Cell Cycle, Cellular Assembly and Organization, DNA Replication, Recombination, and Repair 43 33
4 Drug Metabolism, Small Molecule Biochemistry, Cellular Compromise 41 32
5 Infectious Diseases, Post-Translational Modification, Developmental Disorder 38 31
Table 3. Top five associated network functions predicted by an IPA analysis of miRNA and mRNA in MM.
Scientific Reports | (2021) 11:10957 | https://doi.org/10.1038/s41598-021-90424-y 8
Vol:.(1234567890)www.nature.com/scientificreports/
#
Module Size P-value Gene Id Gene Symbol *Degree Betweenness
0 402 3.64E-11 672 BRCA1 51 12,309.77
1026 CDKN1A 41 9837.73
5111 PCNA 37 5809.36
983 CDK1 30 4144.93
5347 PLK1 26 5018.87
4176 MCM7 24 2771.13
991 CDC20 23 1982.08
472 ATM 22 2491.62
890 CCNA2 21 1781.56
1029 CDKN2A 20 3589.92
1 373 4.57E-08 7316 UBC 358 46,319.96
3676 ITGA4 97 1251.95
7412 VCAM1 95 1200.74
7415 VCP 90 1340.9
3312 HSPA8 88 987.02
3326 HSP90AB1 83 1125.47
3309 HSPA5 81 795.28
8452 CUL3 67 541.42
3303 HSPA1A 66 565.57
203,068 TUBB 66 528.71
2 238 1.99E-02 3725 JUN 52 4409.1
6772 STAT1 47 4410.76
1958 EGR1 44 4338.56
5925 RB1 39 3345.44
3659 IRF1 34 1100.71
7421 VDR 29 2058.43
5966 REL 26 1825.76
6667 SP1 25 2321.16
7157 TP53 23 1708.21
2033 EP300 23 929.11
3 58 3.34E-02 6194 RPS6 51 42.61
6191 RPS4X 51 37.5
6210 RPS15A 51 33.01
6207 RPS13 50 38.73
6189 RPS3A 49 52.8
6228 RPS23 49 32.17
6188 RPS3 48 26.02
6202 RPS8 48 20.13
6217 RPS16 48 18.54
6129 RPL7 47 16.68
4 45 3.26E-02 1994 ELAVL1 33 870
351 APP 11 250
Table 4. Top five significant functional modules and associated hub genes. # Top 5 modules based on size *Top
10 hub genes based on degree.
not observed to be significantly enriched in any pathways. Moreover, we found that the TFs of up- and downregu-
lated miRNAs were commonly enriched in 39 pathways, including MAPK signaling pathway (hsa04010), HIF-1
signaling pathway (hsa04066), cell cycle (hsa04110), wnt signaling pathway (hsa04310), osteoclast differentiation
(hsa04380), toll-like receptor signaling pathway (hsa04620), B cell receptor signaling pathway (hsa04662), path-
ways in cancer (hsa05200), Transcriptional misregulation in cancer (hsa05202), Viral carcinogenesis (hsa05203),
microRNAs in cancer (hsa05206), chronic myeloid leukemia (hsa05220), acute myeloid leukemia (hsa05221),
small cell lung cancer (hsa05222) and others (Table S20 in Supplementary File 1).
Discussion
In this study, a meta-analysis of mRNA and miRNA expression profiles has been carried out on more than 600
MM patients including 44 Indian myeloma patients (represented in 9 GSE-GEO datasets) in order to com-
pute altered mRNA and miRNA patterns and potential biomarkers of prognostic clinical relevance in multiple
Scientific Reports | (2021) 11:10957 | https://doi.org/10.1038/s41598-021-90424-y 9
Vol.:(0123456789)www.nature.com/scientificreports/
*Gene Biomarker Description Regulation Biomarker application(s)
Diagnosis,disease progression,efficacy,prognosis,re
CDKN2A Cyclin dependent kinase inhibitor 2A Up
sponse to therapy,safety
HGF Hepatocyte growth factor Up Diagnosis,disease progression,efficacy,prognosis
IGF1 Insulin like growth factor 1 Up Diagnosis,efficacy,prognosis,safety
CDKN1A Cyclin dependent kinase inhibitor 1A Up Diagnosis,efficacy,prognosis,response to therapy
STAT1 Signal transducer and activator of transcription 1 Up Diagnosis,efficacy,prognosis,response to therapy
Diagnosis,disease progression,efficacy,prognosis,re
MKI67 Marker of proliferation Ki-67 Down
sponse to therapy
PTK2 Protein tyrosine kinase 2 Down Diagnosis,disease progression,efficacy,prognosis
MMP9 Matrix metallopeptidase 9 Down Diagnosis,disease progression,efficacy,prognosis
TOP2A DNA topoisomerase II alpha Down Diagnosis,efficacy,prognosis,response to therapy
VCAM1 Vascular cell adhesion molecule 1 Down Diagnosis,disease progression,efficacy,prognosis
Table 5. Common molecular biomarker candidates for diagnosis, disease progression, efficacy, prognosis,
response to therapy and safety in multiple myeloma. ★ Gene candidates with ≥ 4 biomarker applications.
(a) UNION 154
CDKN1A ARG55
ITGA3 ARG55
XBP1 ARG55
BRCA1, EXO1, MCM4, CDKN1A, ITGA3,
HSPA5 ARG55
MKI67, MSH2, PCNA XBP1, HSPA5
CCNA2 FOXO3 ARG55 HZD 97
FOXO3 BRCA1 CINGLEC214
CINGLEC 214 CCNA2 CINGLEC214 ARG55
PARP1
TOP2A ARG 55 EXO1 CINGLEC214
1 MCM4 CINGLEC214
4
MKI67 CINGLEC214
1 1 1 MSH2 CINGLEC214
EMC 92 6 IFM 15 PCNA CINGLEC214
3 1
HZD 97 2 RPS4X EMC 92
CTSE STAT1 EMC 92
RPS4X, UNION 154 TOP2A CINGLEC214 EMC 92
STAT1, TUBB EMC 92
MSH6,
TUBB 2 MSH6 HZD 97
TNFSF13B TNFSF13B HZD 97
CDKN2A, M3CN15 CTSE IFM-15
CDK1 PARP1 IFM-15 ARG55
CDK1 M3CN 15
CDKN2A M3CN 15
(b) UNION 37
mir-28, mir-148a, mir- hsa-mir-130a Cor 32
29b, mir-30b, mr-30d Kas24
mir-15b hsa-mir-106b Kas 13 Xiang 13 Cor 32
hsa-mir-19a Kas 13 Xiang 13
5 mir-18a hsa-mir-20a Kas 13 Xiang 13
hsa-mir-18a Kas 13
hsa-mir-15b Kas 24 Kas 13 Xiang 13
UNION 1 hsa-let-7b Kas 24 Kas 13
Kas13
37 2 let-7b, hsa-mir-155 Kas 24 Kas 13
mir-155 hsa-mir-28 Kas 24
3 1 1 2
hsa-mir-148a Kas 24
Xu7 1 mir-20a, hsa-mir-29b Kas 24
1 mir-19a hsa-mir-30b Kas 24
Xiang13
let-7e, hsa-mir-30d Kas 24
mir-19b, mir-130a mir-191 hsa-mir-191 Xiang 13
mir-92a Cor32 hsa-let-7e Xu 7
mir-106b hsa-mir-19b Xu 7
hsa-mir-92a Xu 7
Figure 3. A comparison of commonality between (a) Union 154 DEG and (b) Union 37 DEM signatures
found in this study with analogous published signatures showing an overlap of 22 DEGs and 17 DEMs,
respectively9,10,14,16,17,21,25,26,28,54.
Scientific Reports | (2021) 11:10957 | https://doi.org/10.1038/s41598-021-90424-y 10
Vol:.(1234567890)www.nature.com/scientificreports/
miRNA biomarker Regulation Evidence Description Causality
MiR-148a participates in the growth of RPMI8226 multiple myeloma cells by regulating
hsa-mir-148a Up Target gene YES
CDKN1B
hsa-mir-23b Up Transcription factor target miR-23b/SP1/c-myc forms a feed-forward loop supporting multiple myeloma cell growth YES
In addition, ectopic expression of miRNA-29a or exposure to PRIMA-1Met reduced cell
hsa-mir-29a Up Genetics_overexpression_suppress YES
proliferation and induced apoptosis in MM cells
hsa-mir-29b Up Therapeutic target miR-29b-based epi-therapeutic approaches in the treatment of this malignancy YES
Overexpression of microRNA-29b induces apoptosis of multiple myeloma cells through
hsa-mir-29b-1 Up Target gene YES
down regulating Mcl-1
The common loss of miR-15a and miR-16–1 in CLL, as well as the loss of 13q14 in mantle
cell lymphoma (50 percent of cases), multiple myeloma (16 to 40 percent) and prostate can-
cer (60 percent), strongly suggests that these two miRNAs act as tumor suppressor genes.
hsa-mir-16–1 Down Genetics_knock down_promote YES
While their full target complement is unknown, they appear to mediate their effects largely
by down-regulating the anti-apoptotic protein BCL2. This protein is often found expressed
at high levels in CLL and is thought to be important for the survival of the malignant cells
hsa-mir-16–1 Down Target gene miR-15a and miR-16 affect the angiogenesis of multiple myeloma by targeting VEGF YES
miR-19a is overexpressed significantly in Lp-1 and U266 multiple myeloma cells, and pro-
hsa-mir-19a Down Genetics_overexpression_promote YES
mots the proliferation and invasion of the myeloma cells, but inhibits their apoptosis
Effects of microRNA-20a on the proliferation, migration and apoptosis of multiple
hsa-mir-20a Down Target gene YES
myeloma via the PTEN/PI3K/AKT signaling pathway
Table 6. List of miRNAs that could result in disease phenotypes (multiple myeloma) when permutated.
(a) (b) (c) miR-30d-3p and OS
miR-16-2-3p and OS miR-16-2-3p and PFS
1.0
1.0 1.0
No change No change No change
High expression High expression 0.8
Low expression
0.8 0.8
0.6 p=0.03 0.6 pwww.nature.com/scientificreports/
Figure 5. TF-gene biomarker regulatory network generated by NetworkAnalyst (version 3.0; http://www.netwo
rkanalyst.ca). The network revealed 164 interaction pairs among 5 seed genes and 139 transcription factors
(TFs). Blue circle stands for the seed gene and blue diamond stands for the transcription factor.
myeloma. Overall, this study has imputed two core signatures, ‘Union 154’ for DEGs and ‘Union 37’ for DEMs
in MM that appear to have a unified representation of several other analogous signatures reported in the
literature9,10,14,16,17,21,25,26,28,54 (Fig. 3a and b).
The present study has revealed that 85% (85/100) of DEMs and 91.04% (1,240/1,362) of DEGs were signifi-
cantly altered, are inversely correlated and involved in regulatory networking in multiple myeloma. The most
downregulated miR observed in MM malignant plasma cells as compared to NPCs in our study is miR-155. A
reduced expression of this miR in MM PCs vs NPCs suggests a tumor suppressor role as has also been reported
previously55. A similar study has reported an epigenetic repression of miR-375 in MGUS and MM primary cells
as compared to N PCs56, which is also concurrent to our findings. Another tumor suppressor miR-144 that can
be sponged by lncSOX2OT57 has been reported to be downregulated in MM plasma cells and cell lines earlier
and was found downregulated in plasma cells in our study. Similarly, upregulation of miR-29b in MM PCs in this
study is in sync with previous studies, where it has been reported that the overexpression of miR-29b induces
apoptosis of multiple myeloma cells by down regulating MCL-158.
Some of the DEMs observed in MM in our study can be extrapolated and categorized on the basis of their
previously reported roles relating to pathogenesis, clinical presentation, drug resistance and clinical outcomes.
While the deregulated miRs-30d and 181b have been associated with p53 e xpression33, miRs-106/ 181b and
miR-181b/ miR-193b are specifically dysregulated in early and late stages of pathogenesis in MGUS and MM
respectively30. Some of the DEMs have been associated with sensitivities to Bortezomib (e.g., miRs-17-5p, miR-
29b-3p, miR-20a-5p) while others with poor survival outcomes (miR-92a, miR-16, let-7e, miR-19b, miR-19a)25.
Although sample size of inhouse MM subset (n = 44) in our study is small, we observed all the Union37 DEMs
in this patient population. Moreover, a significant association of low expression of miR-30d-3p with poor OS
and of high expression of miR-16–2-3p with poor OS and PFS (Fig. 4) was also noted. The miR-30d-3p is a
Scientific Reports | (2021) 11:10957 | https://doi.org/10.1038/s41598-021-90424-y 12
Vol:.(1234567890)www.nature.com/scientificreports/
known prognostic biomarker for MM reported to have lower serum expression levels and tumor suppressor
functions mediated through direct targeting of TP53 and MTDH/PI3K/Akt signaling p athway59. A recent study
has reported high expression of miR-16–2-3p in serum of Bortezomib refractory MM p atients60 but its role in
MM has not been investigated thoroughly. Since miR-16–2 can target WNT5A, impair ability of MSCs to dif-
ferentiate into o steoblasts61 its deregulation may be of prognostic significance in MM and needs to be explored
further. Coincidentally, IPA analysis has also highlighted importance of WNT pathway in this study.
Another integrative s tudy27 mined two miRNA and two mRNA microarray GEO datasets and identified
39 DEMs and 32 hub genes. Among these DEMs, miR-155 and miR-148 were found to be deregulated in their
study27 as well as in Union 37 profile in the present work. Likewise, another meta-analysis of 7 datasets includ-
ing MM patients26 highlighted 13 DEMs, of which hsa-miR-106b, miR-15b, miR-191, miR-19a and miR-20a are
also represented in Union 37 profile. A recent meta-analysis by Xu et al25 reported 7 DEMs of poor prognostic
significance among which deregulated miR-92a, miR-16, let-7e and 19b are common to the Union 37 signature.
The IPA core analysis disclosed 12.42% (n = 154) of DEGs as putative biomarkers that could be useful in
diagnosis, disease progression, efficacy, prognosis, response to therapy and safety. Further investigation revealed
that 42.21% (n = 65) of targets were involved in more than one functional role. It is known that proteins with the
highest degree have the highest betweenness in the network. As hub proteins are accountable for holding net-
works together62,63, they are more likely to be master regulators of signaling and transcription and can be used as
therapeutic targets or biomarkers64. The target genes identified in this study were subjected to PPI network which
disclosed a total of 394 nodes with ≥ 10 connections with other nodes and were designated as ‘hub’ genes. All hub
genes were observed to be targeted by MM associated DEMs and could act as possible biomarkers for this disease.
It is noteworthy that IPA based data mining of DEGs and DEMs in this study has revealed five top hub genes
lying in the centre of functional networks. These include UBC, ITGA4, HSP90AB1, VCAM1 and VCP. Two
genes (UBC and HSP90B1) have been earlier reported to be upregulated and involved in myelomagenesis in
malignant plasma cells in other studies65 as well and may be critically involved in ubiqutin-proteosomal pathway.
The HSP90A family members are known to promote anti tumor immunity via their exposure on dying myeloma
cells66 and their interaction with lncRNA MALAT1 is associated with poor prognosis67. Gene ITGA4 along with
ITGB1 codes for integrin VLA4 that mediates homing of myeloma cells into bone marrow and augment IL6 in
the microenvironment.68. Similarly, MM cells establish contact with bone marrow stromal cells via adhesion
molecules such as VCAM1 and enhance osteoclast stimulating activity that can be reduced by Bortezomib and
Lenalidomide69,70. The gene VCP is a potential therapeutic target that mediates delivery of ubiquinated misfolded
protein aggregates to proteasome71 and was found to be upregulated in MM plasma cells in this study.
Conclusions
The regulatory crosstalk between DEGs and DEMs in MM is highly complex. This study has identified core
putative signatures of DEMs (‘Union 37’) and DEGs (‘Union 154’) in MM as compared to normal PCs that may
impact clinical outcomes (for instance, miR-16–2 and miR-30d). Further studies on functionally connected hub
genes (such as UBC, ITGA4, HSP90AB1, VCAM1, VCP), other potential seed genes (e.g., CDKN1A, CDKN2A,
MMP9, IGF1, MKI67), DEMs and their multidimensional networking with regulatory transcription factors
are needed for better understanding of their oncogenic/ anti tumor properties and to explore their synergistic
prognostic value.
Data availability
Gene expression (GSE125361) and miRNA expression (GSE125363) signatures in multiple myeloma have been
submitted to the National Center for Biotechnology Information (NCBI; https://www.ncbi.nlm.nih.gov/geo)
under BioProject accession number PRJNA515992.
Received: 20 December 2020; Accepted: 29 April 2021
References
1. Manier, S. et al. Genomic complexity of multiple myeloma and its clinical implications. Nat. Rev. Clin. Oncol. 14, 100–113 (2016).
2. Rustad, E. H. et al. Revealing the impact of structural variants in multiple myeloma. Blood Cancer Discov 1, 258–273 (2020).
3. Maura F, Bolli N, Angelopoulos N, Dawson KJ, Leongamornlert D, Martincorena I, Mitchell TJ, Fullam A, Gonzalez S, Szalat R,
Abascal F, Rodriguez-Martin B, et al. Genomic landscape and chronological reconstruction of driver events in multiple myeloma.
Nat Commun [Internet] 2019 [cited 2020 Oct 30];10. Available from: https://www.ncbi.nlm.nih.gov/pmc/articles/PMC6707220/
4. Walker, B. A. et al. Mutational spectrum, copy number changes, and outcome: results of a sequencing study of patients with newly
diagnosed myeloma. J. Clin. Oncol. 33, 3911–3920 (2015).
5. Walker, B. A. et al. Identification of novel mutational drivers reveals oncogene dependencies in multiple myeloma. Blood 132,
587–597 (2018).
6. Maura, F., Rustad, E. H., Boyle, E. M. & Morgan, G. J. Reconstructing the evolutionary history of multiple myeloma. Best Pract.
Res. Clin. Haematol. 33, 101145 (2020).
7. Botta C, Di Martino MT, Ciliberto D, Cucè M, Correale P, Rossi M, Tagliaferri P, Tassone P. A gene expression inflammatory
signature specifically predicts multiple myeloma evolution and patients survival. Blood Cancer J. 2016; 6.
8. Szalat, R., Avet-Loiseau, H. & Munshi, N. C. Gene expression profiles in myeloma: ready for the real world?. Clin. Cancer Res. 22,
5434–5442 (2016).
9. Kuiper, R. et al. A gene expression signature for high-risk multiple myeloma. Leukemia 26, 2406–2413 (2012).
10. Liu Y, Yu H, Yoo S, Lee E, Laganà A, Parekh S, Schadt EE, Wang L, Zhu J. A Network Analysis of Multiple Myeloma Related Gene
Signatures. Cancers (Basel) 2019; 11.
11. Went, M. et al. Transcriptome-wide association study of multiple myeloma identifies candidate susceptibility genes. Hum. Genom.
13, 1–8 (2019).
Scientific Reports | (2021) 11:10957 | https://doi.org/10.1038/s41598-021-90424-y 13
Vol.:(0123456789)www.nature.com/scientificreports/
12. Rojas, E. A. et al. Transcriptome analysis reveals significant differences between primary plasma cell leukemia and multiple
myeloma even when sharing a similar genetic background. Blood Cancer J. 9, 1–13 (2019).
13. Mitra, A. K. et al. A gene expression signature distinguishes innate response and resistance to proteasome inhibitors in multiple
myeloma. Blood Cancer J. 7, e581–e581 (2017).
14. Chung, T.-H., Mulligan, G., Fonseca, R. & Chng, W. J. A novel measure of chromosome instability can account for prognostic
difference in multiple myeloma. PLoS ONE 8, e66361 (2013).
15. de Boussac, H. et al. Kinome expression profiling to target new therapeutic avenues in multiple myeloma. Haematologica 1(105),
784–795 (2020).
16. Zhu, F.-X., Wang, X.-T., Zeng, H.-Q., Yin, Z.-H. & Ye, Z.-Z. A predicted risk score based on the expression of 16 autophagy-related
genes for multiple myeloma survival. Oncol. Lett. 18, 5310–5324 (2019).
17. Decaux, O. et al. Prediction of survival in multiple myeloma based on gene expression profiles reveals cell cycle and chromosomal
instability signatures in high-risk patients and hyperdiploid signatures in low-risk patients: a study of the Intergroupe Francophone
du Myélome. J. Clin. Oncol. 26, 4798–4805 (2008).
18. Bai, H. & Chen, B. A 5-gene stemness score for rapid determination of risk in multiple myeloma. Onco Targets Ther. 13, 4339–4348
(2020).
19. Zhou, Y. et al. Prediction of cytogenetic abnormalities with gene expression profiles. Blood 119, e148-150 (2012).
20. Shaughnessy, J. D. et al. A validated gene expression model of high-risk multiple myeloma is defined by deregulated expression of
genes mapping to chromosome 1. Blood 109, 2276–2284 (2007).
21. Dickens, N. J. et al. Homozygous deletion mapping in myeloma samples identifies genes and an expression signature relevant to
pathogenesis and outcome. Clin. Cancer Res. 16, 1856–1864 (2010).
22. Zhan, F. et al. Gene-expression signature of benign monoclonal gammopathy evident in multiple myeloma is linked to good
prognosis. Blood 109, 1692–1700 (2007).
23. Amin, S. B. et al. Gene expression profile alone is inadequate in predicting complete response in multiple myeloma. Leukemia 28,
2229–2234 (2014).
24. Chng, W. J. et al. Gene signature combinations improve prognostic stratification of multiple myeloma patients. Leukemia 30,
1071–1078 (2016).
25. Xu, P., Xia, T., Ling, Y. & Chen, B. MiRNAs with prognostic significance in multiple myeloma: A systemic review and meta-analysis.
Medicine (Baltimore) 98, e16711 (2019).
26. Xiang, T. et al. Identification of four potential predicting miRNA biomarkers for multiple myeloma from published datasets. PeerJ
5, e2831 (2017).
27. Gao, H., Wang, H. & Yang, W. Identification of key genes and construction of microRNA-mRNA regulatory networks in multiple
myeloma by integrated multiple GEO datasets using bioinformatics analysis. Int. J. Hematol. 106, 99–107 (2017).
28. Kassambara, A. et al. Global miRNA expression analysis identifies novel key regulators of plasma cell differentiation and malignant
plasma cell. Nucleic Acids Res. 45, 5639–5652 (2017).
29. Chi, J. et al. MicroRNA expression in multiple myeloma is associated with genetic subtype, isotype and survival. Biol. Direct 6, 23
(2011).
30. Wang, W. et al. Aberrant levels of mirnas in bone marrow microenvironment and peripheral blood of myeloma patients and disease
progression. J. Mol. Diagn. 17, 669–678 (2015).
31. Zhou, Y. et al. High-risk myeloma is associated with global elevation of miRNAs and overexpression of EIF2C2/AGO2. Proc. Natl.
Acad. Sci. USA 107, 7904–7909 (2010).
32. Lionetti, M. et al. Identification of microRNA expression patterns and definition of a microRNA/mRNA regulatory network in
distinct molecular groups of multiple myeloma. Blood 114, e20–e26 (2009).
33. Pichiorri, F., De Luca, L. & Aqeilan, R. I. MicroRNAs: new players in multiple myeloma. Front Genet 2, 22 (2011).
34. Handa H, Murakami Y, Ishihara R, Kimura-Masuda K, Masuda Y. The Role and Function of microRNA in the Pathogenesis of
Multiple Myeloma. Cancers (Basel) [Internet] 2019 [cited 2020 Jul 15];11. Available from: https://www.ncbi.nlm.nih.gov/pmc/artic
les/PMC6896016/
35. Chen D, Yang X, Liu M, Zhang Z, Xing E. Roles of miRNA dysregulation in the pathogenesis of multiple myeloma. Cancer Gene
Ther 2021
36. Abdi, J., Jian, H. & Chang, H. Role of micro-RNAs in drug resistance of multiple myeloma. Oncotarget 7, 60723–60735 (2016).
37. Misiewicz-Krzeminska I, Krzeminski P, Corchete LA, Quwaider D, Rojas EA, Herrero AB, Gutiérrez NC. Factors Regulating
microRNA Expression and Function in Multiple Myeloma. Noncoding RNA [Internet] 2019 [cited 2020 Jul 15];5. Available from:
https://www.ncbi.nlm.nih.gov/pmc/articles/PMC6468559/
38. Gutiérrez, N. C. et al. Deregulation of microRNA expression in the different genetic subtypes of multiple myeloma and correlation
with gene expression profiling. Leukemia 24, 629–637 (2010).
39. Corthals, S. L. et al. Micro-RNA-15a and micro-RNA-16 expression and chromosome 13 deletions in multiple myeloma. Leuk Res.
34, 677–681 (2010).
40. Federico C, Sacco A, Belotti A, Ribolla R, Cancelli V, Giacomini A, Ronca R, Chiarini M, Imberti L, Marini M, Rossi G, Presta M,
et al. Circulating microRNAs and Their Role in Multiple Myeloma. Noncoding RNA [Internet] 2019 [cited 2020 Jul 15];5. Available
from: https://www.ncbi.nlm.nih.gov/pmc/articles/PMC6631121/
41. Barrett, T. & Edgar, R. Mining microarray data at NCBI’s gene expression omnibus (GEO). Methods Mol. Biol. 338, 175–190 (2006).
42. Barrett, T. et al. NCBI GEO: archive for functional genomics data sets–update. Nucleic Acids Res. 41, D991-995 (2013).
43. Smyth GK. Linear models and empirical bayes methods for assessing differential expression in microarray experiments. Stat Appl
Genet Mol Biol 2004;3:Article3.
44. Benjamini, Y. & Hochberg, Y. Controlling the false discovery rate: a practical and powerful approach to multiple testing. J. Roy.
Stat. Soc.: Ser. B (Methodol.) 57, 289–300 (1995).
45. Rajkumar, S. V. et al. International Myeloma Working Group updated criteria for the diagnosis of multiple myeloma. Lancet Oncol.
15, e538-548 (2014).
46. Katiyar A, Sharma S, Singh TP, Kaur P. Identification of Shared Molecular Signatures Indicate the Susceptibility of Endometriosis
to Multiple Sclerosis. Front Genet [Internet] 2018 [cited 2020 Jul 21];9. Available from: https://www.ncbi.nlm.nih.gov/pmc/artic
les/PMC5820528/
47. Arasappan, D., Tong, W., Mummaneni, P., Fang, H. & Amur, S. Meta-analysis of microarray data using a pathway-based approach
identifies a 37-gene expression signature for systemic lupus erythematosus in human peripheral blood mononuclear cells. BMC
Med. 9, 65 (2011).
48. Taminau J, Lazar C, Meganck S, Nowé A. Comparison of Merging and Meta-Analysis as Alternative Approaches for Integrative
Gene Expression Analysis. ISRN Bioinform [Internet] 2014 [cited 2020 Jul 21];2014. Available from: https://www.ncbi.nlm.nih.
gov/pmc/articles/PMC4393058/
49. Reimand, J., Kull, M., Peterson, H., Hansen, J. & Vilo, J. g:Profiler–a web-based toolset for functional profiling of gene lists from
large-scale experiments. Nucleic Acids Res. 35, W193-200 (2007).
50. Piñero J, Queralt-Rosinach N, Bravo À, Deu-Pons J, Bauer-Mehren A, Baron M, Sanz F, Furlong LI. DisGeNET: a discovery plat-
form for the dynamical exploration of human diseases and their genes. Database (Oxford) [Internet] 2015 [cited 2020 Jul 15];2015.
Available from: https://www.ncbi.nlm.nih.gov/pmc/articles/PMC4397996/
Scientific Reports | (2021) 11:10957 | https://doi.org/10.1038/s41598-021-90424-y 14
Vol:.(1234567890)You can also read