Calcium Positively Mediates Blue Light-Induced Anthocyanin Accumulation in Hypocotyl of Soybean Sprouts
←
→
Page content transcription
If your browser does not render page correctly, please read the page content below
ORIGINAL RESEARCH
                                                                                                                                       published: 28 May 2021
                                                                                                                                doi: 10.3389/fpls.2021.662091

                                             Calcium Positively Mediates Blue
                                             Light-Induced Anthocyanin
                                             Accumulation in Hypocotyl of
                                             Soybean Sprouts
                                             Gang Hu, Xiaomeng Yue, Jinxue Song, Guipei Xing, Jun Chen, Haixia Wang, Nana Su* and
                                             Jin Cui*

                                             College of Life Sciences, Nanjing Agricultural University, Nanjing, China

                                             Soybean sprouts are a flavorful microgreen that can be eaten all year round and are
                            Edited by:       widely favored in Southeast Asia. In this study, the regulatory mechanism of calcium
                     Antonio Ferrante,
               University of Milan, Italy
                                             on anthocyanin biosynthesis in soybean sprouts under blue light was investigated.
                       Reviewed by:
                                             The results showed that blue light, with a short wavelength, effectively induced
                              Biao Lai,      anthocyanin accumulation in the hypocotyl of soybean sprout cultivar “Dongnong
    Yangtze Normal University, China
                                             690.” Calcium supplementation further enhanced anthocyanin content, which was
                     Zhang Zongying,
               Shandong Agricultural         obviously inhibited by LaCl3 and neomycin treatment. Moreover, exogenous calcium
                      University, China      changed the metabolism of anthocyanins, and seven anthocyanin compounds were
                        Yuncong Yao,
   China Agricultural University, China
                                             detected. The trend of calcium fluorescence intensity in hypocotyl cells, as well as that
                   *Correspondence:
                                             of the inositol 1,4,5-trisphosphate and calmodulin content, was consistent with that
                                Jin Cui      of anthocyanins content. Specific spatial distribution patterns of calcium antimonate
                    cuijin@njau.edu.cn
                                             precipitation were observed in the ultrastructure of hypocotyl cells under different
                              Nana Su
                  sunana@njau.edu.cn         conditions. Furthermore, calcium application upregulated the expression of genes related
                                             to anthocyanin biosynthesis, and calcium inhibitors suppressed these genes. Finally,
                   Specialty section:        transcriptomics was performed to gain global insights into the molecular regulation
         This article was submitted to
        Crop and Product Physiology,         mechanism of calcium-associated anthocyanin production. Genes from the flavonoid
               a section of the journal      biosynthesis pathway were distinctly enriched among the differentially expressed genes,
            Frontiers in Plant Science
                                             and weighted gene co-expression network analysis showed that two MYBs were related
          Received: 31 January 2021
                                             to the accumulation of anthocyanins. These results indicated that calcium released
            Accepted: 30 April 2021
            Published: 28 May 2021           from apoplast and intracellular stores in specific spatial-temporal features promote blue
                              Citation:      light-induced anthocyanin accumulation by upregulation of the expression of genes
Hu G, Yue X, Song J, Xing G, Chen J,         related to anthocyanin synthesis of “Dongnong 690” hypocotyl. The findings deepen the
      Wang H, Su N and Cui J (2021)
     Calcium Positively Mediates Blue        understanding of the calcium regulation mechanism of blue light-induced anthocyanin
           Light-Induced Anthocyanin         accumulation in soybean sprouts, which will help growers produce high-quality foods
Accumulation in Hypocotyl of Soybean
                                             beneficial for human health.
 Sprouts. Front. Plant Sci. 12:662091.
      doi: 10.3389/fpls.2021.662091          Keywords: soybean sprouts, calcium, blue light, flavonoid, anthocyanins

Frontiers in Plant Science | www.frontiersin.org                                     1                                   May 2021 | Volume 12 | Article 662091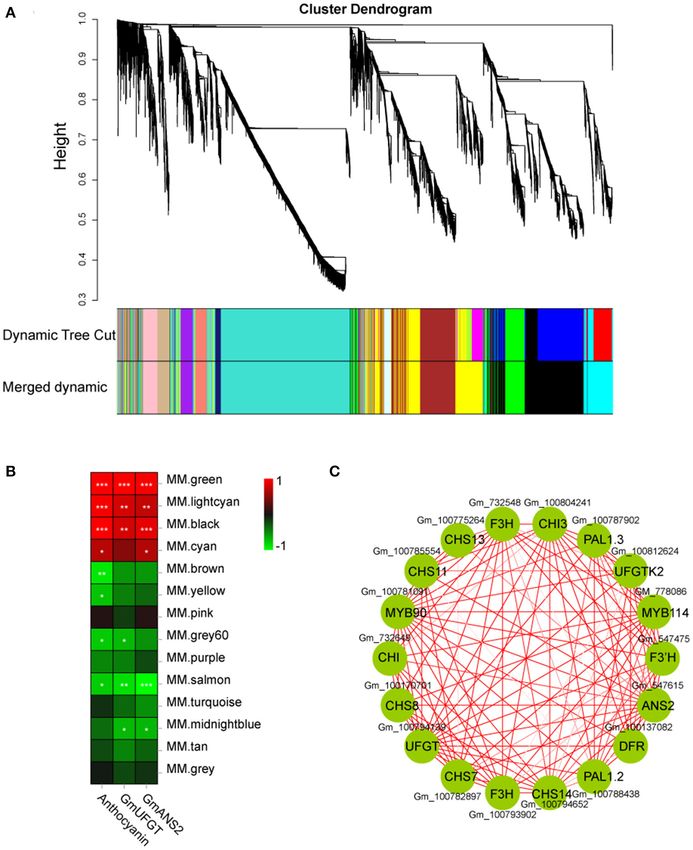
Hu et al.                                                                                            Calcium Contributes to Anthocyanin Accumulation

INTRODUCTION                                                               levels in Alternanthera bettzickiana seedlings. A recent study
                                                                           has reported that Ca2+ /calmodulin (CaM) specifically targeted
Anthocyanins, derived from the metabolic pathway of                        FvUGT1 at a site partially overlapping with the interdomain
phenylpropane, are important nutritional components of                     linker in grape cell (Peng et al., 2016). Soybean sprouts are
fruits and vegetables. The visible color imparted by anthocyanins          a fresh, nutritious microgreen, and can be mass-produced
attracts pollinators to promote plant reproduction (Andersen               in a short period of time. However, to date, in-depth and
and Markham, 2005). In addition, anthocyanins are active                   comprehensive studies of the calcium-regulated anthocyanin
oxygen scavengers that respond to biotic and abiotic stress,               synthesis mechanism in soybean sprouts under blue light are
thereby maintaining the normal growth and development of                   still limited. In this study, we systematically elaborated the
plants (Gould et al., 2002). For humans, anthocyanins are a                regulation mechanism of calcium on anthocyanin synthesis
powerful antioxidant and are widely present in the daily diet              in soybean sprouts under blue light from the perspective
to promote health (Bassolino et al., 2013). Studies have shown             of calcium at the tissue and subcellular level, combined
that consumption of anthocyanins can reduce the risk of cancer,            with transcriptomics. The findings could contribute to genetic
diabetes, and cardiovascular disease (He and Giusti, 2010;                 engineering aimed at increasing the anthocyanin content
Tsuda, 2012).                                                              of vegetables.
   The mechanism of anthocyanin biosynthesis has been
clearly elucidated in many species (Almeida et al., 2007).
Many structural genes have been identified to play specific                MATERIALS AND METHODS
roles in the anthocyanin biosynthetic pathway, namely, early
                                                                           Plant Materials and Treatment
biosynthetic genes chalcone isomerase (CHI), chalcone synthase
                                                                           Soybean seeds (Glycine max L., cv. “Dongnong 690”) were
(CHS), flavanone 3-hydroxylase (F3H), flavonoid 3′ -hydroxylase
                                                                           disinfected with 0.5% NaClO for 30 min and then washed with
(F3′ H), and late biosynthetic genes UDP-glucose: flavonoid 3-O-
                                                                           distilled water. The sterilized seeds were soaked in distilled water
glucosyltransferase (UFGT), dihydroflavonol 4-reductase (DFR),
                                                                           for 8 h to facilitate germination. Germinated seeds were then
and anthocyanidin synthase (ANS) (Hichri et al., 2011). Some
                                                                           evenly sown in a tray with two layers of gauze to sprout. The
structural genes are usually regulated by members of the MBW
                                                                           sprouts were then exposed to three light qualities (continuous
complex, composed of the R2R3-MYB transcription factor, basic
                                                                           radiation with an intensity of 30 µmol/m2 /s) with different
helix-lool-helix (bHLH), and WD repeat domain containing
                                                                           culture solutions. The different treatments were as follows:
proteins (WD40). For example, MdMYB308L physically interacts
                                                                           (1) D: cultivated with purified water without light; (2) W:
with MdbHLH33 and enhances its binding to the MdDFR
                                                                           cultivated with purified water under white light radiation; (3)
promoter to improve anthocyanin accumulation in apple (An
                                                                           B: cultivated with purified water under blue light radiation;
et al., 2020). Few MYBs are involved in the inhibition of
                                                                           (4) B + CaCl2 : cultivated with 3 mM CaCl2 under blue light
anthocyanin biosynthesis. In addition, members of MBW
                                                                           radiation; (5) B + LaCl3 : cultivated with 1 mM LaCl3 under
synergistically regulate anthocyanin biosynthesis by interacting
                                                                           blue light radiation; and (6) B+ neomycin: cultivated with
with other transcription factors, such as COP1, NAC, and WRKY
                                                                           1 mM neomycin under blue light radiation. Temperature and
(Zhou et al., 2015).
                                                                           relative humidity during cultivation were maintained at 25◦ C and
   Light-emitting diode (LED) light bulbs have recently been
                                                                           80%, respectively.
used in controlled-environment agriculture to grow vegetables,
                                                                              Uniformly sized sprouts were harvested at 24 and 36 h. Fresh
aiming to regulate the photosynthesis of secondary metabolism
                                                                           hypocotyls with deeply pigmented parts were randomly sampled
(Alrifai et al., 2019). Secondary metabolites in plants are affected
                                                                           for microscopic observation and biochemical measurement.
by the quality of light. The expression of CRY2/3, SPAs,
                                                                           Others were immediately frozen in liquid nitrogen and stored at
HY5, and R2R3-MYBs are activated by blue light, leading to
                                                                           −80◦ C for further analysis.
anthocyanin accumulation in tea plants (Zheng et al., 2019).
Red light promotes the accumulation of proanthocyanidins in
strawberry, possibly by inducing the expression of LAR and ANR             Anthocyanin Extraction and Measurement
(Zhang et al., 2018b). Ultraviolet (UV) radiation increases the            The total anthocyanin content was extracted from the
expression of late biosynthetic genes (VcDFR, VcANS, VcUFGT,               corresponding hypocotyl tissue using an extraction solution
and VcMYB) in developing blueberries, causing anthocyanin                  (49.9% ddH2 O, v/v; 50% methanol, v/v; and 0.1% HCl
biosynthesis (Yang et al., 2018).                                          v/v), and measured as described in the previous study
   Calcium is a widespread second messenger that plays a specific          (Zhang et al., 2018a).
role in the development and growth of plants. Many studies
have shown that calcium enhances anthocyanin accumulation                  Identification of Anthocyanin Profiles
by the upregulation of genes related to anthocyanin biosynthesis           The qualitative analysis of the anthocyanin profile was based on
(Zhu et al., 2019). In Arabidopsis, changes in endogenous Ca2+             previous study (Zhang et al., 2019). Fresh hypocotyl samples (2 g)
levels modulated sucrose-induced sugar uptake, which in turn               were extracted with 6 ml methanol containing 1% (w/v) HCl, and
regulated anthocyanin accumulation (Dong et al., 2012). In                 the mixture was sonicated at 20◦ C for 10 min. The supernatant
a study by Wang et al. (2005), chlorpromazine pretreatment                 was collected after centrifugation and filtered with a 0.22-µm
inhibited the activity of CaM, causing a reduction in anthocyanin          nylon membrane for further analysis.

Frontiers in Plant Science | www.frontiersin.org                       2                                       May 2021 | Volume 12 | Article 662091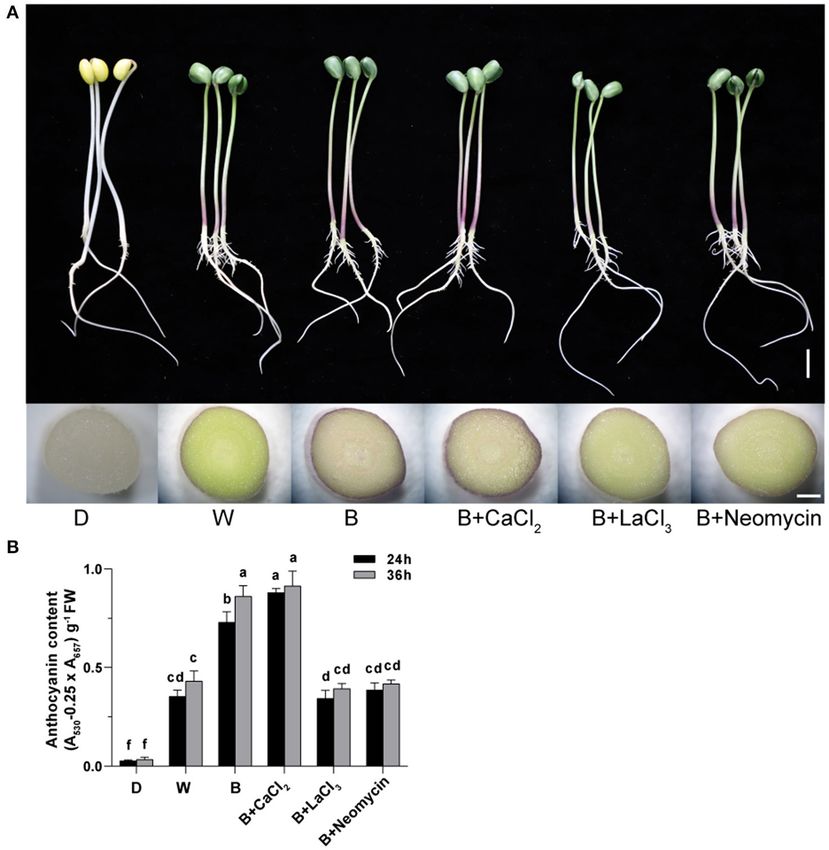
Hu et al.                                                                                                                  Calcium Contributes to Anthocyanin Accumulation

 FIGURE 1 | Effects of light, CaCl2, and Ca2+ inhibitors on phenotype of “Dongnong 690” sprouts and total anthocyanin content in hypocotyl in different treatments.
 (A) Phenotype of “Dongnong 690” sprouts (up panel, bar = 1 cm) and cross section of hypocotyl (down panel, bar = 0.1 cm) under different conditions, 24 h after
 sowing. (B) The total content anthocyanin in hypocotyls, 24 and 36 h after sowing. Values are the mean ± SE of triplicate (n = 3). The different letters represent
 significant differences among various treatments (p < 0.05). The different treatments were as follows: (1) D: cultivated with purified water without light; (2) W: cultivated
 with purified water under white light radiation; (3) B: cultivated with purified water under blue light radiation; (4) B + CaCl2 : cultivated with 3 mM CaCl2 under blue light
 radiation; (5) B + LaCl3 : cultivated with 1 mM LaCl3 under blue light radiation; and (6) B + neomycin: cultivated with 1 mM neomycin under blue light radiation.

   The sample was qualitatively identified using the Xevo                                  Calcium Imaging
G2-XS Q-TOF high resolution mass spectrometer (Waters,                                     Calcium in hypocotyl cells was observed using indicator Fluo-
Milford, MA, United States). A 2-µL solution was injected                                  3 AM. The hypocotyl tissues with deeply pigmented part were
into the analytical column (ACQUITY UPLCTM BEH C18,                                        cut into thin slices by hand and loaded with Fluo-3 a.m. in
2.1 × 100 mm, 1.7 µm particle size), and the flow rate was                                 a 20-mm Hank’s balanced salt solution (HBSS) buffer for
0.4 ml min−1 . Solvent A was 0.1% formic acid in water,                                    40 min at 37◦ C. The stained tissues were washed in a 10-
and solvent B was 0.1% formic acid in acetonitrile. The                                    mM 2-[4-(2-hydroxyethyl)-1-piperazinyl] ethanesulfonic acid
elution gradient was applied as follows: 0–2 min, 5% B; 2–                                 (HEPES) buffer three times and incubated at 37◦ C for 10 min
17 min, 5–95% B; 17–19 min, 95% B; 19–24 min, 95–5% B.                                     in the dark. Calcium signal was assessed using a 488-nm
Positive ion mode was used with a capillary voltage of                                     excitation filter in combination with a 525–530 nm emission filter
2.5 kV. MSE acquisition modes were adopted for 150-1,E                                     on a confocal laser scanning microscope system (Carl Zeiss,
m/z. Other parameters were set as follows: ramp collision                                  Oberkochen, Germany).
energy, 20–30 eV; source temperature, 120◦ C; and desolvation
gas temperature, 400◦ C. Masslynx 4.1 was used for data                                    Cytochemical Localization of Calcium and
collection and processing (Waters Co., United States). Daidzein                            Ultrastructural Observation
(30 µM) was used as an internal standard. The relative                                     Cytochemical localization of calcium in soybean hypocotyl cells
content of anthocyanins was expressed as peak area of                                      was performed following the method of Jian et al. (1997) with
the sample/standards.                                                                      some modifications. Hypocotyl segments (1 mm3 cubes) were

Frontiers in Plant Science | www.frontiersin.org                                       3                                               May 2021 | Volume 12 | Article 662091
Hu et al. Calcium Contributes to Anthocyanin Accumulation
immersed in fixative solution containing 4% glutaraldehyde and
Each value is the mean ± SE (n = 3). Values followed by different letters within the same row are significantly different at P < 0.05 according to the multiple test of Duncan. “ND” means not detected. The different treatments were as
follows: (1) D: cultivated with purified water without light; (2) W: cultivated with purified water under white light radiation; (3) B: cultivated with purified water under blue light radiation; (4) B + CaCl2 : cultivated with 3 mM CaCl2 under blue
0.0422 ± 0.0060b
0.6193 ± 0.0064c
0.0288 ± 0.0026c
0.6059 ± 0.0028c
2% potassium antimonate in 0.1 mol L−1 of phosphate buffer (pH
B+Neomycin
7.6) for 8 h at 4◦ C. After fixation, the samples were washed three
times (10 min each) with 0.1 M potassium phosphate buffer (pH
7.6) containing 2% potassium antimonate, and then fixed in 1%
ND
ND
ND
ND
ND
osmium tetroxide for 2 h. The samples were then washed twice
in phosphate buffer containing 2% potassium antimonate, and
0.0340 ± 0.0029c
0.6077 ± 0.0044c
0.0318 ± 0.0018c
0.6055 ± 0.0020c
then washed twice with distilled water. Thereafter, the samples
were dehydrated in an ethanol series and embedded in EMbed
B+LaCl3
812 (EMS, New Jersey, United States). The embedded samples
were then sectioned with an EM UC7 ultramicrotome (Leica,
ND
ND
ND
ND
ND
Germany) at a thickness of 80 nm. Finally, the sections were
observed using an H-7650 transmission electron microscope
0.6788 ± 0.0152b
0.0948 ± 0.0061a
0.1380 ± 0.0016a
0.9689 ± 0.0025a
0.1434 ± 0.0021a
0.3154 ± 0.0038a
2.2126 ± 0.0041a
0.0630 ± 0.0046
light radiation; (5) B + LaCl3 : cultivate with 1 mM LaCl3 under blue light radiation; and (6) B + neomycin: cultivated with 1 mM neomycin under blue light radiation. 24 h after sowing.
(Hitachi Co., Tokyo, Japan).
Relative abundance
B+CaCl2
Measurement of IP3 and CaM Content
IP3 content was determined according to the instruction of
ND
plant the 1,4,5-trisphosphate kit (GE Healthcare, Chicago, IL,
United States). Fresh hypocotyl tissue (0.5 g) was ground into
0.0429 ± 0.0023b
0.1130 ± 0.0018b
0.3335 ± 0.0035b
0.0411 ± 0.0006b
1.3515 ± 0.0034b
0.7797 ± 0.0015a
0.1271 ± 0.0015a
powder in liquid nitrogen and 0.5 ml of 20% perchloric acid
was added. Subsequently, the mixture was incubated on ice for
20 min. The precipitated protein was removed by centrifugation
(4◦ C; 2,000 × g; 10 min). Then, the collected supernatant
ND
ND
B
was used to determine the IP3 content. CaM concentration
was measured using a plant CaM content assay kit (Kmaels
0.3571 ± 0.0035d
0.6062 ± 0.0015c
0.2491 ± 0.0034
Biotech, Shanghai, China). Fresh hypocotyl tissue (0.5 g) was
ground to powder in liquid nitrogen and homogenized in
50 mM Tris-HCl buffer (containing 1 mM egtazic acid [EGTA],
0.5 mM phenylmethylsulfonyl fluoride [PMSF] and 1 mM β- ND
ND
ND
ND
ND
ND
W
mercaptoethanol). The extract was disintegrated by ultrasonic
treatment for 2 min, incubated in a water bath at 95◦ C for 3 min,
TABLE 1 | Anthocyanin profile in hypocotyl of “Dongnong 690” sprouts grown in different treatments.
ND
ND
ND
ND
ND
ND
ND
ND
D
and then centrifuged (10,000 × g; 4◦ C; 20 min). Finally, the
supernatant was collected for the analysis of CaM content.
Pelargonidin 3-O-(6′′ -succinyl-glucoside)
Cyanidin 3-O-(6′′ -acetyl-galactoside)
RNA Extraction, Library Preparation, and
Pelargonidin 3-O-sambubioside
RNA-Sequencing
Pelargonidin 3-O-galactoside
Petunidin 3,5-O-diglucoside
Malvidin 3,5-O-diglucoside
Total RNA was extracted from hypocotyl tissue using the
Malvidin 3-O-galactoside
TRIzol RNA plant plus reagent (Tiangen, Beijing, China).
RNA quality was assessed using an Agilent 2100 Bioanalyzer
(Agilent Technologies, Palo Alto, CA, United States). Samples
Compounds
Pelargonidin
with an RNA integrity number score > 7.5 were selected
for deep sequencing. The RNA-Seq library was constructed
Total
using the TruSeqTM RNA sample preparation Kit for Illumina
(San Diego, CA, United States) from 24 samples, including
hypocotyls harvested at 24 and 36 h in dark, white light, blue
Observed RT (min)
light, and blue light plus LaCl3 treatment. The library was
sequenced on the Illumina HiSeqTM 2,500 sequencing platform
by Genedenovo Biotechnology Co., Ltd (Guangzhou, China).
10.23
11.07
Clean reads were obtained by removing reads that contain
3.02
5.34
5.10
5.65
5.33
3.75
adapter, with undetermined base, and with low-quality from
raw reads. The transcriptome sequencing results are shown in
Observed m/z
Supplementary Table 3.
641.1734
565.1544
565.1544
533.1284
271.0602
493.1323
493.1323
491.1159
Transcriptome and Quantitative
Polymerase Chain Reaction Analysis
The clean reads were aligned to the reference genome of Glycine
No
max after the removal of adapters and low-quality sequences.
1
2
3
4
5
6
7
8
Frontiers in Plant Science | www.frontiersin.org 4 May 2021 | Volume 12 | Article 662091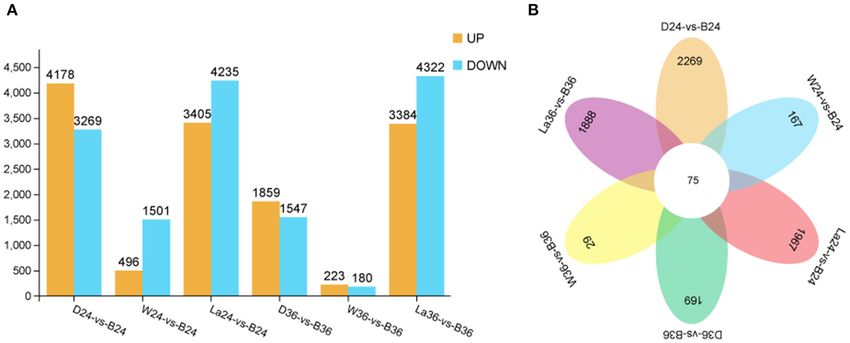
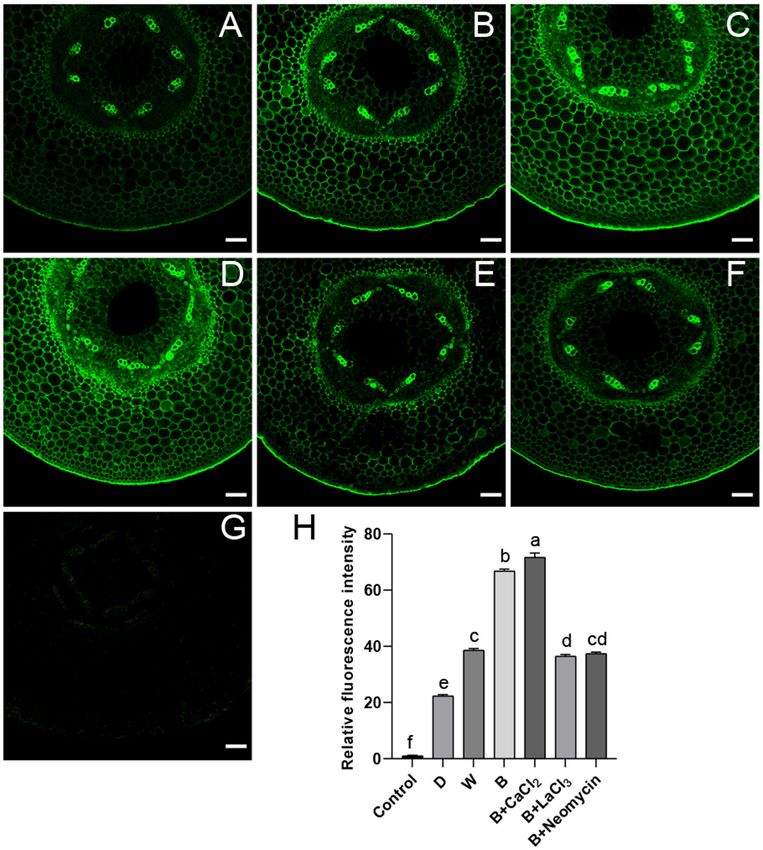
Hu et al.                                                                                                             Calcium Contributes to Anthocyanin Accumulation

 FIGURE 2 | Green fluorescent image of calcium in “Dongnong 690” hypocotyl cells at 24 h under different conditions. (A–F) stand for treat with dark, white light, blue
 light, blue light + 3mM CaCl2 , blue light + 1mM LaCl3, and blue light + 1mM neomycin, respectively. (G) Hypocotyl was treated with distilled water without addition of
 probe. (H) Relative fluorescence intensity of calcium in different treatments. bar = 100 µm. Values are the mean ± SE of triplicate (n = 3). The different letters
 represent significant differences among various treatments (p < 0.05).

To assess sequence quality, the saturation and gene coverage                           95◦ C for 2 min, followed by 40 cycles of 95◦ C for 10 s, 60◦ C for
were analyzed using the RSeQC-2.3.6 software. Fragments per                            30 s, and 72◦ C for 30 s. ELF1B was used as the housekeeping gene
kilobase per million reads (FPKM) was used to determine                                (Jian et al., 2008). Specific primers were designed using Primer
the expression level of each transcript (Varet et al., 2016).                          5 (Supplementary Table 1). Relative gene expression levels were
Significantly differentially expressed genes (DEGs) were defined                       calculated using the 2−11CT method (Vandesompele et al., 2002).
as genes with P-adjust < 0.05 and |log2FC |≥ 1. The raw counts of
each transcript were compared using DESeq2 software to detect                          Weighted Gene Co-expression Network
significant DEGs between pairwise comparison. Genetic Output                           Analysis
Analysis Tool (GOAT) and R package were used to perform Gene                           Weighted gene co-expression network analysis (WGCNA) was
Ontology (GO) enrichment analysis and Kyoto Encyclopedia of                            performed using an R package (Zhang and Horvath, 2005).
Genes and Genomes (KEGG) enrichment analysis (P-adjust <                               Module detection and network construction were performed
0.05 after Benjamini and Hochberg correction).                                         using an unsigned type of topological overlap matrix, a minimal
   Quantitative real-time PCR (qRT-PCR) was carried out on                             module size of 50, a power β of 10, and a branch merge
a Mastercycler ep realplex Real-time PCR System (Eppendorf,                            cut height of 0.7. The module eigengene value was used
Hamburg, Germany) using Bestar SYBR Green qPCR Mastermix                               to evaluate the correlation between the modules and the
(DBI, Bioscience Inc., Germany). Reactions were performed at                           anthocyanin content of 24 samples. The most significant module

Frontiers in Plant Science | www.frontiersin.org                                   5                                              May 2021 | Volume 12 | Article 662091
Hu et al. Calcium Contributes to Anthocyanin Accumulation
FIGURE 3 | The localization of calcium antimony precipitates in “Dongnong 690” hypocotyl cells at 24 h under different conditions. (A–F) stand for treat with dark,
white light, blue light, blue light + 3 mM CaCl2 , blue light + 1 mM LaCl3, and blue light + 1 mM neomycin, respectively. bar = 1 µm. Arrows and ovals indicate
precipitates of calcium. CW: cell wall. IS: intercellular space.
was “MM. green” based on 22 genes (Supplementary Table 2) treatments caused the hypocotyl to appear purple-red, which was
with a WGCNA edge weight > 0.80, which was given using obviously induced to accumulate anthocyanins. Whole areas of
Cytoscape 3.3.0. the hypocotyl profile in B were deeply colored compared with
those in W (Figure 1A). The TAC of the hypocotyl in the D, W,
Statistical Analysis and B treatments were obtained (Figure 1B). The TAC began to
At least three independent experiments were performed for each be produce rapidly under light irradiation after 24 h. The TAC in
treatment. Data were expressed as mean ± standard error (SE) B was two-fold higher than that in the W treatment at 24 h. With
after one-way analysis of variance (ANOVA) using the SPSS 17.0 continuous light exposure of up to 36 h, the TAC in B was further
program (SPSS Inc. Chicago, IL, United States). The data were enhanced, but it did not significantly fluctuate in W (Figure 1B).
statistically analyzed using the multiple range test of Duncan These results indicate that blue light is more effective than
(P < 0.05). white light in inducing the accumulation of anthocyanins in
“Dongnong 690” hypocotyls. Furthermore, exogenous calcium
RESULTS significantly increased TAC by 20.5% compared with that of
only B radiation at 24 h, but no significant improvement was
Anthocyanin Accumulation in Hypocotyl of observed at 36 h. By contrast, the application of LaCl3 and
Soybean Sprouts neomycin obviously weakened the positive effects of calcium
The phenotype of soybean sprouts and total anthocyanin content on TAC throughout the experiment. Meanwhile, compared with
(TAC) of hypocotyl under different conditions were analyzed only B treatment, calcium inhibitors notably prevented the
(Figure 1). Compared with the D treatment, the W and B accumulation of anthocyanins (Figure 1B).
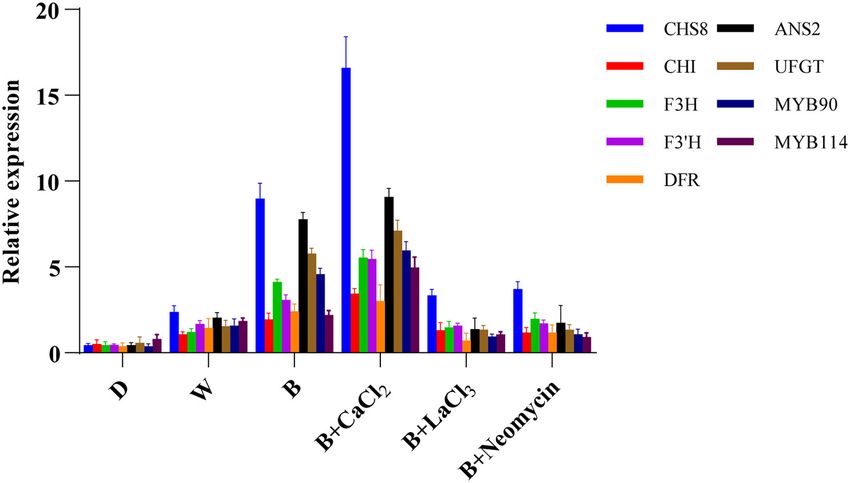
Frontiers in Plant Science | www.frontiersin.org 6 May 2021 | Volume 12 | Article 662091Hu et al. Calcium Contributes to Anthocyanin Accumulation FIGURE 4 | IP3 content (A) and CaM content (B) in “Dongnong 690” hypocotyls at 24 h under different conditions. Values are the mean ± SE of triplicate (n = 3). The different letters represent significant differences among various treatments (p < 0.05). The different treatments were as follows: (1) D: cultivated with purified water without light; (2) W: cultivated with purified water under white light radiation; (3) B: cultivated with purified water under blue light radiation; (4) B + CaCl2 : cultivated with 3 mM CaCl2 under blue light radiation; (5) B + LaCl3 : cultivated with 1 mM LaCl3 under blue light radiation; and (6) B + neomycin: cultivated with 1 mM neomycin under blue light radiation. FIGURE 5 | Expression level of genes related to anthocyanin biosynthesis at 24 h in “Dongnong 690” hypocotyls under different conditions. Values are the mean ± SE of triplicate (n = 3). The different treatments were as follows: (1) D: cultivated with purified water without light; (2) W: cultivated with purified water under white light radiation; (3) B: cultivated with purified water under blue light radiation; (4) B + CaCl2 : cultivated with 3 mM CaCl2 under blue light radiation; (5) B + LaCl3 : cultivated with 1 mM LaCl3 under blue light radiation; and (6) B + neomycin: cultivated with 1 mM neomycin under blue light radiation. Analysis of Anthocyanin Profile abundant compound was pelargonidin 3-O-galactoside in B+ The composition of anthocyanins from hypocotyl was analyzed CaCl2 , with a proportion of 32.4%. In addition to reducing using a high resolution mass spectrometer (Table 1). CaCl2 the TAC, LaCl3 and neomycin lessened the composition of treatment promoted the production of a new monomer, anthocyanins, with only three components. Date showed that pelargonidin 3-O-(6′′ -succinyl-glucoside), and increased the dark conditions did not stimulate anthocyanin accumulation. content of some monomers. For instance, the content of Under W irradiation, two anthocyanin individuals were detected, pelargonidin 3-O-galactoside and cyanidin 3-O-(6′′ -acetyl- of which malvidin 3,5-O-diglucoside only responded to white galactoside) in the B+ CaCl2 treatment was 2.9- and 7.7-fold, light. Significant changes based on the anthocyanin composition respectively, higher than that in the only B treatment. The most were observed in B. A total of six anthocyanin individuals Frontiers in Plant Science | www.frontiersin.org 7 May 2021 | Volume 12 | Article 662091
Hu et al. Calcium Contributes to Anthocyanin Accumulation
FIGURE 6 | Differentially expressed genes identified by RNA-seq analysis in hypocotyl of sprouts. (A) Number of DEGs between D vs B, W vs B, and La vs B groups
at 24 and 36 h after illumination. (B) Venn diagram representation of total genes from D, W, B, and La groups at 24 and 36 h after illumination. D: dark. W: white light.
B: blue light. La: blue light + 1 mM LaCl3 , 24 or 36h.
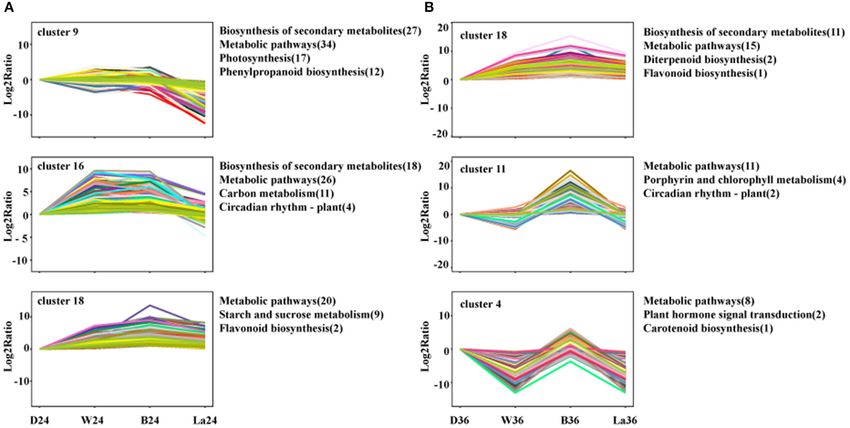
FIGURE 7 | Cluster analysis of DEGs with significant expression profile changes and KEGG pathway enrichment analysis at 24h (A) and 36h (B). All the DEGs were
subjected to complete-linkage hierarchical clustering using a Euclidean distance metric and divided into 20 clusters at two time points. Enriched KEGG pathways are
listed to the right of each cluster. D: dark. W: white light. B: blue light. La: blue light + 1 mM LaCl3 , 24 or 36 h.
were obtained, such as cyanidin, pelargonidin, malvidin, AM). Hypocotyl not incubated with Fluo-3 AM showed faint
and petunidin derivatives. Among them, pelargonidin-based spontaneous fluorescence as a control (Figures 2G,H). After
anthocyanins were predominant, followed by cyanidin-based CaCl2 supplementation in B, the brightest green fluorescent
anthocyanins. The result shown in Table 1 is consistent with the signal was observed, mainly distributed in the stele and
total anthocyanin content in different treatments, as shown in endothelial cells of hypocotyl (Figures 2D,H). On the contrary,
Figure 1B. treated with LaCl3 or neomycin, the fluorescence brightness of
the hypocotyl section was obviously weakened, showing a distinct
Intensity of Calcium in Hypocotyl Profile inhibitory effect (Figures 2E,F,H). Compared with D, the cross
The correlation between calcium and anthocyanin accumulation section of hypocotyl in the W and B treatments showed a strong
was investigated using a dye-based calcium indicator (Fluo-3 fluorescent signal (Figures 2A–C,H). The relative fluorescence
Frontiers in Plant Science | www.frontiersin.org 8 May 2021 | Volume 12 | Article 662091Hu et al. Calcium Contributes to Anthocyanin Accumulation
FIGURE 8 | Weighted gene co-expression network analysis of DEGs identified in soybean sprout hypocotyl. (A) Hierarchical cluster tree showing 14 modules of
co-expressed genes. Each of the DEGs is represented by a leaf in tree, and each of the modules by a major tree branch. The lower panel shows modules in
designated colors. (B) Module-trait correlations and corresponding significant differences. The panel shows 14 modules. The color scale indicates module-trait
correlations. Panel labeled “GmUFGT,” “GmANS2,” and “Anthocyanins” as a trait. (C) Cytoscape representation of co-expressed genes with the edge weights ≥.8 in
the “MM.green” module. Member gene IDs are given.
intensity of the hypocotyl profile in B was higher than that in W D (Figure 3A). In the W treatment, denser sphere-like particles
(Figures 2B,C,H). were scattered in the cytoplasm (Figure 3B). The obvious change
was that many larger intensive precipitates in agglomerate form
Distribution of Calcium in Hypocotyl Cells were observed in the cytoplasm in B (Figure 3C). After CaCl2
The distribution of calcium in the subcellular structure of supplementation in B, a large amount of sludge deposits appeared
hypocotyl was explored. Calcium antimonate precipitate is an around the cell membrane, and a spot of particles was found
electron-dense particle used to observe calcium localization. in the cell wall (Figure 3D). Compared with the B + CaCl2
Calcium precipitates were distributed in the cytoplasm and near treatment, the black precipitation in the cytoplasm was obviously
the cell membrane as a small number of tiny irregular particles in reduced by the LaCl3 and neomycin treatments (Figures 3E,F).
Frontiers in Plant Science | www.frontiersin.org 9 May 2021 | Volume 12 | Article 662091Hu et al. Calcium Contributes to Anthocyanin Accumulation
Determination of IP3 and CaM Content (Supplementary Figure 1), representing different expression
To determine the role of IP3 and CaM in the calcium patterns. Then, KEGG pathway enrichment analysis was
signaling pathway for anthocyanin synthesis, their contents performed to comprehensively observe the biological pathways
were measured. Compared with the blue radiation treatment, enriched in clusters with similar expression trends. The
exogenous calcium supplementation further increased the IP3 transcripts in samples treated with LaCl3 in clusters enriched in
content, which was the highest level among all treatments. the biosynthesis of secondary metabolites, metabolic pathways,
On the contrary, LaCl3 reduced the IP3 content in the B and flavonoid biosynthesis were all downregulated compared
treatment, reaching a level comparable with that in the D with those in the B treatment (Figure 7). Furthermore, flavonoid
treatment. Neomycin application reinforced this inhibitory effect biosynthesis was enriched in Cluster 18, included in both 24 and
(Figure 4A). The content of IP3 in hypocotyl in B was higher than 36 h groups, and contained genes with similar expression patterns
that in the D and W treatments (Figure 4A). Similarly, CaCl2 but with different relative Log2 ratio in the same treatment
application further elevated the CaM content compared with the (Figure 7).
blue radiation treatment, reaching the highest level. Conversely, DEGs were studied by performing weighted gene co-
treatment with LaCl3 resulted in the lowest CaM content, expression network analysis (WGCNA), identifying 14 modules
followed by neomycin treatment (Figure 4B). In addition, the (Figure 8A). The analysis of module-trait relationships showed
CaM content in hypocotyl showed a gradient trend among three that the “MM.green” module was highly correlated with the
light qualities (Figure 4B). Compared with the D treatment, the anthocyanin content in 24 samples (Figure 8B). Therefore,
CaM content in the W and B treatments increased by 24.5 and the genes related to this module might play a key role in
43.4%, respectively. the anthocyanin accumulation in soybean sprouts hypocotyl.
Twenty-two genes that might be involved in anthocyanin
Transcript Levels of Anthocyanin biosynthesis were found in this module (“MM.green”),
Biosynthetic-Related Genes containing GmMYB90 (Gm_100781091) and GmMYB114
The expression levels of genes involved in anthocyanin (Gm_778086) (Figure 8B). The “MM.green” module was
biosynthesis in hypocotyl were investigated using qRT-PCR further annotated by KEGG enrichment analysis. Diterpenoid
(Figure 5). Compared with the blue radiation treatment, biosynthesis, the pentose phosphate pathway, biosynthesis
the transcription level of early biosynthetic genes and late of secondary metabolites, and flavonoid biosynthesis
biosynthetic genes were enhanced after CaCl2 supplementation, were significantly enriched as a major pathway, and the
especially those of GmCHS8, GmANS2, and GmUFGT. metabolic pathways contained the largest number of genes
However, both the LaCl3 and neomycin treatments completely (Supplementary Figure 4A). GO-based term classification was
reversed this trend. Compared with D, the expression levels performed to provide insights into gene function. Thirty GO
of structural genes related to anthocyanin synthesis were terms were found as enriched biological processes, the number
upregulated in the W treatment. The B treatment further of genes involved in metabolic process, antioxidant activity, and
significantly improved the expression level of these key genes. membrane-bounded organelle (Supplementary Figure 4B).
Gene Expression Profiles and Differentially DISCUSSION
Expressed Genes and Weighted Gene This study, from a multi-dimensional perspective, aimed to
Co-expression Network Analyses determine the molecular regulation mechanism of calcium on
To gain global insight into the molecular mechanism of calcium anthocyanin biosynthesis in soybean sprouts under blue light.
on anthocyanin metabolism, sprouts of hypocotyl samples in the Calcium is a ubiquitous second messenger that is involved
dark, white light, blue light, and blue light + 1 mM LaCl3 groups in secondary metabolism in plants. Spraying calcium is widely
were analyzed at 24 and 36 h by RNA-seq. A total of 28,599 non- performed to improve the quality of crops in agricultural
redundant DEGs between and among different treatment groups production (Chen et al., 2019). These results reflect those of
were identified (Figure 6). The total number of DEGs at 24 h was Wang et al. (2016) who also reported that supplementing
greater than that at 36 h. The results indicate that the early period with Ca2+ can improve soybean sprout yield and increase
may be a critical stage that affects the coloration of hypocotyl. bioactive substances. In this study, calcium notably increased
Besides, compared with the other pairwise comparison groups, the anthocyanin content in sprout hypocotyl at the initial
groups La24 vs. B24 and La36 vs. B36 had more DEGs. germination stage, which was inhibited by LaCl3 and neomycin
The expression of 10 selected DEGs from the RNA-Seq data treatments (Figure 1), consistent with a previous study (Zhu
was further verified by qRT-PCR. Linear regression analysis et al., 2019). Interestingly, in addition to affecting the TAC,
showed that RNA-Seq and qRT-PCR results for these genes exogenous calcium also affected the composition of anthocyanins
were highly correlated (r = 0.888–1) (Supplementary Figure 2). (Table 1). Previous studies have also shown that calcium affected
These results indicated that the transcriptomic profiling data the polyphenol profile and the metabolism of mevatin and
accurately corresponded to the treatment responses of soybean quercetin in grape berries (Martins et al., 2020). This may
sprouts hypocotyl. be related to plant regulation metabolomic profile to respond
To further understand the relevant biological processes, the to changes in the external environment. Besides, light-induced
transcripts were divided into 20 profiles at each time point anthocyanin production is affected by changes in period,
Frontiers in Plant Science | www.frontiersin.org 10 May 2021 | Volume 12 | Article 662091Hu et al. Calcium Contributes to Anthocyanin Accumulation
intensity, and wavelength. Blue light accelerating anthocyanin calcium increased the IP3 content in hypocotyls, and there
accumulation in plants has been widely reported (Tao et al., 2018; was a significant correlation with the anthocyanin content
Zhang et al., 2018b; Zheng et al., 2019). In this study, blue light (Figure 4). Moreover, as the main calcium sensor, CaM plays
can more effectively stimulate the accumulation of anthocyanins an important role in decoding Ca2+ signals into downstream
in soybean hypocotyls (Figure 1). These studies prove that cellular physiological responses. In Alternanthera bettzickiana,
calcium is beneficial for the blue light-induced anthocyanin the change in CaM activity is parallel to the increase in
synthesis in “Dongnong 690” hypocotyl. anthocyanin content at low temperatures; and chlorpromazine
Furthermore, the relationship between the relative level and inhibits CaM activity and leads to a decrease in anthocyanins
distribution of calcium and anthocyanin accumulation was (Wang et al., 2005). Other researchers (He et al., 2020) have
explored. Exogenous calcium increased Ca2+ concentration in reported that calcineurin B-like proteins (CBLs) activate related
the root tip cells of barley sprouts, resulting in strong green kinases by sensing Ca2+ , and then activate target genes related
fluorescence in cells, while LaCl3 and 2-aminoethoxydiphenyl to anthocyanin biosynthesis. In this study, the changes in the
borate inhibit calcium mobilization (Ma et al., 2019b), which is in CaM content were significantly consistent with the accumulation
accordance with the results in this study (Figure 2). Fluorescence of anthocyanins under different conditions (Figure 4). These
images also show that anthocyanin accumulation areas near the findings suggest that intracellular IP3-dependent Ca2+ and
vascular bundles have calcium enrichment in pear leaves (Zhai extracellular Ca2+ participate in blue light-induced anthocyanin
et al., 2019). The results shown in Figure 2 are consistent with synthesis in “Dongnong 690” hypocotyl, at least partially,
the changing trend in anthocyanin content under corresponding through the Ca2+ -CaM pathway. However, how CaM activates
conditions. Notably, a higher level of calcium is observed under downstream target genes to promote the accumulation of
blue light compared with that in the D and W treatments. This anthocyanins requires more direct evidence.
phenomenon was mainly attributed to phot2; and mutants and In the calcium signal transduction pathway, transient Ca2+
over-expressed transgenic lines related to phototrophic protein oscillations in cells caused by external stimuli can be sensed
indicate that blue light specifically induces an increase in the by other Ca2+ sensors or binding proteins, such as calcium-
cytoplasmic Ca2+ level in the hypocotyls of A. thaliana (Zhao dependent protein kinase (CDPK), calmodulin-like proteins
et al., 2013). In addition, calcium presents temporal and spatial (CMLs), and CBLs (Hashimoto and Kudla, 2011). Hierarchical
characteristics at different developmental stages and metabolic cluster analysis showed that the expression pattern of calcium-
processes in plants. Yang et al. (2020) found that calcium responsive genes under blue light was different from that
showed particular distribution patterns at different stages in of other treatments (Supplementary Figure 5A). Among these
the anthers of Impatiens balsamina. In mung bean cotyledon DEGs, calmodulin and calcium-dependent protein kinase were
cells, after calcium application, calcium precipitation increased significantly up-regulated, which is speculated to play an
in intercellular spaces and cell walls, and many spherical particles important role in the anthocyanin metabolism pathway. Calcium
were observed, while LaCl3 inhibited Ca2+ influx into the cells transport across organelle membranes and plasma membrane
(Zhou et al., 2018). Ma et al. (2019a) noted that calcium, is tightly regulated by Ca2+ -ATPase, calcium channel, V-type
in a specific distribution, participated in γ-aminobutyric acid ATPase, and Ca2+ /proton exchanger (De Freitas et al., 2012). As
signal transduction for phenolic compound accumulation in the main calcium transporter, upregulated calcium-transporting
germinated hulless barley. Similar results were observed in this ATPase was involved in the regulation of calcium under blue
study. Calcium was mainly distributed in the cytoplasm and light (Supplementary Figure 5A). How these Ca2+ sensors are
adjacent to the cell membrane, exogenous CaCl2, and its inhibitor involved in the regulation of blue light-induced anthocyanin
affected the enrichment of calcium precipitation (Figure 3). This biosynthesis and their interaction remains to be elucidated.
implies that calcium as an intracellular messenger depends on Phytohormones that control anthocyanin accumulation have
the kinetics of its spatia-temporal release from the calcium pool. also been widely reported. Carvalho et al. (2010) proved
However, the typical form of black precipitate in B is different that ABA played an active role in regulating anthocyanin
from that in W and D (Figure 3), and may be related to a biosynthesis in hormone mutants. Wang et al. (2019) reported
different light signal (Łabuz et al., 2016). Based on these studies, that ethylene acts as a negative regulator in light-regulated
we speculate that calcium participates in the metabolism of anthocyanin biosynthesis in cabbage. Most upregulated ABA
anthocyanins in a specific spatiotemporal manner in “Dongnong and downregulated ethylene related genes have been observed
690” hypocotyl. under blue light (Supplementary Figure 5B). Genes that encode
Calcium actively regulates anthocyanin biosynthesis through auxin and salicylic acid-responsive elements have different
specific signaling pathways in most fruits and vegetables (Peng expression modes and indicate that they have distinct functions
et al., 2016). The binding of IP3 to its receptors causes calcium in the regulation of anthocyanin biosynthesis through various
channels on the organelles to open, thus releasing Ca2+ from transduction pathways. In general, some form of hormonal
the calcium store to the cytoplasm (Lovett et al., 2002). IP3 cross-talk may participate in pigment accumulation of soybean
can induce isoflavone accumulation in soybean sprouts by sprout hypocotyl.
upregulating the activity of isoflavone biosynthetic enzyme under Many studies have shown that calcium treatment can
UV-B radiation (Jiao et al., 2016). Similarly, there is a high improve the expression of anthocyanin biosynthesis-related
correlation between IP3 content and anthocyanin accumulation genes (Zhu et al., 2019; Yu et al., 2020). Xu et al. (2014)
in radish sprouts (Zhang et al., 2018a). In this study, exogenous reported that calcium activated the key genes related to
Frontiers in Plant Science | www.frontiersin.org 11 May 2021 | Volume 12 | Article 662091Hu et al. Calcium Contributes to Anthocyanin Accumulation
anthocyanin synthesis in the strawberry fruit, including FvDFR2, and accession number(s) can be found below:
FvANS1, and FvUGT1. Contrariwise, EGTA and neomycin SRA, PRJNA719628.
treatments markedly suppressed the activity, proteins, and gene
expressions of GmCHS and GmIFS in soybean sprouts under
UV-B irradiation (Jiao et al., 2016). Similarly, in this study,
AUTHOR CONTRIBUTIONS
exogenous calcium promoted the expression of structural genes JCu, NS, and GH designed the experiment. GH analyzed the
related to anthocyanin synthesis (Figure 5). These identified data and wrote the first draft manuscript. XY, JS, GX, JCh,
genes were also consistent with the WGCNA analysis results and HW accomplished the laboratory analysis and helped
(Figure 8C). Besides, R2R3-MYB subgroup 6, namely, MYB75,
in data processing. All authors reviewed and approved the
MYB90, MYB113, and MYB114, contains factors that regulate
final manuscript.
anthocyanin biosynthesis in vegetative tissues (Gonzalez et al.,
2008). The expressions of RsPAP1 and RsPAP2 in radish
sprouts were stimulated by exogenous calcium, whereas EGTA FUNDING
and neomycin inhibited this process (Zhang et al., 2018a). In
this study, the WGCNA analysis showed that GmMYB90 and This work was supported by National Natural Science
GmMYB114 were also involved in the regulation of anthocyanin Foundation of China (31772360), China Postdoctoral Science
synthesis, and that they had high homology with AtPAP1 Foundation (2019M651860), and Jiangsu Provincial Natural
and AtPAP2 in Arabidiposis thaliana (Supplementary Figure 3). Science Foundation of China (BK20180522).
Furthermore, in the corresponding treatment, these MYBs and
anthocyanin synthesis structural genes had similar expression
SUPPLEMENTARY MATERIAL
patterns (Supplementary Figure 2). Although the specialized
functions of these candidate genes have not been thoroughly The Supplementary Material for this article can be found
characterized in this study, we provide valuable references for online at: https://www.frontiersin.org/articles/10.3389/fpls.2021.
other researchers in the future. These studies support our 662091/full#supplementary-material
findings that calcium regulates blue light-induced anthocyanin Supplementary Figure 1 | Clusters of differentially expressed transcripts with
accumulation by upregulating the key genes involved in expression profile changes. (A,B) Changes in gene expression profiles in 24 and
anthocyanin synthesis in “Dongnong 690” hypocotyl. 36 h treatment groups, respectively. The transcripts were divided into 20 clusters
at each time point, representing distinct expression patterns. Colored profiles with
significant differential expression at p < 0.05.
CONCLUSION Supplementary Figure 2 | Correlation analysis of the RNA-seq data and
qRT-PCR. The RNA-seq and qRT-PCR results for these genes were highly
Overall, exogenous calcium increased total anthocyanin content correlated. The right y-axis shows the expression data of RNA-seq. The left y-axis
and affected the metabolism profile of the hypocotyls of soybean indicates the corresponding gene relative expression levels detected by qRT-PCR.
The x-axis shows different treatments at 24 or 36 h. D: dark. W: white light. B: blue
sprouts. The calcium signal, which is generated by the influx light. La: blue light + 1 mM LaCl3 .
of extracellular calcium across the plasma membrane and the
Supplementary Figure 3 | Phylogenetic tree comprising GmMYB90 and
release of intracellular calcium pools, is involved in regulating
GmMYB114 in Glycine max and R2R3-MYB TFs in A. thaliana.
blue light-induced anthocyanin biosynthesis in “Dongnong 690”
hypocotyl. Simultaneously, calcium with certain temporal and Supplementary Figure 4 | KEGG pathway and GO annotation analyses of genes
in MM. green module. (A) The X-axis is the gene ratio and the Y-axis is the
spatial characteristics activates the expression of genes related pathway type. The bigger the bubble, the more different genes it contains. (B) The
to anthocyanin biosynthesis. This study may provide a better X coordinates in the diagram are GO entry names, and the Y coordinates are gene
reference for production practices and help improve the quality percent.
of supplemental lighting used in artificial growth systems. Supplementary Figure 5 | Heat map representation of the expression patterns of
genes related to calcium (A) and hormone (B) signal transduction. D: dark. W:
white light. B: blue light. La: blue light + 1 mM LaCl3 , 24 or 36 h.
DATA AVAILABILITY STATEMENT Supplementary Table 1 | List of primer sequences used in this study.
The datasets presented in this study can be found in online Supplementary Table 2 | List of genes from different module.
repositories. The names of the repository/repositories Supplementary Table 3 | Summary statistics of transcriptome sequencing.
REFERENCES Alrifai, O., Hao, X., Marcone, M. F., and Tsao, R. (2019). Current review of the
modulatory effects of LED lights on photosynthesis of secondary metabolites
Almeida, J. R., D’Amico, E., Preuss, A., Carbone, F., de Vos, C. R., and future perspectives of microgreen vegetables. J. Agric. Food Chem. 67,
Deiml, B., et al. (2007). Characterization of major enzymes and 6075–6090. doi: 10.1021/acs.jafc.9b00819
genes involved in flavonoid and proanthocyanidin biosynthesis An, J. P., Wang, X. F., Zhang, X. W., Xu, H. F., Bi, S. Q., You, C. X., et al. (2020).
during fruit development in strawberry (Fragaria× ananassa). An apple MYB transcription factor regulates cold tolerance and anthocyanin
Arch. Biochem. Biophys. 465, 61–71. doi: 10.1016/j.abb.2007. accumulation and undergoes MIEL1-mediated degradation. Plant Biotechnol.
04.040 J. 18, 337–353. doi: 10.1111/pbi.13201
Frontiers in Plant Science | www.frontiersin.org 12 May 2021 | Volume 12 | Article 662091Hu et al. Calcium Contributes to Anthocyanin Accumulation
Andersen, O. M., and Markham, K. R. (2005). Flavonoids: Chemistry, Biochemistry of more stilbenoids and less anthocyanins. Food Chem. 313:126123.
and Applications. Boca Raton, FL: CRC press. doi: 10.1201/9781420039443 doi: 10.1016/j.foodchem.2019.126123
Bassolino, L., Zhang, Y., Schoonbeek, H.-,j., Kiferle, C., Perata, P., and Martin, Peng, H., Yang, T., Whitaker, B. D., Shangguan, L., and Fang, J. (2016).
C. (2013). Accumulation of anthocyanins in tomato skin extends shelf life. N. Calcium/calmodulin alleviates substrate inhibition in a strawberry UDP-
Phytol. 200, 650–655. doi: 10.1111/nph.12524 glucosyltransferase involved in fruit anthocyanin biosynthesis. BMC Plant Biol.
Carvalho, R. F., Carvalho, S. D., and Duque, P. (2010). The plant-specific 16:197. doi: 10.1186/s12870-016-0888-z
SR45 protein negatively regulates glucose and ABA signaling during Tao, R., Bai, S., Ni, J., Yang, Q., Zhao, Y., and Teng, Y. (2018). The blue light
early seedling development in Arabidopsis. Plant Physiol. 154, 772–783. signal transduction pathway is involved in anthocyanin accumulation
doi: 10.1104/pp.110.155523 in ‘Red Zaosu’pear. Planta 248, 37–48. doi: 10.1007/s00425-018-
Chen, Z., Ma, Y., Yang, R., Gu, Z., and Wang, P. (2019). Effects of exogenous 2877-y
Ca2+ on phenolic accumulation and physiological changes in germinated Tsuda, T. (2012). Dietary anthocyanin-rich plants: biochemical basis and recent
wheat (Triticum aestivum L.) under UV-B radiation. Food Chem. 288, 368–376. progress in health benefits studies. Mol. Nutr. Food Res. 56, 159–170.
doi: 10.1016/j.foodchem.2019.02.131 doi: 10.1002/mnfr.201100526
De Freitas, S. T., Jiang, C.-Z., and Mitcham, E. J. (2012). Mechanisms Vandesompele, J., de Preter, K., Pattyn, F., Poppe, B., Van Roy, N., de Paepe, A.,
involved in calcium deficiency development in tomato fruit in response to et al. (2002). Accurate normalization of real-time quantitative RT-PCR data by
gibberellins. J. Plant Growth Regul. 31, 221–234. doi: 10.1007/s00344-011- geometric averaging of multiple internal control genes. Genome Biol. 3, 1–12.
9233-9 doi: 10.1186/gb-2002-3-7-research0034
Dong, H. S., Choi, M. G., Lee, H. K., Cho, M., and Park, Y. I. (2012). Varet, H., Brillet-Guéguen, L., Coppée, J.-Y., and Dillies, M.-A. (2016). SARTools:
Calcium dependent sucrose uptake links sugar signaling to anthocyanin a DESeq2-and edgeR-based R pipeline for comprehensive differential
biosynthesis in Arabidopsis. Biochem. Biophys. Res. Commun. 430, 634–639. analysis of RNA-Seq data. PLoS ONE 11:e0157022. doi: 10.1371/journal.pone.
doi: 10.1016/j.bbrc.2012.11.100 0157022
Gonzalez, A., Zhao, M., Leavitt, J. M., and Lloyd, A. M. (2008). Regulation Wang, C., Zhang, Y., and Liu, T. (2005). Activity changes of calmodulin
of the anthocyanin biosynthetic pathway by the TTG1/bHLH/Myb and Ca2+ -ATPase during low-temperature-induced anthocyanin
transcriptional complex in Arabidopsis seedlings. Plant J. 53, 814–827. accumulation in Alternanthera bettzickiana. Physiol. Plantarum 124, 260–266.
doi: 10.1111/j.1365-313X.2007.03373.x doi: 10.1111/j.1399-3054.2005.00513.x
Gould, K., McKelvie, J., and Markham, K. (2002). Do anthocyanins Wang, F., Ahammed, G. J., Li, G., Bai, P., Jiang, Y., Wang, S., et al. (2019). Ethylene
function as antioxidants in leaves? Imaging of H2O2 in red and green is involved in red light-induced anthocyanin biosynthesis in cabbage (Brassica
leaves after mechanical injury. Plant Cell Environ. 25, 1261–1269. oleracea). International J. Agric. Biol. 21, 955–963.
doi: 10.1046/j.1365-3040.2002.00905.x Wang, X., Yang, R., Zhou, Y., and Gu, Z. (2016). A comparative transcriptome
Hashimoto, K., and Kudla, J. (2011). Calcium decoding mechanisms in plants. and proteomics analysis reveals the positive effect of supplementary Ca2+
Biochimie 93, 2054–2059. doi: 10.1016/j.biochi.2011.05.019 on soybean sprout yield and nutritional qualities. J. Proteomics 143, 161–172.
He, J., and Giusti, M. M. (2010). Anthocyanins: natural colorants with doi: 10.1016/j.jprot.2016.04.020
health-promoting properties. Annu. Rev. Food Sci. Technol. 1, 163–187. Xu, W., Peng, H., Yang, T., Whitaker, B., Huang, L., Sun, J., et al. (2014).
doi: 10.1146/annurev.food.080708.100754 Effect of calcium on strawberry fruit flavonoid pathway gene expression
He, Y., Xie, Y., Li, X., and Yang, J. (2020). Drought tolerance of transgenic and anthocyanin accumulation. Plant Physiol. Biochem. 82, 289–298.
rice overexpressing maize C4-PEPC gene related to increased anthocyanin doi: 10.1016/j.plaphy.2014.06.015
synthesis regulated by sucrose and calcium. Biol. Plant. 64, 136–149. Yang, J., Li, B., Shi, W., Gong, Z., Chen, L., and Hou, Z. (2018). Transcriptional
doi: 10.32615/bp.2020.031 activation of anthocyanin biosynthesis in developing fruit of blueberries
Hichri, I., Barrieu, F., Bogs, J., Kappel, C., Delrot, S., and Lauvergeat, V. (2011). (Vaccinium corymbosum L.) by Preharvest and postharvest UV
Recent advances in the transcriptional regulation of the flavonoid biosynthetic irradiation. J. Agric. Food Chem. 66, 10931–10942. doi: 10.1021/acs.jafc.
pathway. J. Exp. Bot. 62, 2465–2483. doi: 10.1093/jxb/erq442 8b03081
Jian, B., Liu, B., Bi, Y., Hou, W., Wu, C., and Han, T. (2008). Validation of internal Yang, S., Liang, W., Shi, J., Peng, L., and Zheng, R. (2020). Calcium distribution
control for gene expression study in soybean by quantitative real-time PCR. during anther development in Impatiens balsamina. Biol. Plant. 64, 178–184.
BMC Mol. Biol. 9:59. doi: 10.1186/1471-2199-9-59 doi: 10.32615/bp.2019.147
Jian, L.-C., Li, P. H., Sun, L.-H., and Chen, T. H. (1997). Alterations in Yu, J., Zhu, M., Wang, M., Xu, Y., Chen, W., and Yang, G. (2020). Transcriptome
ultrastructure and subcellular localization of Ca2+ in poplar apical bud analysis of calcium-induced accumulation of anthocyanins in grape skin. Sci.
cells during the induction of dormancy. J. Exp. Bot. 48, 1195–1207. Hortic. 260:108871. doi: 10.1016/j.scienta.2019.108871
doi: 10.1093/jxb/48.6.1195 Zhai, R., Wang, Z., Yang, C., Lin-Wang, K., Espley, R., Liu, J., et al.
Jiao, C., Yang, R., and Gu, Z. (2016). Cyclic ADP-ribose and IP3 mediate abscisic (2019). PbGA2ox8 induces vascular-related anthocyanin accumulation and
acid-induced isoflavone accumulation in soybean sprouts. Biochem. Biophys. contributes to red stripe formation on pear fruit. Hortic Res. 6:137.
Res. Commun. 479, 530–536. doi: 10.1016/j.bbrc.2016.09.104 doi: 10.1038/s41438-019-0220-9
Łabuz, J., Samardakiewicz, S., Hermanowicz, P., Wyroba, E., Pilarska, M., and Zhang, B., and Horvath, S. (2005). A general framework for weighted gene
Gabryś, H. (2016). Blue light-dependent changes in loosely bound calcium co-expression network analysis. Stat. Appl. Genet. Mol. Biol. 4, 1–43.
in Arabidopsis mesophyll cells: an X-ray microanalysis study. J. Exp. Bot. 67, doi: 10.2202/1544-6115.1128
3953–3964. doi: 10.1093/jxb/erw089 Zhang, X., Wei, J., Huang, Y., Shen, W., Chen, X., Lu, C., et al. (2018a). Increased
Lovett, J. L., Marchesini, N., Moreno, S. N., and Sibley, L. D. (2002). Toxoplasma cytosolic calcium contributes to hydrogen-rich water-promoted anthocyanin
gondii microneme secretion involves intracellular Ca2+ release from inositol biosynthesis under UV-A irradiation in radish sprouts hypocotyls. Front. Plant
1, 4, 5-triphosphate (IP3)/ryanodine-sensitive stores. J. Biol. Chem. 277, Sci. 9:1020. doi: 10.3389/fpls.2018.01020
25870–25876. doi: 10.1074/jbc.M202553200 Zhang, X., Wei, J., Tian, J., Li, N., Jia, L., Shen, W., et al. (2019).
Ma, Y., Wang, P., Gu, Z., Tao, Y., Shen, C., Zhou, Y., et al. (2019a). Enhanced anthocyanin accumulation of immature radish microgreens by
Ca(2+) involved in GABA signal transduction for phenolics accumulation hydrogen-rich water under short wavelength light. Sci. Hortic. 247, 75–85.
in germinated hulless barley under NaCl stress. Food Chem. X 2:100023. doi: 10.1016/j.scienta.2018.11.060
doi: 10.1016/j.fochx.2019.100023 Zhang, Y., Jiang, L., Li, Y., Chen, Q., Ye, Y., Zhang, Y., et al. (2018b).
Ma, Y., Wang, P., Zhou, T., Chen, Z., Gu, Z., and Yang, R. (2019b). Role of Ca(2+) Effect of red and blue light on anthocyanin accumulation and differential
in phenolic compound metabolism of barley (Hordeum vulgare L.) sprouts gene expression in strawberry (Fragaria× ananassa). Molecules 23:820.
under NaCl stress. J. Sci. Food Agric. 99, 5176–5186. doi: 10.1002/jsfa.9764 doi: 10.3390/molecules23040820
Martins, V., Billet, K., Garcia, A., Lanoue, A., and Geros, H. (2020). Zhao, X., Wang, Y.-L., Qiao, X.-R., Wang, J., Wang, L.-D., Xu, C.-
Exogenous calcium deflects grape berry metabolism towards the production S., et al. (2013). Phototropins function in high-intensity blue
Frontiers in Plant Science | www.frontiersin.org 13 May 2021 | Volume 12 | Article 662091You can also read