Pleiotropic effects of ebony and tan on pigmentation and cuticular hydrocarbon composition in Drosophila melanogaster - bioRxiv
←
→
Page content transcription
If your browser does not render page correctly, please read the page content below
bioRxiv preprint first posted online Feb. 1, 2019; doi: http://dx.doi.org/10.1101/538090. The copyright holder for this preprint (which
       was not peer-reviewed) is the author/funder, who has granted bioRxiv a license to display the preprint in perpetuity.
                                 It is made available under a CC-BY-NC-ND 4.0 International license.

          Pleiotropic effects of ebony and tan on pigmentation and cuticular
                hydrocarbon composition in Drosophila melanogaster

   Massey J. H.1,2, Akiyama N.3, Bien, T.4,5, Dreisewerd, K.4,5, Wittkopp, P. J.1,6*, Yew J.Y. 7*, Takahashi
   A.3,8*

   1
       Department of Ecology and Evolutionary Biology, University of Michigan, Ann Arbor, MI, USA
   2
       Janelia Research Campus, Howard Hughes Medical Institute, Ashburn, VA, USA
   3
       Department of Biological Sciences, Tokyo Metropolitan University, Hachioji, Japan
   4
       Institute for Hygiene, University of Münster, Münster, Germany
   5
       Interdisciplinary Center for Clinical Research (IZKF), University of Münster, Münster, Germany
   6
   Department of Molecular, Cellular, and Developmental Biology, University of Michigan, Ann
   Arbor, MI, USA
   7
       Pacific Biosciences Research Center, University of Hawaii at Manoa, Honolulu, HI, USA
   8
       Research Center for Genomics and Bioinformatics, Tokyo Metropolitan University, Hachioji, Japan

   * Correspondence:
   Corresponding Authors
   wittkopp@umich.edu; jyew@hawaii.edu; ayat@tmu.ac.jp

                                                                                                                                          1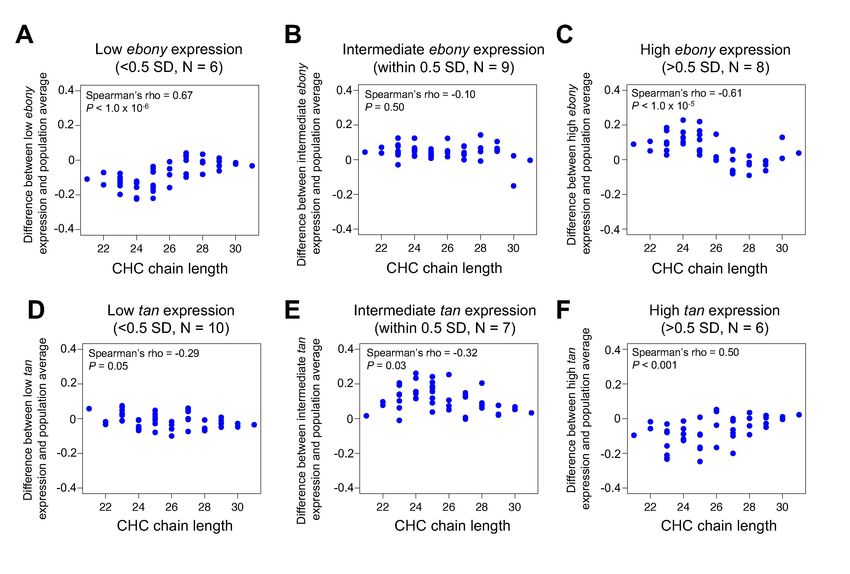
bioRxiv preprint first posted online Feb. 1, 2019; doi: http://dx.doi.org/10.1101/538090. The copyright holder for this preprint (which
       was not peer-reviewed) is the author/funder, who has granted bioRxiv a license to display the preprint in perpetuity.
                                 It is made available under a CC-BY-NC-ND 4.0 International license.

                                                                     Abstract

   Pleiotropic genes are genes that affect more than one trait. For example, many genes required for
   pigmentation in the fruit fly Drosophila melanogaster also affect traits such as circadian rhythms,
   vision, and mating behavior. Here, we present evidence that two pigmentation genes, ebony and tan,
   which encode enzymes catalyzing reciprocal reactions in the melanin biosynthesis pathway, also
   affect cuticular hydrocarbon (CHC) composition in D. melanogaster females. More specifically, we
   report that ebony loss-of-function mutants have a CHC profile that is biased toward long (>25C)
   chain CHCs, whereas tan loss-of-function mutants have a CHC profile that is biased toward short
   (
bioRxiv preprint first posted online Feb. 1, 2019; doi: http://dx.doi.org/10.1101/538090. The copyright holder for this preprint (which
       was not peer-reviewed) is the author/funder, who has granted bioRxiv a license to display the preprint in perpetuity.
                                 It is made available under a CC-BY-NC-ND 4.0 International license.

         Here, we test whether the ebony and tan genes of D. melanogaster, which are required for the
   synthesis of dark melanins and yellow sclerotins from dopamine, respectively, also affect CHC
   composition. The ebony gene encodes a protein that converts dopamine into N-β-alanyl dopamine
   (NBAD), and the tan gene encodes a protein that catalyzes the reverse reaction, converting NBAD
   back into dopamine (Figure 1A). We report that loss-of-function mutations in both ebony and tan
   altered CHC length composition relative to wild-type flies in opposing directions. These opposing
   effects on CHC length composition are consistent with ebony and tan’s opposing biochemical
   functions in dopamine metabolism (Figure 1A). Indeed, pharmacological inhibition of dopamine
   synthesis in ebony mutants caused a tan-like CHC length profile. To examine the possibility that
   variation in ebony and/or tan activity might cause correlated changes in pigmentation and CHC
   composition in a natural population, we used lines from the Drosophila Genetic Reference Panel
   (DGRP) to test for covariation between pigmentation and CHC composition. We found that CHC
   length composition covaried not only with pigmentation but also with levels of ebony and tan
   expression in a manner consistent with the mutant analyses. In the discussion, we compare our data
   to studies of clinal variation in CHC composition and pigmentation to determine whether the
   pleiotropic effects we see might have contributed to correlated evolution of these traits.

   2        Materials and Methods

   2.1      Fly stocks and maintenance
   The following lines were used: P excision line tan20A (True et al., 2005) (courtesy of John True,
   Stony Brook University); the UAS-ebony-RNAi effector line was obtained from the Vienna
   Drosophila Resource Centre (Dietzl et al., 2007, KK106278); dsxGAL4 (Rideout et al., 2010) (courtesy
   of Stephen Goodwin, Oxford University); OK72-GAL4 (Ferveur et al., 1997) (courtesy of Scott
   Pletcher, University of Michigan); pannier-GAL4 (Calleja et al. 2000) was obtained from the
   Bloomington Drosophila Stock Center (BDSC 3039); vasa-Cas9 (Gratz et al., 2014, BDSC 51324)
   (courtesy of Rainbow Transgenics Inc.). All flies were grown at 23°C with a 12 h light-dark cycle on
   standard corn-meal fly medium.

   2.1.1 DGRP stocks
   The following inbred D. melanogaster lines from the DGRP (Ayroles et al. 2009; Mackay et al.
   2012; Huang et al. 2014) were used in this study: RAL-208, RAL-303, RAL-324, RAL-335, RAL-
   357, RAL-358, RAL-360, RAL-365, RAL-380, RAL-399, RAL-517, RAL-555, RAL-705, RAL-
   707, RAL-732, RAL-774, RAL-786, RAL-799, RAL-820, RAL-852, RAL-714, RAL-437, RAL-861
   and RAL-892. These lines consist of the set of 20 lines used in Miyagi et al. (2015) and additional 3
   dark lines (RAL-714, RAL-437, and RAL-861), which were added to avoid line specific effects from
   a limited number of dark lines. All flies were grown at 25°C with a 12 h light-dark cycle on standard
   corn-meal fly medium.

   2.2      Generation of ebony CRISPR lines
   New loss-of-function ebony mutants were constructed by synthesizing two single guide RNAs
   (gRNA), using a MEGAscript T7 Transcription Kit (Invitrogen), following the PCR-based protocol
   from Bassett et al. (2014), that target ebony’s first coding exon and co-injecting these at a total
   concentration of 100 ng/μL into embryos of a D. melanogaster vasa-Cas9 line (Gratz et al., 2014;
   BDSC 51324) (Supplementary Figure S1). These gRNAs were previously found to generate a high
   level of heritable germline transformants (Ren et al., 2014; Supplementary Figure 1). We screened
   for germline transformants based on body pigmentation and confirmed via Sanger sequencing three

                                                                                                                                          3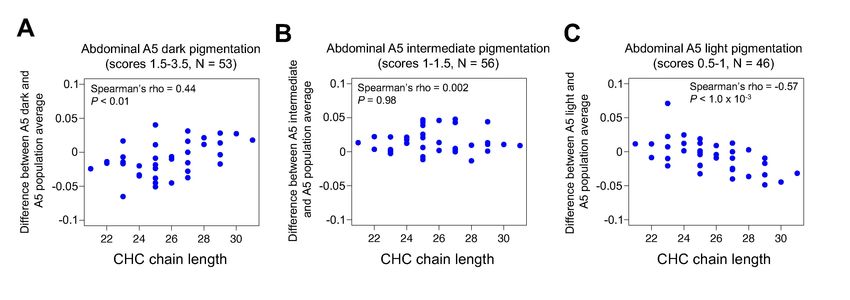
bioRxiv preprint first posted online Feb. 1, 2019; doi: http://dx.doi.org/10.1101/538090. The copyright holder for this preprint (which
was not peer-reviewed) is the author/funder, who has granted bioRxiv a license to display the preprint in perpetuity.
It is made available under a CC-BY-NC-ND 4.0 International license.
unique ebony loss-of-function alleles, ebonyCRISPR(1,2) containing a 55 bp deletion, and ebonyCRISPR(3)
and ebonyCRISPR(4), each containing an in-frame 3 bp deletion (Supplementary Figure S1). Each
deletion caused flies to develop dark body pigmentation, indicating loss of Ebony activity (Figure
1B, Supplementary Figure S2A).
2.3 CHC extraction and measurements
For Figures 1 and 2 and Supplementary Figures S2–5, CHCs were extracted and analyzed as
described below (CHC names and formulas are summarized in Supplementary Table S1). For the
analyses using the DGRP (Figures 3 and 4, Supplementary Figure S6), all CHC data for females were
obtained from Dembeck et al. (2015b); however, in the case of GC/MS peaks composed of more than
two combined CHC components that differed in CHC chain length, the non-branched CHC chain
length was used. Also, CHCs that were not detected in all strains were removed from the analyses.
2.3.1 Extraction
For each experiment, five replicate CHC samples of virgin female flies were prepared for each
genotype or pharmacological treatment group. All ebony and tan mutant CHC extractions were
performed on 3–4 d old virgin females. For pharmacological experiments, 1–2 d old virgin females
were treated for 4 d prior to CHC extraction. For GAL4/UAS experiments, virgin females were
tested at 10–12 d. For each sample, 5 flies were placed in a single glass vial (Wheaton 224740 E–C
Clear Glass Sample Vials) on ice. 120 μL of hexane (Sigma Aldrich, St Louis, MO, USA) spiked
with 10 μg/mL of hexacosane (Sigma Aldrich) was added to each vial and sealed with a cap. Vials
were incubated at room temperature for 20 mins. 100 μL of the cuticular extract was removed,
transferred into a clean vial (Wheaton 0.25 mL with low volume insert), and stored at -20ºC.
2.3.2 GC/MS analysis
Gas chromatography mass spectrometry (GC/MS) analysis was performed on a 7820A GC system
equipped with a 5975 Mass Selective Detector (Agilent Technologies, Inc., Santa Clara, CA, USA)
and a HP-5ms column ((5%-Phenyl)-methylpolysiloxane, 30 m length, 250 μm ID, 0.25 μm film
thickness; Agilent Technologies, Inc.). Electron ionization (EI) energy was set at 70 eV. One
microliter of the sample was injected in splitless mode and analyzed with helium flow at 1 mL/ min.
The following parameters were used: column was set at 40°C for 3 min, increased to 200°C at a rate
of 35°C/min, then increased to 280°C at a rate of 20°C/min for 15 min. The MS was set to detect
from m/z 33 to 500. Chromatograms and spectra were analyzed using MSD ChemStation (Agilent
Technologies, Inc.). CHCs were identified on the basis of retention time and EI fragmentation
pattern. The relative abundance for each CHC signal was calculated by normalizing the area under
each CHC peak to the area of the hexacosane signal. To eliminate multicollinearity among sample
peak amounts, a log-contrast transformation was applied to the resulting proportional values, using
nC27 as the denominator (Yew et al., 2011; Blow and Allen, 1998):
-
To determine the relative change in CHC length between two genotypes, experimental groups, or
groups of DGRP strains, the difference in relative intensity of individual CHC intensities of each
group was calculated:
Difference log-contrast CHC ' log-contrast CHC
These values were then plotted against CHC chain length.
4bioRxiv preprint first posted online Feb. 1, 2019; doi: http://dx.doi.org/10.1101/538090. The copyright holder for this preprint (which
was not peer-reviewed) is the author/funder, who has granted bioRxiv a license to display the preprint in perpetuity.
It is made available under a CC-BY-NC-ND 4.0 International license.
2.4 Ultraviolet laser desorption ionization mass spectrometry (UV-LDI MS)
For intact fly analysis, individual animals were attached to a glass cover slip using adhesive pads
(G304, Plano, Wetzlar, Germany). The cover slips were mounted on a custom-milled sample holder
containing a rectangular, 1.8 mm deep well. Sample height was adjusted by choosing a stack of 0.2
mm-thick adhesive pads (G3347, Plano). Mass spectra were generated using a prototype orthogonal-
extracting mass spectrometer (oTOF-MS) as described previously (Yew et al. 2011). The oTOF-MS
was equipped with a modified oMALDI2 ion source (AB Sciex, Concord, Canada) and an N2 laser (λ
= 337 nm) operated at a pulse repetition rate of 30 Hz. N2 was used as buffer gas at p = 2 mbar. This
elevated pressure is critical to achieve an efficient collisional cooling environment for generation of
weakly-bound [M + K]+ ions that constituted the major molecular ion species. Before starting the
actual measurements, external mass calibration was achieved with red phosphorus, resulting in a
mass accuracy of approximately 25 ppm. Approximately 900 laser shots were placed at one position
to achieve a mass spectrum (30 s @30 Hz). All spectra were acquired in positive ion mode and
processed using MS Analyst software (Analyst QS 2.0, AB Sciex, Concord, Canada).
2.5 Pharmacology Experiments
For pharmacological treatments, standard corn-meal fly medium was liquefied and cooled to ca.
60°C before the addition of each respective drug or solvent control. Ten 1–2 d old virgin females
were placed in the vials for 4 d. To inhibit tyrosine hydroxylase activity, we prepared a 36 mM alpha
methyl tyrosine (L-AMPT) (Sigma Aldrich) diet. The pH of the solution was adjusted with
concentrated HCl until the drug dissolved. A solvent control diet solution was prepared using
identical procedures. For the dopamine treatments, 1 mM and 10 mM L-dopa precursor (Methyl L-
DOPA hydrochloride) (Sigma Aldrich) were dissolved in water before adding to liquefied fly media.
2.6 RNA extraction
Female virgin flies were collected within 1 h of eclosion, and the heads were removed in RNAlater
(Ambion) to separate the effect from transcripts in non-epidermal head tissues. The remaining head-
less body samples were stored in RNAlater at -80°C until use. Three body samples from each line
were placed in a 2 mL microtube with 400 μL TRIzol Reagent (Thermo Fisher Scientific, Tokyo,
Japan) and an equivalent volume of 1.2 mm zirconia silica beads (Bio Medical Science). After
shaking the tube at 3,200 rpm for 2 min using a Beads Crusher μT-12 (TAITEC, Koshigaya, Japan),
160 μl chloroform was added and mixed thoroughly. Total RNA in the aqueous phase was
subsequently purified using silica-gel (Wakocil 5SIL, Wako, Osaka, Japan) based on the method of
Boom et al. (1990) and was quantified using a Nanodrop 2000c spectrophotometer (Thermo Fisher
Scientific).
2.7 Quantitative real-time PCR (qRT-PCR)
First strand cDNA was synthesized from 1 μg total RNA by using a PrimeScript RT Reagent Kit with
gDNA Eraser (Takara Bio, Kusatsu, Japan). qRT-PCR was performed in a 25 µl reaction volume
with SYBR Premix Ex Taq II Tli RNaseH Plus (Takara Bio) on a Thermal Cycler Dice TP800
(Takara Bio). Primer pairs used for RT-qPCR were ebony: 5′−CTTAGTGTGAAACGGCCACAG−3′
and 5′−GCAGCGAACCCATCTTGAA−3′; tan: 5′−GTTGAGGGGCTTCGATAAGA−3′ and
5′−GTCCTCCGGAAAGATCCTG−3′; Act57B: 5′−CGTGTCATCCTTGGTTCGAGA−3′ and
5′−ACCGCGAGCGATTAACAAGTG−3′; Rp49: 5′−TCGGATCGATATGCTAAGCTG−3′ and
5′−TCGATCCGTAACCGATGTTG−3′. Act57B and Rp49 were used as internal control. Two
5bioRxiv preprint first posted online Feb. 1, 2019; doi: http://dx.doi.org/10.1101/538090. The copyright holder for this preprint (which
was not peer-reviewed) is the author/funder, who has granted bioRxiv a license to display the preprint in perpetuity.
It is made available under a CC-BY-NC-ND 4.0 International license.
replicate PCR reactions were performed for each cDNA sample and three biological replicates were
obtained for each line.
2.8 Grouping DGRP lines based on pigmentation scores and ebony/tan expression levels
The DGRP lines (N = 155) with both pigmentation scores in Dembeck et al. (2015a) and CHC
profiles in Dembeck et al. (2015b) were grouped into dark, intermediate, and light pigmentation lines
using the pigmentation scores of the abdominal tergites from Dembeck et al. (2015a). The scores
ranged from 0 for no dark pigmentation to 4 for 100% dark pigmentation in increments of 0.5, and
were averaged across 10 individuals per line. Pigmentation grouping was done based on the score
delimitations that split the lines most evenly into three groups. For the 5th tergite (A5), lines were
categorized into following groups: dark (1.5 < score, N = 53), intermediate (1 < score ≤ 1.5, N = 56),
and light (score ≤ 1, N = 49). For the 6th tergite (A6), lines were categorized into following groups:
dark (3 < score, N = 51), intermediate (2 < score ≤ 3, N = 55), light (score ≤ 2, N = 49).
The 23 DGRP lines with varying ebony and tan expression levels were grouped into low,
intermediate, and high expression lines using the qRT-PCR data. Since the normalized quantities are
continuous values, grouping was done based on standard deviations (SD). For the ebony expression,
lines were categorized into following groups: low (expression < mean - 0.5SD, N = 6), intermediate
(mean - 0.5SD ≤ expression ≤ mean + 0.5SD, N = 9), and high (mean + 0.5SD < expression, N = 8).
For the tan expression, lines were categorized into following groups: low (expression < mean -
0.5SD, N = 10), intermediate (mean - 0.5SD ≤ expression ≤ mean + 0.5SD, N = 7), and high (mean +
0.5SD < expression, N = 6).
2.9 Statistics
All statistical tests were performed in R for Mac version 3.3.3 (R Core Team 2018) using one-way
ANOVAs to test for statistically significant effects between more than two groups and post-hoc
Tukey HSD tests for multiple pairwise comparisons. We used Spearman’s rank correlation
coefficient ρ to test for the significance of the association. All pairwise tests were two-tailed, and the
level of significance was set as α = 0.05.
3 Results
3.1 Loss-of-function mutations in ebony and tan have reciprocal effects on CHC length
profiles
To determine whether the ebony gene affects cuticular hydrocarbons (CHCs), we created three new
ebony mutant alleles via CRISPR/Cas9 gene editing. One allele, ebonyCRISPR(1,2), contained a 55 bp
deletion that caused a frame-shift in ebony’s coding sequence (Supplementary Figure S1C). Flies
homozygous for this ebonyCRISPR(1,2) allele showed dark body pigmentation similar to that described
previously for loss-of-function ebony mutants (Bridges and Morgan, 1923) (Figure 1B). We
measured CHC profiles in 3–4 d old ebonyCRISPR(1,2) virgin females using gas chromatography
(GC/MS) and found that ebonyCRISPR(1,2) flies showed lower levels of total alkanes relative to 3–4 d
old virgin females from the strain the guide RNAs were injected into (i.e., un-injected vasa-Cas9)
(Figure 1C, One-way ANOVA: F9,40 = 4494, P < 2.0 x 10⁻¹⁶; post-hoc Tukey HSD was significant for
alkanes: P < 1.0 x 10⁻⁵).
We then tested whether ebonyCRISPR(1,2) females had different proportions of individual CHCs.
We calculated the average difference in individual log-contrast transformed CHC relative intensities
6bioRxiv preprint first posted online Feb. 1, 2019; doi: http://dx.doi.org/10.1101/538090. The copyright holder for this preprint (which
was not peer-reviewed) is the author/funder, who has granted bioRxiv a license to display the preprint in perpetuity.
It is made available under a CC-BY-NC-ND 4.0 International license.
(see Materials and Methods) between ebonyCRISPR(1,2) flies and un-injected vasa-Cas9 control flies and
plotted these values against CHC chain length (varying from 21 carbons (C) to 29C) (Figure 1D,
Supplementary Table S1). We found that ebonyCRISPR(1,2) flies tended to show lower levels of short
chain CHCs (25C), suggesting that disrupting the
function of ebony causes a CHC lengthening effect (Figure 1D, Spearman's ρ = 0.83, P < 1.0 x 10⁻⁵).
The two other ebony alleles generated using CRISPR/Cas9 gene editing (ebonyCRISPR(3) and
ebonyCRISPR(4)) each had a single 3 bp in-frame deletion in the first coding exon (Supplementary
Figure S1D,E), suggesting that they might have less severe effects on Ebony activity than the
ebonyCRISPR(1,2) allele containing a 55 bp deletion causing a frame-shift. Consistent with this
prediction, these ebony mutants also showed darker body pigmentation than wild-type flies
(Supplementary Figure S2A), but did not show any bias toward longer CHCs (Supplementary Figure
S2B,C, ebonyCRISPR(3): Spearman's ρ = 0.22, P = 0.34; ebonyCRISPR(4): Spearman's ρ = 0.07, P = 0.78).
To better understand the effects of reduced ebony expression on CHCs, we knocked down
ebony expression in specific cell types using ebony-RNAi (Dietzl et al., 2007). First, we drove
expression of ebony-RNAi with the dsxGAL4 driver (Rideout et al., 2010), which causes RNAi
expression in the cuticle, fat body, CNS, and oenocytes among other tissues. We observed darker
pigmentation in dsxGAL4 > UAS-ebony-RNAi flies than control flies (data not shown), suggesting that
the ebony-RNAi effectively targeted and knocked down ebony expression. These dsxGAL4 > UAS-
ebony-RNAi flies also showed a pattern of CHC lengthening similar to the ebonyCRISPR(1,2) mutants
when compared to to dsxGAL4 / + control flies but not when compared to UAS-ebony-RNAi / + control
flies. This result might be due to leaky UAS-ebony-RNAi expression in the latter control flies that
makes their profiles more similar to those of dsxGAL4 > UAS-ebony-RNAi flies (Supplementary Figure
S3A, B, relative to dsxGAL4 / + control: Spearman’s ρ = 0.58, P < 0.007; relative to UAS-ebony-RNAi
/ + control: Spearman’s ρ = 0.19, P = 0.42).
We hypothesized that the effect on CHCs might be due to reducing ebony expression
specifically in oenocytes because these cells synthesize many CHC precursor compounds
(Wigglesworth, 1970). Therefore, we drove expression of ebony-RNAi using the OK72-GAL4 driver
that is also expressed in oenocytes (Ferveur et al., 1997). These flies showed no significant difference
in CHC length profiles (Supplementary Figure S3C, Spearman’s ρ = -0.01, P = 0.96), suggesting that
ebony expression in non-oenocyte tissues expressing doublesex affects the overall length proportion
of CHCs.
Next, we asked whether loss-of-function mutations in the tan gene also affect CHC
composition. Specifically, we examined CHC composition in 3–4 d old virgin females carrying a
tan20A null allele, which contains an imprecise P-element excision that results in a 953 bp deletion
that includes the presumptive promoter region (True et al., 2005). Because tan encodes a protein that
catalyzes the reverse of the reaction catalyzed by Ebony (Figure 1A), we predicted that tan mutants
might show the opposite effects on CHC composition. Similar to the ebonyCRISPR(1,2) mutants, tan20A
females showed differences in the overall abundance of alkanes, but also total CHCs, monoenes, and
methyl branched CHCs (Figure 1E, One-way ANOVA: F9,40 = 3586, P < 2.0 x 10⁻¹⁶; post-hoc Tukey
HSD was significant for total summed CHCs: P < 0.01, total summed alkanes: P < 0.001, total
summed monoenes: P < 0.001, and total summed methyl branched: P < 0.001). More importantly,
tan20A females tended to show higher levels of short chain CHCs relative to long chain CHCs when
compared to w1118 Canton-S (CS) control flies, as predicted (Figure 1F, Spearman’s ρ = -0.62, P =
0.0043). Together, these results suggest that ebony and tan have reciprocal effects on both
pigmentation synthesis (reviewed in True, 2003 and True, 2005) and CHC length profiles. We note
7bioRxiv preprint first posted online Feb. 1, 2019; doi: http://dx.doi.org/10.1101/538090. The copyright holder for this preprint (which
was not peer-reviewed) is the author/funder, who has granted bioRxiv a license to display the preprint in perpetuity.
It is made available under a CC-BY-NC-ND 4.0 International license.
that this conclusion contradicts Wicker-Thomas and Hamann (2008)’s report that CHC profiles were
similar in ebony or tan loss-of-function mutants and wild-type flies; however, the ebony and tan
alleles used in this prior work might not have been nulls.
3.2 Pharmacological inhibition of tyrosine hydroxylase activity reverses the CHC lengthening
effect in ebonyCRISPR(1,2) flies
We hypothesized that ebony and tan might have reciprocal effects on CHC length profiles because of
their effects on dopamine metabolism. For example, because ebony encodes a protein that converts
dopamine into NBAD (Figure 1A), we hypothesized that loss-of-function ebony mutants might
accumulate dopamine (as reported in Hodgetts and Konopka, 1973) and that this dopamine might be
shunted into other pathways, possibly affecting CHC lengthening. To explore this hypothesis, we fed
1–2 d old adult female ebonyCRISPR(1,2) flies a tyrosine hydroxylase inhibitor, alpha methyl tyrosine
(L-AMPT), for four days to determine whether inhibiting dopamine synthesis would reverse the CHC
lengthening pattern we observed in ebonyCRISPR(1,2) flies. Relative to ebonyCRISPR(1,2) solvent-fed
control flies, ebonyCRISPR(1,2) flies fed 36 mM L-AMPT did indeed reverse the CHC lengthening
pattern we observed in ebonyCRISPR(1,2) flies, resulting in a shortening of CHCs similar to that
observed in tan20A flies (Figure 2A, Spearman’s ρ = -0.48, P = 0.03). Feeding 1–2 d old adult flies L-
AMPT did not, however, affect body pigmentation (data not shown), consistent with body
pigmentation being determined prior to and soon after eclosion (Hovemann et al., 1998). We also fed
ebonyCRISPR(4) flies a 36 mM dose of L-AMPT to see if we could induce CHC shortening in an ebony
mutant with unchanged CHC length composition. Similar to ebonyCRISPR(1,2) fed flies, we detected a
significant negative correlation when comparing ebonyCRISPR(4) fed flies to an ebonyCRISPR(4) solvent-
fed control (Supplementary Figure S4, Spearman’s ρ = -0.57, P = 0.009).
We next hypothesized that tan20A flies might have lower levels of circulating dopamine,
because tan encodes a protein that converts NBAD back into dopamine (Figure 1A). To determine
whether elevating dopamine levels in tan mutants would affect CHCs, we fed tan20A females a
dopamine precursor, methyl L-DOPA hydrochloride (L-DOPA precursor), to see if elevating
dopamine levels could reverse the CHC shortening pattern we observed in tan20A flies; however,
neither the 1 mM nor 10 mM L-DOPA precursor treatments seemed to affect CHC length profiles
when compared to tan20A solvent-fed control flies (Figure 2B, C, Spearman’s ρ = 0.17, P = 0.50;
Spearman’s ρ = 0.01, P = 0.97, respectively). We also fed tan20A flies a higher 100 mM dose of the L-
DOPA precursor, but all of these flies died before CHC extraction; these flies also showed darker
cuticle pigmentation consistent with elevated dopamine. Finally, we fed 1 mM and 10 mM doses of
L-DOPA precursor to wild-type (w1118 CS) females to see if we could induce CHC lengthening in a
wild-type genetic background; instead, we observed a slight CHC shortening effect for the 1 mM
dose and no effect for the 10 mM dose (Supplementary Figure S5, Spearman’s ρ = -0.52, P = 0.02;
Spearman’s ρ = -0.36, P = 0.12, respectively). Together, these results indicate that inhibiting tyrosine
hydroxylase activity in ebony mutants causes a CHC shortening effect like that observed in tan20A
flies; however, increasing dopamine levels through feeding does not cause a CHC lengthening effect.
3.3 UV-LDI MS data suggests that ebony’s effects on pigmentation and CHC length profiles
are not linked at the level of the cuticle
Pigmentation synthesis in insect cuticles involves the secretion of biogenic amines (such as
dopamine) by epidermal cells into the developing cuticle where they are oxidized into quinones that
can form melanins or sclerotins that crosslink proteins (Figure 1A; reviewed in True, 2003 and
Riedel et al., 2011). To determine whether ebony’s effects on CHC length profiles depend on their
function in pigmentation and sclerotization of the fly cuticle, we measured the relative abundance of
8bioRxiv preprint first posted online Feb. 1, 2019; doi: http://dx.doi.org/10.1101/538090. The copyright holder for this preprint (which
was not peer-reviewed) is the author/funder, who has granted bioRxiv a license to display the preprint in perpetuity.
It is made available under a CC-BY-NC-ND 4.0 International license.
individual CHCs in virgin females with different levels of pigmentation across the body. We crossed
pannier-GAL4 (Calleja et al. 2000) females with males from the UAS-ebony-RNAi effector line to
generate flies with a dark, heavily melanized stripe down the dorsal midline (Figure 3A). We then
used UV laser desorption/ionization mass spectrometry (UV-LDI MS) to take repeated
measurements of CHCs along the thorax of females, targeting inside and outside the dark stripe
(Figure 3A). Although we observed an upward trend in abundance from short to long CHCs, we did
not detect a significant CHC lengthening effect like that observed between ebonyCRISPR(1,2) flies and
un-injected vasa-Cas9 females (Figure 3B, Spearman’s ρ = 0.58, P = 0.13). Within the black cuticle,
most CHCs detected by UV-LDI MS showed a decrease in abundance relative to brown cuticle
(Figure 3B). This result suggests that ebony does not affect CHC length profiles through the
pigmentation/sclerotization synthesis pathway, at least at the level of CHC/pigment deposition in the
cuticle.
3.4 Abdominal pigmentation covaries with CHC length profiles in the Drosophila Genetic
Reference Panel (DGRP)
The effects of ebony and tan mutants on CHC profiles described above suggest that variation in these
genes might contribute to variation in both pigmentation and CHC profiles. Recently, Dembeck et al.
(2015a,b) analyzed the genetic architecture of abdominal pigmentation and CHC composition in
female D. melanogaster lines from the Drosophila Genetic Reference Panel (DGRP): Dembeck et al.
(2015a) quantified abdominal pigmentation intensity in the 5th and 6th abdominal tergites (A5 and
A6), and Dembeck et al. (2015b) investigated CHC profiles from the majority of the panel, but the
relationship between the two traits was not examined. Using data from the 155 DGRP lines for which
both pigmentation scores and CHC profiles were published, we tested the hypothesis that natural
variation in pigmentation covaries with natural variation in CHC length profiles. In order to
investigate CHC composition in a way that was comparable to the experiments described above, we
divided the 155 DGRP lines into dark (N = 53), intermediate (N = 56), and light (N = 46)
pigmentation groups using the 5th abdominal tergite (A5) pigmentation scores (0–4) from Dembeck
et al (2015a). Next, we tested whether females from dark, intermediate, or light pigmentation groups
showed differences in their abundance of CHCs with different chain lengths relative to the 155
DGRP line average. We found that the group with the darkest A5 pigmentation showed lower levels
of short chain CHCs and higher levels of long chain CHCs relative to the 155 line average (Figure
4A, Spearman’s ρ = 0.44, P < 0.01); the group with intermediate A5 pigmentation showed no
relationship with CHC chain length (Figure 4B, Spearman’s ρ = 0.002, P = 0.98); and the group with
lightest A5 pigmentation showed the opposite pattern as the dark group (Figure 4C, Spearman’s ρ = -
0.57, P = 1.0 x 10⁻³). We also compared CHC profiles in dark (N = 51), intermediate (N = 55), and
light (N = 49) groups based on pigmentation of the 6th abdominal tergite (A6), and found that,
unexpectedly, the dark group did not show a significant CHC lengthening effect (Supplementary
Figure S6A, Spearman’s ρ = 0.19, P = 0.25), and the intermediate group showed a CHC lengthening
effect (Supplementary Figure S6B, Spearman’s ρ = 0.44, P < 0.01). However, the light group showed
a significant CHC shortening effect as expected (Supplementary Figure S6C, Spearman’s ρ = -0.68,
P < 1.0 x 10⁻⁵). These data suggest that darkly pigmented DGRP females show a pattern of CHC
lengthening similar to the darkly pigmented loss-of-function ebonyCRISPR(1,2) flies, and lightly
pigmented DGRP females show a pattern of CHC shortening similar to lightly pigmented loss-of-
function tan20A flies.
3.5 ebony and tan expression covaries with CHC length profiles in the DGRP
9bioRxiv preprint first posted online Feb. 1, 2019; doi: http://dx.doi.org/10.1101/538090. The copyright holder for this preprint (which
was not peer-reviewed) is the author/funder, who has granted bioRxiv a license to display the preprint in perpetuity.
It is made available under a CC-BY-NC-ND 4.0 International license.
The DGRP genome-wide association (GWAS) study from Dembeck et al. (2015a) revealed that top
variants associated with pigmentation are in ebony, tan, and bab1, consistent with variation in ebony
expression level observed in the DGRP lines (Miyagi et al. 2015) and associations between
pigmentation and these genes in studies of other D. melanogaster populations (Rebeiz et al. 2009a,b;
Telonis-Scott et al. 2011; Takahashi and Takano-Shimizu 2011; Bastide et al. 2013; Endler et al.
2016; 2018). We therefore hypothesized that the differences in CHC length profiles seen in darkly
and lightly pigmented DGRP females might be a consequence of expression variation at ebony and/or
tan.
Using qRT-PCR, we quantified ebony and tan expression within 1 h after eclosion, which is
when pigments determining adult body color are actively produced, in a sample of 23 DGRP lines
that showed variable pigmentation. We then tested whether variation in ebony and tan expression
covaried with CHC length profiles by categorizing the 23 DGRP lines into groups of low,
intermediate, and high ebony or tan expression levels based on the qRT-PCR results, examining the
average difference in individual CHC abundances between each expression group relative to the 23
line average, and plotting these values against CHC chain length (Figure 5).
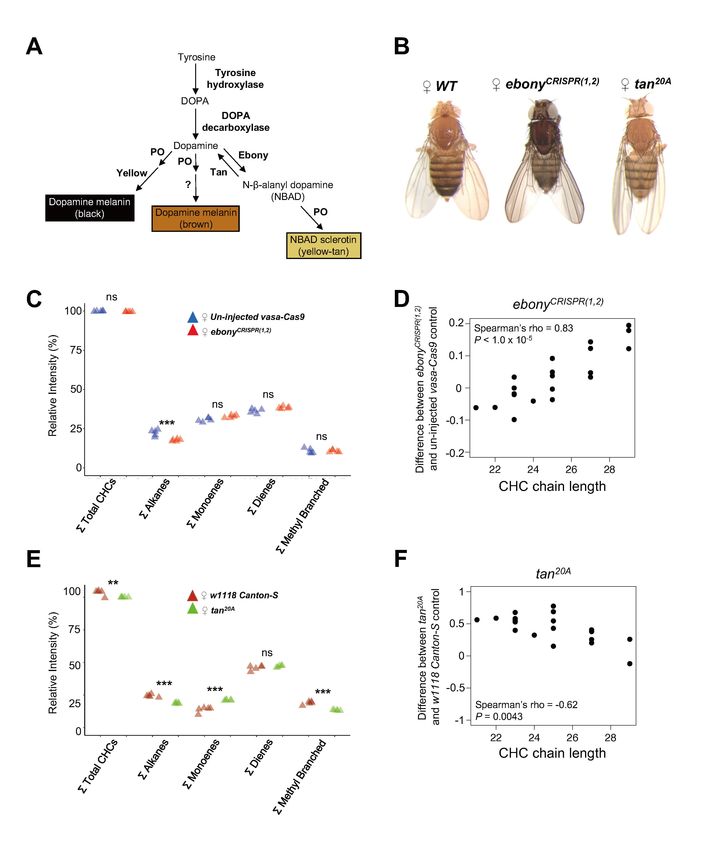
Consistent with our hypothesis, the DGRP lines with low ebony expression showed lower
levels of short chain CHCs, lines with high ebony expression showed higher levels of short chain
CHCs, and lines with intermediate expression showed no change in CHC profiles (Figure 5A–C,
Spearman’s ρ = 0.67, P < 1.0 x 10⁻⁶, Spearman’s ρ = -0.61, P < 1.0 x 10⁻⁵, Spearman’s ρ = -0.10, P =
0.50, respectively). Reciprocally, the DGRP lines with low or intermediate tan expression showed a
slight increase in short chain CHCs, and lines with high tan expression showed a significant decrease
in short chain CHCs (Figure 5D,F, Spearman’s ρ = -0.29, P = 0.05, Spearman’s ρ = -0.32, P = 0.03,
Spearman’s ρ = 0.50, P < 0.001, respectively). Taken together, our results suggest that differences in
ebony and tan gene expression have pleiotropic effects on both pigmentation and CHC length
profiles that might cause these traits to covary in natural D. melanogaster populations.
4 Discussion
Pigmentation genes are often pleiotropic, with effects on vision, circadian rhythms, immunity, and
mating behavior (reviewed in Wittkopp and Beldade, 2009; Takahashi, 2013). Here, we show that
ebony and tan also affect CHC production, with the two genes altering CHC length profiles in
opposing directions: ebonyCRISPR(1,2) mutants had significantly higher levels of long chain CHCs, and
tan20 mutants had significantly higher levels of short chain CHCs. Our results suggest 1) that ebony
and tan have a previously undescribed role in CHC synthesis and/or deposition and 2) that pleiotropy
of both genes might influence the covariation of pigmentation and CHC composition.
4.1 Considering the pleiotropic effects of ebony and tan through changes in dopamine
metabolism
Previous work has shown that changes in dopamine metabolism influence CHC composition in
Drosophila melanogaster. Specifically, females homozygous for loss-of-function Dopa-
decarboxylase (Ddc) temperature-sensitive alleles showed changes in CHC composition that could
be reversed with dopamine feeding (Marican et al., 2004; Wicker-Thomas and Hamann, 2008).
Additionally, inhibiting dopamine synthesis by feeding wild-type females the tyrosine hydroxylase
inhibitor L-AMPT altered CHC composition in a similar direction as the loss-of-function alleles
(Marican et al., 2004; Wicker-Thomas and Hamann, 2008). We found that feeding with L-AMPT
affects CHC length composition, causing ebonyCRISPR(1,2) and ebonyCRISPR(3) mutants to have a more
tan20-like CHC length profile (Figure 2A and Supplementary Figure S4). This result suggests that
10bioRxiv preprint first posted online Feb. 1, 2019; doi: http://dx.doi.org/10.1101/538090. The copyright holder for this preprint (which
was not peer-reviewed) is the author/funder, who has granted bioRxiv a license to display the preprint in perpetuity.
It is made available under a CC-BY-NC-ND 4.0 International license.
ebony and tan may affect CHC length composition through dopamine metabolism, but feeding tan20
and wild-type females dopamine did not lead to CHC lengthening (Figure 2B,C and Supplementary
Figure S5). Why did L-AMPT feeding affect CHC length composition while dopamine feeding did
not? One possible reason is that L-AMPT is a potent inhibitor of tyrosine hydroxylase activity
(Spector et al., 1965), which processes tyrosine that flies ingest, whereas dopamine feeding might not
cause significant changes in dopamine abundance in tissues relevant to CHC synthesis.
Another gene suggesting a possible link between CHC composition and dopamine is the D.
melanogaster apterous gene. Loss of apterous gene function causes an increase in the proportion of
long chain CHCs (Wicker and Jallon, 1995), and apterous mutants also show high levels of
dopamine (Gruntenko et al., 2003; Grutenko et al., 2005; Grutenko et al., 2012). These mutants also
show low levels of juvenile hormone (JH) (Altaratz et al., 1991), and treating decapitated females
with methoprene to increase JH synthesis caused a decrease in long chain CHCs (Wicker and Jallon,
1995). The CHC lengthening and increased dopamine levels seen in apterous mutants resemble
ebony mutants, but it is unknown whether ebony mutants show altered JH profiles. Further evidence
supporting a role of JH and other ecdysteroids in determining CHC chain length comes from
houseflies (Blomquist et al., 1987). In D. melanogaster, ecdysteroid signaling was found to be
required not only for CHC synthesis but also survival of the oenocyte cells that synthesize CHCs
(Chiang et al., 2016). An interesting future direction would be to test whether changes in dopamine
metabolism in ebony or tan mutants influence CHC length composition through JH signaling. More
broadly, a thorough genetic analysis focused on tissue-specific manipulation of dopamine is needed
to deepen our understanding about its role in CHC synthesis.
4.2 CHC lengthening in ebony mutants does not seem to depend on changes at the level of the
cuticle
Data from our tyrosine hydroxylase inhibition experiments supported the hypothesis that elevated
dopamine levels in ebony mutants (as reported in Hodgetts and Konopka, 1973) affect CHC
lengthening; however, it remains unclear which cells require ebony expression (and possibly
dopamine metabolism) to influence CHC synthesis. We hypothesized that ebony-dependent changes
of the fly cuticle itself might affect CHC deposition during fly development or CHC extraction in the
laboratory, and found that all but one detected CHC showed an overall decrease in abundance in dark
cuticle relative to light cuticle. However, we note that these differences might be due to changes in
the physical properties of dark versus light cuticle as they interact with the UV-LDI instrument. We
also note that ebonyCRISPR(3) and ebonyCRISPR(4) mutants had darkly pigmented cuticle like
ebonyCRISPR(1,2) mutants but CHC length profiles similar to wild-type flies, suggesting that ebony and
tan’s effects on CHC length composition can be separated from their role in pigmentation synthesis.
For example, ebony expression in glia is necessary for normal circadian rhythms in D. melanogaster
but not pigmentation (Suh and Jackson, 2007). We tested whether knocking down ebony in oenocytes
affected CHC length composition and found that it did not, thus the specific cells required for ebony
and tan’s effects on CHC synthesis remain unknown.
4.3 Patterns of CHC composition and pigmentation along clines in natural populations
Identifying the pleiotropic effects of ebony and tan on pigmentation and CHCs is important because
it suggests that these genes might contribute to the covariation of both traits in natural populations.
For example, selection for ebony- or tan-dependent pigmentation variation might also cause variation
in CHC length composition without selection acting directly on this trait. Alternatively, selection for
long chain CHCs with higher melting temperatures (Gibbs and Pomonis, 1995; Gibbs, 1998) in drier
climates might cause a correlated increase in pigmentation intensity. Indeed, we found that variation
11bioRxiv preprint first posted online Feb. 1, 2019; doi: http://dx.doi.org/10.1101/538090. The copyright holder for this preprint (which
was not peer-reviewed) is the author/funder, who has granted bioRxiv a license to display the preprint in perpetuity.
It is made available under a CC-BY-NC-ND 4.0 International license.
in abdominal pigmentation covaries with both ebony and tan gene expression as well as CHC length
profiles in directions predicted by ebony and tan mutants among the DGRP lines, which were derived
from flies isolated from a single, natural population (Ayroles et al. 2009; Mackay et al. 2012; Huang
et al. 2014). However, this finding does not necessarily imply variation in both traits is caused by the
same gene(s) nor that these traits will always co-evolve; for example, individuals with dark
pigmentation may coincidentally possess alleles that are in linkage disequilibrium that cause a CHC
lengthening phenotype. Comparing the phenotypic frequency of pigmentation and CHC length
composition phenotypes within and between the same populations that are undergoing adaptation to
common environments will help answer this question. In Africa, for example, D. melanogaster
populations repeatedly show a strong positive correlation between elevation and dark pigmentation,
suggesting that environments at high altitudes might select for darkly pigmented flies (or some other
trait that correlates with pigmentation) (Pool and Aquadro, 2007; Bastide et al., 2014). It will be
interesting to know whether these populations also show an increase in abundance of long chain
CHCs.
Both pigmentation and CHC length profiles vary along altitudinal and latitudinal clines in
natural Drosophila populations, suggesting that ecological factors such as humidity or temperature
play a role in shaping variation in at least one of these traits. At higher altitudes or latitudes,
populations often showed darker pigmentation profiles in Europe, India, and Australia (Heed and
Krishnamurthy, 1959; David et al., 1985; Capy et al., 1988; Das, 1995; Munjal et al., 1997; Parkash
and Munjal, 1999; Pool and Aquadro, 2007; Telonis-Scott et al., 2011; Parkash et al., 2008a; Parkash
et al., 2008b; Matute and Harris, 2013). In Africa, however, latitude and pigmentation intensity
showed a negative correlation, so this relationship is not universal (Bastide et al., 2014). For CHCs,
Rajpurohit et al. (2017) reported that D. melanogaster populations at higher latitudes showed more
short chain CHCs, whereas populations at lower latitudes showed more long chain CHCs in the
United States. Frentiu and Chenoweth (2010) similarly found that populations at high latitudes along
a cline in Australia showed more short chain CHCs and fewer long chain CHCs. These patterns do
not match predictions based on the pleiotropy we observed: flies at higher latitudes tend to have
darker pigmentation and higher levels of short chain CHCs whereas ebonyCRISPR(1,2) mutants, for
example, have darker pigmentation and lower levels of short chain CHCs. To the best of our
knowledge, pigmentation (nor ebony or tan expression) and CHC length composition have not been
simultaneously measured in flies from the same cline, making it difficult to discern whether
pigmentation and CHC composition covary in the wild in ways predicted by the mutant data. For
example, Frentiu and Chenoweth (2010) measured CHCs from populations along the east coast of
Australia, but they did not include populations from higher latitude coastal regions with darker
pigmentation and lower ebony expression in newly eclosed adults (Telonis-Scott et al. 2011).
Comparing variation in both traits within and between populations along latitudinal and/or altitudinal
clines will make it clearer if and to what extent pigmentation and CHC composition covary and
whether variation in these features is accompanied by changes in ebony and tan expression.
5 Conflict of Interest
The authors declare that the research was conducted in the absence of any commercial or financial
relationships that could be construed as a potential conflict of interest.
6 Author Contributions
12bioRxiv preprint first posted online Feb. 1, 2019; doi: http://dx.doi.org/10.1101/538090. The copyright holder for this preprint (which
was not peer-reviewed) is the author/funder, who has granted bioRxiv a license to display the preprint in perpetuity.
It is made available under a CC-BY-NC-ND 4.0 International license.
J.H.M., N.A., P.J.W., J.Y.Y., and A.T. conceived the project; J.H.M., N.A., T.B., K.D., and J.Y.Y.
collected the data; J.H.M, N.A., T.B., K.D., J.Y.Y., and A.T. analyzed the data; and J.H.M., P.J.W.,
J.Y.Y., and A.T wrote the paper.
7 Funding
This work was supported by a University of Michigan, Department of Ecology and Evolutionary
Biology, Nancy W. Walls Research Award, National Institutes of Health training grant
T32GM007544, and Howard Hughes Medical Institute Janelia Graduate Research Fellowship
awarded to J.H.M; the German Research Foundation (grant DR 416/10-1) awarded to K.D.; National
Institutes of Health grant 1R35GM118073 awarded to P.J.W.; Department of Defense, U.S. Army
Research Office W911NF1610216 and National Institutes of Health grant 1P20GM125508 awarded
to J.Y.Y.; The Sumitomo Foundation Grant for Basic Science Research Projects 160999 to A.T.
8 Acknowledgments
We thank members of the Takahashi, Wittkopp, and Yew labs and Aki Ejima for helpful discussions;
John True, Stephen Goodwin, Scott Pletcher, Rainbow Transgenics Inc., the Bloomington Drosophila
Stock Center, and the Vienna Drosophila RNAi Center for fly stocks; and Rainbow Transgenics Inc.,
for fly injections.
9 Reference styles
Albert, A. Y., Sawaya, S., Vines, T. H., Knecht, A. K., Miller, C. T., et al. (2008). The genetics of
adaptive shape shift in stickleback: pleiotropy and effect size. Evolution, 62, 76-85.
Altaratz, M., Applebaum, S. W., Richard, D. S., Gilbert, L. I., & Segal, D. (1991). Regulation of
juvenile hormone synthesis in wild-type and apterous mutant Drosophila. Molecular and Cellular
Endocrinology, 81, 205-216.
Ayroles, J. F., Carbone, M. A., Stone, E. A., Jordan, K. W., Lyman, R. F., Magwire, M. M., ... &
Mackay, T. F. (2009). Systems genetics of complex traits in Drosophila melanogaster. Nature
Genetics, 41, 299-307.
Bassett, A. R., Tibbit, C., Ponting, C. P., Liu, J-L. 2013. Highly efficient targeted mutagenesis of
Drosophila with CRISPR/Cas9 system. Cell Reports, 4, 220-228.
Bastide, H., Betancourt, A., Nolte, V., Tobler, R., Stöbe, P., Futschik, A., & Schlötterer, C. (2013). A
genome-wide, fine-scale map of natural pigmentation variation in Drosophila melanogaster. PLoS
Genetics, 9, e1003534.
Bastide, H., Yassin, A., Johanning, E. J. Pool, J. E. (2014). Pigmentation in Drosophila melanogaster
reaches its maximum in Ethiopia and correlates most strongly with ultra-violet radiation in sub-
Saharan Africa. BMC Evolutionary Biology, 14, 179.
Bastock, M. (1956). A gene mutation which changes a behavior pattern. Evolution, 10, 421-439.
Boom, R. C. J. A., Sol, C. J., Salimans, M. M., Jansen, C. L., Wertheim-van Dillen, P. M., & Van der
Noordaa, J. P. M. E. (1990). Rapid and simple method for purification of nucleic acids. Journal of
Clinical Microbiology, 28, 495-503.
13bioRxiv preprint first posted online Feb. 1, 2019; doi: http://dx.doi.org/10.1101/538090. The copyright holder for this preprint (which
was not peer-reviewed) is the author/funder, who has granted bioRxiv a license to display the preprint in perpetuity.
It is made available under a CC-BY-NC-ND 4.0 International license.
Blomquist, G. J., DILLWITH, J. W., & Adams, T. S. (1987). Biosynthesis and endocrine regulation
of sex pheromone production in Diptera. In Pheromone Biochemistry (pp. 217-250).
Blows MW, Allen RA (1998) Levels of mate recognition within and between two Drosophila species
and their hybrids. American Naturalist, 152, 826–837.
Brand, A. H., & Perrimon, N. (1993). Targeted gene expression as a means of altering cell fates and
generating dominant phenotypes. Development, 118, 401-415.
Bridges, C. B., & Morgan, T. H. (1923). Third-chromosome group of mutant characters of
Drosophila melanogaster. Carnegie Institution Of Washington: Washington.
Calleja, M., Herranz, H., Estella, C., Casal, J., Lawrence, P., Simpson, P., & Morata, G. (2000).
Generation of medial and lateral dorsal body domains by the pannier gene of Drosophila.
Development, 127, 3971-3980.
Capy, P., David, J. R., & Robertson, A. (1988). Thoracic trident pigmentation in natural populations
of Drosophila simulans: a comparison with D. melanogaster. Heredity, 61, 263.
Chiang, Y. N., Tan, K. J., Chung, H., Lavrynenko, O., Shevchenko, A., & Yew, J. Y. (2016). Steroid
hormone signaling is essential for pheromone production and oenocyte survival. PLoS Genetics, 12,
e1006126.
Chung, H., Loehlin, D. W., Dufour, H. D., Vacarro, K., Millar, J. G., & Carroll, S. B. (2014). A
single gene affects both ecological divergence and mate choice in Drosophila. Science, 343, 1148-
1151.
Das, A. (1995). Abdominal pigmentation in Drosophila melanogaster females from natural Indian
populations. Journal of Zoological Systematics and Evolutionary Research, 33(2), 84-87.
David, J. R., Capy, P., Payant, V., & Tsakas, S. (1985). Thoracic trident pigmentation in Drosophila
melanogaster: differentiation of geographical populations. Génétique, Sélection, Évolution, 17, 211.
Dembeck, L. M., Huang, W., Magwire, M. M., Lawrence, F., Lyman, R. F., & Mackay, T. F. (2015).
Genetic architecture of abdominal pigmentation in Drosophila melanogaster. PLoS Genetics, 11,
e1005163.
Dembeck, L. M., Böröczky, K., Huang, W., Schal, C., Anholt, R. R., & Mackay, T. F. (2015).
Genetic architecture of natural variation in cuticular hydrocarbon composition in Drosophila
melanogaster. Elife, 4, e09861.
Dietzl, G., Chen, D., Schnorrer, F., Su, K. C., Barinova, Y., Fellner, M., ... & Couto, A. (2007). A
genome-wide transgenic RNAi library for conditional gene inactivation in Drosophila. Nature, 448,
151-156.
Drapeau, M. D., Radovic, A., Wittkopp, P. J., & Long, A. D. (2003). A gene necessary for normal
male courtship, yellow, acts downstream of fruitless in the Drosophila melanogaster larval brain.
Journal of Neurobiology, 55, 53-72.
14bioRxiv preprint first posted online Feb. 1, 2019; doi: http://dx.doi.org/10.1101/538090. The copyright holder for this preprint (which
was not peer-reviewed) is the author/funder, who has granted bioRxiv a license to display the preprint in perpetuity.
It is made available under a CC-BY-NC-ND 4.0 International license.
Drapeau, M. D., Cyran, S. A., Viering, M. M., Geyer, P. K., & Long, A. D. (2006). A cis-regulatory
sequence within the yellow locus of Drosophila melanogaster required for normal male mating
success. Genetics, 172, 1009-1030.
Duveau, F., & Félix, M. A. (2012). Role of pleiotropy in the evolution of a cryptic developmental
variation in Caenorhabditis elegans. PLoS Biology, 10, e1001230.
Endler, L., Betancourt, A. J., Nolte, V., & Schlötterer, C. (2016). Reconciling differences in pool-
GWAS between populations: a case study of female abdominal pigmentation in Drosophila
melanogaster. Genetics, 202, 843-855.
Endler, L., Gibert, J. M., Nolte, V., & Schlötterer, C. (2018). Pleiotropic effects of regulatory
variation in tan result in correlation of two pigmentation traits in Drosophila melanogaster.
Molecular Ecology, 27, 3207-3218.
Ferveur, J. F., Savarit, F., O'kane, C. J., Sureau, G., Greenspan, R. J., & Jallon, J. M. (1997). Genetic
feminization of pheromones and its behavioral consequences in Drosophila males. Science, 276,
1555-1558.
Flaven-Pouchon, J., Farine, J-P., Ewer, J., Ferveur, J-F. (2016). Regulation of cuticular hydrocarbon
profile maturation by Drosophila tanning hormone, bursicon, and its interaction with desaturase
activity. Insect Biochemistry and Molecular Biology, 79, 87-96.
Foley, B. R., & Telonis-Scott, M. (2011). Quantitative genetic analysis suggests causal association
between cuticular hydrocarbon composition and desiccation survival in Drosophila melanogaster.
Heredity, 106, 68.
Frentiu, F. D., Chenoweth, S. F. (2009). Clines in cuticular hydrocarbons in two Drosophila species
with independent population histories. Evolution, 64, 1784-1794.
Gibbs, A., & Pomonis, J. G. (1995). Physical properties of insect cuticular hydrocarbons: the effects
of chain length, methyl-branching and unsaturation. Comparative Biochemistry and Physiology Part
B: Biochemistry and Molecular Biology, 112, 243-249.
Gibbs, A. G., Chippindale, A. K., & Rose, M. R. (1997). Physiological mechanisms of evolved
desiccation resistance in Drosophila melanogaster. Journal of Experimental Biology, 200, 1821-
1832.
Gibbs, A. G. (1998). Water-proofing properties of cuticular lipids. American Zoologist, 38, 471-482.
Gratz, S. J., Ukken, F. P., Rubinstein, C. D., Thiede, G., Donohue, L. K., Cummings, A. M., &
O'Connor-Giles, K. M. (2014). Highly specific and efficient CRISPR/Cas9-catalyzed homology-
directed repair in Drosophila. Genetics, 196, 961-971.
Greenwood, A. K., Mills, M. G., Wark, A. R., Archambeault, S. L., Peichel, C. L. (2016). Evolution
of schooling behavior in threespine sticklebacks is shaped by the Eda gene. Genetics, 203, 677-681.
Gruntenko, N. E., Chentsova, N. A., Andreenkova, E. V., Bownes, M., Segal, D., Adonyeva, N. V.,
& Rauschenbach, I. Y. (2003). Stress response in a juvenile hormone‐deficient Drosophila
melanogaster mutant apterous. Insect Molecular Biology, 12, 353-363.
15bioRxiv preprint first posted online Feb. 1, 2019; doi: http://dx.doi.org/10.1101/538090. The copyright holder for this preprint (which
was not peer-reviewed) is the author/funder, who has granted bioRxiv a license to display the preprint in perpetuity.
It is made available under a CC-BY-NC-ND 4.0 International license.
Gruntenko, N. E., Karpova, E. K., Alekseev, A. A., Chentsova, N. A., Saprykina, Z. V., Bownes, M.,
& Rauschenbach, I. Y. (2005). Effects of dopamine on juvenile hormone metabolism and fitness in
Drosophila virilis. Journal of Insect Physiology, 51, 959-968.
Gruntenko, N. Е., Laukhina, O. V., Bogomolova, E. V., Karpova, E. K., Menshanov, P. N.,
Romanova, I. V., & Rauschenbach, I. Y. (2012). Downregulation of the dopamine D2-like receptor
in corpus allatum affects juvenile hormone synthesis in Drosophila melanogaster females. Journal of
Insect Physiology, 58, 348-355.
Heed, W. B., & Krishnamurthy, N. B. (1959). Genetic studies on the cardini group of Drosophila in
the West Indies. Univ. Texas Publ, 5914, 155-179.
Hodgetts, R. B., & Konopka, R. J. (1973). Tyrosine and catecholamine metabolism in wild-type
Drosophila melanogaster and a mutant, ebony. Journal of Insect Physiology, 19, 1211-1220.
Hovemann, B. T., Ryseck, R. P., Walldorf, U., Störtkuhl, K. F., Dietzel, I. D., & Dessen, E. (1998).
The Drosophila ebony gene is closely related to microbial peptide synthetases and shows specific
cuticle and nervous system expression. Gene, 221, 1-9.
Huang, W., Massouras, A., Inoue, Y., et al. (2014) Natural variation in genome architecture among
205 Drosophila melanogaster Genetic Reference Panel lines. Genome Research, 24, 1193–1208.
Mackay, T. F., Richards, S., Stone, E. A., Barbadilla, A., Ayroles, J. F., Zhu, D., ... & Richardson, M.
F. (2012). The Drosophila melanogaster genetic reference panel. Nature, 482, 173-178.
Marican, C., Duportets, L., Birman, S., Jallon, J. M. (2004). Female-specific regulation of cuticular
hydrocarbon biosynthesis by dopamine in Drosophila melanogaster. Insect Biochemistry and
Molecular Biology, 34, 823-830.
Martin, A., & Orgogozo, V. (2013). The loci of repeated evolution: a catalog of genetic hotspots of
phenotypic variation. Evolution, 67, 1235-1250.
Matute, D. R., & Harris, A. (2013). The influence of abdominal pigmentation on desiccation and
ultraviolet resistance in two species of Drosophila. Evolution 67, 2451-2460.
Mckay, J. K., Richards, J. H., and Mitchell-Olds, T. (2003). Genetics of drought adaptation in
Arabidopsis thaliana: I. Pleiotropy contributes to genetic correlations among ecological traits.
Molecular Ecology 12, 1137-1151.
McLean, C. Y., Reno, P. L., Pollen, A. A., Bassan, A. I., Capellini, T. D., Guenther, C., ... & Wenger,
A. M. (2011). Human-specific loss of regulatory DNA and the evolution of human-specific
traits. Nature, 471, 216.
Miyagi, R., Akiyama, N., Osada, N., & Takahashi, A. (2015). Complex patterns of cis-regulatory
polymorphisms in ebony underlie standing pigmentation variation in Drosophila melanogaster.
Molecular Ecology, 24, 5829–5841.
Munjal, A. K., Karan, D., Gibert, P., Moreteau, B., Parkash, R., & David, J. R. (1997). Thoracic
trident pigmentation in Drosophila melanogaster: latitudinal and altitudinal clines in Indian
populations. Genetics Selection Evolution, 29, 601.
16You can also read