Ionic Cross-Linking as a Strategy to Modulate the Properties of Oral Mucoadhesive Microparticles Based on Polysaccharide Blends - MDPI
←
→
Page content transcription
If your browser does not render page correctly, please read the page content below
pharmaceutics

Article
Ionic Cross-Linking as a Strategy to Modulate the Properties of Oral
Mucoadhesive Microparticles Based on Polysaccharide Blends
Fernanda Isadora Boni *, Beatriz S. F. Cury, Natália Noronha Ferreira and Maria Palmira Daflon Gremião *

                                          School of Pharmaceutical Science, São Paulo State University (UNESP), Araraquara, Road Araraquara–Jaú,
                                          Km 01, Araraquara, São Paulo 14801-902, Brazil; beatriz.cury@unesp.br (B.S.F.C.);
                                          natalia.noronha@unesp.br (N.N.F.)
                                          * Correspondence: fernanda.boni@unesp.br (F.I.B.); palmira.gremiao@unesp.br (M.P.D.G.);
                                            Tel.: +5516-3301-6961 (F.I.B.); +5516-3301-6975 (M.P.D.G.)

                                          Abstract: Polymer blends of gellan gum (GG)/retrograded starch(RS) and GG/pectin (P) were
                                          cross-linked with calcium, aluminum, or both to prepare mucoadhesive microparticles as oral carriers
                                          of drugs or nano systems. Cross-linking with different cations promoted different effects on each
                                          blend, which can potentially be explored as novel strategies for modulating physical–chemical and
                                          mucoadhesive properties of microparticles. Particles exhibited spherical shapes, diameters from
                                          888 to 1764 µm, and span index values lower than 0.5. Blends of GG:P cross-linked with aluminum
                                          resulted in smaller particles than those obtained by calcium cross-linking. GG:RS particles exhibited
                                larger sizes, but cross-linking this blend with calcium promoted diameter reduction. The uptake

                                          rates of acid medium were lower than phosphate buffer (pH 6.8), especially GG:RS based particles
Citation: Boni, F.I.; Cury, B.S.F.;
                                          cross-linked with calcium. On the other hand, particles based on GG:P cross-linked with calcium
Ferreira, N.N.; Gremião, M.P.D. Ionic
                                          absorbed the highest volume of acid medium. The percentage of systems erosion was higher in
Cross-Linking as a Strategy to
                                          acid medium, but apparently occurred in the outermost layer of the particle. In pH 6.8, erosion was
Modulate the Properties of Oral
Mucoadhesive Microparticles Based
                                          lower, but caused expressive swelling of the matrixes. Calcium cross-linking of GG:RS promoted
on Polysaccharide Blends.                 a significantly reduction on enzymatic degradation at both pH 1.2 and 6.8, which is a promising
Pharmaceutics 2021, 13, 407.              feature that can provide drug protection against premature degradation in the stomach. In contrast,
https://doi.org/10.3390/                  GG:P microparticles cross-linked with calcium suffered high degradation at both pH values, an
pharmaceutics13030407                     advantageous feature for quickly releasing drugs at different sites of the gastrointestinal tract. The
                                          high mucoadhesive ability of the microparticles was evidenced at both pH values, and the Freundlich
Academic Editors:                         parameters indicated stronger particle–mucin interactions at pH 6.8.
Vitaliy Khutoryanskiy and
Elisabetta Gavini                         Keywords: gellan gum; pectin; retrograded starch; mucoadhesion; liquid uptake; erosion;
                                          enzymatic degradation
Received: 1 February 2021
Accepted: 12 March 2021
Published: 19 March 2021

                                          1. Introduction
Publisher’s Note: MDPI stays neutral
with regard to jurisdictional claims in
                                               The oral route is the most common pathway for drug administration, because it
published maps and institutional affil-   simultaneously provides several advantages, such as convenience, ease and security for self-
iations.                                  administration, and improved patient compliance. However, the variation of physiological
                                          conditions exhibited throughout the gastrointestinal tract (GIT), such as pH, microbiota,
                                          enzymatic content, and peculiarities of local mucous membranes, impose great challenges
                                          for the therapeutic performance of orally administered drugs [1].
Copyright: © 2021 by the authors.
                                               Microencapsulation can be considered a powerful technological strategy for design-
Licensee MDPI, Basel, Switzerland.
                                          ing innovative delivery systems for oral drug administration. This strategy allows the
This article is an open access article
                                          modulation of critical physical–chemical and/or biological properties of drug molecules,
distributed under the terms and           which can enhance systemic or local action depending on the formulations and techno-
conditions of the Creative Commons        logical approaches used [2–6]. In addition to carrying active compounds, such as drugs,
Attribution (CC BY) license (https://     nano-systems can also be microencapsulated, which may, in turn, help to effectively control
creativecommons.org/licenses/by/          drug release rates and provide protection against in vivo degradation [7–10]. One of the
4.0/).                                    most attractive possibilities of employing microencapsulation in treatments is the fact

Pharmaceutics 2021, 13, 407. https://doi.org/10.3390/pharmaceutics13030407                          https://www.mdpi.com/journal/pharmaceutics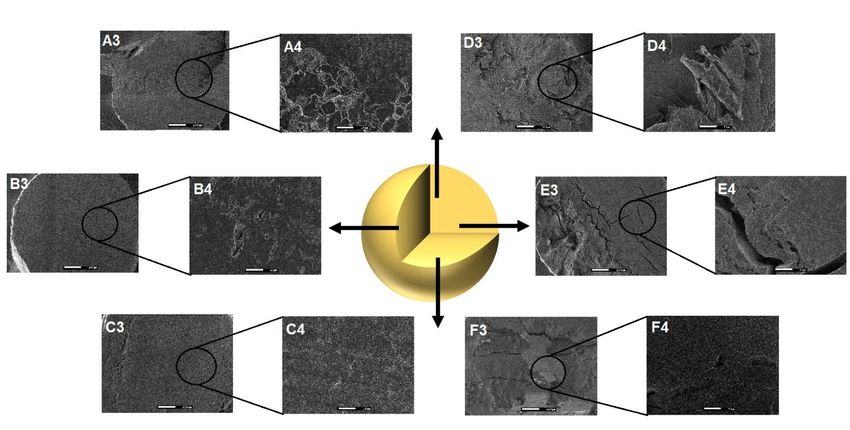
Pharmaceutics 2021, 13, 407                                                                                            2 of 17

                              that they can promote sustained, prolonged, delayed, and/or targeted release of drugs or
                              nano-systems to specific organs or cells [8].
                                    Over recent years, our research group has focused on the use of natural polysaccha-
                              rides in the rational design of innovative micro-scale oral delivery systems, some exploiting
                              gellan gum (GG), retrograded starch (RS), and pectin (P) as backbone materials. This
                              approach has allowed us to modulate drug release rates and achieve desired interactions
                              with the bio interface, influencing the biological performance of drugs [2,5,6,11,12].
                                    GG and P are widespread, bioavailable, biocompatible, and low-cost polysaccha-
                              rides. Their attractive features, such as hydrogel-forming ability, pH-dependent response,
                              swelling, and inhibitory enzymatic activity, can be very useful in designing novel drug de-
                              livery systems. Additionally, several studies have highlighted the mucoadhesive properties
                              of these polysaccharides [11,12].
                                    Mucoadhesion is a complex mechanism, which is enabled by supramolecular interac-
                              tions between mucous components, mainly mucin glycoproteins, and the functional groups
                              of other substrates, such as the polymeric microparticles (PMs). The mucoadhesiveness
                              of drug delivery systems can significantly affect the biological performance of drugs and
                              loaded nano-systems, providing system immobilization and increasing residence time
                              and/or absorption at the target site of action, in addition to intensifying contact with
                              biological substrates [13].
                                    GG, RS, and P also allow the use of mild encapsulation conditions, avoiding organic
                              solvents, high temperatures, and extreme pH values, which preserves the stability of
                              several drugs, proteins, and cells [14].
                                    Blends of GG and P were exploited for the design of micro and nanostructured
                              systems by cross-linking with Al3+ . Both beads and nanoparticles allowed high entrapment
                              efficiency of resveratrol and effectively reduced drug release in acidic media. Low drug
                              permeability was also demonstrated for all cell models, revealing that such systems present
                              promising features that allow colon-targeted drug release [2].
                                    Retrograded starch (RS) is prepared by hydrothermally treating high-amylose starch,
                              which increases its resistance against the enzymatic digestion in the upper portions of the
                              GIT and enables it to be selectively degraded by colonic microbiota. Both of the aforemen-
                              tioned features make it suitable for designing colon-specific drug delivery systems [15,16].
                              Recently, a novel oral carrier for insulin, composed by GG microparticles cross-linked with
                              aluminum (Al3+ ) and coated with films based on RS/P blends, was designed and tested.
                              The designed microparticles effectively protected the insulin from degradation in the acidic
                              and enzymatic conditions of the stomach, providing low drug release rates in acidic media
                              and improving the intestinal permeability of this protein. Results evidenced the potential
                              of this micro-carrier system for colon-specific release of proteins and other biomolecules,
                              when aiming for systemic action [5].
                                    The potential mucoadhesiveness of GG and RS at different pH values (1.2 and 6.8)
                              was recently evaluated by using the rheological approach. The high mucoadhesive ability
                              of GG was evidenced as it provoked significant changes in mucin arrangements, mainly
                              in acidic media. On the other hand, the interactions between RS and mucin were poor,
                              indicating low mucoadhesiveness. These findings evidence that mixing GG and RS can be
                              a rational strategy for modulating the mucoadhesiveness of mucosal drug delivery systems
                              to specific uses [16].
                                    In the present work, we approach the design of inert oral mucoadhesive microparticles
                              based on GG/RS or GG/P blends, cross-linked with calcium, aluminum, or both. Different
                              physical–chemical properties were achieved, as well as particles mucoadhesiveness. This
                              study opens up new possibilities for the design of inert platforms that target drugs, proteins,
                              or even nanostructured systems to specific gastrointestinal sites.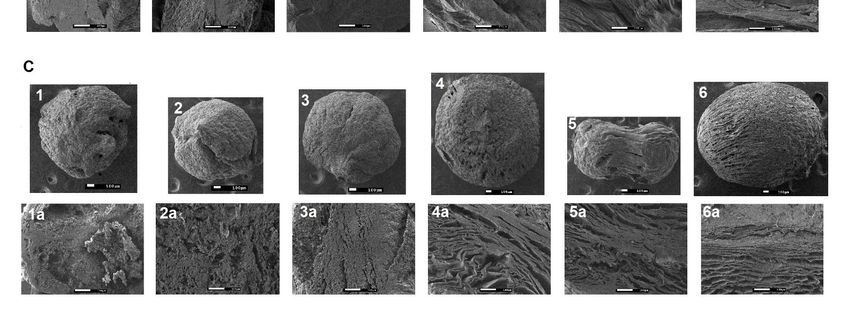
Pharmaceutics 2021, 13, 407                                                                                            3 of 17

                              2. Materials and Methods
                              2.1. Materials
                                  Pectin (type LM-5206 CS, ~380 kDa) and gellan gum (Kelcogel®CG-LA, ~115 kDa)
                              were kindly provided by CP Kelco (Limeira, Brazil). High-amylose starch (HAS) (Hylon
                              VII–68% amylose, lot: HA9140) was a gift from National Starch & Chemical (New Jersey,
                              USA). Mucin type II was acquired from Sigma-Aldrich (Missouri, USA). All other materials
                              used were of analytical grade and obtained from commercial suppliers.

                              2.2. Methods
                              2.2.1. Development of polysaccharide-based microparticles
                              Retrogradation of High-amylose Starch
                                   The retrogradation process of high-amylose starch (type 3) was carried out by hy-
                              drothermal treatment, applying alternating thermal cycles of 4 ◦ C and 30 ◦ C every two
                              days for 16 days, following the procedure proposed by Meneguin et al. [17]. Briefly, an
                              aqueous high-amylose dispersion (5%, w/v) was prepared under magnetic stirring at 80 ◦ C.
                              This dispersion was autoclaved (121 ◦ C) for 15 min in order to pre-gelatinize the starch
                              before conducting the retrogradation process.

                              Polysaccharide-based Microparticles (PMs) by Ionic-cross-linking
                                    Microparticles of GG:P and GG:RS were prepared by the ionotropic gelation method,
                              applying single or double ionic cross-linking with Ca2+ and/or Al3+ . To summarize, GG:P
                              microparticles were produced by mixing the polymers (1:1, w/w) and their subsequent
                              dispersion into purified water at 2% (w/v) under magnetic stirring and heating (60 ◦ C).
                              Afterwards, ionic cross-linking was carried out by dripping the dispersion into the cooled
                              cation solution (3%, w/v) using syringes with needles (22G-0.7 × 0.3 mm), under magnetic
                              stirring. The cross-linking reaction was maintained for 30 min. In order to produce the
                              double cross-linked microparticles, the GG:P dispersion was dripped in a Ca2+ solution and,
                              after 15 min, the formed particles were separated by filtration and immersed into a cooled
                              Al3+ solution under magnetic stirring for 30 min. Lastly, the obtained PMs were once again
                              separated by filtration (reconstituted cellulose, pore size 3 µm), washed with distilled water,
                              and dried at room temperature until reaching homogeneous weight. Particles composed of
                              GG:RS were produced following the same protocol described above and by mixing the GG
                              dispersion (2%, w/v) with the RS (5%, w/v) dispersion at a mass ratio of 1:2.5. The particles
                              were filtered, washed, and dried at room temperature, reaching homogeneous weight.

                              2.2.2. Microparticle Characterization
                              Particle Size, Span Index, and Circularity Index
                                    Size and shape of the PMs were evaluated on a Leica MZ APO® stereoscope, coupled
                              to a Motic Images Advance 3.2 program, using captured images at 10× magnification. The
                              circularity and the equivalent diameter of 100 particles of each sample were analyzed by
                              the captured images using ImageJ® Software.
                                    Based on size distribution data, the Span index was determined following Equation
                              (1), providing sample polydispersity.

                                                                           ( D90 − D10)
                                                                 SPAN =                                                   (1)
                                                                               D50
                                   D90, D10, and D50 represent the diameters (µm) determined for the 90th, 10th, and
                              50th percentiles, respectively.

                              Surface and Internal Structure Analyses by Field Emission Scanning Electron Microscopy
                                   Intact and fractured PMs were analyzed using high-resolution field emission scanning
                              electron microscopy (SEM-FEG) using a JOEL-JSM-7500F microscope (Joel company, USA),
                              coupled to the Joel Pc-100 ver.2.1.0.3. software. Samples were fixed with double-sided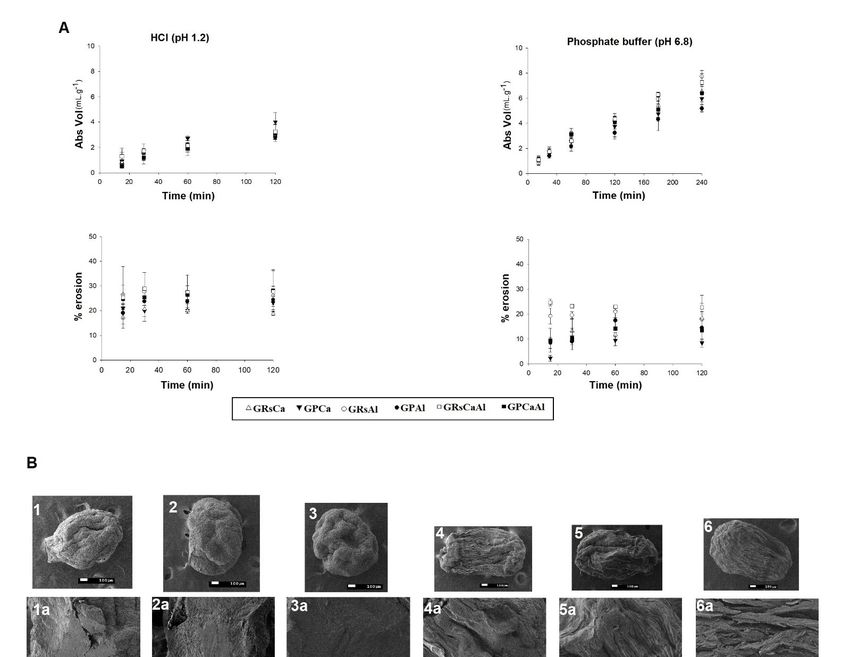
Pharmaceutics 2021, 13, 407                                                                                           4 of 17

                              carbon tape and coated with a conductive material (carbon). Photomicrographs were
                              recorded at different magnifications to enable internal and external structures visualization.

                              Liquid Uptake and Erosion of PMs
                                   The liquid uptake profiles were determined using an Enslin device according to an
                              adapted methodology [18]. The liquid uptake was measured at predetermined time inter-
                              vals by applying different mediums, HCl 0.1 N (pH 1.2) and phosphate buffer (pH 6.8),
                              which were considered biorelevant for GIT, simulating the gastric and intestinal environ-
                              ments, respectively. In pH 1.2, the assay was conducted for 120 min and, in pH 6.8, for
                              240 min. The liquid uptake ability of PMs was calculated according to Equation (2).

                                                                         Vol abs (mL)
                                                                  Lu =                                                   (2)
                                                                         m PMs ( g)

                                  Lu represents the media absorbed per mass of PMs, V is the volume absorbed (mL),
                              and m is the initial mass of PMs (g).

                              Erosion Percentage of PMs
                                   PMs erosion was evaluated with the same mediums used when analyzing liquid
                              uptake, simulating the pH value of biological fluids. A known mass of particles was
                              placed on the mesh of an acrylic support. Thereafter, the system was immersed in HCl
                              0.1 N (pH 1.2) or phosphate buffer (pH 6.8) for 120 min. At pre-established time intervals,
                              particles were removed and dried until reaching constant weight.
                                   After drying, the PMs were weighed, and the erosion percentage was calculated
                              according to Equation (3).
                                                                    ( Mi − M f s)
                                                             %E =                 × 100                              (3)
                                                                        Mfs
                              where %E = percentage of erosion, Mi = initial PMs mass, and Mfs = PMs mass after drying.
                                  In order to observe the structure of the particle matrix after the erosion test, samples
                              were frozen (−80 ◦ C), lyophilized for 24 h (Micromodule 115, Thermo Scientific), and
                              analyzed using SEM-FEG.

                              Evaluation of PMs Enzymatic Degradation in Simulated Gastric and Enteric Media
                                   The evaluation of enzymatic degradation was assessed by gravimetry and image
                              analysis. The assay was carried out in Hanson Research dissolution equipment (ST8 Plus)
                              equipped with apparatus I (basket), under 60 rpm agitation at 37 ◦ C ± 0.2, using fluids
                              that simulate the pH and enzymatic content found along the GIT [19]. A mass of particles
                              was incubated for two hours in a NaCl 0.9% solution, acidified with HCl 0.1N (pH 1.2)
                              containing the pepsin enzyme (0.3 mg.mL−1 ), while the other mass of particles was in-
                              cubated for four hours in phosphate buffer (pH 6.8) containing the pancreatin enzyme
                              (3.2 mg.mL−1 ) [5,20].
                                   For gravimetric analysis, after the incubation period, samples were carefully removed
                              from the baskets and dried at room temperature until exhibiting constant weight.
                                   For image acquisition, samples were frozen (−80 ◦ C), lyophilized for 24 h (Micromod-
                              ule 115, Thermo Scientific, Waltham, MA, USA), and analyzed using SEM-FEG.

                              2.2.3. Microparticle mucoadhesiveness
                              PMs Mucoadhesiveness by Porcine Mucosa Assay
                                  Porcine intestinal mucosa was obtained from the local slaughterhouse and the ex vivo
                              mucoadhesion was evaluated on a Texture Universal Analyzer TA.XT plus® 189 (Stable
                              Micro 190 Systems, Godalming, UK) in “compression” mode [6]. The porcine tissue was
                              kept at room temperature and incubated in saline at 37 ◦ C to ensure the integrity of the
                              mucous layer. Then, sections of the mucosa were placed on the acrylic support of the
                              equipment, and the PMs were carefully fixed to a cylindrical probe (10 mm in diameter)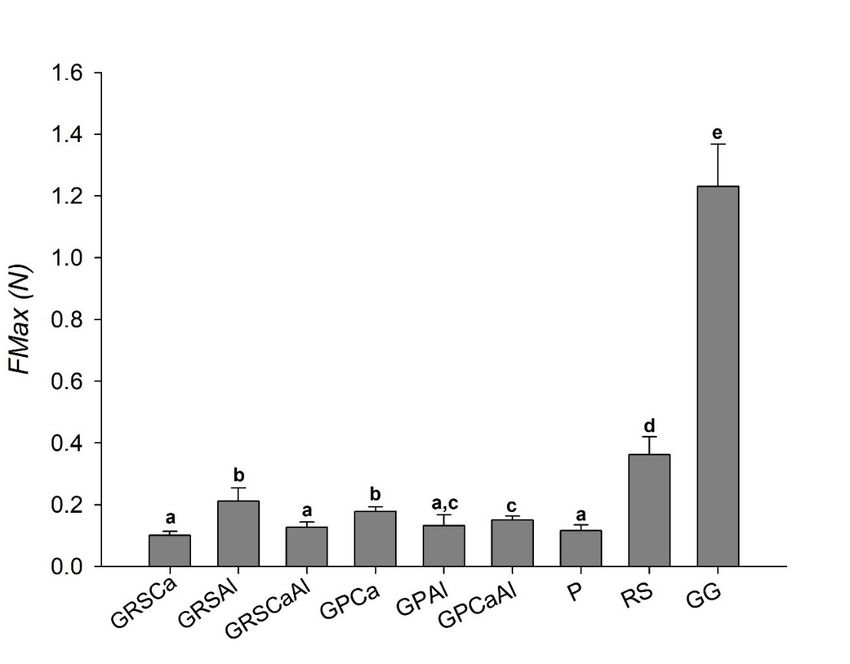
Pharmaceutics 2021, 13, 407                                                                                          5 of 17

                              using double-sided tape (3M Scotch® ) to provide the formation of a particle monolayer. The
                              analytical probe containing the PMs was moved perpendicularly to the mucosa (5 mm.s−1 )
                              and introduced in the porcine intestinal mucosa (0.3 mm), remaining there during a contact
                              time of 120 s, then, moved upward at a speed of 20 mm·min−1 . The maximum detachment
                              force (N) was calculated through the force vs time plots provided by the Software Texture
                              Exponent Lite. The test was performed in triplicate (n = 3) and the results expressed as the
                              mean and standard deviation.

                              In Vitro Mucin Adsorption
                                   The in vitro mucoadhesiveness evaluation of the PMs was performed according to
                              previously described methodology [18,21]. A mass of particles (20 mg) was kept in contact
                              with mucin aqueous solutions (Mucin type II, Sigma-Aldrich® ) at pH 1.2 and 6.8 at different
                              concentrations (50, 100, 150, and 200 µg.mL−1 ) and 37 ◦ C, for one hour of incubation. Sam-
                              ples were centrifuged for five minutes at 3600 rpm and the free mucin at the supernatant
                              was quantified in a spectrometer (Cary 60 UV-Vis) at 749 nm, using the Lowry colorimetric
                              assay (Total Protein Kit, Micro Lowry, Peterson’s Modification, Sigma-Aldrich® ). One
                              milliliter of the Lowry reagent solution was added to 1 mL of the supernatant and kept at
                              room temperature for 20 min. Then, 0.5 mL of the Folin-Ciocalteu’s Phenol reagent was
                              added and kept for 30 min reaction time protected from light. A blank was obtained using
                              purified water. Tests were performed in triplicate for each mucin concentration and pH
                              value. Absorbance was measured and free mucin concentration was calculated applying
                              an analytical curve previously obtained with albumin y = 0.0085x + 0.0741 (R2 = 0.9972).
                              The concentration of mucin adsorbed on the PMs was determined indirectly following
                              Equation (4).
                                                      Q mucin adsorbed = Q mucin added − Q free mucin                   (4)

                              Mucin Adsorption Curves
                                   In order to investigate the mechanisms involved in the mucin adsorption process that
                              occurs on the PMs surface, adsorption data was plotted associating free mucin concentra-
                              tion in the supernatant (mg.L−1 ) vs mass adsorbed to the microparticles (mg.g−1 ). Based
                              on those adsorption curves, linearized models of Freundlich (Equation (5)) and Langmuir
                              (Equation (6)) were applied.

                                                                               1
                                                            Log Qe = logk +      × Log Ce                               (5)
                                                                               n
                                                               Ce     1       Ce
                                                                  =        +                                            (6)
                                                               Qe   Qmax b   Q max
                              where Qe = mass of mucin adsorbed by PMs mass; Ce = concentration of free mucin in the
                              supernatant; K = Freundlich constant, which represents the material’s adsorption capacity;
                              and n = constant of the adsorption intensity. Qmáx and b are Langmuir equation parameters,
                              where Qmáx = constant of the monolayer maximum adsorption capacity and b = adsorption
                              equilibrium constant related to the adsorption energy [22,23].
                                   The Freundlich model was applied by plotting the graph of log Qe (mg.g−1 ) vs. log
                              Ce (mg.L−1 ), and for the Langmuir model, the graph Ce/Qe (g.L−1 ) vs Ce (mg.L−1 ) was
                              plotted. Linear regression was then applied to the acquired graphs for the acquisition of
                              constant values. Best correlation to data was chosen based on the highest values of the
                              coefficient of determination (R2 ).

                              3. Results and Discussion
                              3.1. Development of Polymeric Microparticles (PMs)
                                   Microparticles based on GG:P and GG:RS blends were prepared by ionotropic gelation,
                              using Al3+ , Ca2+ or both as cross-linkers. Our aim was to investigate the effect of these
                              different cross-linkers on the properties of the microparticles and on the modulation of
                              their functional properties when used as oral drug delivery systems.
Pharmaceutics 2021, 13, 407 6 of 17
Samples were named according to polymer blend, concentration, and cross-linker as
shown in Table 1.
Table 1. Microparticle nomenclature and composition.
Mass Ratio of GG:P Mass Ratio between GG:RS
Sample Cross-linker (%)
(w/w) (w/w)
GRsCa - 1:2.5 Ca2+ (3%)
GRsAl - 1:2.5 Al3+ (3%)
GRsCaAl - 1:2.5 Ca2+ e Al3+ (3%)
GPCa 1:1 - Ca2+ (3%)
GPAl 1:1 - Al3+ (3%)
GPCaAl 1:1 - Ca e Al3+ (3%)
2+
For the PMs based on GG:P, the polymeric concentration of 2% (w/v) was selected,
as was done in a previous study conducted by Prezotti and co-authors (2018) [21]. For
GG:RS-based particles, the development followed the conditions proposed by De Oliveira
(2020) [24]. The concentration of cross-linking agents was selected based on these previous
works, and preliminary tests were carried out in this present study.
Effect of Ionic Cross-Linkers on the Size and Morphology of PMs
Diameter control and particle size distribution are crucial because changes in volume
and, consequently, on the surface area can directly affect the ability of drug or nanocarrier
entrapment, resulting in potential dose variations, in addition to affecting the reproducibil-
ity of the events involved in the release process [25]. The diameters of microparticles based
on GG:P and GG:RS ranged from 888 to 961 µm and from 1607 to 1764 µm, respectively,
while circularity varied from 0.77 to 0.82 and from 0.76 to 0.78, respectively (Table 2).
Table 2. Microparticle average diameter, circularity, and SPAN index (n = 100).
Sample Average Diameter (µm) ± SD Circularity ± SD SPAN
GRsCa 1607 ± 177 0.76 ± 0.07 0.29
GRsAl 1793 ± 158 0.78 ± 0.09 0.30
GRsCaAl 1760 ± 174 0.78 ± 0.09 0.28
GPCa 961 ± 97 0.77 ± 0.07 0.27
GPAl 889 ± 110 0.82 ± 0.05 0.41
GPCaAl 888 ± 99 0.81 ± 0.08 0.30
According to Table 2, it is possible to observe that the cross-linkers significantly
affected particle diameter (p < 0.05) in a different manner for each polymer blend. Ionic
cross-linking of Ca2+ to GG:P resulted in bigger particles, while cross-linking with the
same agent to GG:RS dispersions resulted in smaller particles. The double cross-linking
process did not significantly affect the size of the particles and obtained comparable results
to single cross-linking with aluminum.
Carboxylic groups of GG and P ionize in aqueous dispersions (pH ~6.0) as long as
the dispersion pH remains higher than the pKa values (pKa ≈ 3.5). This fact grants high
density of negative charge (~ −40 mV) to this blend. Thus, the repulsive electrostatic forces
between them should provide looser and expanded polymer networks. When in contact
with Ca2+ and/or Al3+ cations, extensive electrostatic interactions with the polymers’
negatively-charged functional groups are expected, which brings the chains closer and
also favors other supramolecular interactions, such as hydrogen bonds and Van der Walls
forces. Consequently, GG:P microparticles become characterized by a packed and stable
three-dimensional network. Aluminum is a trivalent ion and has an extra positive charge in
relation to the divalent calcium ion. Each Al3+ is able to bind to three carboxylate residues
of GG and P, promoting an additional cross-linking point in relation to Ca2+ . This behavior
probably results in the formation of a more intensely cross-linked and packed structure,
characterized by a smaller diameter [26], compared to particles cross-linked with Ca2+ ,
which favors a more expanded network (Table 2).Pharmaceutics 2021, 13, 407 7 of 17
RS is a polysaccharide with high molecular weight (1803 kDa) and, when compared to
GG and P, in aqueous medium, it has low negative charge density (~−3mV), which makes
it prone to forming weaker electrostatic interactions with the cations [27]. During GG:RS
microparticle formation, it is probable that the ionic interactions between the carboxylates,
from glucuronic acid molecules of GG, and Ca2+ and/or Al3+ are stronger than the ionic
interactions formed with RS. Thus, the association of RS long and bulky chains should
prevail by physical interpenetration throughout the interstitial spaces of the GG network.
In such conditions, a more disordered and volumous structure should be built [28,29],
originating larger particles than those obtained with GG:P (Table 2).
GG:RS dispersion cross-linked with calcium resulted in smaller particles (Table 2).
Considering that a lower level of polymeric network cross-linking with the Ca2+ ions is
expected, a more mobile and adaptable structure should be formed, favoring the inter-
penetration of RS chains and the subsequent structural rearrangements, which contribute
to the formation of compact and smaller particles. On the other hand, cross-linking with
Al3 + resulted in a more rigid structure, especially in the outermost layer of the particle,
which made the interpenetration of the RS chains more difficult, forming a more disordered
and bulky structure (Table 2). Similar behavior occurred with the double cross-linking,
indicating that the additional cross-linking does not affect the particle size (Table 2).
Particle size homogeneity can be quantitatively assessed by calculating the SPAN
index. The lower the SPAN index value, the narrower the particle size distribution [30].
According to Table 2, all particles showed SPAN index below 0.5, highlighting size homo-
geneity of the obtained PMs.
The SEM photomicrographs exhibited nearly spherical PMs (Figure 1). Circularity
Pharmaceutics 2021, 13, x FOR PEER REVIEW analysis consists of a shape factor for which the values close to 1.0 represent
degree a
8 of 19
perfect circle. Herein, the nearly circular shapes of the obtained PMs was evidenced with
values between 0.76 and 0.82 (Table 2).
Figure 1.
Figure 1. Photomicrographs
Photomicrographs of the polymeric microparticles (PMs) surface (A: GRSCa at 40×, 40×,A1:
A1:150×,
150×and A2:
, and A2:1500×;
1500×B:;
GRSAl at 40×, B1: 150×, and B2: 1500×; C: GRSCaAl at 40×, C1: 150×, and C2: 1500×; D: GPCa in 40×, D1:
B: GRSAl at 40×, B1: 150×, and B2: 1500×; C: GRSCaAl at 40×, C1: 150×, and C2: 1500×; D: GPCa in 40×, D1: 150×, and 150×, and D2:
1500×;
D2: E:×GPAl
1500 in 40×,
; E: GPAl E1:×150×,
in 40 and×E2:
, E1: 150 1500×;
, and and×
E2: 1500 F:; GPCaAl in 40×, in
and F: GPCaAl F1:40150×, and
×, F1: 150F2:
×, 1500×).
and F2: 1500×).
Microparticles
Particles basedGRSCa
on GG:P and GRSAl apresented
showed an irregular
more cohesive andand
structure rough surface surface
smoother (Figure
1A), while the surface of GRSCaAl was more homogeneous and cohesive.
compared to their GG:RS counterparts (Figure 1). At the largest magnification (10,000×),
Internal of
the presence images
cracksatand
10,000× exhibited
fissures in the the presence
internal of large
structure waspores (Figure
evident 2D–F)
for GPAl in
and
GRSCa, GRSAl,
GPCaAl (Figure 1and
(E3GRSCaAl.
and F3). ItApparently, theduring
is possible that doublethe
cross-linking contributed
drying process, to the
the retraction
formation
of this moreofcross-linked
a more cohesive matrix
and rigid without network
polymeric the presence of these
caused large pores
irregularities andstructure,
in the internal
channels in
resulting (Figure 2F).points.
rupture Rupture points, large pores, and internal channels can favor the dif-
fusion of liquids into
Microparticles the matrix
GRSCa and can,
and GRSAl consequently,
presented accelerate
an irregular and roughthesurface
release(Figure
of drugs or
1A),
nano-systems.
while the surface of GRSCaAl was more homogeneous and cohesive.Figure 1. Photomicrographs of the polymeric microparticles (PMs) surface (A: GRSCa at 40×, A1: 150×, and A2: 1500×; B:
GRSAl at 40×, B1: 150×, and B2: 1500×; C: GRSCaAl at 40×, C1: 150×, and C2: 1500×; D: GPCa in 40×, D1: 150×, and D2:
1500×; E: GPAl in 40×, E1: 150×, and E2: 1500×; and F: GPCaAl in 40×, F1: 150×, and F2: 1500×).
Pharmaceutics 2021, 13, 407 Microparticles GRSCa and GRSAl presented an irregular and rough surface (Figure 8 of 17
1A), while the surface of GRSCaAl was more homogeneous and cohesive.
Internal images at 10,000× exhibited the presence of large pores (Figure 2D–F) in
GRSCa, GRSAl, and GRSCaAl. Apparently, the double cross-linking contributed to the
Internal images at 10,000× exhibited the presence of large pores (Figure 2D–F) in
formation of a more cohesive matrix without the presence of these large pores and internal
GRSCa, GRSAl, and GRSCaAl. Apparently, the double cross-linking contributed to the
channels (Figure 2F). Rupture points, large pores, and internal channels can favor the dif-
formation of a more cohesive matrix without the presence of these large pores and internal
fusion of liquids into the matrix and can, consequently, accelerate the release of drugs or
channels (Figure 2F). Rupture points, large pores, and internal channels can favor the
nano-systems.
diffusion of liquids into the matrix and can, consequently, accelerate the release of drugs
or nano-systems.
Figure2.2.Photomicrographs
Figure Photomicrographsshowing
showingthe
theinternal
internalstructure
structureofofthe
thePMs
PMs(A3:
(A3:GRSCa
GRSCa150 ×, and
150×, A4: 1500
and A4: ×;B3:
1500×; 150×,
GRSAl150×,
B3:GRSAl
and
andB4:1500 ×; C3:
B4:1500×; C3: GRSCaAl
GRSCaAl150 ×, and C4:1500
150×, ×; D3:
C4:1500×; D3: GPCa 150×,and
GPCa 150×, D4:1500×E3:
andD4:1500×; ; E3:GPAl 150×and
GPAl150×, , andE4: 1500×and
E4:1500×; ; andF3:
F3:
GPCaAl150
GPCaAl ×, and F4: 1500×).
150×, 1500×).
3.2. Effect of Ionic cross-linkers on Liquid Uptake and Erosion of PMs in Simulated Gastric and
Enteric Media
The liquid uptake ability of PMs was evaluated in media that simulate stomach and
intestinal pH values (1.2 and 6.8, respectively).
The profiles of absorbed liquid (mL) vs mass of PMs (g) were presented in Figure 3.
The amount of liquid uptake is directly related to the hydrophilicity of the polymeric
blend used in the matrix and to its cross-linking degree. The former not only affects the
hydrophilicity but also impacts packing and arrangement of the polymer matrix [23,24,31].
In the acid medium (pH 1.2), differences in absorption rates were observed, which
may have been influenced by the particle composition and by the cross-linker. Micropar-
ticles composed by GG:RS absorbed similar volumes of acid medium at the end of the
test; however, the absorption rate varied between samples. Fifteen minutes into the test,
GRSCa absorbed 0.73 mL.g−1 , while GRSAl and GRSCaAl absorbed a volume almost two
times greater (~ 1.35 mL.g−1 ). In 30 min, GRSCa absorbed 1.31 mL.g−1 , while GRSAl
and GRSCaAl absorbed 1.62 and 1.73 mL.g−1 , respectively. After 60 min, the difference
observed was maintained, with the samples of GRSCa, GRSAl, and GRSCaAl absorbing
1.85, 2.15, and 2.17 mL.g−1 , respectively. After 120 min, samples had absorbed the same
final volume (Figure 3).Pharmaceutics2021,
Pharmaceutics 2021,13,
13,407
x FOR PEER REVIEW 10 9ofof1917
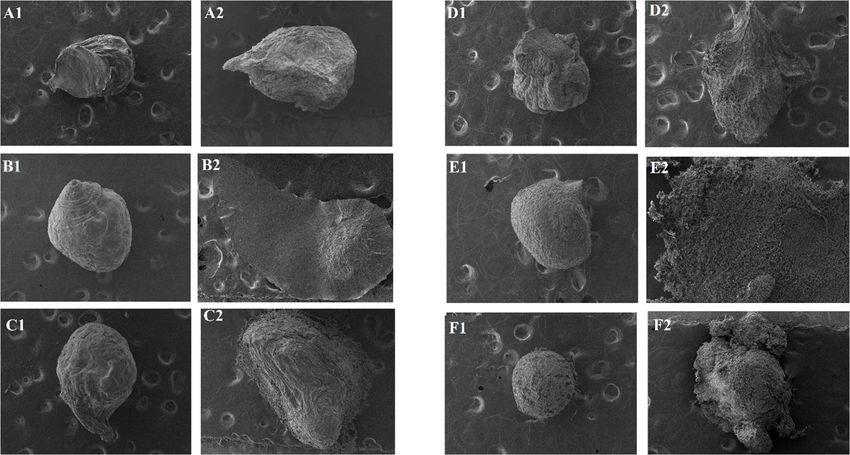
Figure 3. A- Samples profiles of liquid uptake and erosion; B-Photomicrographs of PMs after incubation (120 min) in HCl
Figure
(pH 1.2);3.C-A-Photomicrographs
Samples profiles ofofliquid uptake
PMs after and erosion;
incubation (120B-Photomicrographs of PMs
min) in phosphate buffer (pHafter incubation
6.8). (1: GRSCa(120
40×min)
; 1a:in HCl
GRSCa
(pH
150 ×,1.2); C- Photomicrographs
2: GRSAl 40×; 2a: GRSAl 150 of PMs
×, 3:after incubation
GRSCaAl 40×; (120 min) in phosphate
3a: GRSCaAl buffer40(pH
150×, 4: GPCa 6.8).
×; 4a: (1: GRSCa
GPCa 150×, 40×; 1a: GRSCa
5: GPAl 40×; 5a:
150× 150
GPAl , 2: ×
GRSAl 40 ×; 2a:40GRSAl
. 6: GPCaAl ×; 6a: 150× , 3: GRSCaAl
GPCaAl 150×). 40× ; 3a: GRSCaAl 150× , 4: GPCa 40× ; 4a: GPCa 150× , 5: GPAl 40× ; 5a:
GPAl 150× . 6: GPCaAl 40× ; 6a: GPCaAl 150×).
The same behavior was observed for particles composed by GG:P. After 15 min of
testing, the GPCa particle had absorbed 0.95 mL.g−1 of the medium, value higher than that
observed for GPAl and GPCaAL, which absorbed 0.75 and 0.54 mL.g−1 , respectively. AtPharmaceutics 2021, 13, 407 10 of 17
30 min, the volumes absorbed by the samples were similar (~ 1.5 mL.g−1 ) but differentiat-
ing again at 60 min with GPCa, GPAl, and GPCaAl absorbing 2.75, 2.16, and 1.93 mL.g−1 ,
respectively. At the end of the test, the significant difference remained with the highest
volume of acid medium being absorbed by GPCa (4.01 mL.g−1 ) (Figure 3).
When analyzing the influence of the cross-linker in each polymer blend, we observed
that GG:RS formed a packaged matrix with no visible pores and cracks when calcium was
used as the cross-linker. This made the acid medium diffusion difficult, resulting in the
lowest absorption rate among all PMs. GG:RS particles, formed by double cross-linking,
presented similar behavior to those cross-linked only with Al3+ , which may indicate that
the organization of the polymeric net, initially cross-linked with Ca2+ , did not undergo
significant changes after contact with the second cation. Another possibility is that the
changes in the structure occurred more in the outer region of the particle.
In contrast, cross-linking GG:P with Ca2+ promoted a lower number of ionic bonds
between the carboxylates of the GG and P chains, forming a matrix with a lower degree
of cross-linking and consequently greater hydrophilia. This PMs was also composed by a
network with greater mobility, capable of accelerating the diffusion of the medium and
more easily accommodate a large volume of liquid in its structure.
In acid medium, GG:P particles exhibited a higher percentage of erosion, with values
ranging from 20.1 to 26.4% (Figure 3). In this case, the cross-linker used did not have a
significant impact on results. At this pH, the polymer network probably remained more
packed because of the protonation of carboxylic groups of polymers. Thus, the volume of
medium that was diffused into the matrix was capable of exerting sufficient hydrostatic
pressure to disrupt the rigid polymeric structure, causing ruptures that resulted in the
accelerated erosion of the system [21].
The photomicrographs (Figure 3) revealed that, although the particles maintained a
spherical shape, they exhibited a certain degree of superficial erosion, characterized by
decreased size and superficial heterogeneity with roughness and fissures.
The image of the transversal sections of these particles allows us also to observe that
the internal structure was compact and homogeneous, indicating that the excess of H+ ions
from the acidic media enabled the protonation of free carboxylic groups of the polymeric
structure, reducing the repulsion of the polymer chains. Thus, the interactions by hydrogen
bonds and dipole-induced interactions are favored and a more cohesive structure is built,
which can hamper the diffusion of the medium into the matrix, resulting in erosion mostly
of the superficial layer of the particles.
In phosphate buffer (pH 6.8) for up to 60 min, the observed profiles were similar to
those obtained in an acid medium. After 120 min, buffer absorption became higher than
in acid medium for all samples (up to 1.4 times). From 120 to 180 and to 240 min, an
increasing uptake of phosphate buffer was observed, reaching values ranging from 5.17 to
7.71 mL.g−1 (Figure 3).
Particles GRSAl and GRSCaAl absorbed the highest volumes of phosphate buffer, 7.72
and 7.27 mL.g−1 , respectively, after 240 min. In contrast, GRSCa, GPCa, GPAl, and GPCaAl
all absorbed similar volumes (Figure 3). This was probably due to the less extensive
cross-linking of GG with Ca2+ . The RS chains were able to interpenetrate more efficiently
throughout the polymer meshes, accommodating its chains in a more packed way. This
structural arrangement probably hindered the expansion of the matrix by electrostatic
repulsion and the diffusion of liquids into the structure, resulting in lower liquid uptake.
Considering that liquid absorption represents the first stage of the drug or nanocarriers
release process, the higher absorption of phosphate buffer (pH 6.8) should increase the
relaxation and mobility of the polymer chains, which can favor the diffusion of the drug or
nanocarriers from the particle into the intestinal environment.
In pH 6.8, erosion was lower than in acidic pH, with the exception of sample GRSCaAl,
which presented a similar percentage of erosion in both mediums, 18.7% and 20.1%,
respectively (Figure 3). At pH values higher than the polymer pKa, free carboxylic acid
groups were ionized, which resulted in the electrostatic repulsion of the chains and in aPharmaceutics 2021, 13, 407 11 of 17
more dilated and mobile structure [4]. With the expansion of the polymer meshes, the
matrix was able to accommodate a greater number of water molecules, suffering less
erosion, but exhibiting a higher degree of swelling [21]. This behavior was corroborated
by the photomicrographs (Figure 3), in which the tendency to maintain the shape of the
particles was observed, but with a significant enlargement of the particle, indicating the
swelling process. The internal structure of PMs at pH 6.8 demonstrated the formation of
a greater number of channels and pores, resulting in a laminated and dilated structure,
which favors the release of drugs or nanocarriers.
3.3. Effect of Ionic Cross-Linkers on Enzymatic Degradation of Mps in Simulated Gastric and
Enteric Media
The enzymatic degradation (%) of PMs are shown in Table 3. Microparticle degrada-
tion in simulated gastric media (containing pepsin, pH 1.2) ranged from 18.2 to 61.3% and,
in simulated enteric media (containing pancreatin, pH 6.8), from 15.1 to 95.3%.
Table 3. Enzymatic degradation of the GG:P (GP) and GG:RS (GRS) microparticles cross-linked with
Ca2+ (Ca), Al3+ (Al), or Ca2+ and Al3+ (CaAl).
HCl+NaCl (pH 1.2) Phosphate Buffer (pH 6.8)
Sample with Pepsin with Pancreatin
Degradation (%) ± SD
GRSCa 18.2 ± 0.6 15.1 ± 9.2
GRSAl 32.0 ± 0.8 53.7 ± 7.5
GRSCaAl 40.6 ± 2.1 52.9 ± 3.8
GPCa 61.3 ± 0.7 65.7 ± 1.8
GPAl 35.8 ± 2.8 95.3± 3.7
GPCaAl 32.1 ± 0.1 75.2 ± 1.5
Digestive enzymes are produced and secreted by the mouth, stomach, pancreas, vesi-
cle, and intestines and help in the digestion process so that, the constituents of substances
consumed become bioavailable. Pepsin originates in the stomach and its activation occurs
through the presence of HCl. Pancreatin, on the other hand, is composed of a set of en-
zymes, such as amylase, trypsin, lipase, and pancrease, which have the ability to digest
proteins, polypeptides, and starch [31].
According to Table 3, GG:RS microparticles cross-linked with calcium enabled an
expressive reduction of enzymatic degradation in both media, behavior that probably
willresult in an extended release profile. As previously described, the cross-linking of this
blend with calcium promoted the formation of a compact network, improving its resistance
against the enzyme access and degradation. It was also observed that GG:RS microparticles
were more resistant than GG:P micoparticles, probably due to the retrogradation of starch,
which reduced the access of enzymes to the polymer matrix.
In acidic media, calcium cross-linking significantly increased the enzymatic degrada-
tion of GG:P microparticles, which contrasts GG:RS. This is in agreement with our findings
about the formation of a more flexible and mobile network, which favors enzyme assess-
ment, while Al3+ and double cross-linking form a more rigid and voluminous structure.
In simulated enteric media, GPAl was the sample that suffered the greatest degree
of degradation, followed by the GPCaAl, with 95.3% and 75.2%, respectively. This is an
interesting behavior if a burst release in the intestine is desired. The GG:P matrix granted
easier access to enzymes, since at pH 6.8 there was an expansion of the polymeric net
formed by GG:P (pKa ~ 3.0), resulting in the high rates of matrix swelling and enzyme
diffusion to the interior of the microparticle.
Afterwards, samples were collected and analyzed by microscopy (Figure 4).Pharmaceutics 2021, 13, x FOR PEER REVIEW 13 of 19
Pharmaceutics 2021, 13, 407 formed by GG:P (pKa ~ 3.0), resulting in the high rates of matrix swelling and enzyme
12 of 17
diffusion to the interior of the microparticle.
Afterwards, samples were collected and analyzed by microscopy (Figure 4).
Figure 4. Photomicrographs of microparticles after enzyme degradation assay (40×)- A: GRSCa; B: GRSAl; C: GRSCaAl;
Figure 4. Photomicrographs of microparticles after enzyme degradation assay (40×)- A: GRSCa; B: GRSAl; C: GRSCaAl; D:
D: GPCa; E: GPAl, and F: GPCaAl, 1: gastric medium and 2: enteric medium).
GPCa; E: GPAl, and F: GPCaAl, 1: gastric medium and 2: enteric medium).
It
It is
is possible
possible to
to observe
observe that
that in
in the
the simulated
simulated gastric
gastric medium,
medium, most
most samples
samples exhibited
exhibited
preserved structures, maintaining their nearly spherical shape. In
preserved structures, maintaining their nearly spherical shape. In the simulated the simulated enteric
enteric
medium,
medium, however,
however, structures exhibited deformations
structures exhibited deformations or even disintegration,
or even disintegration, especially
especially
microparticles: GRSAl, GRSCaAl, GPAl,
microparticles: GRSAl, GRSCaAl, GPAl, and GPCaAl. and GPCaAl.
In
In comparison
comparison with with the
the previous
previous test
test (item
(item 3.2),
3.2), the
the addition
addition of
of enzymes
enzymes significantly
significantly
affected the structural integrity of the microparticles, mainly in the
affected the structural integrity of the microparticles, mainly in the conditionsconditions that
that simu-
simulate
late the enteric medium, revealing their pH/enzymatic sensitivity
the enteric medium, revealing their pH/enzymatic sensitivity behaviors. behaviors.
3.4. Effect
Effect of
of Ionic
Ionic Cross-linking
Cross-linking on Mucoadhesiveness
3.4.1. PMs Mucoadhesiveness
3.4.1. PMs Mucoadhesiveness by by the
the Porcine
Porcine Mucosa
Mucosa Assay
Assay
This experiment
This experiment used
used intestinal
intestinal porcine
porcine tissue
tissue as
as the
the biological
biological substrate
substrate that
that mim-
mim-
icked the physiological conditions to which the system would be exposed.
icked the physiological conditions to which the system would be exposed. Maximum mu- Maximum
mucoadhesion
coadhesion force
force (FMax),
(FMax), also
also known
known asaspotential
potentialmucoadhesiveness,
mucoadhesiveness,was was evaluated
evaluated by by
measuring the strength required to detach microparticles from
measuring the strength required to detach microparticles from the substrate. the substrate.
The average
The FMax of
average FMax of raw
raw RSRS and
and GG
GG polymers
polymers were
were 0.36
0.36 NNand
and1.23
1.23N,
N,respectively,
respectively,
values higher than that of P (0.12 N, Figure
values higher than that of P (0.12 N, Figure 5). 5).
GG is
GG is aa hydrophilic
hydrophilic polymer
polymerthat thatcontains
containsseveral
severalcarboxylic
carboxylic and
andhydroxyl
hydroxylgroups
groupsin its
in
chain. These groups can interact with the glycoproteins present in the mucus via
its chain. These groups can interact with the glycoproteins present in the mucus via su- supramolecular
interactions, such
pramolecular as hydrogen
interactions, bonds,
such which formbonds,
as hydrogen extensive interactions
which of considerable
form extensive strength
interactions of
and, consequently, increase the force needed for tissue detachment [11,12].
considerable strength and, consequently, increase the force needed for tissue detachment
RS presented higher FMax than P, and according to diffusion theory, this is probably
[11,12].
due to its extensive and flexible chains, which allow greater surface contact with the
mucosa, favoring the interpenetration of the mucus layer [13,16].Pharmaceutics 2021, 13, x FOR PEER REVIEW 14 of 19
Pharmaceutics 2021, 13, 407 13 of 17
Figure 5. Maximum mucoadhesion force (FMax) of microparticles: pectin (P), retrograded starch
Figure 5. Maximum mucoadhesion force (FMax) of microparticles: pectin (P), retrograded starch (RS), and gellan gum
(RS), and gellan gum (GG).
(GG).
The P used in this study was of low molecular weight and low degree of esterification
RS presented higher FMax than P, and according to diffusion theory, this is probably
(DE < 50%). Other studies have reported that low DE pectin has the capacity of penetrating
due to its extensive and flexible chains, which allow greater surface contact with the mu-
deeply into the intestinal mucus layer, but is unable to adhere strongly to the surface [32,33].
cosa,low
The favoring
molecularthe interpenetration
weight of P probably of theprovides
mucus layer [13,16]. and diffusion in the mucus
less folding
layer,The P usedininlower
resulting this study
FMaxwas of low
(Figure 5).molecular weight and low degree of esterification
(DEMucin adsorption curves were used to comprehend the mechanisms that drive the
mucoadhesion of these microparticles.
Figure 6 shows the graph of absorbed mucin (mass) and percentage of mucin ad-
Pharmaceutics 2021, 13, 407 14 of 17
sorbed in the PMs, according to mucin concentration in the aqueous solutions at pH 1.2
and 6.8. The adsorption percentages on microparticle surfaces varied from 84% to 97% in
the highest concentration of mucin at both pH values. In both media, the mucin adsorp-
increased as theas
tion increased concentration of available
the concentration mucinmucin
of available increased, whilewhile
increased, the polymer blendblend
the polymer did
not
didsignificantly influence
not significantly the amount
influence of adsorbed
the amount mucinmucin
of adsorbed (Figure 6). 6).
(Figure
Figure 6. Amount of mucin adsorbed by the microparticles as a function of the amount of mucin added to the solutions
(represented by xthe
Pharmaceutics 2021, 13, FORbars)
PEERand percentage of adsorbed mucin (represented by the dots).
REVIEW 16 of 19
Figure 6. Amount of mucin adsorbed by the microparticles as a function of the amount of mucin added to the solutions
(represented by the bars) and percentage
From theofmucin
adsorbed mucin (represented
adsorption bythat
data, curves the dots).
represent the interaction between mucin
and the particle surfaces were plotted (Figure 7). In these curves, the mass of mucin
From
adsorbed bythe mucin adsorption
microparticle data,mg.g
mass (Qe, curves
−1 )that
wasrepresent the
associated tointeraction betweenofmucin
the concentration free
and the
mucin in particle surfaces(Ce,
the supernatant weremg.L
plotted
− 1 ). (Figure 7). In these curves, the mass of mucin ad-
sorbed by microparticle mass (Qe, mg.g−1) was associated to the concentration of free mu-
cin in the supernatant (Ce, mg.L−1).
The profiles indicate favorable interaction, in which the amount of adsorbed mucin
increases as the concentration of mucin in the medium increases. Despite the small differ-
ence in the results of adsorbed mucin mass, the greater slope exhibited by the mucin ad-
sorption curves at pH 1.2 suggests the greater adsorption ability of microparticles in this
medium.
Figure 7. Mucin adsorption curves of microparticles in mediums of pH 1.2 and 6.8.
Figure 7. Mucin
Theadsorption curves offavorable
profiles indicate microparticles in mediums
interaction, of pHthe
in which 1.2amount
and 6.8. of adsorbed mucin in-
creases as the concentration of mucin in the medium increases. Despite the small difference
in theFigure
results7ofshows the differences
adsorbed mucin mass,between
the greateradsorption curve profiles
slope exhibited according
by the mucin to pH
adsorption
variation. According to the classification of Giles et al. [23], the GPCa curve,
curves at pH 1.2 suggests the greater adsorption ability of microparticles in this medium. at both pH
values, belongs
Figure to the
7 shows the“L” class, which
differences betweenindicates that the
adsorption availability
curve profilesof active sites
according to pHfor
adsorptionAccording
variation. on the particle
to thesurface decreases
classification as theet
of Giles concentration of mucin
al. [23], the GPCa in the
curve, medium
at both pH
increases.
values, In thistocurve,
belongs the class,
the “L” inflection
whichpoint characterizes
indicates that thethe saturationof
availability ofactive
the interaction
sites for
sites on the particle surface. However, at higher concentrations, the
adsorption on the particle surface decreases as the concentration of mucin in the mediumadsorption process
continues, with the mucin binding to sites that are energetically different from
increases. In this curve, the inflection point characterizes the saturation of the interaction those ini-
tiallyon
sites saturated [34].surface.
the particle The same “L” class
However, was fitted
at higher with the mucin
concentrations, adsorption process
the adsorption data of
GRSCa at with
continues, pH 6.8, however,
the mucin at the
binding concentrations
to sites evaluated,different
that are energetically the curve
fromdid not initially
those show a
plateau that would indicate a limit on the adsorption capacity.
At pH 1.2, the GRSCa adsorption curve belongs to the “S” class, with an upward
curvature, since particle-mucin interactions were probably weaker than the mucin–mucin
interactions [23].Pharmaceutics 2021, 13, 407 15 of 17
saturated [34]. The same “L” class was fitted with the mucin adsorption data of GRSCa at
pH 6.8, however, at the concentrations evaluated, the curve did not show a plateau that
would indicate a limit on the adsorption capacity.
At pH 1.2, the GRSCa adsorption curve belongs to the “S” class, with an upward
curvature, since particle-mucin interactions were probably weaker than the mucin–mucin
interactions [23].
From the values of R2 obtained through linear regression, it was observed that the
adsorption data shows better correlation with the Freundlich model (at pH 1.2, R2 = 0.9835
and 0.9843, and at pH 6.8, R2 = 0.9849 and 0.9995, for GPCa and GRsCa, respectively).
The Freundlich model describes adsorption onto an irregular surface, as well as the
possibility of adsorption in multiple layers. In this model, the amount of adsorbed solute
results from the sum of adsorption in all available sites, each with different binding energy,
with the strongest binding sites being occupied first, followed by adsorption in the lower
energy sites, until reaching the process balance.
From the linearization of the Freundlich model, the coefficients n and k were obtained,
with n indicating the intensity of mucin adsorption on the particle surface. At pH 1.2,
the values of n were 1.56 and 1.38, and at pH 6.8, they were 1.76 and 1.73 for GRSCa and
GPCa, respectively. Favorable conditions for adsorption occur when values of n are greater
than 1.0.
The k coefficient, on the other hand, is related to particle adsorption capacity. At
pH 1.2, k = 8.5 and 7.3, and at pH 6.8, k = 10.1 and 9.6 for GRSCa and GPCa, respectively.
The high values of k indicate the great capacity of mucin adsorption per unit of PMs mass.
In the tested range of mucin concentration, the adsorption was favorable at both pH
values; however, the adsorption coefficients n and K of the Freundlich model indicate that
the particle–mucin interaction was strongest at pH 6.8.
4. Conclusions
In this work, microparticles based on different polymer blends (GG:RS and GG:P) were
prepared by ionotropic gelation using different cations (Ca2+ or Al3+ ), or by double cross-
linking, in order to modulate both their physical–chemical and mucoadhesive properties.
Our intent was to design mucoadhesive oral carriers for targeted delivery of drugs or nano
systems to different sites of the GIT. The cross-linking process with calcium or aluminum
promoted different effects on the GG:RS and GG:P properties, representing a promising
strategy for their modulation according to specific purposes. In general, double cross-
linking did not promote significant changes, especially when compared to aluminum
cross-linking.
Calcium cross-linking promoted the decrease of GG:RS microparticles size, while the
same process done on GG:P caused the contrary effect. The liquid uptake ability of both
GG:RS and GG:P microparticles was high, with GRSCa and GPCa presenting the lowest
and highest acid absorption rates, respectively. In phosphate buffer, particles absorbed high
volume per mass, and the different cross-linking approaches did not affect this behavior.
Cross-linking of GG:RS microparticles with calcium resulted in an impressive reduction
of microparticle degradation in mediums containing enzymes and of pH 1.2 and 6.8, a
favorable feature for protecting drugs against premature release in acidic media and a
sustaining drug release in the intestine. In contrast, GG:P microparticle degradation was
significantly increased by cross-linking with calcium at both pH media, which can provide
quick release of drugs throughout the GIT. Aluminum cross-linking significantly increased
microparticle degradation in simulated intestinal media, which can contribute to fast
release of drugs in this site.
The ex vivo and in vitro tests evidenced the mucoadhesive ability of GG:RS and GG:P
cross-linked microparticles, regardless of the pH. This constitutes a promising feature for
the immobilization of the drugs at different sites of action and/or absorption. Calcium
cross-linking enhanced the mucoadhesiveness of GG:P microparticles while aluminum
hampered mucoadhesiveness in GG:RS blends.Pharmaceutics 2021, 13, 407 16 of 17
The promising attributes of the inert microparticles designed in this work reveal
their potential for encapsulation different drugs or nanoparticles, aiming the targeted
release at different sites of the GIT. The effect of the encapsulation of nanoparticles on the
microparticles structure and properties will be addressed in future work.
Author Contributions: F.I.B.: Conceptualization, Methodology, Data curation, Formal analysis,
Investigation, Validation, Visualization, Writing—original draft, Writing—review and editing. N.N.F.:
Visualization, Writing—review and editing. B.S.F.C.: Methodology, Formal analysis, Writing—review
and editing. M.P.D.G.: Supervision, Conceptualization, Project administration, Funding acquisition.
All authors have read and agreed to the published version of the manuscript.
Funding: This work was financially supported by the São Paulo Research Foundation (FAPESP),
provided through grant number 2017/26349-0.
Data Availability Statement: The data presented in this study are available on request from the
corresponding author.
Acknowledgments: Authors are grateful for Department of Drug and Medicines at São Paulo State
University, São Paulo Research Foundation (FAPESP), and “Coordenação de Aperfeiçoamento de
Pessoal de Nível Superior” (CAPES). We would like to thank the LNNano for technical support during
electron microscopy images and the National Institute of Science and Technology in Pharmaceutical
Nanotechnology: a transdisciplinary approach INCT-NANOFARMA, which is supported by the São
Paulo Research Foundation (FAPESP, Brazil).
Conflicts of Interest: The authors declare no conflict of interest.
References
1. Homayun, B.; Lin, X.; Choi, H.-J. Challenges and Recent Progress in Oral Drug Delivery Systems for Biopharmaceuticals.
Pharmaceutics 2019, 11, 129. [CrossRef]
2. Prezotti, F.G.; Boni, F.I.; Ferreira, N.N.; Silva, D.S.; Almeida, A.; Vasconcelos, T.; Sarmento, B.; Gremião, M.P.D.; Cury, B.S.F. Oral
nanoparticles based on gellan gum/pectin for colon-targeted delivery of resveratrol. Drug Dev. Ind. Pharm. 2020, 46, 236–245.
[CrossRef] [PubMed]
3. Prezotti, F.G.; Boni, F.I.; De Souza, D.; Campana-filho, S.P.; Almeida, A.; Palmira, M.; Gremi, D.; Stringhetti, B.; Cury, F. Gellan
Gum / Pectin Beads Are Safe and Efficient for the Targeted Colonic Delivery of Resveratrol. Polymers (Basel) 2018, 10, 50.
[CrossRef] [PubMed]
4. Boni, F.I.; Prezotti, F.G.; Cury, B.S.F. Gellan gum microspheres crosslinked with trivalent ion: Effect of polymer and crosslinker
concentrations on drug release and mucoadhesive properties. Drug Dev. Ind. Pharm. 2016, 42, 1283–1290. [CrossRef] [PubMed]
5. Meneguin, A.B.; Beyssac, E.; Garrait, G.; Hsein, H.; Cury, B.S.F. Retrograded starch/pectin coated gellan gum-microparticles
for oral administration of insulin: A technological platform for protection against enzymatic degradation and improvement of
intestinal permeability. Eur. J. Pharm. Biopharm. 2018, 123, 84–94. [CrossRef]
6. de Oliveira Cardoso, V.M.; Stringhetti Ferreira Cury, B.; Evangelista, R.C.; Daflon Gremião, M.P. Development and characterization
of cross-linked gellan gum and retrograded starch blend hydrogels for drug delivery applications. J. Mech. Behav. Biomed. Mater.
2017, 65, 317–333. [CrossRef]
7. Chen, J.; Li, X.; Chen, L.; Xie, F. Starch film-coated microparticles for oral colon-specific drug delivery. Carbohydr. Polym. 2018, 191,
242–254. [CrossRef] [PubMed]
8. Wong, C.Y.; Al-Salami, H.; Dass, C.R. Microparticles, microcapsules and microspheres: A review of recent developments and
prospects for oral delivery of insulin. Int. J. Pharm. 2018, 537, 223–244. [CrossRef] [PubMed]
9. dos Santos, A.M.; Meneguin, A.B.; Akhter, D.T.; Fletcher, N.; Houston, Z.H.; Bell, C.; Thurecht, K.J.; Gremião, M.P.D. Understand-
ing the role of colon-specific microparticles based on retrograded starch/pectin in the delivery of chitosan nanoparticles along
the gastrointestinal tract. Eur. J. Pharm. Biopharm. 2021, 158, 371–378. [CrossRef]
10. Ma, Y.; Fuchs, A.V.; Boase, N.R.B.; Rolfe, B.E.; Coombes, A.G.A.; Thurecht, K.J. The in vivo fate of nanoparticles and nanoparticle-
loaded microcapsules after oral administration in mice: Evaluation of their potential for colon-specific delivery. Eur. J. Pharm.
Biopharm. 2015, 94, 393–403. [CrossRef]
11. Sriamornsak, P.; Wattanakorn, N.; Takeuchi, H. Study on the mucoadhesion mechanism of pectin by atomic force microscopy and
mucin-particle method. Carbohydr. Polym. 2010, 79, 54–59. [CrossRef]
12. Osmałek, T.; Froelich, A.; Tasarek, S. Application of gellan gum in pharmacy and medicine. Int. J. Pharm. 2014, 466, 328–340. [CrossRef]
13. Carvalho, F.C.; Bruschi, M.L.; Evangelista, R.C.; Gremião, M.P.D. Mucoadhesive drug delivery systems. Braz. J. Pharm. Sci. 2010,
46, 1–17. [CrossRef]
14. Lopez-Mendez, T.B.; Santos-Vizcaino, E.; Pedraz, J.L.; Hernandez, R.M.; Orive, G. Cell microencapsulation technologies for
sustained drug delivery: Clinical trials and companies. Drug Discov. Today 2020. [CrossRef]You can also read