Reversal of Forest Soil Acidification in the Northeastern United States and Eastern Canada: Site and Soil Factors Contributing to Recovery - MDPI
←
→
Page content transcription
If your browser does not render page correctly, please read the page content below
Article
Reversal of Forest Soil Acidification in the
Northeastern United States and Eastern Canada:
Site and Soil Factors Contributing to Recovery
Paul Hazlett 1, * , Caroline Emilson 1 , Greg Lawrence 2 , Ivan Fernandez 3 , Rock Ouimet 4
and Scott Bailey 5
 1    Natural Resources Canada–Canadian Forest Service 1219 Queen St. E., Sault Ste.
      Marie, ON P6A 2E5, Canada; caroline.emilson@canada.ca
 2    U.S. Geological Survey New York Water Science Center, 425 Jordan Road, Troy, NY 12180, USA;
      glawrenc@usgs.gov
 3    School of Forest Resources, University of Maine, Deering Hall, Orono, ME 04469-5722, USA;
      ivanjf@maine.edu
 4    Direction de la Recherche Forestière, Ministère des Forêt, de la Faune et des Parcs du Québec,
      Complexe Scientifique, 2700 Einstein Street, Quebec City, QC G1P 3W8, Canada;
      rock.ouimet@mffp.gouv.qc.ca
 5    Hubbard Brook Experimental Forest, USDA Forest Service, Northern Research Station,
      234 Mirror Lake Road, North Woodstock, NH 03262, USA; scott.bailey@usda.gov
 *    Correspondence: paul.hazlett@canada.ca

 Received: 25 June 2020; Accepted: 18 August 2020; Published: 27 August 2020

 Abstract: As acidic deposition has decreased across Eastern North America, forest soils at some sites
 are beginning to show reversal of soil acidification. However, the degree of recovery appears to
 vary and is not fully explained by deposition declines alone. To assess if other site and soil factors
 can help to explain degree of recovery from acid deposition, soil resampling chemistry data (8- to
 24-year time interval) from 23 sites in the United States and Canada, located across 25◦ longitude
 from Eastern Maine to Western Ontario, were explored. Site and soil factors included recovery years,
 sulfate (SO4 2− ) deposition history, SO4 2− reduction rate, C horizon pH and exchangeable calcium
 (Ca), O and B horizon pH, base saturation, and exchangeable Ca and aluminum (Al) at the time of
 the initial sampling. We found that O and B horizons that were initially acidified to a greater degree
 showed greater recovery and B horizon recovery was further associated with an increase in recovery
 years and lower initial SO4 2− deposition. Forest soils that seemingly have low buffering capacity and a
 reduced potential for recovery have the resilience to recover from the effects of previous high levels of
 acidic deposition. This suggests, that predictions of where forest soils acidification reversal will occur
 across the landscape should be refined to acknowledge the importance of upper soil profile horizon
 chemistry rather than the more traditional approach using only parent material characteristics.

 Keywords: acidic deposition; forest soil recovery; pH; base saturation; exchangeable cations

1. Introduction
     One of the initial environmental concerns expressed about acidic deposition was the potential
cumulative effect of long-term pollutant loading on soil acidity and nutrient levels and the consequences
of these soil changes on forest health and productivity [1–3]. As noted by Johnson et al. [4], the term soil
acidification has often been used when describing decreases in soil pH and base saturation, increases in
base cation leaching, decreases in exchangeable base cations and/or increases in exchangeable aluminum
(exAl) by mobilization from the soil. While related in some respects, these soil properties can respond

Soil Syst. 2020, 4, 54; doi:10.3390/soilsystems4030054                         www.mdpi.com/journal/soilsystems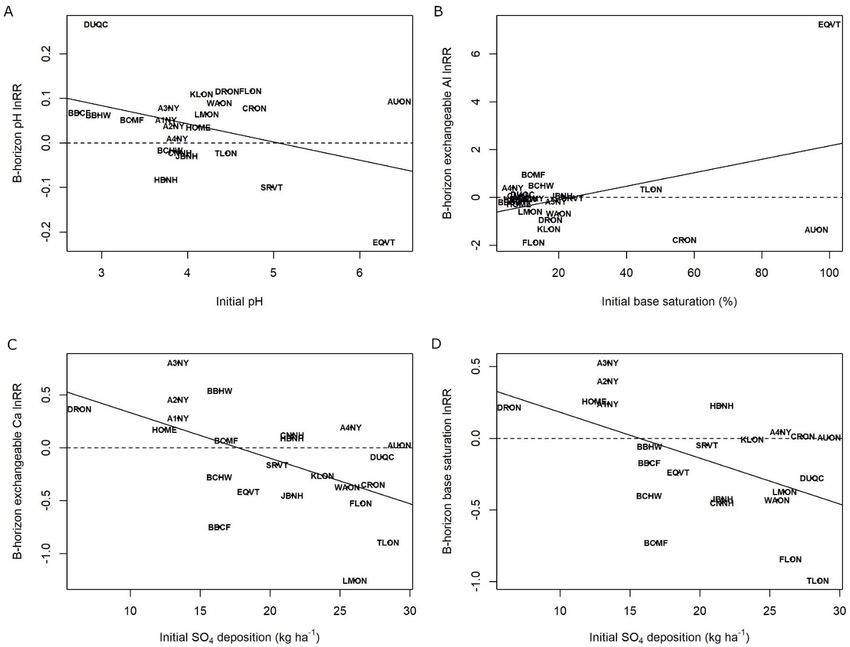
Soil Syst. 2020, 4, 54                                                                                  2 of 22

differently to increasing or decreasing acid inputs depending on inherent site and soil conditions.
For example, increased base cation leaching does not necessarily lead to decreases in pH and base
saturation if biological cycling, atmospheric deposition or mineral weathering can counter leaching
losses by providing inputs to affected soil horizons. Conversely, while increased deposition of hydrogen
ion (H+ ) and sulfate (SO4 2− ) can reduce pH and base saturation, site differences in inorganic SO4 2−
adsorption and desorption [5] can limit base cation leaching losses.
      Berden et al. [6] synthesized results from some of the earliest soil resampling studies from Northern,
Central and Western Europe that were conducted to determine the impacts of acidic deposition on
forests. Several studies reported 0.2 to 1.5 unit decreases in forest soil pH from the mid 19000 s up until
the early 19800 s. Researchers in Germany also found significant declines in soil exchangeable calcium
(exCa) and magnesium (exMg), and increases in exAl over similar time periods [7,8]. In North America,
Linzon and Temple [9] documented pH declines for A and B horizons of one soil series in central
Ontario between 1960 and 1978. A retrospective study using plots established in the Adirondack
Mountains of New York showed declines in exCa concentrations in surface soil horizons from the early
19300 s to 1984 and between 1984 and the mid 20000 s [10–12]. Other studies across Eastern Canada and
the United States confirmed decreases in soil pH, base saturation, and concentrations of exCa and
exMg and increases in exAl concentrations due to acidic deposition from the 19600 s to the 19900 s [13],
the 19700 s to the early 20000 s [14–16], the 19800 s to the early 20000 s [17–19] and the 19900 s to the early
20100 s [20].
      Acidic deposition across Europe and Eastern North America has declined since the early 19800 s
in line with declines in sulphur (S) and nitrogen (N) emissions brought about by pollution control
policies [21–24]. After decades of acidification, forest soils have begun to show signs of recovery.
In the first soil resampling study to document recovery in North America, Lawrence et al. [25] reported
increased pH and decreased exAl concentrations between 1992/93 and 2003/04 for Oa horizons at several
red spruce stands in the Northeastern United States. Other studies that executed soil resampling across
multiple sites in North America and Europe have generally reported greater recovery in the forest
floor and upper mineral soil compared to deeper horizons, and at sites where soils were resampled in
the 20000 s to the early 20100 s [26–29]. These studies seem to indicate that after a lag period, declining
acidic deposition is now leading to decreased soil acidity, and in many cases, decreases in precipitation
S and N have been linked directly to the degree of recovery.
      It is generally acknowledged that the most important factors that control a soils’ ability to buffer
acidic inputs, and its recovery from acidification at any particular site, are the chemical characteristics
of the bedrock and surficial geological deposits [30,31]. In relation to base cation leaching loss, soils low
in secondary iron and aluminum oxide minerals with high pH have lower SO4 2− adsorption capacities,
and soils with high N content that exceeds biological need for N, are susceptible to base cation loss [32].
Other site factors that can influence soil acidification processes include the position of the pedon along
the catena (topography), soil porosity (texture and structure), hydrologic characteristics of the terrain
(profile depth and surface characteristics), and the amount of nutrient biocycling related to forest type
and developmental stage [26,31]. To generalize, sites with shallow, coarse textured glacial deposits and
parent materials with low buffering capacity are more at risk of acidification than sites with deeper,
fine textured deposits and calcareous parent materials with high buffering capacity [30–32].
      In Lawrence et al. [26], we resampled O and B horizons at 27 forested sites across Eastern Canada
and the Northeastern United States over intervals of 8 to 24 years with the second sampling in the
mid to late 20000 s. Soils at most sites exhibited some evidence of recovery from acidic deposition
with decreases in exAl in O horizons, and increased pH in O and B horizons. Exchangeable Ca
concentrations showed the fewest number of differences from initial to final sampling for both horizons,
but base saturation decreased significantly in B horizons at one-third of the sites. While we also
found that increasing percent reduction in SO4 2− deposition over the time period between samplings
led to increased levels of recovery in the O horizon (i.e., increasing ratios of initial to final base
saturation and exCa, and decreasing exAl ratios), the relationships were driven by relatively few
Soil Syst. 2020, 4, 54                                                                               3 of 22

sites. Three resampling studies were conducted in experimental watersheds at Bear Brook, Maine,
where SO4 2− input decreases ranged from only 5.7–9.8% due to annual experimental aerial additions of
(NH4 )2 SO4 fertilizer. The objective of these studies was to maintain N and S inputs at levels comparable
to heavily impacted areas in the Eastern United States from the early 19800 s, levels prior to ambient
deposition decreases over the re-sampling period. The largest decrease in SO4 2− deposition (76%)
occurred at the Wawa (Ontario, Canada) site. This site was immediately downwind of an iron ore
sintering plant that began provincially ordered controls on sulfur dioxide (SO2 ) emissions in the
mid-1980s and was completely closed in 1998. It is possible that the actual deposition decrease at this
site was greater than that estimated from the regional air and precipitation monitoring network.
      In this study, we extend the work of Lawrence et al. [26] by examining the soil resampling data
from 19 of the original 27 sites, and four new sites in the Adirondack region of New York. The main
objectives of this study were to: (a) compare soil recovery indices to site and soil properties that we
would expect to be critical to soil recovery; and (b) determine which measurements are most useful
to predict recovery and if there were thresholds in site and soil properties that determined whether
sites recovered or not. We used recovery years, initial SO4 2− deposition, SO4 2− reduction rate and soil
chemical properties collected at each site as variables to explain why there were different degrees of
recovery across this region.

2. Materials and Methods

2.1. Study Sites, Experimental Design and Field Sampling
      The 23 study sites are located in Maine, Vermont, New Hampshire and New York [33] in the
United States and Quebec and Ontario in Canada, spanning 68◦ W to 93◦ W longitude (Figure 1).
For this study, we did not include the three Bear Brook, Maine sites that were part of Lawrence et al. [26]
because the SO4 2− inputs at these sites were experimentally maintained at elevated levels by fertilizer
additions. As shown previously, while recovery was linked to declines in SO4 2− deposition, not all sites
with similar deposition declines recovered to the same degree. As our goal was to evaluate additional
variables that could further explain and predict site specific response to decreases in acidic deposition,
we included chemical properties of the C horizon (parent material) at each site. An additional five of
the 27 sites in Lawrence et al. [26] did not have these data so they were also not included in this study.
The forests at the sites represent a range of mature, upland stands situated in glacial terrain; 14 northern
hardwood, six softwood and three mixed northern hardwood/softwood stands (Table 1). Most of
the study sites have well-developed Spodosol (Podzol) soil profiles (19 sites), with Alfisol (Luvisolic)
(2 sites) and Inceptisol (Brunisol) (2 sites) also represented. Soils textures (B horizon) are loamy sands
to silty clays, with surface horizons including mull, moder and mor forest floors (Figure 2). The study
sites had annual precipitation ranging from 706 to 1703 mm year−1 and annual mean temperatures
from 1.8 to 7.8 ◦ C (Table 1). Sites in the eastern part of the region generally receive higher annual
precipitation than those to the west.
      The initial soil sampling and the subsequent final resampling at each site were led by the same five
investigators and can be grouped into seven distinct projects, each with a similar experimental design.
      The consistency of investigators ensured that the initial sampling sites could be exactly re-located
and the initial sampling protocol could be repeated, both elements of critical importance to measure
changes in soil chemical properties over time [34]. The number of pits sampled at each site ranged
from 4 to 28 (Table 1) and the soil resampling had lengths of time from 8 to 24 years between initial and
final sampling (Figure 3). With the varied intervals between sampling, the initial sampling years and
final sampling years ranged from 1985 to 2004, and 2003 to 2017, respectively (Figure 3). Index soil
horizons, O (LFH) (either Oe [F], Oa [H], or combined Oe [F]/Oa [H]), and upper B horizons were
sampled in each soil pit at initial and final sampling. The C horizon at each site was sampled at the
initial sampling date by excavating one additional soil pit to 1 m depth or to bedrock, if 1 m depth
could not be reached.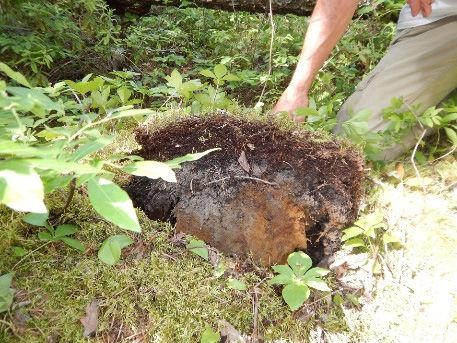
Soil Syst. 2020, 4, 54                                                                                                                                                            4 of 22

      Table 1. Location, site characteristics and sampling description for soil resampling sites in Eastern Canada (Cdn) and the Northeastern United States (US). Ordered
      from east to west.

               State/Province,                                  Soil Type (US   Soil Type (Cdn                    Soil Texture a B   Annual Precipitation     Annual Mean
                                 Site Code     Forest Type                                         Pits Sampled
                  Location                                      Great Group)     Great Group)                        Horizon              b (mm)            Temperature b (◦ C)
                                                                                 Humo-ferric
              MaineBear Brook     BBCF           spruce          Haplorthod                             10              SL                  1256                    6.9
                                                                                   podzol
                                                northern                         Humo-ferric
              MaineBear Brook     BBHW                           Haplorthod                             10              SL                  1256                    6.9
                                               hardwood                            podzol
                                                                                 Humo-ferric
               MaineHowland       HOME       mixed softwood      Haplorthod                             12              SL                  1180                    6.4
                                                                                   podzol
               New Hampshire,                                                    Humo-ferric
                                  CNNH           spruce          Haplorthod                             12              SL                  1703                    1.8
               Crawford Notch                                                      podzol
                                                northern                         Humo-ferric
              QuebecDuchesnay     DUQC                           Haplorthod                             4               SL                  1341                    3.8
                                               hardwood                            podzol
                  New
                                                northern                         Humo-ferric
             HampshireHubbard     HBNH                           Haplorthod                             4               SL                  1281                    5.6
                                               hardwood                            podzol
                  Brook
                  New
                                                northern                         Humo-ferric
              HampshireJeffers    JBNH                           Haplorthod                             4               SL                  1434                    4.0
                                               hardwood                            podzol
                  Brook
               VermontSleepers                  northern                         Humo-ferric
                                  SRVT                           Haplorthod                             4               SL                  1295                    4.5
                   River                       hardwood                            podzol
               Vermont Mount                    northern
                                  EQVT                           Dystrudept     Dystric brunisol        4               SL                  1383                    5.9
                  Equinox                      hardwood
                 New York                       northern                         Humo-ferric
                                  A2NY                           Haplorthod                             15              SL                  1342                    4.4
              Adirondack 28014                 hardwood                            podzol
                                             spruce, northern                    Humo-ferric
            New YorkBuck Creek    BCMF                           Haplorthod                             28              SL                  1258                    4.8
                                                hardwood                           podzol
                                                northern                         Humo-ferric
            New YorkBuck Creek    BCHW                           Haplorthod                             28              SL                  1258                    4.8
                                               hardwood                            podzol
            New YorkAdirondack                  northern                         Humo-ferric
                                  A3NY                           Haplorthod                             15              SL                  1196                    5.2
                  28030                        hardwood                            podzol
            New YorkAdirondack                  northern                         Humo-ferric
                                  A1NY                           Haplorthod                             15              SL                  1305                    4.6
                  27020                        hardwood                            podzol
            New YorkAdirondack                 softwood,                         Humo-ferric
                                  A4NY                           Haplorthod                             15              SL                  1259                    6.4
                  29012                        hardwood                            podzol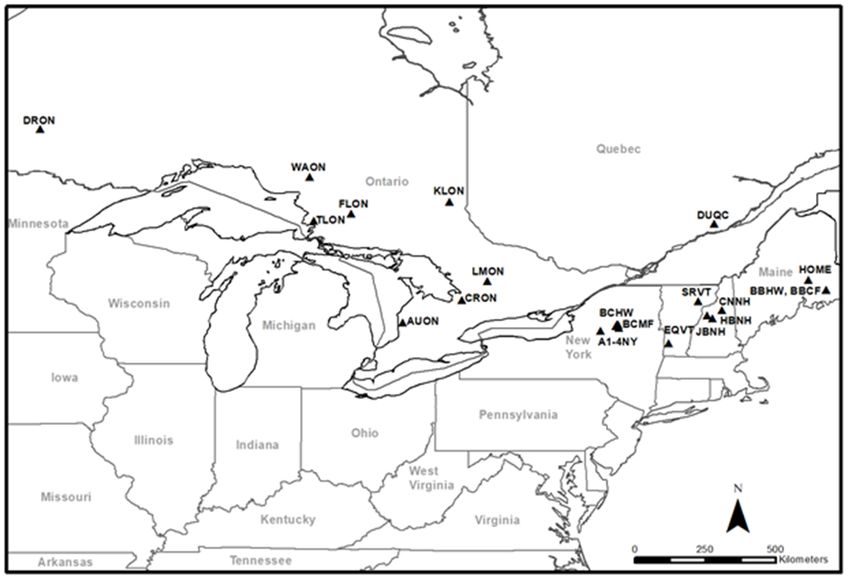
Soil Syst. 2020, 4, 54                                                                                                                                                                             5 of 22

                                                                                            Table 1. Cont.

               State/Province,                                         Soil Type (US     Soil Type (Cdn                        Soil Texture a B   Annual Precipitation       Annual Mean
                                    Site Code        Forest Type                                             Pits Sampled
                  Location                                             Great Group)       Great Group)                            Horizon              b (mm)              Temperature b (◦ C)
                OntarioLittle                         northern                             Gray brown
                                      LMON                               Hapludalf                                 25                SiL                   1080                    5.3
                Margaret Lake                        hardwood                                luvisol
                                                      northern                               Melanic
             Ontario Craighurst       CRON                              Eutrustept                                 25                 SL                   968                     6.6
                                                     hardwood                                brunisol
                                                                                           Humo-ferric
            OntarioKirkland Lake      KLON         boreal jack pine     Haplorthod                                 25                 SiS                  743                     3.1
                                                                                             podzol
                                                      northern                             Gray brown
               OntarioAuburn          AUON                               Hapludalf                                 25                SiC                   991                     7.8
                                                     hardwood                                luvisol
                                                                                           Humo-ferric
             OntarioFlame Lake        FLON         boreal jack pine     Haplorthod                                 25                SCL                   896                     3.1
                                                                                             podzol
                                                      northern                             Ferro-humic
            OntarioTurkey Lakes       TLON                             Haplohumod                                  25                SiL                   1069                    3.3
                                                     hardwood                                podzol
                                                                                           Humo-ferric
                OntarioWawa           WAON         boreal jack pine     Haplorthod                                 25                 LS                   838                     2.0
                                                                                             podzol
                                                                                           Humo-ferric
               OntarioDryden          DRON         boreal jack pine     Haplorthod                                 25                 SiS                  706                     2.6
                                                                                             podzol
      a Soil texture: C = clay, SiC = silty clay, CL = clay loam, SiCL = silty clay loam, SCL = sandy clay loam, L = loam, SL = sandy loam, SiL = silt loam, Si = silt, SiS = silty sand, LS = loamy
      sand. b Climate data from climate surfaces model, annual mean values 2001–2010 [35].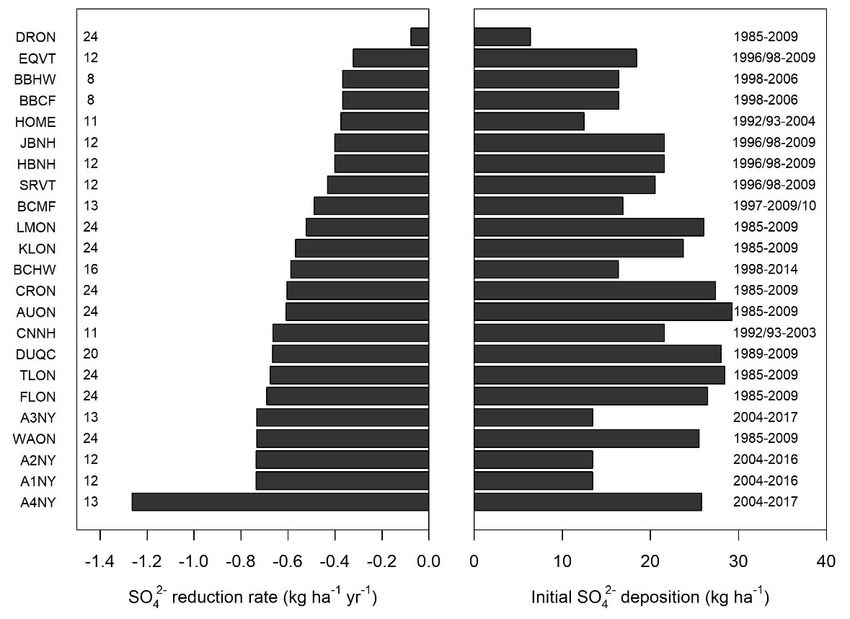
ntario
TLON northern hardwood Haplohumod Ferro-humic podzol 25 SiL 1069
key Lakes
ntario
WAON boreal jack pine Haplorthod Humo-ferric podzol 25 LS 838
Wawa
ntario
DRON boreal jack pine Haplorthod Humo-ferric podzol 25 SiS 706
ryden
texture: C = clay, SiCSoil Syst. clay,
= silty 2020, 4,
CL54= clay loam, SiCL = silty clay loam, SCL = sandy clay loam, L = loam, SL = sandy loam, SiL
6 of
= 22
silt loam, Si = silt, SiS
LS = loamy sand. Climate data from climate surfaces model, annual mean values 2001–2010 [35].
b
Soil Syst. 2020, 4, x FOR PEER REVIEW 6 of 23
Figure 1.
Figure 1. Location
Location of
of soil
soil resampling
resampling sites in Eastern
sites in Eastern Canada
Canada and
and the
the Northeastern
Northeastern United
United States.
States.
(A) (B)
Figure
Figure2. 2.Example
Example (A) hardwood
(A) hardwood andand(B)(B)
softwood
softwoodprofiles showing
profiles showingforest floor
forest and
floor upper
and mineral
upper soil
mineral
morphologies of soil of
soil morphologies resampling sites insites
soil resampling Eastern CanadaCanada
in Eastern and theand
Northeastern United States.
the Northeastern United States.
Wet-onlyprecipitation
precipitation SO 2− deposition was determined for each soil resampling site using data
Wet-only SO 42−4deposition was determined for each soil resampling site using data from
fromregional
either either regional
air andair and precipitation
precipitation monitoring
monitoring networks networks
in Canadain Canada
[36] and [36]
theand the United
United States States
[37], or[37],
site-
or site-measurements
specific specific measurementsin the case in the case ofBBHW
of BBCF, BBCF, BBHW
and DUQC.and DUQC.
For soilFor soil resampling
resampling sites insites
the in the
United
States,
United deposition at the closest
States, deposition at theNational Atmospheric
closest National Deposition
Atmospheric Program Program
Deposition (NADP) (NADP)
station was used
station
(http://nadp.slh.wisc.edu/ntn/;
was used (http://nadp.slh.wisc.edu/ntn/;accessed 1 June 2020).
accessed In Ontario,
1 June 2020). Inwhere soil where
Ontario, resampling sites were sites
soil resampling more
distant fromdistant
were more air and fromprecipitation monitoring
air and precipitation stations, SO
monitoring stations, SO4 2− deposition
42− deposition was calculated by distance
was calculated by
weighting depositiondeposition
distance weighting from several fromproximate CanadianCanadian
several proximate Air and Air Precipitation Monitoring
and Precipitation Network
Monitoring
(CAPMoN)
Network (CAPMoN) stations (https://www.canada.ca/en/environment-climate-change/services/air-
stations (https://www.canada.ca/en/environment-climate-change/services/air-pol
pollution/monitoring-networks-data/canadian-air-precipitation.html;
lution/monitoring-networks-data/canadian-air-precipitation.html; accessed accessed11June June2020.
2020. Initial
Initial SOSO
4
2−42−
deposition
deposition (kg·ha) −1
(kg·ha −1 at)each site site
at each was wascalculated as theasmean
calculated of the of
the mean 4 years
the 4prior
yearstoprior
the initial
to thesoil sampling
initial soil
sampling and SO4 reduction rate (kg·ha yr ) was determined as the slope of the decreasefour
and SO 42− reduction rate 2− (kg·ha −1 yr−1) was determined
−1 −1 as the slope of the decrease in deposition from in
years prior tofrom
deposition the four
initialyears
sampling
prior to to the
the initial
year ofsampling
final sampling for all
to the year of sites
final except
sampling onefor
(DUQC)
all sitesthat only
except
had
onedeposition
(DUQC) data starting
that only hadfrom the year data
deposition of initial sampling.
starting from Initial
the yearSO4of2− deposition covered a broad range
initial sampling. Initial SO4 2−
from 6.4 to 29.3 kg·ha −1 with nine sites having deposition
deposition covered a broad range from 6.4 to 29.3 kg·ha with nine sites greater
−1 than 23 kg·ha −1, eight of these being the
having deposition greater
sites
thanwhere soils
23 kg·ha −1 ,were
eightsampled initially
of these being theinsites
the where
1980’s soils
(Figure
were3).sampled
Adirondack site in
initially 29012 (A4NY)
the 1980 had high
0 s (Figure 3).
deposition when initially sampled in 2004 (25.8 kg·ha ), but this site had extremely high SO4 deposition
−1 2−
−1
Adirondack site 29012 (A4NY) had high deposition when initially sampled in 2004 (25.8 kg·ha ),
from 1981 to 1984 (mean value 36.6 2− kg·ha−1). The five sites with initial deposition less than 15 kg·ha−1
but this site had extremely high SO4 deposition from 1981 to 1984 (mean value 36.6 kg·ha−1 ). The five
included Adirondack 27020 (A1NY), 28014 (A2NY) and 28030 (A3NY), sampled in 2004 and the DRON
sites with initial deposition less than 15 kg·ha−1 included Adirondack 27020 (A1NY), 28014 (A2NY)
and HOME sites. While the A4NY site maintained high SO42− deposition into the early 2000’s, it had a rapid
decline to its final sampling in 2017 resulting in a SO42− reduction rate of 1.26 kg·ha−1·year−1, compared to a
relatively narrow range of 0.32 to 0.74 kg·ha−1·year−1 for 21 of the 23 sites (Figure 3). The most westerly site
DRON had the lowest initial SO42− deposition and SO42− reduction rate, 6.4 kg·ha−1 and 0.08 kg·ha−1·year−1,
respectively.
Soil Syst. 2020, 4, 54 7 of 22
and 28030 (A3NY), sampled in 2004 and the DRON and HOME sites. While the A4NY site maintained
high SO4 2− deposition into the early 20000 s, it had a rapid decline to its final sampling in 2017 resulting
in a SO4 2− reduction rate of 1.26 kg·ha−1 ·year−1 , compared to a relatively narrow range of 0.32 to
0.74 kg·ha−1 ·year−1 for 21 of the 23 sites (Figure 3). The most westerly site DRON had the lowest initial
Soil Syst.
SO4 2− 2020, 4, x FOR PEER REVIEW
deposition and SO4 2− reduction rate, 6.4 kg·ha−1 and 0.08 kg·ha−1 ·year−1 , respectively. 7 of 23
Figure3.3.SO SO 2− reduction rate and initial SO 2− deposition at soil resampling sites in Eastern Canada
Figure 42−4 reduction rate and initial SO42− deposition
4 at soil resampling sites in Eastern Canada and the
and the Northeastern United States. Values on the left
Northeastern United States. Values on the left represent the number represent the number of recovery
of recovery years
years for eachforsite
each
(i.e.,
site (i.e., number of years between initial and final soil sampling), and values on the right represent
number of years between initial and final soil sampling), and values on the right represent year of initial and
yearsoil
final of initial
sampling.and final soil sampling.
2.2. Laboratory Analysis
2.2. Laboratory Analysis
In the same way as the field sampling protocols, both the initial and final chemical analyses for
In the same way as the field sampling protocols, both the initial and final chemical analyses for each
each
site weresite conducted
were conducted with
with the the oversight
oversight of the of theinvestigator.
same same investigator. This approach
This approach ensured ensured
that thethat the
analyses
analyses of both samplings were done in the same laboratory facility
of both samplings were done in the same laboratory facility and that each laboratory method wasand that each laboratory method
was meticulously repeated. Samples −1
meticulously repeated. Samples werewere analyzed
analyzed forforpHpHinin 0.01
0.01 mol·L
mol·L−1 CaCl
CaCl22 by by glass
glasselectrode.
electrode.
Exchangeable Ca, Mg, K, Na were determined in unbuffered 1 mol·L −1 NH Cl solution and inexAl in 1
Exchangeable Ca, Mg, K, Na were determined in unbuffered 1 mol·L NH4Cl solution and exAl −1 4 either
either 1 mol·L −1 NH Cl or 1 mol·L−1 KCl. Solution concentrations were determined by inductively
mol·L−1 NH4Cl or 1 mol·L 4 −1 KCl. Solution concentrations were determined by inductively coupled plasma
coupled
(ICP) plasmaspectrometry.
emission (ICP) emission Basespectrometry.
saturation wasBase calculated
saturation as wasthe calculated
sum of baseas thecations
sum ofdivided
base cations
by the
divided by the cation exchange capacity determined as either the exchangeable
cation exchange capacity determined as either the exchangeable acidity plus the sum of exchangeable bases acidity plus the sum
ofNH
or exchangeable
4 replacement bases or NH
methods. 4 replacement
Within each of themethods. Within
seven projects each of the
researchers seven
also projects researchers
had archived samples from
alsoinitial
the had archived
samplingsamples
that werefrom the initialatsampling
reanalyzed the samethattimewere
as thereanalyzed at theFor
final samples. same timesites,
some as theallfinal
of the
samples. For some sites, all of the initial samples were available to reanalyze
initial samples were available to reanalyze and the recent analyses were utilized in this study rather than and the recent analyses
were
the utilized
initial in this For
analyses. study rather
other thanonly
sites, the initial analyses.
a subset of theFor othersamples
initial sites, only was a subset of the and
reanalyzed initialthe
samples was of
comparability reanalyzed
the analysesandwere
the comparability
confirmed, or, when of thedifferences
analyses were wereconfirmed, or, when differences
detected, regression relationships
wereused
were detected, regression
to adjust relationships
the initial analyses for were used
those to adjust
samples the initial
where analyses
analyses were fornotthose samples
repeated. As awhere
further
check
analyseson analyses
were notcomparability,
repeated. As aforest
further soil reference
check samples
on analyses (Oa [F] and Bforest
comparability, horizons) were distributed
soil reference samples to
four
(Oa of[F]the
and five laboratories
B horizons) in this
were study and
distributed an additional
to four of the five11laboratories
laboratoriesinacross the Eastern
this study and anUnited States
additional
and Canada [38].across
11 laboratories Replicate analysesUnited
the Eastern of the reference
States and samples
Canada were
[38].conducted
Replicatein each laboratory
analyses as part of
of the reference
their
samplesregular
were sample runs. in
conducted The results
each were not
laboratory different
as part among
of their regularlaboratories,
sample runs. withThe variability among
results were notthe
laboratories being as low as variability in replicate analyses within laboratories for exCa, exMg, exK, exNa,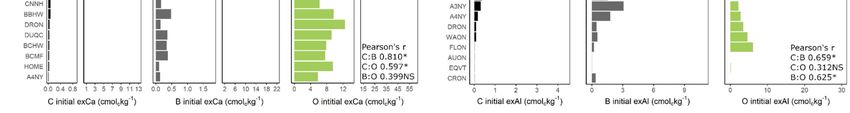
Soil Syst. 2020, 4, 54 8 of 22
different among laboratories, with variability among the laboratories being as low as variability in
replicate analyses within laboratories for exCa, exMg, exK, exNa, exAl and pH [38]. All data from the
Adirondack sites are available in U.S. Geological Survey data release [33].
2.3. Calculations and Statistical Analysis
To explore site and soil variables potentially driving differences in the degree of soil recovery
across sites, all analyses were run separately on O and B soil horizon data in the statistical computing
software R v4.0.0 [39]. Mean initial and final soil chemistry values were first calculated for each
site. For variables used as recovery indices (i.e., exCa, exAl, pH and base saturation), response ratios
(RRs, the ratio of the soil chemistry value at final sampling to that of the soil chemistry value at
initial sampling) were calculated to quantify the magnitude of the soil change effect for each site.
Response ratios were used by Lawrence et al. [26] to investigate the link between changes in SO4 2−
deposition and soil chemical changes. The critical elements to ensure the reliability of the ratio are
the repeatability of field sampling of soil horizons and chemical analyses at the two sampling times.
Recovery indices were then calculated as the natural logarithm of the response to linearize the ratios
and provide a more normal sampling distribution [40] as follows:
Mean.final
Recovery index = lnRR = ln
Mean.initial
To assess associations between all recovery and site and soil properties simultaneously across sites,
redundancy analysis (RDA) was run using the vegan package 2.5–6 [41] to constrain recovery indices
by hypothesized explanatory variables (i.e., initial exCa, exAl, base saturation and pH, C-horizon
initial exCa and pH, years between initial and final sampling [recovery years], initial SO4 2− deposition,
and SO4 2− deposition reduction rate) in ordinal space. RDA was chosen over other multivariate
ordination techniques because it is a hybrid of principal components analysis and multiple regression
that is based on linear relationships and therefore compliments hierarchical partitioning (HP) well [42].
HP was then run to assess which individual explanatory variables best explained differences in recovery.
HP was run for each recovery index using the hier.part package [43]. HP moves away from single
model inferences by calculating independent and joint contributions of each explanatory variable
based on the average of all possible model combinations [44]. The significance of the explanatory
variables independent contributions was calculated based on a negative log-likelihood randomization
test (n = 1000). Finally, correlations between key explanatory variables identified by HP and recovery
indices were plotted and assessed to identify the strength of the associations along with any potential
thresholds related to soil recovery. Prior to analyses, data transformations were applied to O, B and C
horizon initial exCa, O and B horizon initial exAl, and recovery years to meet normality assumptions
and reduce the influence of outliers. In addition, multicollinearity was assessed using the VIF function
in the car package [45]. Initial base saturation and exCa in the B horizon were the only explanatory
variables found to have potential problems with collinearity (VIF > 10). However, multicollinearity
is not a problem because HP separates out independent and joint contributions of each explanatory
variable [46], and when we ran RDA with and without B horizon initial base saturation, the results
were the same. Therefore, B horizon initial base saturation was kept in the RDA to maintain consistency
with HP.
3. Results
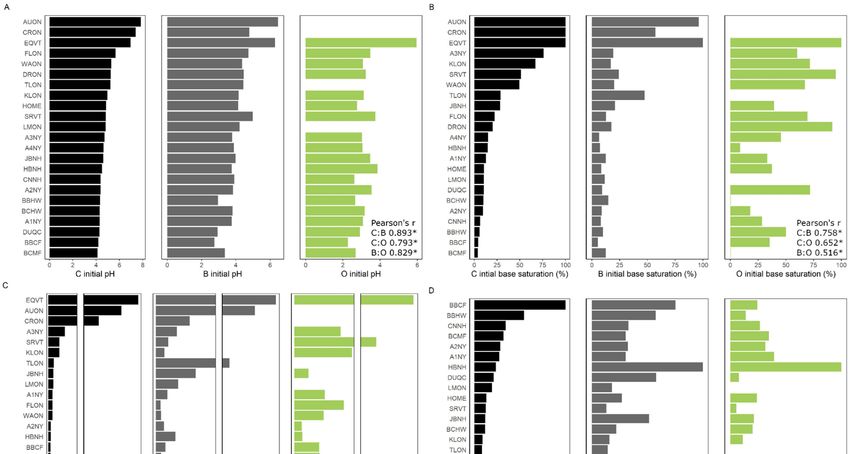
The 23 sites displayed a broad range in soil chemical properties with C horizon pH ranging from
4.12 to 7.83, base saturation from 4.1 to 100%, exCa from 0.02 to 12.9 cmolc ·kg−1 and exAl from less than
0.1 to 4.4 cmolc ·kg−1 (Figure 4). Chemical properties of B horizons at the initial sampling had similar
wide ranges, generally mirrored the C horizon site order from lowest to highest for each chemical
property and were significantly correlated to C horizon properties for pH (r = 0.893), base saturation
(r = 0.758), exCa (r = 0.810) and exAl (r = 0.659). Four sites (BBCF, DUQC, BCMF, BBHW) had initial B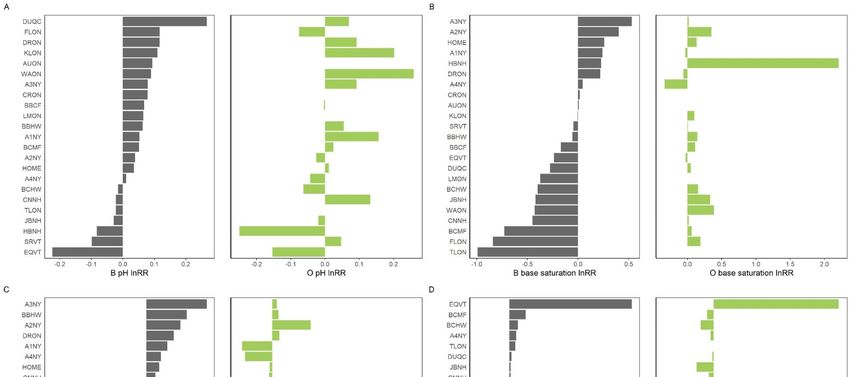
Soil Syst. 2020, 4, 54                                                                               9 of 22

horizon pH values less than 3.5 and two sites (AUON, EQVT) had initial pH values greater than 5.0
(Figure 4). Initial O horizon chemical properties were significantly correlated to C horizon properties
for pH (r = 0.793), base saturation (r = 0.652) and exCa (0.597) but to a lesser degree than the B horizon.
Initial O horizon exAl was not significantly correlated to C horizon exAl (r = 0.312). AUON, CRON
and EQVT sites consistently had the highest initial pH, base saturation and exCa, and the lowest exAl
for C, B and O horizons across all the sites (Figure 4). The B horizon at TLON had relatively high exCa
(3.8 cmolc ·kg−1 ) and base saturation (47.3%), and HBNH, DUQC and JBNH sites had higher exAl,
(5.6, 6.3 and 10.8 cmolc ·kg−1 , respectively), when compared to sites with similar C horizon chemistry.
      Recovery indices also showed a wide range of values across the study sites (Figure 5). Indices were
less than 0, indicating decreased exAl from the initial to final sampling in O and B horizon, for 95% and
65% of the study sites, respectively (Figure 5). Base saturation and pH recovery indices for O horizons
were positive for 79% and 58% of the sites, respectively, but this pattern reversed with B horizon base
saturation lnRR greater than 0 for 39% of the sites and pH lnRR greater than 0 for 70% of the sites.
ExCa recovery indices showed the least number of positive values for study sites with 42% and 48%
for O and B horizons, respectively.
      Site and soil variables explained 70.9% of the variability in O horizon soil chemical property
recovery indices (Figure 6). Redundancy analysis axis 1 (RDA1) explained 40.9% of the variation across
recovery indices and was most strongly loaded by O horizon initial exAl (+) and O horizon initial exCa
(−) (biplot scores > 0.5). Base saturation lnRR, and exCa lnRR were positively constrained by RDA1
across soil resampling sites, and exAl lnRR was negatively constrained. Redundancy analysis axis 2
(RDA2) explained 30.0% of the variation across recovery indices and was most strongly loaded by O
horizon initial pH (−). ExAl lnRR was negatively constrained and pH lnRR was positively constrained
by RDA2 across soil resampling sites. Independent contributions of each site and soil explanatory
variable for O horizon recovery indices based on hierarchical partitioning are shown in Figure 7.
Statistically significant contributions include O horizon initial exAl explaining the most variation in O
horizon exCa lnRR (41.5%) and base saturation lnRR (44.5%) (Figure 8). O horizon initial pH explained
the most variation in O horizon exAl lnRR (27.5%) and pH lnRR (42.6%). Recovery years was also
found to have a significant independent contribution to exAl lnRR (10.9%).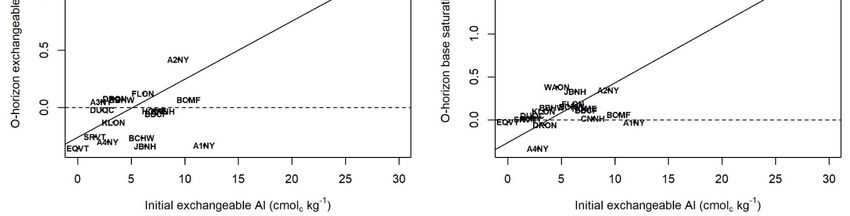
Soil Syst. 2020, 4, x FOR PEER REVIEW                                                                                                                                  10 of 23
Soil Syst. 2020, 4, 54                                                                                                                                                                     10 of 22

             4. (A) Initial
      Figure Figure  4. (A) pH,   (B)pH,
                             Initial  base
                                         (B)saturation, (C) exchangeable
                                              base saturation,             Ca andCa
                                                               (C) exchangeable    (D) exchangeable
                                                                                     and                Al in the
                                                                                          (D) exchangeable         C,the
                                                                                                               Al in  B and
                                                                                                                          C, BOand
                                                                                                                                horizons  for soil
                                                                                                                                    O horizons  forresampling  sites in
                                                                                                                                                     soil resampling     Eastern
                                                                                                                                                                      sites      Canada and
                                                                                                                                                                            in Eastern
      the Northeastern
             Canada and  United    States. Pearson’s
                            the Northeastern    Unitedr values  marked with
                                                        States. Pearson’s     * indicate
                                                                          r values       significance
                                                                                   significant at p < 0.05  < NS
                                                                                                       at por  0.05(not
                                                                                                                    or NS   (not significance).
                                                                                                                        significant).
Soil Syst.Soil
2020, 4,2020,
Syst. 54 4, x FOR PEER REVIEW 11 of 23 11 of 22
5. Recovery
FigureFigure indicesindices
5. Recovery (ln [final
(lnsampling/initial sampling])
[final sampling/initial for (A) for
sampling]) pH,(A)(B)pH,
base(B)
saturation, (C) exchangeable
base saturation, Ca and Ca
(C) exchangeable (D)and
exchangeable Al for the
(D) exchangeable AlBfor
andtheOBhorizons
for soiland
resampling sites
O horizons forinsoil
Eastern Canada
resampling andinthe
sites Northeastern
Eastern United
Canada and States.
the Northeastern United States.ExAl lnRR was negatively constrained and pH lnRR was positively constrained by RDA2 across soil
resampling sites. Independent contributions of each site and soil explanatory variable for O horizon
recovery indices based on hierarchical partitioning are shown in Figure 7. Statistically significant
contributions include O horizon initial exAl explaining the most variation in O horizon exCa lnRR (41.5%)
and base saturation lnRR (44.5%) (Figure 8). O horizon initial pH explained the most variation in O horizon
Soil Syst. lnRR4,(27.5%)
exAl2020, 54 and pH lnRR (42.6%). Recovery years was also found to have a significant independent 12 of 22
contribution to exAl lnRR (10.9%).
Figure
Figure 6. Redundancyanalysis
6. Redundancy analysisshowing
showing the
the relationship
relationship between
betweensoil
soilrecovery
recoveryindices (light
indices grey)
(light andand
grey)
explanatory
explanatory
Soil variables
Syst. 2020, 4, xvariables (black) for the O horizon of 19 soil resampling sites in Eastern Canada
(black) for the O horizon of 19 soil resampling sites in Eastern Canada and
FOR PEER REVIEW and the
13 the
of 23
Northeastern United States. Points (x) represent the soil resampling sites.
Northeastern United States. Points (x) represent the soil resampling sites.
Figure
Figure 7. Independentcontribution
7. Independent contribution (%)
(%) of
of each
each explanatory
explanatory variable
variableforforOOhorizon
horizon soilsoil
recovery indices
recovery indices
based
based onon hierarchical partitioning.
hierarchical partitioning. +/−+/−
signs denote
signs direction
denote of significant
direction contribution
of significant (p < 0.05) based
contribution (pSoil Syst. 2020, 4, x FOR PEER REVIEW 14 of 23
Soil Syst. 2020, 4, 54 13 of 22
Figure of
Figure 8. Correlation 8. Correlation
O horizon of(A)Oinitial
horizon pH(A)and
initial
pHpH and (B)
lnRR, pH initial
lnRR, (B)
pHinitial pH and
and exAl exAl(C)
lnRR, lnRR, (C) initial
initial exAlexCa
exAl and and exCa
lnRRlnRR
andand
(D) (D) initial
initial exAlexAl
andand
BSBSlnRR for 19 soil
lnRR for 19 soil resampling sites in Eastern Canada and the Northeastern United States.
resampling sites in Eastern Canada and the Northeastern United States.Soil Syst. 2020, 4, 54 14 of 22
Soil Syst. 2020, 4, x FOR PEER REVIEW 15 of 23
RDA1 and RDA2 axes of site and soil variables explained 63.2% of the variability in B horizon
soil chemical property recovery indices (Figure 9). RDA1 explained 32.5% of the variation across
recovery indices and was 2− deposition (+) (biplot scores > 0.5).
RDA1 and RDA2 axesmost
of sitestrongly
and soilloaded byexplained
variables initial SO63.2%
4 of the variability in B horizon soil
Base saturation
chemical lnRR
property and exCa
recovery lnRR
indices were9).
(Figure negatively constrained
RDA1 explained 32.5%by of RDA1 across across
the variation soil resampling
recovery
sites.
indicesRDA2 explained
and was 30.7% of
most strongly the variation
loaded by initialacross recovery indices
SO42− deposition and
(+) (biplot was >most
scores 0.5). strongly loaded
Base saturation
lnRR and exCa lnRR were negatively constrained by RDA1 across soil resampling
by B horizon initial exCa (+) and recovery years (−). ExAl lnRR was positively constrained and sites. RDA2 explained
30.7%
pH lnRRof the
wasvariation
negativelyacross recovery indices
constrained and was
by RDA2 mostsites.
across strongly loaded by B
Statistically horizon initial
significant exCa (+)
independent
and recovery years (−). ExAl lnRR was positively constrained and pH lnRR
2− was
contributions to B horizon recovery indices included initial SO4 deposition explaining the mostnegatively constrained by
RDA2 across sites. Statistically significant independent contributions to B
variation in B horizon exCa lnRR (46.7%) and base saturation lnRR (41.1%) (Figures 10 and 11). horizon recovery indices
included initial SO42− deposition explaining the most variation in B horizon exCa lnRR (46.7%) and base
B horizon initial base saturation had significant independent contributions to B horizon exAl lnRR
saturation lnRR (41.1%) (Figures 10 and 11). B horizon initial base saturation had significant independent
(23.2% highest contribution). Recovery years and initial pH were found to have significant independent
contributions to B horizon exAl lnRR (23.2% highest contribution). Recovery years and initial pH were
contributions to pH lnRR (30.1 and 28.2%, respectively) and recovery years was also associated with
found to have significant independent contributions to pH lnRR (30.1 and 28.2%, respectively) and recovery
exAl lnRR (19.8%).
years was also associated with exAl lnRR (19.8%).
Figure 9. Redundancy
Figure 9. Redundancy analysis showing the
analysis showing the relationship
relationshipbetween
betweensoil
soilrecovery
recoveryindices
indices(light
(lightgrey)
grey)and
and
explanatory variables
explanatory variables (black)
(black)for
for the
the BB Horizon
Horizon of of 23
23 soil resampling sites
soil resampling sites in
in Eastern
EasternCanada
Canadaand andthe
the
Northeastern United
Northeastern UnitedStates.
States.Points
Points(x)(x)
represent thethe
represent soilsoil
resampling sites.sites.
resamplingSoil Syst.
Soil 2020,
Syst. 4, x4,FOR
2020, 54 PEER REVIEW 16ofof2223
15
Figure 10. Independent contribution (%) of each explanatory variable for B horizon soil recovery indices
based on hierarchical partitioning. +/− signs denote direction of significant contribution (p < 0.05)
Figure 10. Independent contribution (%) of each explanatory variable for B horizon soil recovery indices
based on a negative log-likelihood randomization test (n = 1000).
based on hierarchical partitioning. +/− signs denote direction of significant contribution (p < 0.05) based on
a negative log-likelihood randomization test (n = 1000).
4. Discussion
A comparison of 23 sites in Eastern Canada and the Northeastern United States enabled an
4. Discussion
evaluation of acidification recovery by resampling forest soils from a broad range of forest types and
A comparison of 23 sites in Eastern Canada and the Northeastern United States enabled an evaluation
soil chemistries with a relatively consistent decrease in S deposition across the region. Across our
of acidification recovery by resampling forest soils from a broad range of forest types and soil chemistries
sampling sites, soil chemical changes indicating recovery from acidification were associated with initial
with a relatively consistent decrease in S deposition across the region. Across our sampling sites, soil
horizon chemistry to a greater degree than to the chemistry of the parent material.
chemical changes indicating recovery from acidification were associated with initial horizon chemistry to
An increase in pH from initial to final sampling in O and B horizons was associated with the
a greater degree than to the chemistry of the parent material.
initial pH of those horizons. For O horizons initial sampling pH ranged from 2.3 to 3.9 for 18 of the
An increase in pH from initial to final sampling in O and B horizons was associated with the initial
sites with the EQVT site having a pH of 6.0. Lower pH values resulted in increased pH at the final
pH of those horizons. For O horizons initial sampling pH ranged from 2.3 to 3.9 for 18 of the sites with the
sampling and using the regression relationship between initial pH and pH lnRR for our sites, O horizon
EQVT site having a pH of 6.0. Lower pH values resulted in increased pH at the final sampling and using
pHregression
the was recovering belowbetween
relationship a threshold initial
initial pH andpH of
pH3.5 (Figure
lnRR 8), and
for our sites,B O
horizon
horizonpH pHwaswas recovering
recovering
below a threshold initial pH of approximately 5.0 (Figure 11). While most of
below a threshold initial pH of 3.5 (Figure 8), and B horizon pH was recovering below a thresholdour data for both O initial
and
B horizons were in the lower end of these pH ranges, higher pH values for a few
pH of approximately 5.0 (Figure 11). While most of our data for both O and B horizons were in the lower sites included in
theofstudy
end theseprovide some
pH ranges, indication
higher of response
pH values for a few with
sitesless acidic initial
included soil conditions.
in the study provide someLong-term
indicationsoilof
monitoring programs in Europe executed across sites with a range of parent material
response with less acidic initial soil conditions. Long-term soil monitoring programs in Europe executed and soil pH
have shown
across soilapH
sites with increases
range over material
of parent similar resampling
and soil pH periods
have to our study
shown soil pHdueincreases
to decreasing
over acidic
similar
deposition. In Austrian forests, Jandl et al. [47] sampled soils in 1987 and again
resampling periods to our study due to decreasing acidic deposition. In Austrian forests, Jandl et al. in 2007 at 139 sites,
[47]
30% of the sites on calcareous bedrock and 70% on silicatic bedrock. Organic horizons
sampled soils in 1987 and again in 2007 at 139 sites, 30% of the sites on calcareous bedrock and 70% on (Oa+Oe [FH])
and upper
silicatic mineral
bedrock. soils showed
Organic horizonsincreases to a greater
(Oa+Oe [FH]) degree
and upper on thesoils
mineral moreshowed
acidic parent
increasesmaterial with
to a greater
the largest increase in the FH horizon. Kirk et al. [48] resampled the upper 15 cm of soil at 555 sites in
deciduous and coniferous woodlands in England and Wales from the late 19700 s to the early 20000 s,
a period with a 50% decrease in rainfall acidity. With an average resampling interval of 22 years they
showed that the largest pH increases were for soils where the initial distilled water pH was less thanSoil Syst. 2020, 4, 54 16 of 22
5.5. They noted that pH increases after declines in acidic deposition would not necessarily occur in
soils where acid buffering processes were dominated by carbonate dissolution (less than pH 7.0) or
cation exchange (pH 5.5 to 7.0), but more likely at pH values of less than 5.5 where dissolution of
aluminosilicate minerals is the primary weathering mechanism for increasing soil pH. An increase in
the number of recovery years was also linked to pH recovery in the B horizons of our study. The largest
increases in pH were in Ontario and Quebec, where sites were sampled 20 or more years after the
initial sampling. This result supports hypotheses related to acidification recovery and the results of
several long-term soil resampling studies that suggest that there will be a lag time between decreases
in acidic deposition and the recovery of soil chemical properties [25,48].
Our analyses showed an association between initial O horizon pH and the degree of soil recovery
as reflected by exAl concentrations. Sites with more acidic O horizons showed decreased exAl and the
threshold pH where exAl decreased from initial to final sampling was 3.5, similar to the threshold for
increasing O horizon pH (Figure 8). This relationship is not unexpected as organic matter solubility
would increase with the decreases in deposition and previously complexed Al would be available to
leach deeper into the soil profile decreasing O horizon exAl. The increase in organic matter solubility
in the O horizon has been attributed to increased pH [26], but may be more a function of decreased
ionic strength, which has also occurred with decreased deposition levels. In that process, pH increases
in the lower pH soils could be driven by increased H+ consumption by weak organic anions exposed
as organic matter disaggregated [49]. In essence, the relationships of initial O horizon pH to pH and
exAl recovery indices are coupled, based on chemical changes in this horizon resulting from reduced
deposition. As with the O horizon pH lnRR relationship, the EQVT site provided a higher pH value
than the other sites, which in this case showed the only increase in exAl. While the chemical explanation
for this trend seems plausible and we have no reason to remove the EQVT site from our analysis,
it is worth noting that it is driving the relationship between initial pH and exAl lnRR. When the
EQVT point was excluded the relationship becomes negative and non-significant. Thin O horizons at
two other sites (AUON and CRON) with high initial B and C horizon pH, base saturation and exCa,
and low exAl similar to EQVT, were not able to be sampled. Additional O horizon data with initial
pH values between 4 and 6 would be useful to validating this relationship. For B horizons, the initial
horizon base saturation was the key variable to determining exAl response to decreasing deposition.
According to the initial base saturation and exAl recovery index regression relationship for our study
sites (Figure 11), B horizons with less than 20% initial base saturation showed recovery with decreases
in exAl. The identification of this threshold supports the results of Lawrence et al. [26], who noted
the dynamic nature of Al in low base saturation B horizons due to the shift from Ca to Al dominance
of soil cation exchange capacity below 20% base saturation [50]. The sites with low base saturation
B horizons that were more predisposed to increased Al mobilization due to increased precipitation
acidity appear to be the sites that are exhibiting the greatest decrease in exAl as precipitation acidity
has decreased. The influence of the high initial base saturation and large increase in exAl at the EQVT
site with resampling was strongly influencing this relationship. Removal of this site from the analysis
resulted in a significant negative relationship between B horizon initial base saturation and exAl lnRR.
Similar to the EQVT initial O horizon pH, we believe that the B horizon chemistry at this site provides
insight into soil chemistry changes at sites that represent the high end of the range in initial soil
chemical properties across this region. Regardless, as reported by Lawrence et al. [26] most of the sites
in our study with initial base saturations less than 20% were experiencing recovery with decreases in B
horizon exAl. As with B horizon pH, an increase in the number of recovery years also led to greater
recovery with decreased B horizon exAl.Soil Syst.Soil
2020, 4, 54
Syst. 2020, 4, x FOR PEER REVIEW 18 of 23 17 of 22
Figure 11. Correlation
Correlation of B horizon
of B horizon (A) initial
(A) initial pH and pH pH
andlnRR,
pH lnRR, (B) initial
(B) initial BS and
BS and exAlexAl lnRR,
lnRR, (C) (C) initial
initial SOSO 2− 2− depositionand
andexCa
exCalnRR
lnRR and (D) initial SO4 2−
and (D)
Figure 11. 4 4 deposition
SO4 and
deposition 2− deposition
BS lnRR and BSsoil
for 23 lnRR for 23 soil sites
resampling resampling sitesCanada
in Eastern in Eastern
andCanada and the Northeastern
the Northeastern United States.
United States.Soil Syst. 2020, 4, 54 18 of 22
Initial O horizon exAl was the primary explanatory variable associated with exCa and base
saturation recovery indices across our study sites. Initial exAl values above a threshold value of
approximately 5 cmolc ·kg−1 resulted in increases in exCa from initial to final sampling. The parallel
relationship of initial exAl to base saturation can be partly attributed to increases in exCa and previously
discussed decreases in O horizon exAl. The HBNH site had an extremely high initial exAl concentration
(29.9 cmolc ·kg−1 , range of other sites 0 to 12 cmolc ·kg−1 ) and the largest increase in exCa and base
saturation at the final sampling. The high initial exAl at HBNH facilitated the development of soil
recovery response relationships across a broader range of soil chemical properties than represented by
the other sites. When the HBNH site was removed from the analysis, these relationships remained
positive but became non-significant. Most previous forest soil resampling studies in this region were
executed at sites with exAl concentrations either below or just above the 5 cmolc ·kg−1 recovery threshold
determined from the regression relationship for our sites, and in most cases, these resampling studies
reported no increases in exCa or base saturation. McHale et al. [51] found no exCa or base saturation
recovery for O horizons that had initial exAl of 3.3 and 4.3 cmolc ·kg−1 at two watersheds in the Catskills
region of New York that were resampled in the early 20100 s. Siemion et al. [28] did show increased
exCa at the non-glaciated Young Womens Creek site in Pennsylvania (initial exAl 3.2 cmolc ·kg−1 )
but no recovery trends for two other sites in New York and New Hampshire (initial exAl 3.3 and
3.1 cmolc ·kg−1 , respectively). They attributed greater recovery at Young Womens Creek to higher initial
atmospheric deposition S and N concentrations at this site and a sampling time frame that spanned the
period from the highest to lowest deposition. In contrast to these two studies, Lawrence et al. [25]
resampled soils in red spruce stands at six sites across the Northeastern United States with initial
O horizon exAl concentrations that were all above our recovery threshold of 5 cmolc ·kg−1 , ranging
from 5.8 to 8.0 cmolc ·kg−1 . Only one of the six sites, with an initial O horizon exAl concentration of
6.4 cmolc ·kg−1 , showed significant increases in O horizon exCa and base saturation from 1992/1993 to
2004. Largely due to the coniferous canopies, all of these sites had relatively deep forest floor horizons
that generated large amounts of natural organic acidity that may have slowed recovery responses.
This was recently determined to be the reason for slowed recovery at the BCMF site in a related
study [52]. Overall, these results for exCa and base saturation are similar to those for pH and exAl
recovery in that O horizons with initially more acidic soil chemical properties were shown to recover
to a greater degree than less acidified O horizons.
An explanation for the negative relationship between B horizon recovery of exCa concentrations
and base saturation with initial site SO4 2− deposition is unclear. Sites with an initial SO4 2− deposition
of less than approximately 16 kg SO4 2− ha−1 showed increased exCa and base saturation at the final
sampling (Figure 11). One possibility is that greater recovery was occurring at sites where SO4 2−
deposition was on a downward trajectory prior to the initial sampling, and the sampling period
coincided with the continuing soil recovery, or perhaps even corresponded to an enhanced recovery
stage. An example of this situation included the A1NY, A2NY and A3NY sites which were not sampled
until 2004, when SO4 2− deposition had declined from a high of 25 kg SO4 2− ha−1 in the early 19800 s to
an average of 13.4 kg SO4 2− ha−1 for the four years prior to initial sampling. This explanation does not
seem applicable to the two sites with the lowest initial SO4 2− deposition, DRON and HOME (6.4 and
12.5 kg SO4 2− ha−1 , respectively) that were first sampled in 1985 and 1992, respectively. One would
expect that these sites located at the western and eastern edges of our study range, outside of the
areas of highest regional acidic deposition, would have been influenced to a lesser degree in terms
of changing soil properties due to acidification. A second possibility relates to the lag time between
recovery of B horizon exCa and base saturation and decreases in acidic deposition. It is plausible
that even with consistent declines in SO4 2− deposition across all sites, sites with the highest initial
deposition are taking longer to recover. This finding seems to support and reinforce the interpretation
by Lawrence et al. [26] that the redistribution of Ca by biocycling from B horizons to surface organic
horizons, limiting B horizon recovery, may be a component of the first stage of forest soil recovery.
It remains to be seen, if at the current rates of deposition, mineral weathering will eventually lead toSoil Syst. 2020, 4, 54 19 of 22
increased base cation concentrations in the deeper part of the soil profile as projected by the conceptual
model of acidification recovery.
The lack of prediction value of the parent material chemistry in our study does not necessarily
indicate that parent material is not of primary importance to the potential for recovery. In these
relatively young and coarse textured soils, the C horizon extractable chemistry (pH and salt-extractable
cations) is mostly controlled by organic matter present in the lower soil profile [53] and not necessarily
reflective of mineral weathering or other processes that control the acid and base cation release so
important to recovery from acidification. Further, the role of hydrological pathways and the movement
of weathering products into the solum has been shown to be an integral factor in recovery, with soils
influenced by shallow groundwater contributions from upslope showing greater recovery than soils
influenced only by vertical soil water percolation [29]. Nutrient cycling processes related to forest
type and age such as litterfall, fine root decomposition and N retention are other factors that could
play a role in soil acidification recovery [25,26] were not considered in our study. While parent
material mineralogy, hydrological pathways and nutrient cycling processes could be better predictors
of acidification recovery, these types of information are currently not readily available for many research
sites such as those in our study or available generally across forest landscapes in this region.
5. Conclusions
Our soil resampling study identified key site and soil factors that were associated with forest
soil recovery from acidification caused by atmospheric deposition in the Northeastern United States
and Eastern Canada. We had anticipated that C horizon soil chemical properties such as pH and
exCa concentrations would be associated with soil recovery indices, but our results indicated that
soil chemical properties of O and B horizons at the initial sampling time were better predictors of soil
response to declining deposition. More acidified O horizons with higher exAl concentrations and
lower pH values showed increased exCa, base saturation and pH, and decreased exAl concentrations
over the range of recovery years for sites in our study. B horizon acidification recovery was associated
with low initial B horizon pH and base saturation but also to initial site SO4 2− deposition and the
number of recovery years between the initial and final sampling. Using the broad range of soil chemical
properties across our study sites, we were able to explore empirical recovery thresholds. O horizons
with initial pH values less than 3.5 and exAl concentrations less than 5 cmolc ·kg−1 , and B horizons with
initial pH values less than 5.0, base saturations less than 20% and initial site SO4 2− deposition less than
16 kg·ha−1 showed recovery. All of these results suggest that soils that would be considered to have low
buffering capacity and seemingly have a reduced potential for recovery have the resilience to recover
from the effects of previous high levels of acidic deposition. Further, the results of our study indicate
that predictions of where forest soil acidification reversal will occur across the landscape should be
refined to acknowledge the importance of upper soil profile horizon chemistry rather than only parent
material characteristics. That commonly measured upper horizon chemistry provides a good predictor
of recovery is very useful as it can be broadly applied. Continued forest soil resampling studies
and re-measurement of chemical properties are necessary to track ecosystem response to changing
deposition and to evaluate the efficacy of pollution control policy.
Author Contributions: Conceptualization, P.H., C.E., G.L., I.F., R.O. and S.B.; Data curation, P.H., C.E., G.L., I.F.,
R.O. and S.B.; Formal analysis, P.H. and C.E; Funding acquisition, P.H., G.L., I.F., R.O. and S.B.; Methodology, P.H.,
C.E., G.L., I.F., R.O. and S.B.; Writing—original draft, P.H. and C.E; Writing—review & editing, P.H., C.E., G.L., I.F.,
R.O. and S.B. All authors have read and agreed to the published version of the manuscript.
Funding: Funding was provided by Natural Resources Canada−Canadian Forest Service, the New York State
Energy Research and Development Authority and the U.S. Geological Survey. Additional funding for the soil
resampling was provided by Northeastern States Research Cooperative through a grant to the Northeastern Soil
Monitoring Cooperative (http://www.uvm.edu/~{}nesmc/index.html).
Acknowledgments: We thank Mark David, University of Illinois, for providing archived soil samples,
and James Shanley, U.S. Geological Survey, for facilitating sampling at Sleepers River, VT. We also thank
the Equinox Preservation Trust for permission to sample at Mount Equinox, VT. The Hubbard Brook ExperimentalYou can also read