EVALUATING OCCUPATIONAL EXPOSURES AND WORK PRACTICES AT GOLD COAST INGREDIENTS, INC. COMMERCE, CA
←
→
Page content transcription
If your browser does not render page correctly, please read the page content below
EVALUATING OCCUPATIONAL EXPOSURES

               AND WORK PRACTICES

                              AT

        GOLD COAST INGREDIENTS, INC.
              COMMERCE, CA

              A Technical Assistance Report to the
   California/Occupational Safety and Health Administration

                  REPORT WRITTEN BY:
           Lauralynn Taylor McKernan ScD, CIH 1
                Kevin H Dunn MSEE, CIH 2

                       REPORT DATE:
                        January, 2008

                     REPORT NUMBER:
                     HETAB20060361-1

U.S. DEPARTMENT OF HEALTH AND HUMAN SERVICES
                     Public Health Service
          Centers for Disease Control and Prevention
     National Institute for Occupational Safety and Health
Division of Surveillance, Hazard Evaluation, and Field Studies 1
        Division of Applied Research and Technology 2
           4676 Columbia Parkway, Mail Stop R-14
                 Cincinnati, Ohio 45226-1998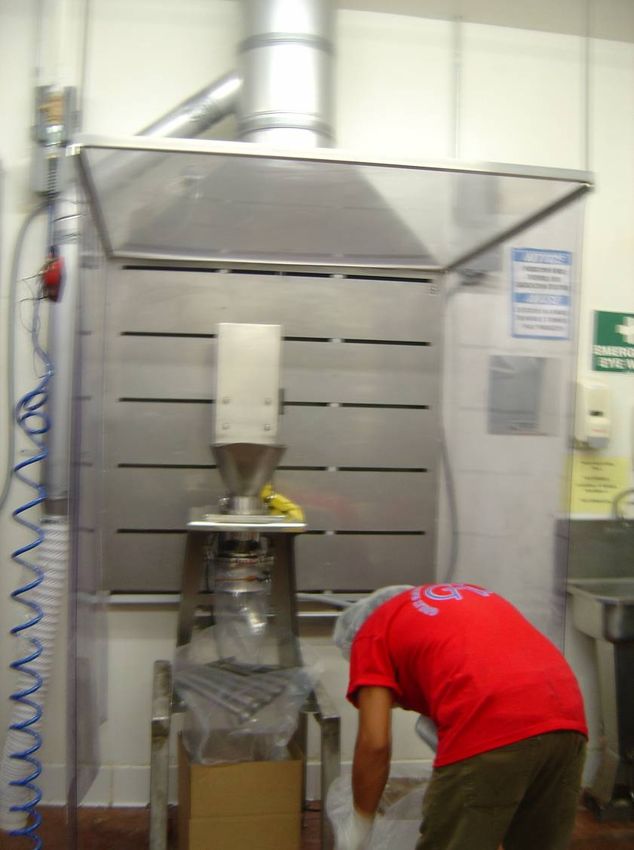
SITE SURVEYED:                 Gold Coast Ingredients, Inc.
                               Commerce, CA

NAICS CODE:                    311

SURVEY DATES:                  November 14-16, 2006;
                               July 10-12, 2007

SURVEYS CONDUCTED BY:          November 14-16, 2006:
                               Lauralynn Taylor McKernan, NIOSH
                               Kevin H Dunn, NIOSH
                               Chad H. Dowell, NIOSH
                               Brian Curwin, NIOSH
                               Alberto Garcia, NIOSH

                               July 10-12, 2007:
                               Lauralynn Taylor McKernan, NIOSH
                               Kevin L. Dunn, NIOSH
                               James Couch, NIOSH

EMPLOYER REPRESENTATIVES       Jon Wellwood
    CONTACTED:

                           2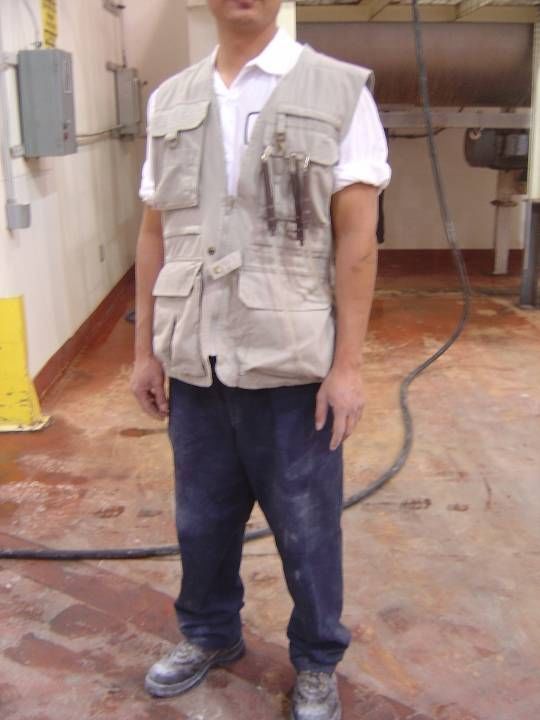
DISCLAIMER

Mention of company names or products does not constitute endorsement by the Centers for
Disease Control and Prevention.

The findings and conclusions in this report are those of the authors and do not necessarily
represent the views of the National Institute for Occupational Safety and Health.

                                                3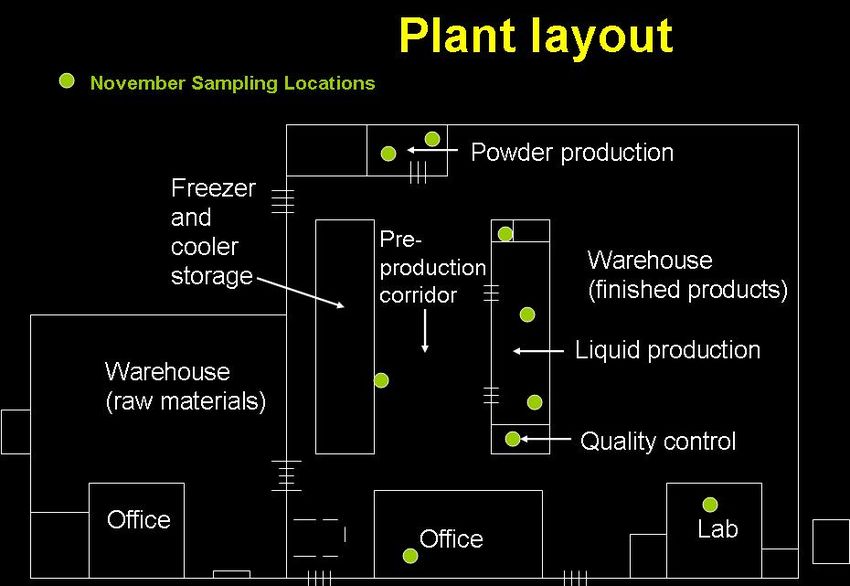
Table of Contents

  i.     Introduction…………………………………………………………………                                    4
 ii.     Materials and Methods……………………………………………………                                8
iii.     Results………………………………………………………………..…                                       18
iv.      Discussion………………………………………………………………….                                     25
 v.      Recommendations…………………………………………………………                                    28
vi.      Acknowledgements ………………………………………………………                                   33
vii.     References…………………………………………………..……..……                                    34

      TABLES
         Table 1. Sampling and Analysis Table……………………………………                       36

         Table 2. Relevant Occupational Exposure Limits …………………………                38

         Table 3. November Site Visit 8-hr TWA Descriptive Statistics……………        39

         Table 4. November Visit Descriptive Statistics by Work Area …………...      40

         Table 5. November Site Visit Task Based Sampling ……………….……..             43

         Table 6. July Two-hour Time Weighted Average Descriptive Statistics…..   45

         Table 7. July Visit Descriptive Statistics by Work Area …………………...       46

         Table 8. Task-Based Sampling July Site Visit ………………….……..…..             48

         Table 9. Compounds Observed in Thermal Desorption Results …………..         51

                                                  4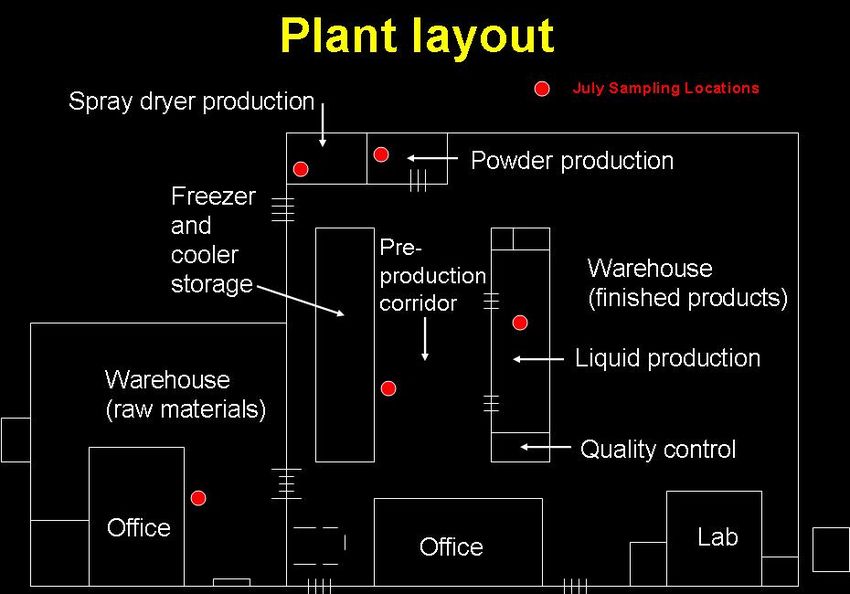
FIGURES

  Figure 1. Sample Locations November Site Visit…………………………… 55

  Figure 2. Sample Locations July Site Visit………………………..………… 56

  Figure 3. Personal Sampling…………………………………………………. 57

  Figure 4. Area Sampling……………………………………………………... 58

  Figure 5. Total Dust and VOC Concentrations in Powder Production Area..    59

  Figure 6. Pre-Production Corridor VOC Concentrations……………………. 60

  Figure 7. Liquid Production Room VOC Concentrations…………………… 61

  Figure 8. Powder Production Room VOC Concentrations………………….                62

  Figure 9. Packaging of butter flavored powder in the ventilated booth…….   63

                                            5
Introduction
In response to a technical assistance request from California Division of Occupational Safety and
Health (Cal/OSHA) in 2006, researchers from the National Institute for Occupational Safety and
Health (NIOSH) conducted site visits of Gold Coast, Inc. at their Commerce, California plant on
November 14-16, 2006 and July 11-12, 2007. Gold Coast is participating in the Flavoring
Industry Safety and Health Evaluation Program (FISHEP), a voluntary special emphasis
program. This program was initiated by the California Department of Health Services (CDHS)
and the California Division of Occupational Safety and Health (Cal/OSHA) in 2006 to identify
workers with flavoring-related lung disease such as bronchiolitis obliterans (BO) and institute
preventive measures in the California flavoring industry. Under FISHEP, companies must report
the results of worksite industrial hygiene assessments to CDHS, and implement control measures
recommended by Cal/OSHA. This site report was conducted as the result of a formal technical
assistance request on occupational exposures to potentially hazardous chemicals in the
manufacturing of food flavors.
Due to the high volumes of diacetyl used, this site was selected for inclusion in this investigation
at the specific request of Cal/OSHA. The objectives of the industrial hygiene surveys conducted
included identifying common work tasks, plant processes, and procedures as well as
characterizing potential occupational exposures within the flavoring industry. A secondary goal
was to provide preliminary engineering control guidance, which has been addressed in other
correspondence[1, 2].
6Process Description
The Gold Coast Ingredients, Inc. is a wholesale flavors and color manufacturer. The company
produces over 1,500 flavors in liquid, powder, spray dried, natural, natural and artificial, or
artificial forms[3]. In October 2006, Gold Coast Ingredients, Inc employed production workers
in areas such as the liquid production room, spray drying room, pre-production corridor and
powder production room.
Flavors are produced by compounding ingredients identified on recipes on computer batch
tickets. These tickets identify the order and quantity of ingredients which need to be added to
make a flavor formulation. High priority chemicals, i.e. substances that may pose a respiratory
hazard as designated by the Flavoring Extract and Manufacturing Association[4], are identified
and appropriate respiratory protection is also highlighted on the batch ticket. Some chemicals,
such as diacetyl, are cold-stored to reduce volatility during use.
Exposures vary dramatically depending upon the flavor formulations completed on a particular
day. An employee can make numerous flavor formulations daily depending upon the size and
complexity of a batch order. It was not unusual to observe at least 7 different batches being
compounded concurrently by different employees in the production areas. The majority of
flavors manufactured are on an as ordered basis, with little advance notice.
Liquid Flavor Production
The liquid production area typically consists of a total of 17 stationary or mobile open tanks for
mixing liquid flavoring ingredients ( Figure 1). There were 4 tanks greater than 4 feet in
7diameter and 13 tanks smaller than this size. There were several small and medium mobile tanks
which were moved throughout the facility according to need of the batch or formulation.
Employees typically pour and mix small quantities of flavoring ingredients on top of a bench top.
Employees complete large pours, near the large open tanks often pouring directly into the tank.
The liquid room is served by a combination of general exhaust and supply ventilation registers
located on the ceiling of the room. There are six air registers located in the room overall.
Measurements of the flow from each register showed that two were exhausting air at a combined
flow rate of 980 cubic feet per minute (cfm), one was supplying air at a rate of 1300 cfm, and
three were not moving air at all. In addition to general ventilation, there was a fume canopy
exhaust hood over two mixing tanks which exhaust air when the fan was activated. These tanks
are heated and used to produce flavored fruit fillings.
Following the initial survey in November 2006, recommendations on the design and
implementation of engineering controls were provided to the company in a letter, dated February
7, 2007. A new local exhaust ventilation system was developed and installed in the liquid
production room by Gold Coast in conjunction with a contractor. These controls were installed
during the May-June 2007 timeframe and consist of two main types of local exhaust ventilation
hoods. The first type is a ventilated bench-top, back draft slotted hood used to control worker
exposure to chemicals during small batch mixing, weighing and pouring activities which
comprise a majority of the workday. Overall, five bench-top ventilated workstations were
installed in the liquid compounding room. The second hood type is a small booth hood which
allows for the rolling in of large kettles. The primary function of this hood is to collect chemical
vapors when the worker is pouring flavoring ingredients into the large mixers and to contain
8evaporative losses when a flavor is being mixed. However, this hood was also observed being
used during the packaging of powder flavorings. A total of three of these hoods were installed in
the liquid compounding room.
Powder Flavor Production
Powders or pastes were typically mixed within ribbon industrial blenders in the powder
production room. In these mixers, a starch or carbohydrate was combined with a liquid or paste
flavoring agent. The mixing process was a source of potential exposures with visible airborne
dust depending upon the work practices employed during pouring, mixing and packaging. The
powder production room and the two spray-drying areas were substantially smaller than the
liquid production room. The powder compounding area consisted of 2 blenders, both outfitted
with local exhaust ventilation. Both blenders were located on platforms with fixed ladders used
for access. The smaller blender was 5 feet 6 inches (length) x 2 feet 8 inches (wide) and was
outfitted with a canopy-type exhaust hood. The larger blender was 8 feet (length) x 3 feet 6
inches (wide) and outfitted with a slotted exhaust hood located about 8 feet above the platform
and behind the work platform. There was no supply air directly provided to the powder
compounding room. Airflow into the room comes solely from infiltration from the warehouse
area through the 10 feet x 10 feet door opening and a 15 inch x 15 inch vent opening located
about 11 feet above the floor. The vent is open to the warehouse area.
Spray Drying Production
Adjacent to the powder blending room, the spray dryer production room contained three spray
dryers (one large and one medium stationary spray dryer, and one mobile spray dryer). Inside a
spray dryer, a slurry compound is infused with a flavor, which is converted to encapsulated
9particles. Many volatile compounds are encapsulated in an amorphous carbohydrate, producing
more stable products with more manageable properties. Release of the flavor from the
encapsulated particle is generally fast and complete upon contact with moisture.[5]
Weighing and measuring of flavoring ingredients can occur at various locations throughout the
production room, usually near the mixing tank or blender that will be used to produce the final
product. It was noted that, for the most part, workers were assigned to either liquid, powder, or
spray drying flavoring processes.
Materials and Methods
Information on processes and procedures was obtained through discussions with management and by
observation of the processes. Prior to the site visit, the management provided production quantities for
chemicals identified as ‘high priority’ by FEMA. This information was used to refine the sampling
scheme used by investigators. Use of personal protective equipment, and work practices were also
observed during site visits.
The primary objective of the November survey was to comprehensively characterize worker exposures in
the production areas. The objective of the July survey was to again document occupational exposures, but
with alternate sampling methods for diacetyl. Characterization of the workplace environment was
accomplished through the use of personal, area, and task based air sampling methods (see figures 1 and 2
for facility layout and sample locations). In November, personal and area air samples were collected for
various processes at a number of locations throughout the facility including: liquids, powders, pre
production corridor, quality assurance, office administration and research and development locations. Air
samples were collected for diacetyl, acetoin, total and respirable particulates, acids (phosphoric, butyric,
10acetic and propionic) and five specific aldehydes (2-furaldehyde, acetaldehyde, benzaldehyde,
isovaleraldehyde, and propionaldehyde). In July, area air measurements were collected in liquids,
powders, pre-production corridor, distribution warehouse and spray drying locations for diacetyl, acetoin
and five specific aldehydes (2-furaldehyde, acetaldehyde, benzaldehyde, isovaleraldehyde, and
propionaldehyde). Relative humidity and temperature measurements were collected using HOBO Pro
Model H08-032-08 temperature and humidity dataloggers (Onset Computer Corp., Bourne, MA) in all
area locations. Table 1 lists the sample type, flow rate, and standard methods utilized during the
November and July site visits. Figure 1 and Figure 2 display sample locations for the November and July
site visits, respectively. All sampling pumps were calibrated in accordance with the sampling methods
utilized. Pump calibration was conducted using a Bios Drycal DC-LITE , Model DCL-M primary flow
standard (BIOS, Butler, NJ). Additional air monitoring equipment used during the survey was within their
calibration periods, and checked for accuracy for the contaminant of interest before being used to collect
field measurements.
Personal Air Sampling
November Site Visit
During the November site visit, eight-hour time weighted average (TWA) personal air samples
were collected over three consecutive days on almost all of the employees (9 of 13) assigned to
work in the liquid and powder production areas. Personal samples were collected for ketones,
acids, and aldehydes using calibrated battery-powered personal sampling pumps (SKC Inc.,
Model 210-1002, Eighty Four, PA) with appropriate sampling media for the contaminant of
interest (Table 1, Figure 3). Diacetyl and acetoin samples were collected using carbon molecular
11sieve media at a flowrate of approximately 0.1 liters per minute and were analyzed according to
NIOSH method 2557. Acid samples were collected with silica gel media (200mg/400mg) at a
flowrate of approximately 0.2 liters per minutes and were analyzed according to draft NIOSH
method 5048 (acetic, butyric and propionic) or NIOSH method 7903 (phosphoric acid).
Aldehyde samples were collected using dinitrophenylhydrazine (DNPH) treated silica gel media
at a flowrate of approximately 0.1 Liters per minute and were analyzed according to EPA TO-11
method. Employees working in the powder production room were also sampled for an Eight-
hour TWA for respirable dust using the model GK 2.69, personal cyclone sampler (BGI ,
Waltham, MA.) mated with an Airchek 2000 personal sampling pump at a flowrate of
approximately 4.2 Liters per minute (SKC Inc., Eighty Four, PA). Respirable dust samples were
analyzed according to NIOSH method 0600.
July Site Visit
Personal 8-hour TWA sampling was not conducted during the July site visits.
During both the July and November site visits, short duration task-based air sampling was also
conducted for ketones, aldehydes or acids using appropriate sampling media and calibrated
pumps to obtain measurements of exposure during selected short-term procedures. Task-based
samples were collected during particular tasks (i.e pouring or mixing) or during batch
formulations which contained higher quantities of ketones, acids or aldehydes. Samples were
collected for the duration of a pouring task (diacetyl, ketones or acids), or the entire duration of a
mixing batch formulation depending on the overall length of the process. Video exposure
monitoring was conducted for select tasks or work practices that were anticipated to produce
elevated airborne concentrations (i.e., increased potential for inhalation exposures) during both
12November and July site visits. Video monitoring consisted of filming the task or work process
of interest, while simultaneously measuring the workers inhalation exposure to volatile organic
compounds (VOCs) in real time using a MiniRAE 2000 or ToxiRAE photoionization detector
(PID) (Rae Systems, Inc., Sunnyvale, CA).
Area Air Sampling
November Site Visit
In November, area samples were also collected in various locations in the plant, including the
administration office, pre-production corridor, quality-control area, and research and
development laboratory (Figure 1) to map contaminant concentrations. Eight-hour time weighted
average (TWA) area air samples were collected over three consecutive days for ketones (diacetyl
and acetoin), aldehydes (acetaldehyde, benzaldehyde, isovaldehyde, 2-furaldehyde,
propionaldehyde) and acids (acetic, butyric, proprionic and phosphoric). Area samples for
diacetyl were collected according to the NIOSH method 2557 and a modified U.S. Department
of Labor, Occupational Safety and Health Administration (OSHA) Method PV2118. This
modified OSHA method used larger collection tubes (400/200 milligram silica gel tubes) which
have greater collection capacity and minimize breakthrough of contaminant to the backup tube.
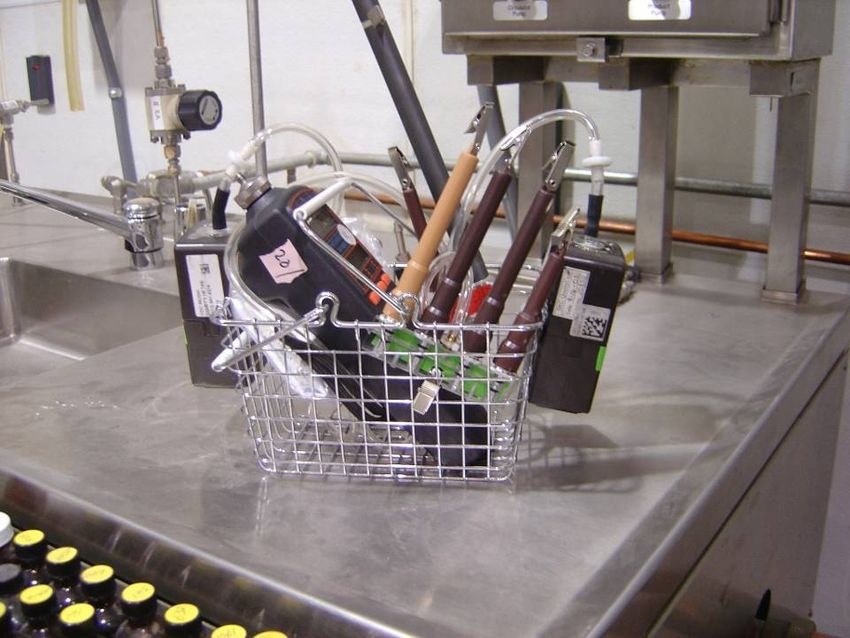
All area sample collection devices were housed inside a metal basket, which was located near
employee work stations (Figure 4 ). Respirable dust and total dust samples were also collected
in the powder production areas. Respirable dust samples were collected using a BGI cyclone at a
flowrate of 4.2 liters per minute (lpm). Real-time VOC concentrations were measured in
selected area baskets using MiniRAE 2000 and ToxiRAE photoionization detectors (PID) (Rae
Systems, Inc., Sunnyvale, CA). PIDs were programmed to log volatile organic compound
13(VOC) concentrations every minute. The PIDs were calibrated for isobutylene and could detect
isobutylene equivalent VOC concentrations from 1 ppm to 2000 ppm.
Thermal desorption samples were collected at all area locations for approximately two hours
each day. The stainless steel thermal desorption tubes contained three beds of sorbent material:
the first section contains Carbopack Y (90 mg), the second section contains Carbopack B (115
mg) and the last section contains Carboxen 1003 (150 mg). The thermal tube sorbents were run
for approximately 2 hours at a flowrate of 0.1 liters per minute and were analyzed according to
NIOSH method 2549. These samples provided both a qualitative and a semi-quantitative
analysis of volatile organic compounds in the work environment.
Area real-time dust concentrations were monitored in the powder production room on one day
using the Model PDR-1000An/1200 Personal DataRams® (PDR) (Thermo Electron Corporation,
Franklin, MA). These monitors were calibrated at the factory using SAE Fine (ISO fine)
powder with a mass median aerodynamic particle diameter of 2-3 um and a bulk density of 2.6-
2.65 g/cm3. Each monitor was set to log dust concentrations every minute throughout the
sampling period.
July Site Visit
In July, area samples were collected in various sampling locations in the plant, including the
powder production area, liquid production area, pre-production corridor, spray dry room and
distribution warehouse (Figure 2). Two-hour TWA area air samples were collected over two
consecutive days for ketones (diacetyl and acetoin) and aldehydes (acetaldehyde, benzaldehyde,
14isovaldehyde, 2-furaldehyde, propionaldehyde). All ketone (diacetyl/acetoin) samples were
collected over approximately two hours at a flow rate of 0.05 LPM using a modified OSHA
Method PV2118. (Since select OSHA results from the November site visits exhibited
breakthrough of the front tube due to extended sampling volumes, the volumes were reduced in
July.) Aldehyde samples were also run for two hours at a flowrate of 0.2 liter per minute and
were analyzed according to EPA TO-11. Additional details on the industrial hygiene sampling
methods used during this survey are provided in Table 1.
After the November site visit was complete, a laboratory investigation indicated that the
NIOSH method for diacetyl was affected by relative humidity, resulting in an underestimation of
true concentrations. A NIOSH project is currently underway and chamber studies of generated
atmospheres are planned to investigate the extent of this phenomenon and determine at what
relative humidity levels it occurs.
Statistical Analyses
Laboratory reports provided sample results in micrograms (µg) of analyte per sample.
Analytical results were converted to an airborne concentration by dividing by the air volume
associated with the sample (mg/m3), then converting to parts per million (ppm) by volume
standard temperature and pressure using the gram molecular weight of the analyte at standard
temperature and pressure. All calculations to determine airborne concentrations, and provide
descriptive statistics were conducted using SAS (SAS 9.1.3, SAS Institute, Cary, NC). Sampling
results that were below the limit of detection for the sampling methods used were assigned a
15value of one-half of the airborne concentration limit of detection (LOD) for statistical analyses
[6].
Applicable Occupational Exposure Limits (OELs)
In evaluating the hazards posed by workplace exposures, NIOSH investigators use both
mandatory (legally enforceable) and recommended occupational exposure limits (OELs) for
chemical, physical, and biological agents as a guide for making recommendations. OELs have
been developed by Federal agencies and safety and health organizations to prevent the
occurrence of adverse health effects from workplace exposures. Generally, OELs suggest levels
of exposure to which most workers may be exposed up to 10 hours per day, 40 hours per week
for a working lifetime without experiencing adverse health effects. However, not all workers will
be protected from adverse health effects even if their exposures are maintained below these
levels. A small percentage may experience adverse health effects because of individual
susceptibility, a pre-existing medical condition, and/or a hypersensitivity (allergy). In addition,
some hazardous substances may act in combination with other workplace exposures, the general
environment, or with medications or personal habits of the worker to produce health effects even
if the occupational exposures are controlled at the level set by the exposure limit. Also, some
substances can be absorbed by direct contact with the skin and mucous membranes in addition to
being inhaled, thus contributing to the overall exposure.
Most OELs are expressed as a time-weighted average (TWA) exposure. A TWA refers to the
average exposure during a normal 8- to 10-hour workday. Some chemical substances and
physical agents have recommended short-term exposure limits (STEL) or ceiling values where
there are health effects from higher exposures over the short-term. Unless otherwise noted, the
16STEL is a 15-minute TWA exposure that should not be exceeded at any time during a workday,
and the ceiling limit is an exposure that should not be exceeded at any time.
In the U.S., OELs have been established by Federal agencies, professional organizations, state
and local governments, and other entities. Some OELs are legally enforceable limits; others are
recommendations. The U.S. Department of Labor OSHA PELs [29 CFR 1910 (general industry);
29 CFR 1926 (construction industry); and 29 CFR 1917 (maritime industry)] are legal limits that
are enforceable in workplaces covered under the Occupational Safety and Health Act. NIOSH
recommended exposure limits (RELs) are recommendations that are made based on a critical
review of the scientific and technical information available on the given hazard and the adequacy
of methods to identify and control the hazards. NIOSH RELs can be found in the NIOSH Pocket
Guide to Chemical Hazards[7]. NIOSH also recommends preventive measures (e.g.,
engineering controls, safe work practices, personal protective equipment, and environmental and
medical monitoring) to minimize the risk of exposure and adverse health effects from these
hazards. Other OELs that are commonly used and cited in the U.S. include the threshold limit
values (TLVs)® recommended by the American Conference of Governmental Industrial
Hygienists (ACGIH)®, a professional organization[8] and the workplace environmental
exposure levels (WEELs)recommended by the American Industrial Hygiene Association,
another professional organization. ACGIH TLVs are considered voluntary guidelines for use by
industrial hygienists and others trained in this discipline “to assist in the control of health
hazards.” WEELs have been established for some chemicals “when no other legal or
authoritative limits exist”[9].
17Employers should understand that not all hazardous chemicals have specific OSHA PELs and for
some agents the legally enforceable and recommended limits may not reflect current health-
based information. However, an employer is still required by OSHA to protect their employees
from hazards even in the absence of a specific OSHA PEL. OSHA requires an employer to
furnish employees a place of employment that is free from recognized hazards that are causing or
are likely to cause death or serious physical harm [Occupational Safety and Health Act of 1970,
Public Law 91–596, sec. 5(a)(1)]. Thus, NIOSH investigators encourage employers to make use
of other OELs when making risk assessment and risk management decisions to best protect the
health of their employees. NIOSH investigators also encourage the use of the traditional
hierarchy of controls approach to eliminating or minimizing identified workplace hazards. This
includes, in preferential order, the use of: (1) substitution or elimination of the hazardous agent,
(2) engineering controls (e.g., local exhaust ventilation, process enclosure, dilution ventilation)
(3) administrative controls (e.g., limiting time of exposure, employee training, work practice
changes, medical surveillance), and (4) personal protective equipment (e.g., respiratory
protection, gloves, eye protection, hearing protection). Table 2 contains a listing of all
substances sampled during the July and November site visits, and provides applicable OELs,
where available.
Results
Descriptive statistics for the 8-hr time weighted average samples, by work area, and task based
samples from the November site visits are presented in Table 3, Table 4 and Table 5,
respectively. Overall two hour samples, by work area from the July site visits are presented in
Tables 6 and 7. Task based samples from the July site visit are presented in Table 8.
18Outdoor air temperatures ranged from 56°F to 87°F during the November site visit (no indoor air
temperatures were collected). Indoor air temperatures in the facility ranged from 71 °F to 90 °F
during the July site visit. Relative humidity in the powder production, liquid production, pre
production corridor, distribution warehouse and spray drying area during the July survey ranged
from 28% to 78%, 33% to 63%, 35% to 55%, 28% to 53%, 23% to 65%, respectively during the
two days of sampling.
Ketones (Diacetyl and Acetoin)
A total of 39 personal and area diacetyl/acetoin 8-hr time weighted samples were collected using
NIOSH method 2557/2558 and fourteen area 8-hr time weighted average samples were collected
using modified OSHA method PV2118 during the November site visit (Tables 3 and Table 4).
The distributions of diacetyl concentrations were skewed to the right; therefore, the natural
logarithm of the sample concentration was used in all statistical analyses. Diacetyl area samples
and personal samples collected on the same day in the same production area were not
significantly different than one another (p-value = 0.384). Accordingly both personal and area
samples are presented together in Table 3 and Table 4. A total of 30 2-hr TWA samples and 10
task-based samples were collected for diacetyl during the July site visit, all using the modified
OSHA method (Tables 6-8).
As stated earlier, a recent laboratory investigation revealed that the NIOSH method #2557 for
diacetyl is influenced by relative humidity concentrations. Although diacetyl samples analyzed
using the NIOSH method have been presented, it should be noted that these measurements are
19likely underestimates of true concentrations. Therefore, we have presented these results solely
for comparison to previous investigations.
During both the November and July site visits, area diacetyl samples were collected using a
modified OSHA method for diacetyl (200 mg/400 mg silica gel media). Select OSHA modified
method results from the November site visits exhibited breakthrough of the front tube due to
extended sampling volumes. Sample volumes were significantly reduced for the July site visits.
Based on the initial laboratory study, it is believed that samples analyzed with the modified
OSHA analytical method provide more accurate results than samples analyzed with the NIOSH
method.
In an analysis limited to samples analyzed according to the modified OSHA method, average
area diacetyl concentrations were highest in the liquid production room (Arithmetic Mean(AM):
0.46 ppm, n= 3) followed by the powder production room ( AM: 0.34 ppm, n=3) and the pre
production corridor (AM:0.21ppm, n=2) during the November site visit.
During the July site visit (Tables 6 and 7), two-hour time weighted average diacetyl
concentrations were again higher in the liquid production room (AM: 0.529ppm) compared to
the powder production room (AM: 0.483 ppm). The highest diacetyl two-hour time weighted
average (6.33 ppm) measured in the facility was in the spray drying room when spray drying was
in operation in the early morning hours of July 11, 2007. The diacetyl concentration in the
preproduction corridor was also highest during the early morning hours when spray drying was
20in operation. Measurable diacetyl concentrations in the distribution warehouse also occurred
during the late morning and early afternoon hours of July 12, 2007.
Task Based Samples
All task-based sample results are shown in Tables 5 and 8. Diacetyl exposures varied
considerably during the site visits depending upon production area, batch formula, worker task
and work practices. During the November site visit, a worker was observed pouring diacetyl
from a 55 gallon drum into multiple 5 gallon containers in the pre-production corridor. During
the operation, the worker wore a full-face respirator and a task-based concentration of 11 ppm
was observed. Eight-hour TWA area concentrations in the pre-production corridor were also
notably higher on this day.
During the July site visit, several task based samples were collected on a variety of flavor
formulations (Table 8). Sifting and packaging powder formulations resulted in the highest
diacetyl concentrations observed. The highest task-based diacetyl sample (17.4 ppm) was
observed over an eight minute time period while a worker scooped butter flavored powder from
a large metal container and packaged it into smaller containers. Diacetyl comprised less than 2%
of the total butter flavored powder formulation. The worker was wearing a respirator during this
process. This task was performed inside one of the newly installed booth-type kettle ventilation
hoods in the liquid compounding room. A 10 minute task-based concentration of 10 ppm
diacetyl was measured while an employee re-packaged butter flavored powder from larger
storage bin into smaller containers. The employee wore a respirator while he completed this
procedure inside a ventilated booth-type hood. A task-based sample concentration of 9.32 ppm
21was also measured over approximately 1 hour when an employee (wearing respiratory
protection) scooped butter flavored powder into a manual sifter. The worker reached deeply into
the metal grinder vat to successfully remove all butter flavored powder placing his breathing
zone into the contaminated area. Also, when an employee (wearing respiratory protection)
packaged dairy flavored powder into smaller containers, a task-based sample concentration of
4.75 ppm was observed over a thirty-three minute sample period. Diacetyl comprised less than
1% of the total dairy flavored powder formulation.
Acetoin
In November, acetoin concentrations were highest in the liquid production room (AM = 0.15
ppm, n=17). In July, the average acetoin concentrations were highest in the spray dryer
operation room, with all measurements lower than 1 ppm. Acetoin was always observed in
lower concentrations than diacetyl during the task-based samples. The highest task-based
acetoin sample concentration in the liquid compounding room was measured during the mixing
of a butter flavor during the November site visit (1.05 ppm). The highest task-based acetoin
sample concentration in the powder compounding room was measured during the packaging of a
butter flavor during the July site visit (2.78 ppm).
Thermal Desorption Samples
One hundred and ninety-one contaminants were identified on the thermal desorption tubes
collected at this facility. To interpret the response from the thermal tube sample analysis, these
responses were categorized (using height of peak and area under peak) in each sample as 1) non-
detected, 2) trace quantity present, 3) minor component of mixture, 4) significant quantity
22present, and 5) major component of mixture. The top 100 contaminants identified during each
site visit are presented in Table 9, in order of decreasing magnitude.
The compounds observed in the liquid, powder and other areas did not appear appreciably
different during each site visit and were found in relatively high abundance. Overall, the thermal
desorption results from the July visit suggest better environmental controls in the workplace,
because concentrations were lower even though the magnitude of contaminants was similar.
Acids
During the November site visit, 8-hr TWA acetic, butyric and propionic acid samples were
collected on employees working in production areas and within area baskets samples throughout
the facility. All samples were below occupational exposure limits for these compounds (Table
2). Eight-hour TWA personal samples collected in the powder production area were the highest
acid samples observed in the facility (Table 4). Acid concentrations were observed while a
worker poured and mixed ingredients for a butter flavor batch during task-based sampling (Table
5, acetic acid: 1.93 ppm, butyric acid: 1.20 ppm, propionic acid: 1.43 ppm).
Phosphoric Acid
A total of 14 8-hr TWA phosphoric acid samples were collected in all area baskets during the
November site visits. All samples were below the analytical limit of detection and all
occupational exposure limits for phosphoric acid( Table 2).
Dust Concentrations
23Respirable and total dust concentrations were measured on employees working in the powder
production room, but were at concentrations below established occupational exposure limits
(Table 2). Real-time dust concentrations were continuously logged for one-minute periods
during powdered flavor production over one day during the November site visit. The dust
concentrations were highly variable as exhibited on the right axis illustrated in Figure 5. One-
minute average dust concentrations peaked as high as 1.6 mg/m3. The dust concentrations are
shown along with the VOC concentrations in Figure 5. During some time-periods, increasing
dust concentrations corresponded with rising VOC concentrations. This suggests that some dust
formulations also contained high quantities of VOC content. There were also examples where
VOC concentrations rose, but dust concentrations did not increase. This scenario could be
reflective of a liquid pour preceding the initiation of blending.
Real-time VOC samples
Real-time PIDs measured room area VOC concentrations during the November site visit (see
Figures 5-8). These detectors respond to a broad range of volatile compounds and do not
provide concentrations specific to any particular compound. However, they do provide insight
into the variation of VOCs throughout the workday. Figures 5-8 illustrate the instantaneous
concentrations of VOCs by production area presented as ppm isobutylene equivalent.
Concentrations were highly variable in all work areas and likely reflect the diversity of batches
and their ingredients. The most variable and highest peak concentrations throughout the three
sampled days were measured in the liquid production room. The pre-production corridor also
showed increasing VOC concentrations throughout the workday. Although real-time
concentrations in all production areas were reviewed, no apparent trends were observed. It did
24not appear that sudden peaks in the liquid or powder rooms resulted in corresponding increases
in VOC levels in the pre-production corridor (reflecting migration) during these sampling
periods.
Respiratory Protection Program
A respiratory protection program was operational in the facility. The program’s quality evolved
throughout the several visits at the facility. During the November site visits, production
employees generally wore respirators at all times in the liquid and powder production area. In
November, respirator use included both half-face cartridge respirators and full-face cartridge
respirators with organic and P100 cartridges and employees had been qualitatively fit tested.
During conversations with employees, they seemed uncertain how often to change respirator
cartridges. Respirators were stored in the production areas. NIOSH provided specific guidance
to both management and employees on respirator use, and storage. Cal/OSHA representatives
were also in communication with the company regarding respiratory protection following the
November site visit.
During the July site visit, the respiratory protection program was notably improved. Respirators
had a specific storage location outside the powder production area. Management indicated that
cartridges were changed after approximately eight hours and had stored used cartridges to
confirm this schedule. New cartridges were visibly available and employee use seemed more
consistent. Management reported that production workers had been quantitatively fit-tested and
trained. Observations suggested respirators were worn more frequently and appropriately by
25production workers. There were still some individuals (quality control officials, management
officials, etc) who entered the production areas without respiratory protection periodically.
Discussion
The July task-based diacetyl samples clearly demonstrate that packaging product, whether liquid
or powder, was an activity associated with the highest exposures. Tasks such as scooping
powders and manually sifting them into packages as well as the filling of liquid containers were
identified as high exposure procedures. These activities should always be conducted with
respiratory protection and engineering controls.
The November task-based samples revealed the highest exposure when an employee
redistributed pure diacetyl from a 55 gallon drum into 5 gallon containers in the pre-production
corridor. When performing this task, employees should continue to wear appropriate respiratory
protection and storing diacetyl in cold storage prior to use. (Cold storage can reduce volatility.)
Redistributing diacetyl should be completed in the liquid production area within a ventilated
booth to reduce worker exposure and migration of diacetyl to other areas of the facility.
During both the November and July site visits, diacetyl concentrations were higher in the liquid
production room compared to the powder production room. Although engineering controls were
installed in the liquid production room prior to the July visit, diacetyl concentrations in the liquid
production room were higher during this survey than during the November visit. This may be
due to the fact that batch ingredients vary dramatically, and that the formulations completed in
July simply contained more diacetyl than those completed in November. Additionally, samples
26collected in November were collected over an eight-hour average versus a two hour averages in
July. Short duration samples will more accurately reflect peak exposures compared to samples
integrated over a longer time period.
However, there may have been another reason for the higher levels of diacetyl measured in the
liquid compounding room. During the collection of short term diacetyl samples, a worker was
packaging butter flavored powder inside one of the ventilated booths located in the liquid
production room. A personal sample collected on the worker and area samples throughout the
liquid production room showed high concentrations of diacetyl during this procedure. After
reviewing the data and pictures taken with the facility, an alternate hypothesis was developed as
described below.
NIOSH investigators found the engineering controls installed in the liquid production room
exhibited good capture when testing the emission of contaminants from a mixing tank within the
ventilated booths. However, it is possible that the exhaust fan was not operating during the
powder packaging. The exhaust fans on these booths are activated when an object (such as a
tank) comes within an inch or so of a proximity switch mounted on the back of the booth. This
feature decreases electricity usage by shutting down the fans while the booths are not in use. If
the powder packaging apparatus did not effectively engage this switch, the fan would not have
come on and the contaminant would not have been captured (see Figure 9). Therefore, it is
possible that the dust and vapors emitted during this process were not adequately captured and
contributed to the personal and area diacetyl concentrations measured during this operation.
Unfortunately, the fan operation cannot be verified by sound due to the high background noise
27levels from the adjacent fan/hood systems. A visual indicator such as a fan operational light
should be connected to the fan circuit and mounted on the booth to indicate to the employee that
the fan is operational. Secondly, boxes with packaged material were moved outside the booth
after packaging. This would allow compounds to be emitted in the liquid production room
before being closed entirely.
The implementation of ventilated booths in the liquid production room provides a good
engineering control which can be used for a variety of tasks including large tank ventilation.
Other operations such as powder packaging and pouring/redistribution of diacetyl and other high
priority chemicals can be more safely completed in these booths once the workers have been
properly trained on use and new operation safeguards such as the one mentioned above are
implemented. Important topics for training include verifying fan operation status, making sure
that the worker knows to always position the contaminant source between him and the exhaust
hood, and closing packaged boxes completely before removing them from the ventilated booths.
The thermal desorption results provide evidence that the benchtop ventilation stations were
working as designed. Although similar compounds were observed and diacetyl was higher in the
rank order, the relative abundance was lower for most contaminants overall.
Recommendations
1. Engineering Controls:
281) Re-design the proximity switch to insure ventilation systems are on when employees operate
the engineering controls in liquid production room. Add a fan operational status light to each
hood to provide an indication to the worker that the booth is functional.
2) Install appropriate engineering controls in the powder production and spray dryer rooms.
These controls should address the potential sources of exposure documented in the letter from
NIOSH, dated February 7, 2007.
3) Train employees on how to use the engineering control hoods properly; provide guidance on
proper usage and good work practices such as avoiding filling up the bench-top hoods with non
essential items.
4) Engineering controls should be evaluated periodically to insure proper operation in
accordance with engineering control guidance[2]. System performance checks should be added
to a preventative maintenance routine.
2. Work Practices:
1) Avoid pouring, measuring, or open transfer of flavoring chemicals or ingredients in the pre
production corridor. These operations should be completed in a ventilated booth using
appropriate work practices.
292) Continue to improve work practices for any flavoring containing diacetyl or other priority
chemicals to fully utilize the engineering controls employed in the liquid production room.
3) Avoid removing containers packaged with flavoring containing diacetyl or other priority
chemicals product from the ventilated booth until they are closed entirely.
4) Keep containers of flavoring chemicals and/or ingredients sealed when not in use.
5) Utilize cold water washes and cold storage of chemicals when feasible.
6) Clean spills promptly to minimize emissions of chemical vapors.
7) Add diacetyl and other high priority chemicals into a batch last, when possible, to minimize
volatilization and exposure potential/duration.
8) Wear personal protection equipment including respirators and skin protection when cleaning
up spills or washing empty containers of flavoring chemicals or ingredients.
3. Respiratory Protection:
1) Continue to require mandatory respirator use for all production workers, distribution
warehouse workers, and other workers who enter the production area.
302) Re-locate the respirator storage and cartridge re-load area from outside the powder production
room/pre-production corridor to an alternate area with lower concentrations of flavoring
chemicals.
3) Restrict access to the pre-production corridor, liquid production room, powder production
room, spray-drying areas, and distribution warehouse to only employees that need to be there,
have been properly quantitatively fit-tested, and are wearing appropriate respiratory protection.
4) In accordance with Cal/OSHA direction, "full-facepiece respirators fit-tested with an
approved quantitative method are needed as minimal protection for employees exposed to
flavoring ingredients in this industry. All employees entering flavor formulation areas or
unprotected areas (e.g., packaging areas) must wear respirators" (FISHEP correspondence from
K. Howard dated Oct. 13, 2006). Specifically, a NIOSH-certified full-face respirator with
organic vapor/acid gas cartridges and particulate filters is the minimum level of respiratory
protection recommended in conjunction with a fully operational respiratory protection program.
Information about respirators is available at the NIOSH website
(http://www.cdc.gov/niosh/npptl/topics/respirators/ and http://www.cdc.gov/niosh/docs/2005-
100/default.html). Details on the OSHA Respiratory Protection Standard are available on the
OSHA website (http://www.osha.gov/).
4. Eye Protection:
1) Enforce use of eye protection in the laboratory and quality controls areas. Full face
respirators provide eye protection in the production areas.
315. Skin Protection:
1) Wear long sleeve shirts, pants, and chemical-resistant gloves in the production areas.
6. Medical Surveillance:
1) Follow medical surveillance guidance and recommendations as specified in communication
related to health hazard request 2007-033 [10, 11]
7. Hazard Communication:
1) Ensure workers understand the hazards associated with flavoring chemicals and how to
protect themselves. OSHA’s Hazard Communication Standard, also known as the “Right to
Know Law” (29 CFR 1910.1200) requires that employees are informed and trained of
potential work hazards and associated safe practices, procedures, and protective measures.
The California Code of Regulations, Title 8, Section 5194, Hazard Communication, is available
at http://www.dir.ca.gov/title8/5194b.html.
32Acknowledgements
The authors gratefully acknowledge the significant collaboration with Dr. Rachel Bailey, Mr.
Kelly Howard and Mr. Dan Leiner for this work. We appreciate the data collection support
from Dr. Ed Burroughs, Mr. James Couch, Dr. Brian Curwin, Mr. Chad Dowell, Mr. Kevin L
Dunn, CAPT Alan Echt, Mr. Alberto Garcia, Ms. Denise Giglio and Mr. Kelly Howard. We
acknowledge the field guidance from Mr. Donald Booher, Mr. Karl Feldman, and Mr. Dan
Farwick. We also appreciate the technical assistance provided by Dr. James Deddens, CAPT
Cherie Estill, Dr. Ardith Grote, Dr. Rich Kanwal, Dr. Kathleen Kreiss, Dr. Greg Kullman, Mr.
Lian Luo, Dr. John McKernan, Ms. Stephanie Pendergras, Mr. Larry Reed, Dr. Robert Streicher
and Dr. Elizabeth Whelan
33References
1. Dunn, K., Letter of October 13, 2006 from K. Dunn, Centers for Disease Control,
National Institute for Occupational Safety and Health to J. Wellwood, Gold Coast
Ingredients, Inc. 2007.
2. Dunn, K.H., A. Echt, and A. Garcia, In-Depth Survey Report: Evaluation Of Engineering
Controls For The Mixing Of Flavoring Chemicals, EPHB Report No. 322-11a, U.S.
Department of Health and Human Services, January 2008, Centers for Disease Control
and Prevention, National Institute for Occupational Safety and Health.
3. Gold Coast Ingredients, Inc. 2007 [cited November 27, 2007]; Available from:
http://www.goldcoastinc.com/.
4. FEMA. Respiratory Health and Safety in the Flavor Manufacturing Workplace. 2004
[cited 2007 October 15]; Available from:
http://www.femaflavor.org/html/public/RespiratoryRpt.pdf.
5. Ubbink, J. and A. Schoonman, Flavor Delivery Systems, in Kirk-Othmer encyclopedia of
chemical technology, R.E. Kirk and D.F. Othmer, Editors. 2002, John Wiley and Sons,
Inc.: Cary, N.C. p. 527-563.
6. Hornung, R.W. and L.D. Reed, Estimation of average concentration in the presence of
nondetectable values. Appl Occup Environ Hyg, 1990. 5(1): p. 46-50.
7. NIOSH, NIOSH Pocket Guide to Chemical Hazards, US Department of Health and
Human Services, Centers for Disease Control and Prevention, DHHS (NIOSH)
Publication Number 2005-149, 2005.
8. American Conference of Governmental Industrial Hygienist, 2007 TLVs® and BEIs®:
threshold limit values for chemical substances and physical agents and biological
exposure indices. 2007, ACGIH Signature Publications: Cincinnati, OH.
9. American Industrial Hygiene Association, 2007 Emergency Response Planning
Guidelines (ERPG) & Workplace Environmental Exposure Levels (WEEL) Handbook.
2007, Fairfax, VA: American Industrial Hygiene Association.
10. NIOSH, Hazard Evaluation and Technical Assistance Interim Letter 1. Gold Coast, Inc.
Commerce, CA. Vol. HETA 2006-0033. 2007, Cincinnati, OH: U.S. Department of
Health and Human Services, Public Health Service, Centers for Disease Control and
Prevention, National Institute for Occupational Safety and Health, DHHS (NIOSH).
11. NIOSH, Hazard Evaluation and Technical Assistance Interim Letter 2. Gold Coast, Inc.
Commerce, CA. August 27, 2007, HETA 2006-0033. 2007, Cincinnati, OH: U.S.
Department of Health and Human Services, Public Health Service, Centers for Disease
Control and Prevention, National Institute for Occupational Safety and Health, DHHS
(NIOSH).
3412. NIOSH, NIOSH Current Intelligence Bulletin 55: Carcinogenicity of Acetaldehyde and
Malonaldehyde, and Mutagenicity of Related Low-Molecular-Weight Aldehydes, US
Department of Health and Human Services, Centers for Disease Control and Prevention,
DHHS (NIOSH) Publication Number 91-112, 1991.
35Table 1. Sampling and Analysis Table
Type Analysis Method Media Analytes Objective Flowrate Sample Duration
November Site Visit
EPA TO-11 Dinitrophenylh 2-Furaldehyde 8-hr TWA 100cc/min 300 minutes
ydrazine Acetaldehyde,
(DNPH) treated Benzaldehyde,
silica (150/300 Isovaleraldehyde
mg) Propionaldehyde
Aldehydes
EPA TO-11 Dinitrophenylh 2-Furaldehyde Task Based 200cc/min 15 minutes -1 hour
ydrazine Acetaldehyde, Sample
(DNPH) treated Benzaldehyde,
silica Isovaleraldehyde
Propionaldehyde
Draft NMAM Silica Gel Acetic Acid 8-hr TWA 200cc/min 480 minutes
5048 (200mg/400mg) Butyric Acid
Propionic Acid
NMAM 7903 Silica Gel Phosphoric Acid 8-hr TWA 200cc/min 480 minutes
Acids
(200mg/400mg)
Draft NMAM Silica Gel Acetic Acid Task Based 200cc/min 15 minutes -1 hour
5048 (200mg/400mg) Butyric Acid Sample
Propionic Acid
OSHA PV2118 Silica Gel Diacetyl 8-hr TWA 100cc/min 480 minutes
(modified (200mg/400mg)
method)
NIOSH CMS Diacetyl/Acetoin 8-hr TWA 480 minutes
Ketones
2557/2558 (75mg/150mg) 100cc/min
NMAM CMS Diacetyl/Acetoin Task Based 200cc/min 15 minutes -1 hour
2557/2558 (75mg/150mg) Sample
36Type Analysis Media Analytes Objective Flowrate Sample Duration
Method
November Site Visit (continued from previous page)
VOCs NMAM 2549 Thermal Varied based on 2-hr TWA 100cc/min 60 minutes
Desorption Tubes Thermal tubes
Respirable dust NMAM 0600 37 mm PVC Respirable dust 8-hr TWA 4.2L/min 240 minutes
filter, BGI
cyclone
Total Dust NMAM 0500 37 mm PVC filter Total dust 8-hr TWA 1.5L/min 240 minutes
July Site Visit
Aldehydes EPA TO-11 Dinitrophenylhyd 2-Furaldehyde 2-hr TWA 200cc/min 120 minutes
razine (DNPH) Acetaldehyde,
treated silica Benzaldehyde,
Isovaleraldehyde
Propionaldehyde
EPA TO-11 Dinitrophenylhyd 2-Furaldehyde Task Based 200cc/min 15 minutes -1 hour
razine (DNPH) Acetaldehyde, Sample
treated silica Benzaldehyde,
Isovaleraldehyde
Propionaldehyde
OSHA Silica Gel Diacetyl/Acetoin 2-hr TWA 50cc/min 120 minutes
Ketones PV2118 (200mg/400mg)
(modified
method)
OSHA Silica Gel Diacetyl/Acetoin Task Based 50cc/min 15 minutes -1 hour
PV2118 (200mg/400mg) Sample
(modified
method)
NOTES:
NMAM: NIOSH Manual of Analytical Methods
37Table 2. Relevant Occupational Exposure Limits
Occupational Exposure Limits
NIOSH REL OSHA PEL ACGIH TLV
Chemical Name TWA STEL Ceiling TWA STEL Ceiling TWA STEL Ceiling
2-Furaldehyde NE NE NE 5 ppm (A) NE NE 2 ppm (A,B) NE NE
Acetaldehyde NE (C) NE (C) NE (C) 200 ppm NE NE NE NE 25 ppm (B)
Acetic acid 10ppm 15ppm NE 10ppm NE NE 10ppm 15ppm NE
Acetoin NE NE NE NE NE NE NE NE NE
Benzaldehyde NE NE NE NE NE NE NE NE NE
Butyric acid NE NE NE NE NE NE NE NE NE
Diacetyl NE NE NE NE NE NE NE NE NE
Isovaleraldehyde NE NE NE NE NE NE NE NE NE
Phosphoric acid 1 mg/m3 3 mg/m3 NE 1 mg/m3 NE NE 1 mg/m3 3 mg/m3 NE
Propionaldehyde D NE NE NE NE NE NE 20 ppm NE NE
Propionic acid 10 ppm 15 ppm NE NE NE NE 10 ppm NE NE
Respirable particulate NE NE NE 5 mg/m3 NE NE 3 mg/m3 NE NE
Total particulate NE NE NE 15 mg/m3 NE NE 10 mg/m3 (E) NE NE
Total volatile organic compounds NE NE NE NE NE NE NE NE NE
NOTES:
A - Skin notation
B - ACGIH confirmed animal carcinogen with unknown relevance to humans [8]
C - NIOSH potential occupational carcinogen - (See Appendix A and C in the NIOSH Pocket Guide to Chemical Hazards [7]
D - Testing has not been completed to determine the carcinogenicity of acrolein, butyraldehyde (CAS#: 123-72-8), crotonaldehyde,
glutaraldehyde, glyoxal (CAS#: 107-22-2), paraformaldehyde (CAS#: 30525-89-4), propiolaldehyde (CAS#: 624-67-9), propionaldehyde
(CAS#: 123-38-6), and n-valeraldehyde, nine related low-molecular-weight-aldehydes. However, the limited studies to date indicate that
these substances have chemical reactivity and mutagenicity similar to acetaldehyde and malonaldehyde. Therefore, NIOSH recommends
that careful consideration should be given to reducing exposures to these nine related aldehydes. [12]
E - Inhalable fraction [8]
NE - Not established
38You can also read