Kaimai Wind Farm Limited Project Development Rationale
←
→
Page content transcription
If your browser does not render page correctly, please read the page content below
Kaimai Wind Farm Limited

Project Development Rationale

Report Prepared For:
Glenn Starr
Kaimai Wind Farm Limited
M338 Private Bag 300987
Albany
Auckland
New Zealand

By:
Energy3 Services Limited
P.O. Box 17563
Sumner
Christchurch, 8830
New Zealand

This report is provided by Energy3 Services Limited solely for the benefit of Counties Power, Energy3 Services Limited shall accept
no liability of any kind whatsoever resulting from a third parties use, or reliance on the information in this report for any reason
whatsoever.

© Energy3 Services Limited 2017
Document Control Record
Document prepared by:

Energy3 Services Limited
PO Box 17563
Christchurch, New Zealand

 Telephone          +64 3 376 5539
 Email              info@energy3.co.nz
 WWW                www.energy3.co.nz

 Report Title                   Kaimai Wind Farm Project Rationale
 Document ID                    Kaimai Rationale            Project Number             Kaimai 01

 File Path                      P:\CUSTOMERS\Ventus Energy\Kaimai Project\Project Outline

 Client                         Ventus Energy               Client Contact            Glenn Starr

 Rev         Date               Revision Details/Status     Prepared         Author   Verifier      Approver

 0           9 February 2018    Revision 0, draft           TC               TC       MB            MB

 1           20 February 2018   Revision 1, draft           MB               MB       TC            TC

 2           26 March 2018      Revision 2, draft           MB               MB       TC            TC

                                Revision 3, grammatical
 3           28 March 2018                                  MB               MB       TC            TC
                                amendments, draft
                                Site Selection extended,
 4           13 June 2018                                   GS               GS       TC            TC
                                Layout history

 5           15 June 2018       Review changes              TC               TC       MB            MB

 Current Revision               5

 Approval
 Author Signature                                           Approver Signature

 Name                                                       Name

 Title                                                      Title

________________________________________________________________________                                       2
          Energy3, P. O. Box 17563, Sumner, Christchurch. Phone +64 3 376 5539, www.energy3.co.nz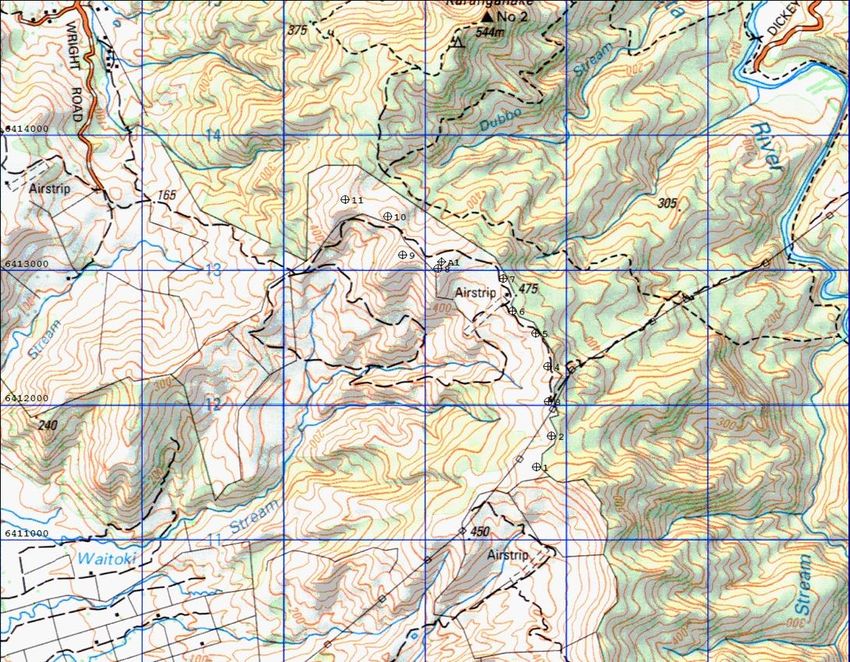
Executive Summary
The provision of a secure and reliable electricity supply to New Zealanders is a constant challenge
being faced by the electricity generation industry. As long-term demand for electricity continues to
increase, additional electricity generation facilities are required to be built.
Recently in the order of 1000MW of thermal plant has been decommissioned in the Auckland
region, this action significantly increases the “dry year” risk of electricity supply shortfall. The
thermal plants were decommissioned as the respective projects had reached the end of their
economic life.
There is no central supply planning authority in New Zealand, and as such each project owner or
developer must formulate their own view on the capacity required to fill electrical demand for an
economic return. The market therefore decides when new plant is built to meet demand, and
often this occurs hastily following a crisis of supply (e.g. 1992, 2003).
Kaimai Wind Farm Limited proposes to construct a wind farm of 24 turbines with an aggregate
capacity of approximately 100MW on the north western end of the Kaimai Ranges. The Kaimai
Wind Farm Site comprising a total area of 1,304Ha is approximately 8 km to the north of Te Aroha.
The Site is characterised by grassed rolling hills, and ranges from 10 to 500m above sea level. The
Site is largely covered by exotic grazing grasses and adapted weed species. The topography is
generally suitable for a wind farm development if appropriate contours are followed for roading
and turbine locations.
The Kaimai Site consists of a strongly defined south-west/north east facing ridgeline, and a lower
plateau to the north west of the main Kaimai Range ridgeline, both are suitably aligned to the wind
resource. The Site, given its topography, has the benefit of being relatively distant from
surrounding dwellings, mitigating potential noise impacts from construction and operation of the
wind farm.
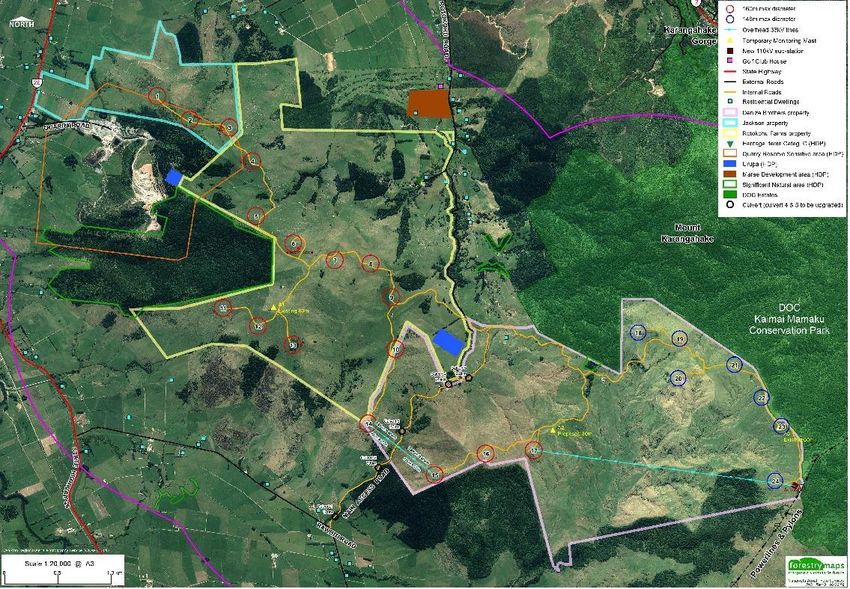
Ventus Energy has carried out extensive wind monitoring since 2005 using various sized tall wind
monitoring masts in the intervening years (20m, 50m and 60m towers). The variety of
meteorological masts that have been installed at different locations on the Site, have supplied
wind data suitable to calculate accurate energy yield estimates of potential turbine types. The
lower elevation areas of the Site feature mean annual wind speeds in the order of 7.5 m/s, while
the higher elevation areas of the Site have higher wind speeds, these are in the order of 9.5 m/s. In
addition measured turbulence levels are relatively low, an important consideration when
considering structural loadings on turbines. The recorded wind flow parameters collectively
indicate a good wind regime for wind turbine power generation.
The inclusion of the upper ridgeline turbines are essential to the overall project viability. From the
measured wind resource it is estimated they will produce on average 28% more electricity per
turbine than the lower elevation turbines. The lower turbines in isolation, representing a smaller
project, do not constitute a viable project given that the highly expensive grid connection cost to
________________________________________________________________________ 3
Energy3, P. O. Box 17563, Sumner, Christchurch. Phone +64 3 376 5539, www.energy3.co.nz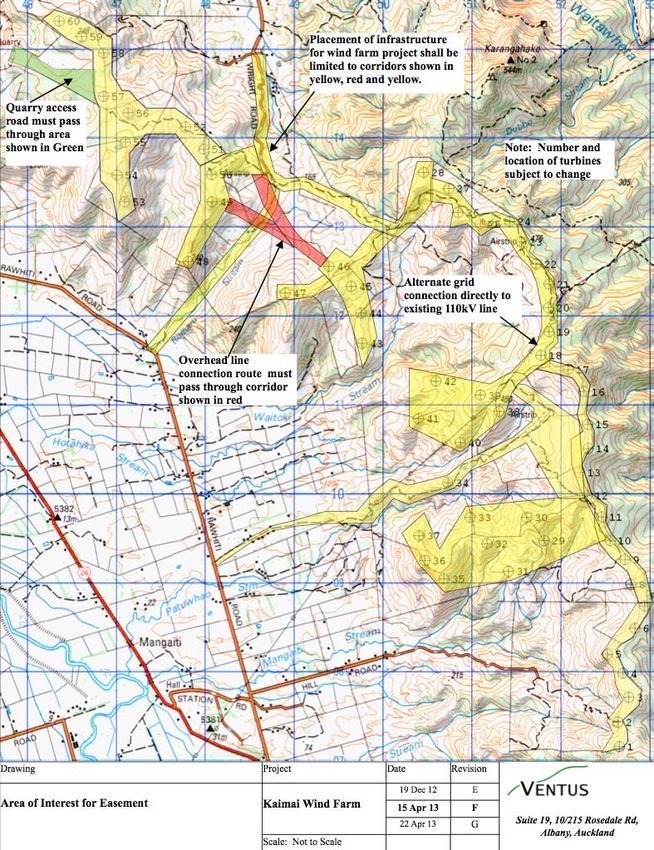
the Transpower network is effectively a fixed cost, regardless of project size. The higher elevation
turbines also provide a form of “cross subsidisation” in terms of energy yield averaged over the
entire project, due to the fact that they are significantly more productive on account of the higher
wind speeds they receive.
The principal of Kaimai Wind Farm Limited, Ventus Energy (NZ) Limited, which is owned by Glenn
Starr, has pursued a wind farm development at the Site since 2005. The project has gone through
many design iterations over the years. Initially starting with a project of 11 turbines of 2MW
capacity, then subsequently expanding to a larger project comprising 60 turbines of 3MW capacity,
and extending over the entire expanse of the agricultural land at the northern end of the Kaimai
Ranges.
After significant consideration and stakeholder involvement, the final design iteration of the
project for which consent is sought has been reduced considerably in size. The reduction is
primarily due to the following factors:
An increase in available turbine sizes (both physical and power output) meaning increased
generation from reduced turbine numbers.
Results from ecological monitoring, particularly increased bat populations.
Definition of an ONL on DoC land to the east of the Site.
Advice from local stakeholders, landscape consultants, and planners.
Complications with respect to landholdings.
As a result the project site was condensed to only include land north of the TransPower 110kV
transmission line, and at lower elevations compared to the more southerly turbine sites considered
in prior design iterations. The reviewed project design has therefore significantly reduced potential
environmental effects, those most notably being ecological and landscape impacts.
Key benefits of the project include:
The Kaimai Range Site has some of the best wind generation potential of any site close to
Auckland, Hamilton, and Tauranga, which are major electrical load centres.
Building significant generation close to load centres increases the value of energy, namely
by mitigating transmission losses that arise from electrical transmission from distant
generation plants.
Locally sourced generation increases security of supply within the region, as imports from
distant generating plants have an increased risk of transmission failure or constraint.
The Site has the significant development advantage in that a 110kV transmission line
passes directly through the Site at its southern end. No additional transmission lines
________________________________________________________________________ 4
Energy3, P. O. Box 17563, Sumner, Christchurch. Phone +64 3 376 5539, www.energy3.co.nz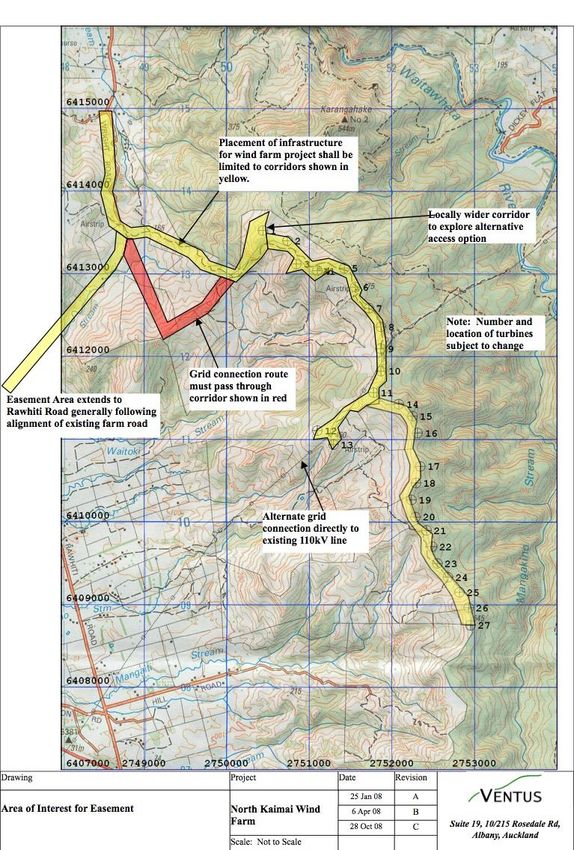
external to the Site are required to be built, completely avoiding the associated
environmental impact.
The development of the Kaimai Wind Farm project is consistent with the Government’s
overall policy framework to secure energy supply with the development of renewable
electricity generation projects.
The development aligns with the Government’s policy towards reducing climate change
inducing greenhouse gas emissions.
The Kaimai Wind Farm will help reduce security of supply risks by providing further
diversification in electricity generation supply.
________________________________________________________________________ 5
Energy3, P. O. Box 17563, Sumner, Christchurch. Phone +64 3 376 5539, www.energy3.co.nz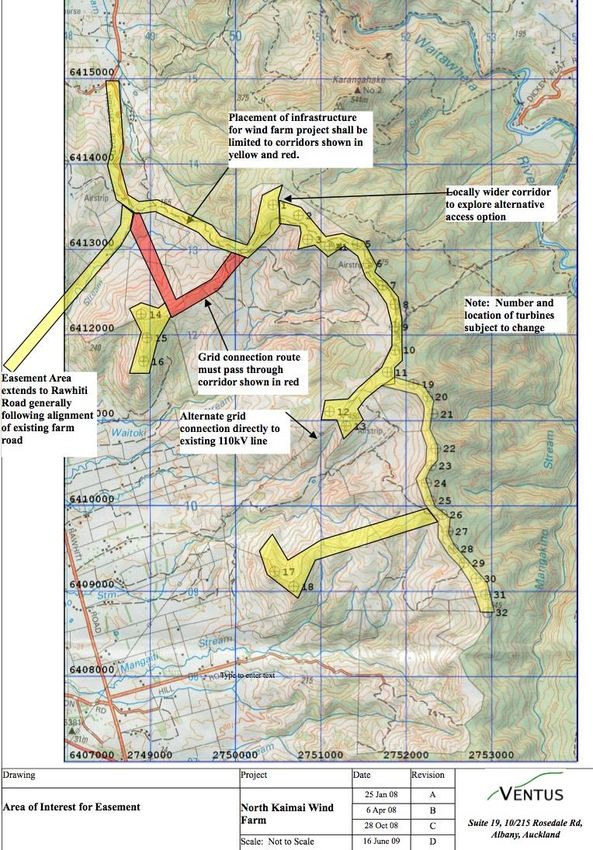
Contents
1.     Introduction ..............................................................................................................................8
2.     Drivers for Electricity ................................................................................................................8
     2.1.     Electricity Supply and Demand in New Zealand ................................................................... 8
     2.2.     Security of Supply ............................................................................................................... 11
     2.3.     Forecast Growth in Electricity Demand.............................................................................. 12
     2.4.     Supply Considerations ........................................................................................................ 14
     2.5.     Generation Development Options ..................................................................................... 15
3.     Site Considerations and Rationale..........................................................................................17
     3.1.     Identification of Wind Farm Sites ....................................................................................... 17
     3.2.     Wind Resource ................................................................................................................... 18
     3.3.     Suitable Land Availability.................................................................................................... 21
     3.4.     Proximity to Locations of High Energy Demand ................................................................. 21
     3.5.     Distance from Large Population Centres............................................................................ 21
     3.6.     Accessibility ........................................................................................................................ 22
     3.7.     Ability to Connect to the National Grid .............................................................................. 22
     3.8.     Avoidance of Sensitive Environmental Areas ..................................................................... 22
4.     Design Approach.....................................................................................................................23
     4.1.     Design Iterations................................................................................................................. 23
5.     Project Economics ..................................................................................................................26
     5.1.     Key Factors ......................................................................................................................... 26
     5.2.     Kaimai CAPEX...................................................................................................................... 26
     5.3.     Power Price......................................................................................................................... 26
     5.4.     Generation Output ............................................................................................................. 27
     5.5.     New Zealand Economy Benefits ......................................................................................... 29

________________________________________________________________________                                                                                  6
            Energy3, P. O. Box 17563, Sumner, Christchurch. Phone +64 3 376 5539, www.energy3.co.nz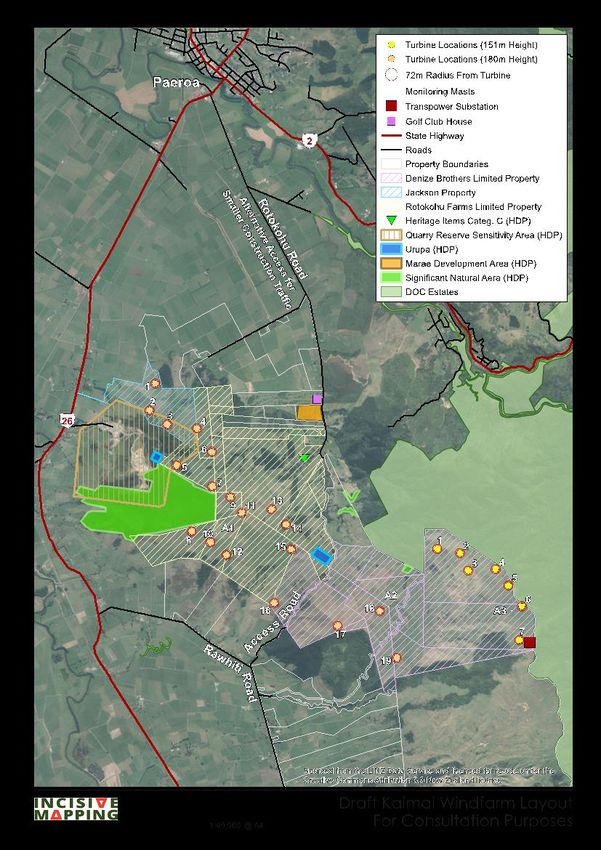
List of Figures
Figure 1 - Mean Annual Wind Speeds in New Zealand ____________________________________________ 19
Figure 2 – Main Load Centres, Transmission Lines, and Generation (TransPower) ______________________ 20
Figure 3: Ellipsoid spacing methodology which reflects dominant wind directions _____________________ 25
Figure 4: V136 Annual Energy Yield Relative to Mean Annual Wind Speed ___________________________ 27
Figure 5: V150 Annual Energy Yield Relative to Mean Annual Wind Speed ___________________________ 28
Figure 6: December 2007 Preliminary Layout – 11 turbines________________________________________ 30
Figure 7: Oct 2008 layout – 27 Turbines _______________________________________________________ 31
Figure 8: June 2009 layout – 32 Turbines ______________________________________________________ 32
Figure 9: April 2013 layout – 60 Turbines ______________________________________________________ 33
Figure 10: April 2015 layout – 54 Turbines _____________________________________________________ 34
Figure 11: Dec 2016 layout – 26 Turbines ______________________________________________________ 35
Figure 12: June 2018 layout – 24 Turbines _____________________________________________________ 36

________________________________________________________________________                                   7
        Energy3, P. O. Box 17563, Sumner, Christchurch. Phone +64 3 376 5539, www.energy3.co.nz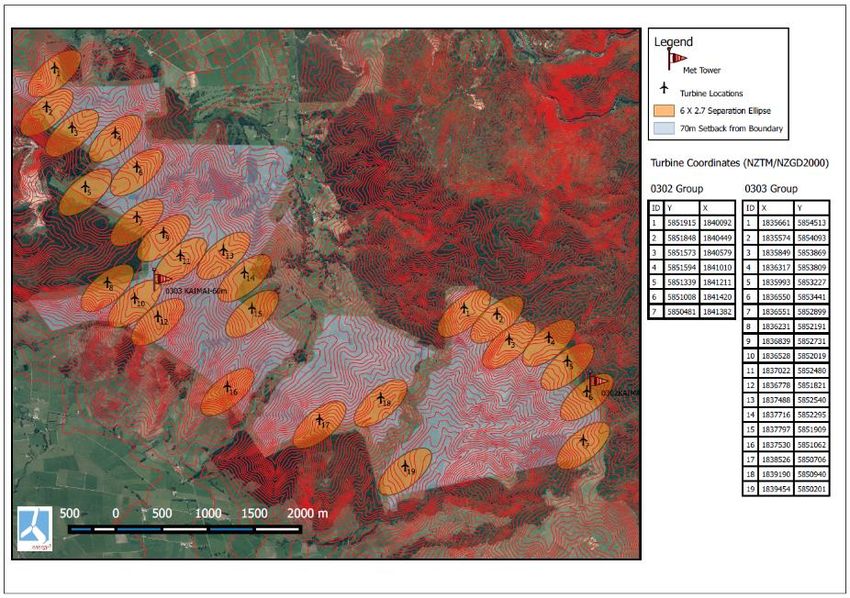
1. Introduction
This document outlines key electricity market drivers, site selection, and development rationale for
new wind energy generation projects in New Zealand, as well as at the proposed projects specific
location and type.
Overall, as long-term demand for electricity continues to increase, it is essential that additional
electricity generation facilities need to be built to satisfy demand and provide price stability. This is
especially important in light of the retirement of fossil fuel-based generation. These key factors
provide the principal rationale for the proposed development of the Kaimai Wind Farm.
2. Drivers for Electricity
This section outlines various drivers for electricity supply in New Zealand such as supply security,
forecast growth of demand, and considers ways in which the supply for this growth can be
managed effectively.
2.1. Electricity Supply and Demand in New Zealand
The majority of electricity generation in New Zealand is from hydroelectric sources, this is
followed secondly by geothermal generation, gas and coal thirdly, and finally wind. The most
recent relative percentages calculated by the Ministry of Business Innovation and Employment
(MBIE) are as follows:
Hydro 64%
Geothermal 18%
Gas and Coal 12%
Wind 6%
Significant differences exist in the distribution, scale, and type of generation plant between the
two islands. The South Island notably has the majority of the countries hydroelectric generation
capacity, and has proportionally higher levels of hydroelectric storage than the hydroelectric
schemes in the North Island.
Annual storage levels are highly dependent on rainfall and snow melt over spring, giving rise to
significant annual fluctuations, these can be higher than 40%. The proportionally higher level of
storage to generating capacity does however provide an increased buffer relative to the collective
North Island hydroelectric generation schemes. The South Islands only other generation source is
wind energy, the wind farms in the South Island are relatively modest in size and contribute
approximately 3% of the Islands total generation.
The South Island has three major hydroelectric power schemes, the Waitaki, Clutha, and
Manapouri. The schemes are located respectively in Waitaki, Otago, and Fiordland, all in the lower
South Island. There is no significant generation in the top of the South Island. The larger scale wind
farms are also located in Otago and Southland.
________________________________________________________________________ 8
Energy3, P. O. Box 17563, Sumner, Christchurch. Phone +64 3 376 5539, www.energy3.co.nz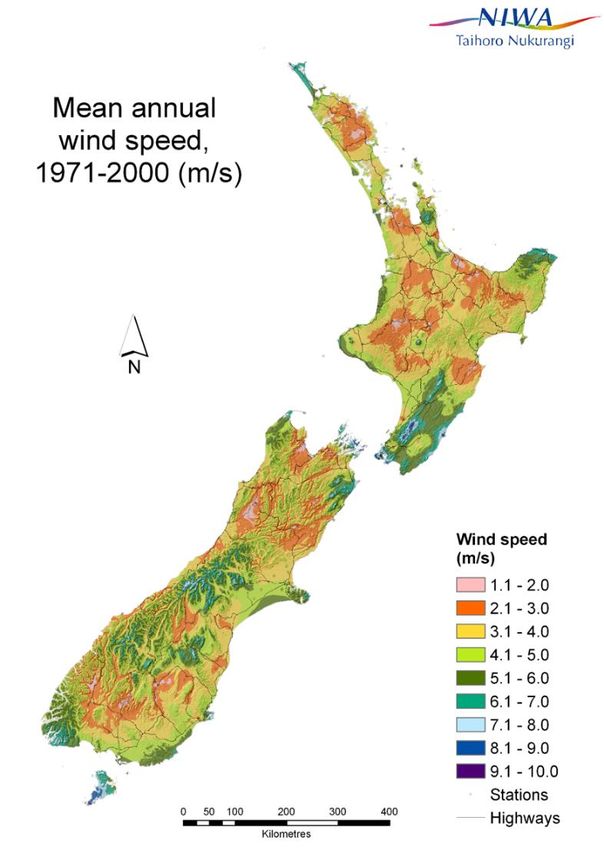
The high voltage DC link originating at the Benmore Dam serves as an important transmission
path to the North Island, largely enabling the export of excess hydro generation capacity in the
South Island to supplement supply in the North Island. Occasionally the power flow may be
reversed in times of energy shortages in the South Island, or due to plant outages (planned or
unplanned).

 Generation of electricity in the North Island is achieved from a wider range of generation types,
and which are proportionally more equal than those of the South Island. Geothermal and gas
generation provide the highest proportion of electricity and contribute a relatively equal amount
of generation that is collectively in the order of 60% of total generation. This is closely followed by
hydroelectric generation which contributes approximately 26% to the total North Island power
generation. Wind contributes approximately 12%, and coal now only 2%.

 The respective plants are clustered to some degree, with gas generation concentrated in the
Taranaki region, and geothermal within the Taupo volcanic zone. There are two major
hydroelectric schemes, the Waikato River Scheme in the Waikato, and the Tongariro Scheme in the
Taranaki.

  Wind generation is focused in the Manawatu, although the Wellington region now has significant
installed capacity, and the Waikato also has a medium sized wind farm (Te Uku rated at 64MW).

 The Huntly power station is the sole coal generation plant in New Zealand, however coal usage
has declined sharply in recent years, and has to some degree been substituted by gas. The power
station is located in the Waikato.

 Consumption ranges from large industrial sites, commercial operations, to residential consumers.
The North Island accounts for approximately two thirds of the total national power consumption,
having a greater population than the South Island, and a greater number of industrial operations.

 The most notable consumer in the South Island is the Tiwai Point Aluminium smelter near Bluff, in
Southland. The smelter accounts for up to one third of total demand in the South Island, and
approximately 12% of total national demand.

  Total national installed generation capacity as reported by MBIE in 2017 was 8,875 MW. Total
generated electricity from these sources was 40,527 GWh. Of note 6% of the total was derived
from wind generation, which continues to increase as a generation component to displace
nonrenewable generation sources.

 Renewable generation electricity generation sources collectively continue to increase their
percentage of total supply, in 2016 the renewables share was 85% of total supply, compared to
81% the prior year.

 The percentage of electricity derived from renewable sources has been trending up over time,
this is primarily due to the following reasons:

________________________________________________________________________                                  9
        Energy3, P. O. Box 17563, Sumner, Christchurch. Phone +64 3 376 5539, www.energy3.co.nz
The continual development of the electricity market.
The downgrading of Maui natural gas reserves which lead to a sharp drop in production in
2003.
Declining capital costs of renewable technologies in conjunction with much lower
operating costs compared to generation using fossil fuels.
A general market commitment to reduce CO2 emissions.
The proposed Kaimai Wind Farm would add the equivalent of 0.97% of installed generation
capacity and 0.99% of net annual generation output, which is a material contribution.
Since 2014 electricity generation companies have announced the impending de-commissioning of
over 1,000 MW of thermal capacity. This has largely arisen as a consequence of new geothermal
generation displacing baseload gas and coal fired generation. In this regard:
Mighty River Power announced the closure of the 175 MW gas-fired Southdown Power
Station in March 2015;
Contact Energy announced the closure of the 380 MW gas-fired Otahuhu B Power Station
in September 2015; and
Genesis Energy announced a timetable to permanently close the remaining 500 MW of
gas / coal fired units at the Huntly Power Station by 2019.
A significant uncertainty identified in the New Zealand electricity market is the future of the Tiwai
Point Aluminium Smelter, and its resultant impact on demand. As the plant currently consumes
approximately 12% of New Zealand’s electricity generation per annum, a permanent shutdown
would result in an excess of supply for a number of years. The smelter is contracted to run until at
least 2018 but has a firm electricity purchase agreement with Meridian Energy contracted out until
2030. Aluminium prices have risen recently to a level of approximately USD 2,200 per ton based on
increased demand and have been trending upwards generally, furthermore the operation is still
profitable, with a sizable profit recently reported for the last financial year. The general industry
view is that the smelter will remain. As expected by commentators, pot line number 4 has been
restarted which has created a substantial additional electrical demand of 50 MW.
As of January 2017, from industry surveys, Transpower assessed that there was the potential for
3,200 MW of generation to be built leading up to 2026. Earliest commissioning dates for the new
electricity generation capacity range between 2018 and 2020. Of this new capacity, 52% would be
wind powered, 16% geothermal and 6% hydro.
While in theory there is a significant amount of new electricity generation capacity that could be
built if market conditions were favourable, these projects are not necessarily in a position to
proceed immediately, or proceed as forecast in the future, and potentially may never be built for a
variety of reasons. As a result it is important to continue to develop new potential generation
________________________________________________________________________ 10
Energy3, P. O. Box 17563, Sumner, Christchurch. Phone +64 3 376 5539, www.energy3.co.nzprojects. Often new projects may be more favourable than those on hold or previously planned
due to the modelled lower cost of electricity generated, or for example by having less
environmental impact. The Government has shown a clear preference for further increasing the
level of renewable generation within New Zealand, and as a result, a continual pool of potential
renewable projects need to be developed.
Demand grew by 1.6% in 2015 but faltered in 2016 reducing to 0.9% on the back of high winter
temperatures and low irrigation demand. Notwithstanding 2016, ongoing population growth has
provided a level of confidence around growth and this is certainly evident in MBIE Electricity
Demand and Generation Scenarios published last year which forecasts annual growth rates ranging
from 0.4% to 1.3%.
2.2. Security of Supply
Electricity is an essential input for modern lifestyles, and for commercial and industrial activity.
Industrial, commercial and domestic activities are all dependent on electricity, including
manufacturing, retail, health services, transportation, lighting, water supply and wastewater
treatment and disposal.
In New Zealand, because of its geographically isolated electricity system and reliance on hydro
generation, the main risk to security of supply is low hydro lake levels. This is especially so as a high
proportion of storage is attributable to the Waitaki Scheme in a single geographic location.
System security margins are calculated by Transpower as the winter percentage proportion of
supply divided by demand minus one. These margins have fallen from pre-2015 historic levels of
25-30% to less than 17% today.
In the base-case scenario analysed by Transpower, the New Zealand and South Island security
margins are forecast to remain above or within the security standards of 14-16% and 25.5 - 30%
until 2018 and 2021 respectively, with existing and committed generation.
To continue to meet the New Zealand winter energy security of supply standard, increasing levels
of new generation are required to be built:
The high probability generation (or equivalent) would need to be commissioned prior to
the winter of 2020.
Increasing levels of medium probability generation would be required prior to the
winters of 2021 and 2022.
After decommissioning of the Huntly Rankine units at the end of 2022 most, if not all,
medium probability, including non-dated projects, would be required through 2023 to
2026.
In the medium to long-term, the supply security forecasts are sensitive to the future plans for the
Huntly Rankine units, and, to a lesser extent, Tiwai Point smelter demand. The base-case scenario
________________________________________________________________________ 11
Energy3, P. O. Box 17563, Sumner, Christchurch. Phone +64 3 376 5539, www.energy3.co.nzassumes the Huntly Rankine units will be decommissioned at the end of 2022. In this scenario the
New Zealand and South Island security of supply margins are expected to fall below the security of
supply standard for energy.
TransPower found in the base-case assessment that significant generation investment would be
needed to maintain energy security margins within the security standards beyond 2022.
2.3. Forecast Growth in Electricity Demand
Analysis of New Zealand’s net generation output between 1974 and 2016 highlights an increase
from a base of 19,751 GWh to 40,547 GWh, an average annual compound growth rate of 1.7%.
Historically electricity demand growth in New Zealand has been closely aligned to economic
growth, as with other developed countries.
Following a number of years of successively increasing demand, the established trend was
reversed in 2007, and since then demand growth has been relatively flat at 0.4% per annum on
average to date. The fall in demand is partially attributed to the Global Financial Crisis, but also to
increasing winter temperatures which have reduced residential demand. In addition increases in
the minimum efficiency for appliances, and increased performance standards for new buildings are
contributing factors to the fall in demand. Energy intensity, a measure of energy efficiency, has
also improved over this time.
MBIE published new electricity and demand scenarios for the years 2016-2050 recently, five
potential future scenarios were analysed. The various scenarios assessed key variables that
contribute to demand such as; joint high GDP and population growth, high future carbon prices,
the future of Tiwai Point Aluminium Smelter, and a disruptive scenario where electric vehicles
achieve a high level of consumer uptake, resulting in displacement of internal combustion engine
vehicles. These forecasts envisaged an annual average growth in demand of between 0.4% and
1.3%.
Demand is expected to grow under all scenarios over time as population, the economy, and
household incomes grow. It was found grid demand is higher in the disruptive scenario than all
other scenarios except the high growth scenario. This is due to charging of the estimated 1.77
million electric vehicles in this scenario by 2040. However, this higher grid demand is partly offset
by the estimated 1,600 GWh of household Solar PV generation in 2040. Total consumer demand,
which includes the demand met by household solar PV, is at a very similar level in the disruptive
and high growth scenarios by the early 2040’s.
The MBIE demand forecasts are conservative when viewed against the average growth rate over
the last 43 years, however it is extremely difficult to predict future demand. The rate of
technological change is progressing rapidly and is often related to electrical consumption, thus
compounding prediction inaccuracies. The general move to increasing electrification of New
Zealand vehicle fleet is a major new area of demand not seen before by the electrical system which
will increase overall demand in the long term.
________________________________________________________________________ 12
Energy3, P. O. Box 17563, Sumner, Christchurch. Phone +64 3 376 5539, www.energy3.co.nzTranspower recently released is Energy Futures white paper in June this year. The paper was
commissioned to assess the impact of a de carbonized economy in conjunction with increased grid
connected renewable generating plant, and how they may affect New Zealand’s power system. A
key finding of the paper is that electricity demand will double by 2050, Transpower stressed that in
order to meet this demand, significant and frequent investment in New Zealand’s generation
portfolio will be necessary in the coming years.
Transpower also found that New Zealand also has a stronger incentive to electrify than most
other countries. This is because the majority of generation, and future generation, can continue to
be derived from non-fossil fuel sources. Most other countries lack the natural resources required
for renewable generation potential, and therefore electricity is much more likely to continue
relying on generation using fossil fuels in those countries.
In its estimations based on a low carbon future, Transpower gave the example that in order to
meet its predictions of 60TWh of new generation requirement by 2050, the equivalent of 4.5 wind
farms with an average size of 60MW would be required to be built each year.
These forecasts reinforce the need for the development of projects such as the proposed Kaimai
Wind Farm.
________________________________________________________________________ 13
Energy3, P. O. Box 17563, Sumner, Christchurch. Phone +64 3 376 5539, www.energy3.co.nz2.4. Supply Considerations
For a stable power system that is able to meet demand in the future, it is crucial that New
Zealand has an active pool of potential generation projects that have been investigated and
consented. One of the important drivers is to have new projects available for construction which
align with the Governments desire to increase the proportion of electricity derived from renewable
generation sources. The new projects may be developed either to offset increasing demand, to
substitute generation from sources which are nonrenewable, or offset lost generation capacity
from retired generation plant.
It is also important to consider further electricity generation diversification as a positive
implication of new developments. As New Zealand is highly reliant on hydroelectric generation,
years of modest inflow into the storage lakes can cause the potential for national power shortages.
This is compounded by the fact that most of the storage is in a relatively small geographic location,
so that storage inflows are not averaged of the entire country where multiple weather patterns
may reduce seasonal variations at any one time. The problem typically manifests when low hydro
storage levels and low inflows in the winter correspond with national peak yearly demand. If this
situation occurs, generation is curtailed so that the hydro storage lakes do not fall below minimum
consented operating levels. Wholesale prices are driven upwards by the reduction in supply, as
generating plant with higher operating costs must be run to meet any shortfall, and that the
market responds in a typical manner to scarcity.
Notable “Dry” year events have occurred in 2001, 2003, 2006, 2008, 2012, and 2017.
Nevertheless the amplitude of the price fluctuations due to low hydro storage levels has
decreased in recent years due to several contributory factors. These include; the commissioning of
new geothermal and wind generation capacity, and improvements to the HVDC inter-island link
and the transmission grid in the North Island.
The addition of electricity generation capacity with output that is not closely correlated with the
weather patterns that feed the main hydro lakes in the South Island will improve the diversity of
the national electricity generation capacity and strengthen resilience against dry year events.
Electricity generation from gas is the second biggest contributor to New Zealand’s supply
following hydroelectric power. Gas generation is unlikely to increase is proportion to overall
generation as firstly, consumer demand for non-energy use is increasing thus competing for
currently available supply. Secondly, it is projected that without new discoveries and at current
consumption rates that remaining reserves will be exhausted within 11 years. It is possible that
further gas may be extracted from the existing reserves if through higher gas prices it is economic
to employ advanced gas extraction techniques.
Investment in gas exploration has declined markedly worldwide, and New Zealand has followed
that trend despite favourable exploration incentives from the prior Government. Permits declined
in step with only one permit issued in 2016, compared to 9 in 2015. There have been no significant
________________________________________________________________________ 14
Energy3, P. O. Box 17563, Sumner, Christchurch. Phone +64 3 376 5539, www.energy3.co.nzdiscoveries in recent years that materially increase reserves that might favour increased gas
generation. Furthermore the current government has recently banned all new oil gas permits,
severely limiting gas generation possibilities in the future.
Gas generation plants may have a place as peaking plants in the future, for example Contact
Energy recently constructed a 200 MW gas turbine plant at Stratford, with this intent in mind. This
plant only operates at times of high electricity prices which may occur during hydro generation
shortages, or plant outages. Peaking plants have decreased fuel requirements given they are only
run periodically, and can bear a higher fuel cost if electricity prices are high.
Base-load gas generation plant is likely to become less viable as gas supply is constrained over
time and prices logically increase. The recent closures of base-load gas plant indicate that they are
uneconomic to operate.
As a further example, Nova Energy is yet to develop its planned 360MW gas fired power plant
near New Plymouth that has been consented for some time.
Another important consideration in terms of future supply is that many currently consented wind
farm projects that have not been built have a shortening development window until the existing
consents lapse. Some of these projects may struggle to obtain renewed consents if they do lapse,
reducing the pool of potential future generation. Furthermore a number of these projects have
been consented with turbines that are now considered small or obsolete, and as such would need
to be re-consented, in which a favourable outcome could not be guaranteed.
2.5. Generation Development Options
There are a range of possible generation options available to increase total electricity supply in
the future, these include; wind, hydro, gas-fired, geothermal, coal, and new and developing
generation options such as solar, wave and tidal.
New Zealand is recognized as having a world class wind resource, primarily because of the
country’s isolated geographic position in the Southern Ocean. While wind generation in New
Zealand has grown substantially in the last 20 years, it only contributes a relatively small
proportion of total electricity supply (6% in 2016).
Over the last 15 years larger scale electricity generation developments in New Zealand have
typically been either geothermal, wind, or gas-fired. However as discussed, the outlook for gas
supply in New Zealand has changed significantly, especially since gas production from the Maui gas
field has declined, and new permits are now banned.
For other options, such as hydroelectricity generation which currently provides the majority of
New Zealand’s electricity supply, there is potential for further development, however, the
opportunity for new large-scale hydroelectricity projects is limited due to environmental concerns
associated with the damming of large rivers.
________________________________________________________________________ 15
Energy3, P. O. Box 17563, Sumner, Christchurch. Phone +64 3 376 5539, www.energy3.co.nzGeneration options, such as geothermal generation, can only occur at a commercial scale where
significant proven geothermal resources are located, notably being a close proximity to the North
Island’s central plateau.
Technical performance of all generation types has improved, particularly so for some
technologies. Over the last 10-15 years there have been major technological advances in Wind
Turbines and Photovoltaic Solar. Gains have been made in terms of efficiency, reliability, and cost.
Despite advances in solar energy technology and relatively rapid domestic uptake, it is likely that
it will be some time before projects at utility scale are commercially viable in New Zealand.
Alternative technologies that may have commercial potential in future include wave and tidal
power, however these technologies are still firmly in the developmental stage and are not likely to
be commercially viable for a number of years.
________________________________________________________________________ 16
Energy3, P. O. Box 17563, Sumner, Christchurch. Phone +64 3 376 5539, www.energy3.co.nz3. Site Considerations and Rationale
This section investigates site development considerations, and provides further rationale for the
Kaimai Wind Farm Site.
3.1. Identification of Wind Farm Sites
Ventus Energy (NZ) Ltd (owner of Kaimai Wind Farm Limited) has historically had an active
program focused on investigating and developing new renewable electricity generation
opportunities throughout the upper North Island. Kaimai Wind Farm Limited has used both
traditional site assessment methods and modelling techniques to identify potential wind farm
sites. This analysis has identified the Kaimai Range area as being the most suitable site in the
region for wind farm development.
The investigation of the wind resource at a number of sites throughout New Zealand has formed
the basis for Kaimai Wind Farm Limited’s consideration in determining general and specific areas
that may be viable for the development of utility scale wind farms.
As part of the selection process for a potential site which warrants further investigation, and the
possible development of a wind farm, several technical matters relative to the site are evaluated.
While every potential location for a wind farm has its individual nuances, it is generally accepted
that a site which has the collective following attributes will be a suitable candidate for wind
generation at a commercial scale:
Availability of a good wind resource (typically an average annual wind speed greater
than 7.5 m/s, ideally associated with low turbulence).
Availability of land suitable for the construction of turbines.
Close proximity to locations of high energy demand.
Suitable distance from large population centres.
Practical access for transporting equipment and materials to the Site.
Ability to connect to the national grid.
Avoidance of sensitive environmental areas.
Kaimai Wind Farm Limited has considered each of these matters in detail when selecting the
Kaimai Site as a feasible development project. Each criterion is discussed in further detail as
follows.
________________________________________________________________________ 17
Energy3, P. O. Box 17563, Sumner, Christchurch. Phone +64 3 376 5539, www.energy3.co.nz3.2. Wind Resource
Areas with wind speeds sufficient for commercial wind farm projects in New Zealand are found in
a number of select locations, including the Kaimai Ranges. Not all of the greater Kaimai region is
suitable however, due to steep and difficult terrain that not only precludes access, but also gives
rise to high levels of wind turbulence which can be structurally damaging to wind turbines.
The Kaimai Site was first identified by the principals of Kaimai Wind Farm Limited in 2005 as the
outcome of a site screening process. The assessment was undertaken to identify likely areas of
higher wind speeds that were also practical from a buildability perspective, had potential for grid
connection, and that were located in close proximity to an area of high electrical demand.
An initial assessment of the area was undertaken utilising specific desktop studies, wind
modelling, and a terrain assessment. In addition, Site visits and consultation with local landowners
were also undertaken to assess the potential for development of a wind farm in the area.
The favourable outcome of the initial site assessment and landowner meeting led to the
commencement of a detailed wind monitoring campaign commencing in 2006.
The wind resource assessment of the Kaimai project was conducted by physical wind monitoring
across the Site. Data was collected from a number of monitoring masts and associated
meteorological recording equipment, installed on representative turbine locations across the Site.
The analysed meteorological measurements have been used to understand Site specific wind
conditions in detail with respect to wind generation potential.
Modeling using the recorded data in conjunction with specialised software has enabled the
selection of suitable wind turbine models, and the spatial placement of wind turbines to maximise
potential energy yield. The key output of the modelling software is to provide an estimation of
potential net annual energy production of the overall Site.
A number of the proposed wind turbine sites have an average wind speed of more than 9 m/s,
and some are approaching 9.5 m/s, in addition turbulence levels are relatively low which is
favourable. The recorded meteorological parameters indicate an excellent wind regime relative to
both local and international wind farms.
In terms of Site classification, the wind speed and turbulence predominantly fit within
International Electrotechnical Commission (“IEC”) Class IB and Class IIB parameters and Class IIIB
parameters. The IEC identifies a range of wind turbine classes based on the wind resource, with
Class IB being the highest wind speed class, with low turbulence, Class IIB being an intermediate
wind speed with low turbulence, and Class IIIB being an intermediate wind speed with low
turbulence.
It is important to note that turbines with larger rotors in Class II conditions can often out produce
turbines with smaller rotors in Class I conditions. This is due to the fact that Class I Sites usually
require smaller rotor diameters in order to reduce structural loadings bought about by periodic
“extreme” wind speeds which are often encountered in Class I Sites.
________________________________________________________________________ 18
Energy3, P. O. Box 17563, Sumner, Christchurch. Phone +64 3 376 5539, www.energy3.co.nzThe following map created by NIWA illustrates the above average wind resource experienced in
the Kaimai ranges relative to the general region (Note the actual measured wind speed is higher
than modelled by NIWA, reinforcing the Sites suitability). It is clear from the map that the Kaimai
Range Site has some of the best wind generation potential close to Auckland, Hamilton, and
Tauranga, which are major electrical load centres.
Figure 1 - Mean Annual Wind Speeds in New Zealand
________________________________________________________________________ 19
Energy3, P. O. Box 17563, Sumner, Christchurch. Phone +64 3 376 5539, www.energy3.co.nzThe following map created by the Electricity Authority illustrates main load centres, transmission
lines, and generation within New Zealand, it clearly defines the Kaimai Sites’ close proximity to
major load centres.
Figure 2 – Main Load Centres, Transmission Lines, and Generation (TransPower)
The current generally agreed locations that feature a viable wind resource are shown by the
purple oval highlights in Figure 2. The diagram illustrates that the majority of areas that feature a
suitable wind resource are a relatively distant from the existing Transpower network. Therefore to
develop any project at scale in the upper north island requires a new high voltage grid corridor and
associated infrastructure. This creates three major hurdles to achieve a successful development:
________________________________________________________________________ 20
Energy3, P. O. Box 17563, Sumner, Christchurch. Phone +64 3 376 5539, www.energy3.co.nz Consenting a transmission corridor.
Obtaining the legal right from numerous landowners to occupy the land.
Installation costs are considerable, and often will make the wind energy project unviable,
or will force the development of very large projects to make the connection economic.
3.3. Suitable Land Availability
The Kaimai Site consists of a predominantly north-west facing ridgeline, and a lower plateau on
the west side of the ridgeline, both are suitably aligned to the wind resource. The landforms of the
proposed Site within the Kaimai Ranges are elevated, but not dominant, over the surrounding area
which encompasses higher elevation topography such as the Te Aroha peak with its associated
telecommunications tower.
The Site, given its topography, has the benefit of being relatively distant from surrounding
dwellings, mitigating potential noise impacts.
Overall, the topography of the area allows for practical access to be developed for construction
purposes and is suitable for turbine placement. Much of the proposed Site already has developed
farm tracks which will be upgraded to allow access of the required components and machinery.
While some of the topography is relatively steep, impacting access roading and turbine
placement, these aspects have been adequately identified and assessed in the initial site design
work. The topographical features of the Site can be readily managed through appropriate
engineering design and construction techniques.
3.4. Proximity to Locations of High Energy Demand
Proximity to major load centres is an important consideration in the development of a potential
site. The Kaimai Site is located close to Tauranga, Hamilton, and Auckland, which are all major load
centres.
Building significant generation close to load centres increases the value of energy, this is achieved
firstly by mitigating transmission losses that arise from transmission from distant generators.
Secondly locally sourced generation increases security of supply within the region, as imports from
distance generating plants have an increased risk of transmission failure. For example, in 2010 the
Makara Wind Farm supported Wellington’s electrical load when the HVDC link tripped, without the
contribution from the wind farm, Wellington would have faced an electrical energy shortage
resulting in a potential blackout.
3.5. Distance from Large Population Centres
It is important that sites are suitably located away from large residential populations, such that
any potential noise or visual effects of the wind farm are minimised.
The Kaimai Site is located in a rural area that is relatively sparsely populated. The surrounding
area is rural in nature, comprising land used for primary production. The population centres
________________________________________________________________________ 21
Energy3, P. O. Box 17563, Sumner, Christchurch. Phone +64 3 376 5539, www.energy3.co.nzlocated close to the Site are relatively modest in size. Paeroa is the nearest town (population
3,900) at a distance of 7KM, followed by Te Aroha (population also 3,900) at a distance of 9KM.
Seven small rural settlements are located around the Site, these include; Waihou, Elstow, Mangiti,
Tirohia, Mackaytown, Karangahake, and Waikino.
3.6. Accessibility
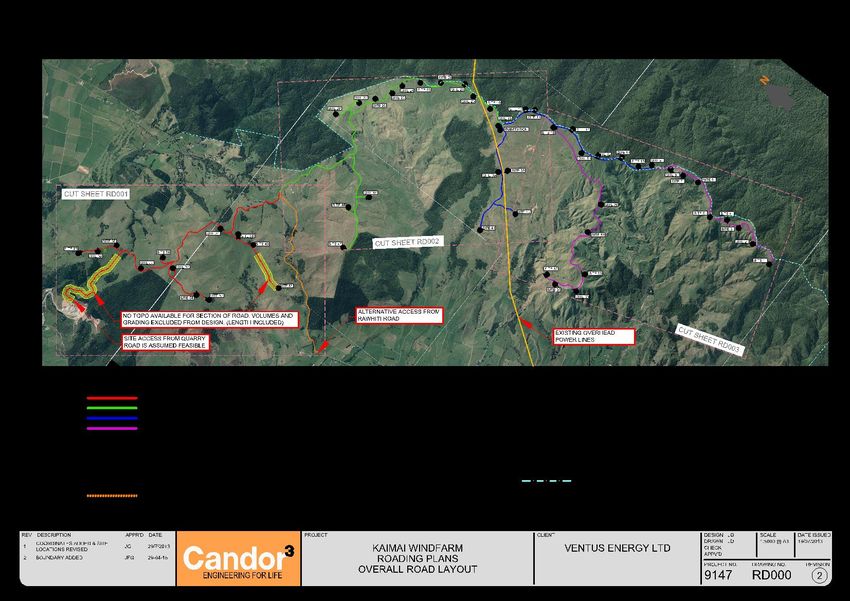
The Turbine components to be used for the Kaimai Wind Farm (i.e. blades, tower sections and
nacelle) are manufactured overseas and will need to be shipped to New Zealand. A suitable route
has been identified to transport these components from the Port of Tauranga, being relatively
close at a distance of approximately 103km. By far the majority of the route is arterial (State
Highway 29, State Highway 26, and State Highway 26), other than the turn in off to Rawhiti Road
which is a short straight stretch of road (4.8km until site turn-in). Given the route is on major
arterial Highways and the secondary road has no corners until the site turn-in, no major road
upgrades are envisaged.
Other External Roads in the vicinity of the Kaimai Wind Farm are suitable for site access for Heavy
Commercial Vehicles (“HCV’s”) and other construction traffic, although may require some
upgrading (such as curve straightening, widening or sealing).
Internal Roads on private land will also be required to access the Turbine locations within the Site.
Where possible, existing farm access tracks will be used, although such tracks will need to be
upgraded (including widening, sealing and/or strengthening in some places), to enable
transportation of the Turbine components to the required locations within the Site.
Overall, appropriate access to the Kaimai Site for both the construction phase, and the ongoing
operational phase can be achieved in a relatively straightforward manner.
3.7. Ability to Connect to the National Grid
The Site has the substantial development advantage that a 110kV Transpower line passes directly
through the Site at its southern end. This means that no additional transmission lines external to
the Site are required to be built, completely avoiding the associated environmental impact.
The TransPower connection feeds electricity into the upper North Island region via various sub
stations, a significant net demand location.
3.8. Avoidance of Sensitive Environmental Areas
The Kaimai Wind Farm Site is not identified in the planning documents as being within or part of
an outstanding natural feature or landscape. However, the Site borders the Karangahake National
Park to the East.
The majority of the Kaimai Site is covered with exotic pasture used for pastoral farming, although
there is some scattered remnant indigenous vegetation at the Site. These areas are not located
________________________________________________________________________ 22
Energy3, P. O. Box 17563, Sumner, Christchurch. Phone +64 3 376 5539, www.energy3.co.nzwithin the construction area for the Kaimai Wind Farm and will continue to be avoided through
careful project design and implementation.
4. Design Approach
4.1. Design Iterations
2005 to April 2008 - 11 turbines (2MW)
Ventus Energy has been working on the project design on the Site since 2005, where initial data
was collected from the first temporary monitoring mast installed and preliminary development
plans researched. This was a preliminary scoping monitoring mast that was installed on the top
ridgeline. At that time only one landowner, being Waitoki Downs Ltd (owned by Mr. Jim Shallue)
was involved in the project (the previous owner to the Denize Brothers property).
October 2008 to 2012 - 27 to 32 turbines (3MW)
Waitoki Downs Ltd subsequently purchased the property to the south of the initial project area,
thus in conjunction with discussion with the landowner, potential layouts were extended onto that
property (Pukeroa Station). A 50m tall monitoring mast was installed upon the main ridgeline to
confirm the wind resource. Project development became focused and concentrated on the main
ridgeline adjacent to the DoC boundary in order to maximise energy yields and economic viability.
At this time the most productive turbines available were 3MW machines with rotor sizes of 90 to
100m diameter.
2013 to 2015 – 54 to 60 turbines (3MW)
As newer turbine designs that are suited to lower wind speed areas became available, the
decision was made to extend the project footprint to the north of the original development area,
hence Rotokohu Farms Ltd farm was included in the project. At this time the landowner to the
south of Pukeroa Station also signaled their interest in the project. Extending the road south to
include another 5 turbines was seen a small practical increment.
Bird and bat monitoring was extended along the entire main ridgeline. However it became
apparent from the studies that a higher degree of bat activity was present to the south of the
project. As evidenced in the Kessels Ecology report Attachment B6 in the AEE.
During 2015 the DoC estate to the east was designated as an ONL under the Waikato RPS. In
conversation with landscape consultants and planning consultants it transpired that the further
south the project extended, then the greater were the perceived effects on landscape.
Lastly, Waitoki Downs Ltd came under financial stress and as a result both properties were sold to
different owners, Pukeroa Station was purchased for the purposes of a piggery development by
________________________________________________________________________ 23
Energy3, P. O. Box 17563, Sumner, Christchurch. Phone +64 3 376 5539, www.energy3.co.nzKaimai Pork Ltd. Kaimai Pork itself became financially distressed and was sold in a bank liquidation.
No development rights exist on Pukeroa Station currently.
As a result of landowner changes, and feedback from specialist reports a decision was made to
curtail the project, and thereby significantly reduce the effects on landscape and bat habitat.
Furthermore the changes enable the project to be located in the jurisdiction of one local authority
to simplify the resource consent application process.
End 2015 to Early 2018 – 24 to 26 turbines (3+ MW)
A 60m monitoring mast (location A1) was installed on the Rotokohu Farms property in July 2016
to confirm financial viability of extending the wind farm site north. The wind resource was found to
be suitable for the new generation of large rotor diameter Class III turbines, with mean annual
wind speeds in the order of 7 to 8m/s.
The monitoring mast on the Denize property, (location A3) was re furbished and re installed in
April 2016, and which has subsequently confirmed an excellent mean annual wind speed of
approximately 9.5m/s. The combined average wind speed over the site is therefore calculated at
7.8m/s which then allows the project to be economically viable.
Hence a clear two stage type project has arisen with two defined areas, a lower ridgeline cluster
and an upper ridgeline cluster. Collectively the wind turbines can produce sufficient output which
supports the economic viability.
Within this period Maureen Jackson’s landholding was also brought in to the project, allowing the
placement of 26 turbines.
After consultation with stakeholders two turbines were removed from the project:
The most northerly turbine due to its proximity to housing.
A turbine between the lower ridgeline and upper ridgeline to make safer passage for gliders.
Historical design layouts can be found in the appendix of this report that show the design
evolution.
Final Design Approach – 24 turbines (4+MW)
The proposal by Kaimai Wind Farm Limited comprises of a 24-turbine wind farm, built over 3
private landholdings. Of the 24 turbines, 17 are on the lower reaches of the Kaimai Range, and 7
are on the ridgeline. The turbine layout and number were arrived upon to optimise the Site
utilisation for wind generation while mitigating potential impacts described in previous iterations.
With the size of turbine increasing over time it has become possible to reduce the number of
wind turbines (and therefore increase spacing). This evolution is evident on the upper ridge, for
example early turbine iterations on the top ridgeline allowed for 11 wind turbines, numbers were
________________________________________________________________________ 24
Energy3, P. O. Box 17563, Sumner, Christchurch. Phone +64 3 376 5539, www.energy3.co.nzreduced to 9 wind turbines, and finally now only 7 are proposed. Generally, fewer larger turbines
that rotate more slowly are seen as more visually appealing, as opposed to greater numbers of
smaller machines. Typically larger turbines also improve the project economics.
Two turbine sizes are utilised, the lower turbines experience lower wind speeds to those of the
ridge line turbines, therefore machines with larger rotors are modelled (up to 160m diameter), and
a slightly higher hub height ( up to 132m). The ridgeline turbines are modelled with up to 146m
diameter rotors and up to 112m hub heights. The smaller rotor size and lower hub height of the
ridgeline turbines helps to reduce the visual impact relative to using larger models.
The turbine placement has been undertaken considering the various Site constraints, and
aesthetics, in conjunction with the wind resource. A crucial aspect of the design is that turbines
need to be suitably spaced for generation efficiency and operational reasons, so that an upwind
turbine does not “shade” the wind from one downwind, reducing its capability to generate
electricity. With respect to this requirement, any wind turbines within the project envelope are to
be separated in so much as possible so that an ellipse drawn around each wind turbine does not
overlap the ellipse drawn around any other wind turbine. The ellipse is orientated to the prevailing
wind at 225 degrees from due north, with the major axis of the ellipse being 5 times the diameter
of the rotor, and the minor axis being 2.3 times that of the rotor diameter.
Figure 3: Ellipsoid spacing methodology which reflects dominant wind directions
________________________________________________________________________ 25
Energy3, P. O. Box 17563, Sumner, Christchurch. Phone +64 3 376 5539, www.energy3.co.nzYou can also read