ASSESSMENT OF MULTIPLE LAYERS OF SECURITY SCREENING OF TRUCKS BY CUSTOMS BORDER PROTECTION IN EL PASO, TEXAS
←
→
Page content transcription
If your browser does not render page correctly, please read the page content below
ASSESSMENT OF MULTIPLE LAYERS OF
SECURITY SCREENING OF TRUCKS BY
CUSTOMS BORDER PROTECTION IN EL PASO,
TEXAS
by

Robert S. Trotter and Brenda K. Manak

Project performed by
Center for International Intelligent Transportation Research
In cooperation with
Coalición Empresarial Pro Libre Comercio (CELC)

Report No. 186043-00005
CIITR Project 186043-00005:

August 2013

Report prepared by
Center for International Intelligent Transportation Research
Texas A&M Transportation Institute
4050 Rio Bravo, Suite 151
El Paso, Texas 79902

TEXAS A&M TRANSPORTATION INSTITUTE
The Texas A&M University System
College Station, Texas 77843-3135
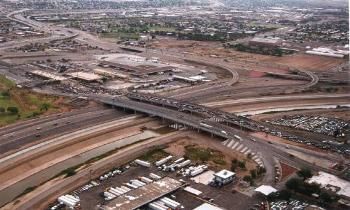
TABLE OF CONTENTS
                                                                                                                                           Page
List of Figures ................................................................................................................................ ii
List of Tables ................................................................................................................................. ii
Disclaimer and Acknowledgments ............................................................................................. iii
Executive Summary ...................................................................................................................... 1
Chapter 1: Introduction ............................................................................................................... 2
Chapter 2: Literature Review ...................................................................................................... 4
  Border Crossings ....................................................................................................................... 4
      Bridge of the Americas ....................................................................................................... 4
      Ysleta–Zaragoza Bridge (Zaragoza) ................................................................................... 4
      Santa Teresa Crossing ......................................................................................................... 6
  Border Wait Time ..................................................................................................................... 7
      Causes of Increased Border Wait Time .............................................................................. 8
      Effects of Increased Border Wait Time .............................................................................. 9
  Trusted Shipper Programs....................................................................................................... 10
Chapter 3: Why Trusted Shipper Programs Are Not Being Used ......................................... 13
  Cost of Trusted Shipper Program Membership ...................................................................... 13
      Large Companies .............................................................................................................. 13
      Small Companies .............................................................................................................. 13
  Other Deterrents to Trusted Shipper Membership .................................................................. 14
Chapter 4: Survey Document and Results................................................................................ 15
  Survey Response ..................................................................................................................... 16
  Border Crossing ...................................................................................................................... 17
  Border Wait Time ................................................................................................................... 18
  Border Crossing Routes .......................................................................................................... 19
  Export Questions..................................................................................................................... 22
      Number of Trips ................................................................................................................ 22
      Warehousing of Goods ..................................................................................................... 22
  Membership Questions ........................................................................................................... 23
      Qualifications for Membership ......................................................................................... 23
      Membership Benefits ........................................................................................................ 24
Chapter 5: Conclusions and Recommendations ...................................................................... 26
     Recommendations and Conclusions ....................................................................................... 27
References .................................................................................................................................... 29
Appendix .................................................................................................................................... A-1

Center for International Intelligent Transportation Research
Texas A&M Transportation Institute                                                                                                         Page i
LIST OF FIGURES

                                                                                                                            Page
Figure 1. The Bridge of the Americas (1). ..................................................................................... 4
Figure 2. Ysleta–Zaragoza Bridge (2). .......................................................................................... 5
Figure 3. Distance between the BOTA and Zaragoza Bridge (5). ................................................. 6
Figure 4. U.S. Border Crossing Primary Inspection Booth. .......................................................... 7
Figure 5. Survey Participants by Company Type. ....................................................................... 17
Figure 6. Border Crossing Use by all Survey Participants. ......................................................... 17
Figure 7. Perceived Border Wait Time at the BOTA and Ysleta–Zaragoza Bridge.................... 19
Figure 8. Who Determines Border Crossing Routes. .................................................................. 20
Figure 9. When Travel Routes and Border Crossings are Determined........................................ 20
Figure 10. Who Determines Alternate Travel Routes and/or Border Crossings. ........................ 21
Figure 11. Factors Considered When Selecting Border Crossing Routes. .................................. 21
Figure 12. Company Use of Warehousing Prior to Exportation of Goods. ................................. 22
Figure 13. Membership Benefits Received by Members and Perceived by Non-Members. ....... 24
Figure 14. C-TPAT Members Indicating Membership Meets Objectives. .................................. 25
Figure 15. C-TPAT Members Indicating Benefits of Membership Meet or Exceed Costs. ........ 25

     LIST OF TABLES

                                                                                                                            Page
     Table 1. El Paso/Ciudad Juarez Trade, Transportation, and Border Crossing Professionals. . 3
     Table 2. Border Wait Times for Commercial Vehicles at the Bridge of the Americas. .......... 8
     Table 3. Border Wait Times for Commercial Vehicles at the Ysleta–Zaragoza Bridge. ........ 8
     Table 4. Survey Response Rate. ............................................................................................ 16
     Table 5. Border Crossing Use by Company Type. ................................................................ 18
     Table 7. Exports per Week and Assigned Company Size. .................................................... 22
     Table 8. Requirements and Supply Chain Guidelines Needed for C-TPAT Membership. ... 23
     Table 9. Certifications Held by C-TPAT and Non–C-TPAT Members. ............................... 23
     Table 10. Percent of Non–C-TPAT Members with Identification Numbers. ........................ 24

Center for International Intelligent Transportation Research
Texas A&M Transportation Institute                                                                                          Page ii
DISCLAIMER AND ACKNOWLEDGMENTS
This research was performed by the Center for International Intelligent Transportation
Research, a part of the Texas A&M Transportation Institute, in cooperation with the Coalición
Empresarial Pro Libre Comercio (CELC). The contents of this report reflect the views of the
authors, who are responsible for the facts and the accuracy of the data presented herein.
The research team thanks Rafael Aldrete, Oscar Kuri, Sarai Kuri, Eun Sug Park, Lupe
Ramos, Aracely Soto, Juan Carlos Villa, and Alex Valdez for their expertise and assistance in the
performance of project activities.
Center for International Intelligent Transportation Research
Texas A&M Transportation Institute Page iiiEXECUTIVE SUMMARY
Since the creation of the North American Free Trade Agreement (NAFTA) in 1994, cross
border travel and trade have continued to grow at a steady rate. This growth has been mitigated
by two outside occurrences that have impacted border security and economic investments. The
attack on the United States on September 11, 2001 (9/11), affected border security, and the
world-wide economic downturn of 2008 impacted investments along the border. Both the
United States and Mexican governments have stated that they do not have additional funding to
put into border infrastructure or to increase staffing levels to meet ever growing cross border
traffic.
Increase in trade has provided a substantial economic boost to border communities. With the
growth in volume of vehicles crossing, there is additional traffic on bridge infrastructures and
adjacent roadways. Cross border congestion causes bridge saturation and increased border wait
time (BWT), which add to the cost of doing business. To address these issues, the U.S. and
Mexican governments are forming Public-Private-Partnerships (PPP) which have developed
trusted shipper programs such as the Customs-Trade Partnership Against Terrorism (C-TPAT)
and Free and Secure Trade (FAST) in the United States, and Nuevo Esquema de Empresas
Certificades (NEEC) in Mexico.
Membership in the U.S. program has remained level for a number of years. The Mexican
program is relatively new. The goal of both countries is to increase membership in their trusted
shipper programs with the goal of increasing border security and reducing BWT.
This research project focused on border congestion at the Bridge of the Americas (BOTA),
which is a free crossing, the Ysleta–Zaragoza toll bridge, and the Santa Teresa, New Mexico,
crossing. Researchers looked at current conditions and reviewed BWTs, as well as reviewed
projected growth analysis to determine how these crossings were now being utilized and to
consider improvements that will be needed to meet anticipated growth. The study also
considered the effects of increased BWT on the status of just-in-time (JIT) inventory, supply
chain security, and economic impact. We surveyed 250 cross border manufacturing and
transportation companies.
TTI partnered with the Coalición Empresarial Pro Libre Comercio (CELC) to conduct a
bilingual survey of 250 cross border companies obtaining 55 responses which provided a
confidence level of 90% for our findings. Previous border surveys have tended to focus only on
the U.S. side of the border, but this effort targeted the Mexican border crossing community, as
well. Survey questions focused on awareness of trusted shipper programs’ membership
requirements, cost of joining trusted membership programs, and benefits of trusted shipper
program membership.
The targeted audience for the survey recommendations is U.S. Customs and Border
Protection Agency, Mexican Aduana (Customs), and the public and private sector who share a
common goal of increasing membership in the trusted shipper programs. The survey findings
may also be used to build a border crossing predictive model to provide decision-makers a new
method to understand how membership in trusted shipper programs can provide economic
benefits as well as reduce border congestion.
Center for International Intelligent Transportation Research
Texas A&M Transportation Institute Page 1CHAPTER 1:
INTRODUCTION
The two primary international bridge crossings in El Paso, Texas, are quickly reaching their
saturation points for commercial truck crossings. Saturation points at the Bridge of the Americas
(BOTA) and the Ysleta–Zaragoza International Bridge negatively impact the economic growth
of El Paso and Ciudad Juarez, Mexico, through loss of current and new business opportunities
due to increased border wait time (BWT). In addition to economic issues, increased BWTs
affect the quality of life and air in the border cities of El Paso and Ciudad Juarez.
U.S. Customs and Border Protection (CBP) has created trusted shipper programs that
expedite border crossings and reduce BWTs resulting in a reduction of congestion for trucks,
private automobiles, buses, and pedestrians. This report focuses on why shippers and
manufacturers choose not to join CBP trusted shipper programs and what incentives might
influence them to join.
In addition to the two international bridge crossings, the report evaluates the land border
crossing at Santa Teresa, New Mexico. The report findings are based on an extensive literature
review; interviews with border specialists including engineers, CBP officials, and city officials;
and data obtained by conducting an electronic survey of companies that utilize these border
crossings every day. A literature review was conducted to discover previous research relevant to
this study. We looked at topics including but not limited to border crossings, border wait time,
C-TPAT, FAST, economic development, U.S.–Mexico trade issues, ports of entry, supply chain
security, just-in-time inventory, industrial parks, and finance.
In addition to the reference material found in the literature review, the professionals listed in
Table 1 were contacted regarding their expertise in the El Paso/Ciudad Juarez trade,
transportation, and border crossings. TTI staff either met with or spoke with these professionals
to get their views on trade, transportation, and border crossings for the El Paso/Ciudad Juarez
region.
Center for International Intelligent Transportation Research
Texas A&M Transportation Institute Page 2Texas A&M Transportation Institute
Center for International Intelligent Transportation Research
Table 1. El Paso/Ciudad Juarez Trade, Transportation, and Border Crossing Professionals.
Name Type of
Organization Organization
Garrick Taylor
Private (non-profit)
Border Trade Alliance (BTA)
Rod Hudson
U.S. Government/Import Businesses Partnership
Customs-Trade Partnership Against Terrorism (C-TPAT)
Rod Hudson
U.S. Government Agency
Customs Border Protection (CBP)
Bob Cook and Manuel Ochoa
Non-profit Business Consultant
El Paso Regional Economic Development Corporation (REDCo)
Stephanie Caviness
Association of International Commerce
Foreign Trade Association (FTA)
Erik Lee and Christopher Wilson
Woodrow Wilson International Center for Scholars, Arizona State University, U.S. Government/Private Research Center/State University
North American Center for Transborder Studies, Mexico Institute
Juan Carlos Villa and Jolanda Prozzi
State Agency/University
Texas A&M Transportation Institute
Said Arbri-Cherif
City of El Paso
International Bridge Director
Page 3CHAPTER 2:
LITERATURE REVIEW
BORDER CROSSINGS
Bridge of the Americas
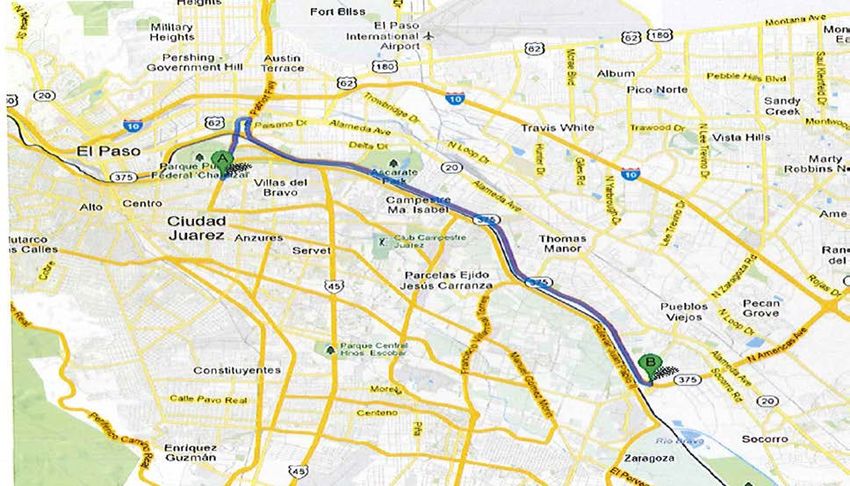
Construction of the Bridge of the Americas was completed in 1998. It is located between El
Paso and Ciudad Juarez as shown in Figure 1. The border crossing consists of two bridges that
each have two lanes for commercial traffic, four lanes for passenger vehicles, and sidewalks for
pedestrians (1). The BOTA is open for commercial vehicle inspection services Monday through
Friday from 6:00am to 6:00pm, and on Saturdays from 6:00 to 2:00pm (1).
Figure 1. The Bridge of the Americas (1).
Ysleta–Zaragoza Bridge (Zaragoza)
The original Ysleta–Zaragoza crossing was built in 1938. It was rebuilt in 1955 and, most
recently, in 1990 (2). This bridge consists of two separate bridges, one of which is a four-lane
bridge dedicated for commercial vehicles. The commercial bridge has two southbound lanes,
one northbound lane, and one northbound FAST (Free and Secure Trade) lane (3). The bridge
charges a fare to all southbound and northbound traffic (1).
Center for International Intelligent Transportation Research
Texas A&M Transportation Institute Page 4The Ysleta–Zaragoza bridge at the Ysleta Port, shown in Figure 2 is open for commercial
vehicle inspection services on Monday through Friday, 6:00am to 12:00midnight and on
Saturdays from 8:00am to 4:00pm (1). Commercial truck traffic shifts to this crossing every
evening as the free BOTA’s inspection services close at 6:00pm weekdays and at 2:00pm on
Saturdays (2).
Figure 2. Ysleta–Zaragoza Bridge (2).
Although some commercial traffic moves to the Ysleta–Zaragoza Bridge at night, Bob Cook
with the El Paso Regional Economic Development Corporation (REDCo) indicates that the
Ysleta–Zaragoza crossing is not convenient because of geographic dispersion of manufacturers
and roadways. Foreign Trade Association president Stephanie Caviness agrees that, “it takes too
long for industrial parks in west and central Juarez to travel east to use the Ysleta–Zaragoza
Bridge crossing.” Figure 3 displays the 21.6-mile distance between the BOTA and Ysleta–
Zaragoza crossings (4).
Caviness stresses that, “truckers lose 1.5 hours driving to Ysleta–Zaragoza when they can
clear the BOTA in a shorter amount of time than driving to Ysleta–Zaragoza” and that “the road
structure east to west is not good for traveling as most major roads head north to the border.”
However, REDCo’s Bob Cook indicated in a June 2012 phone conference that “Juarez has
completed a loop on the southeast side to encourage trucks to use the Ysleta–Zaragoza facility
and is also constructing a new toll bridge, the Tornillio Guadalupe International Bridge
scheduled for completion in 3 to 5 years.”
Center for International Intelligent Transportation Research
Texas A&M Transportation Institute Page 5Figure 3. Distance between the BOTA and Zaragoza Bridge (5).
A proposal to reduce the hours of service at the BOTA by 4 hours was recently considered.
The proposed reduction would allow the CBP to move officers from the free BOTA to the
Ysleta–Zaragoza toll bridge to expand their service in an attempt to attract more users at the
underutilized Ysleta–Zaragoza facility without increasing CBP officers or funding.
Border Trade Alliance (BTA) member Garrick Taylor voiced concern with the proposal
indicating that, “it is not only the cost of tolls, but the increase in time to travel to the Ysleta–
Zaragoza facility as it is too far away from the Maquila operations.” The Texas A&M
Transportation Institute’s (TTI’s) Jolanda Prozzi in her work on the Southwest Border
Infrastructure Master Plan concurred that recent interviews with members of the El Paso
business community indicate that, “Maquila operators and truckers are reluctant to move away
from BOTA, because of costs and the extended transportation corridor to cross at Zaragoza.”
CBP El Paso office representative, Patricia Aveitia in a phone interview stated that, “the
proposed change in hours at BOTA is not being well received from trade and transportation
community and the Maquiladores resent the change as it impacts their level of service at BOTA.”
Santa Teresa Crossing
The Santa Teresa crossing facility, built in 1997, is the newest port of entry on the
U.S./Mexico border, replacing the original port that opened in 1992. Although it is located on
the New Mexico/Mexico border, it is a short 20-minute drive from downtown El Paso (6). The
port of entry is open for commercial traffic weekdays from 8:00am to 8:00pm and on Saturdays
from 9:00am to 2:00pm. This port is known for its exportation of used vehicles and its large
import/export facility for livestock on the Mexican border (6).
Center for International Intelligent Transportation Research
Texas A&M Transportation Institute Page 6BORDER WAIT TIME
Border wait time is the time it takes when traffic first queues on approach to a border
crossing facility until the vehicle reaches the primary inspection booth, see Figure 4. BWT is
measured through surveys, vehicle tracking, loop detectors, radar, video, radio-frequency
identification (RFID), license plate recognition, and Bluetooth™ technology (7).
Figure 4. U.S. Border Crossing Primary Inspection Booth.
The BOTA and the Ysleta–Zaragoza crossings, along with other busy crossings, have been
equipped with RFID technology. The readers gather information from RFID tags already placed
on trucks crossing the border. The data reveal the time it takes a commercial vehicle to travel
from a point on the south side of the border through Mexican/U.S. Customs and state safety
inspections to a point on the Texas side of the border (8).
BWTs have increased significantly since the events of 9/11 (9). In a 2012 presentation at the
Mexico’s Manufacturing Supply Chain Summit, it was reported that since 2010, northbound
truck volumes are on the rise (10). K. Alan Russell, who runs industrial parks in Juarez for
dozens of companies, states that, “bridge traffic is up sharply and follows the cycle of the U.S.
economy” (11). Dr. Esther Rodriguez, Supply Chain Expert with the Texas A&M University
College of Industrial Distribution states that, “as of now, there is no indication that the bridges in
El Paso have become so saturated that they are negatively impacting Just in Time (JIT)
deliveries.” However, BWT is “very sensitive to interruptions and congestion that can easily
lead to enormous delays” (9).
Center for International Intelligent Transportation Research
Texas A&M Transportation Institute Page 7BWTs taken from the U.S. Customs and Border Protection’s Border Wait Time website
http://apps.cbp.gov/bwt/ for the Bridge of the Americas and the Ysleta–Zaragoza toll bridge are
shown in Tables 2 and 3 (12). Note that the wait times for the FAST lanes are significantly less
than the wait times for the standard lanes on 02/28/13 on both bridges even though more
standard lanes were open. Note that the BWT at the free BOTA is five times longer than that of
the Ysleta–Zaragoza toll bridge. However, on 07/09/13 the wait time increased on the Ysleta–
Zaragoza toll bridge. This unexpected outcome may be due to on-going construction in the area
near the BOTA, an increase in manufacturing plants near the Ysleta–Zaragoza bridge, an
increase in the number of FAST and standard lanes open at the Ysleta–Zaragoza bridge, and a
difference in time of day the data were obtained.
Table 2. Border Wait Times for Commercial Vehicles at the Bridge of the Americas.
Standard FAST
Date Time Wait Time Wait Time
Lanes Open Lanes Open
02/28/13 8:00AM 3 25 MIN 2 5 MIN
07/09/13 12:00PM 6 2 MIN 4 2 MIN
Source: CBP website http://apps.cbp.gov/bwt accessed February 28, 2013, and July 9, 2013 (12).
Table 3. Border Wait Times for Commercial Vehicles at the Ysleta–Zaragoza Bridge.
Standard Lanes FAST
Date Time Wait Time Wait Time
Open Lanes Open
02/28/13 8:00AM 2 5 MIN 1 2 MIN
07/09/13 12:00PM 3 15 MIN 1 5 MIN
Source: CBP website http://apps.cbp.gov/bwt accessed February 28, 2013, and July 9, 2013 (12).
Causes of Increased Border Wait Time
Although the BWT appears to have somewhat improved over the past few months,
congestion will increase with growth of trade in the region. Congestion will continue to be one
of the main causes of increased BWTs. Other suspected factors that contribute to increased
border wait times include:
• inadequate staffing,
• increased number of trucks,
• security inspections,
• reduced funding, and
• increased fees.
Center for International Intelligent Transportation Research
Texas A&M Transportation Institute Page 8BWTs also increase due to border crossings not being optimally disbursed among available
capacity (13). This is could be due to the cost of the tolls or the distance to the Ysleta–Zaragoza
toll facility from industrial parks and manufacturers who were strategically located near the
BOTA. Regardless, increases in border wait times affect manufacturers who bear costs of long
and unpredictable border wait times and customs requirements each time merchandise crosses
the border (14).
U.S.–Mexico Trade Issues
The North American Free Trade Agreement took force January 1, 1994; however, there are
still trade issues between the U.S. and Mexico. The U.S. and Mexico agreed to partner on
FAST, but participating companies must be C-TPAT certified to be a member of FAST, and
many companies, especially small ones, do not have the requirements or funding for
membership. Many companies do not have adequate IT systems or the training to use them.
Regardless of these issues, Juan Villa of the Texas A&M Transportation Institute’s Mexico City
Office indicates in a 2005 report that Mexican trade has more than doubled since NAFTA (9).
Inadequate Infrastructures
The future trade relationship between Mexico and the U.S. will require a major infrastructure
to function effectively as projected truck flow for 2020 will be more than 2,200,000 (14). The
infrastructure has not kept pace with expansion of bilateral trade or population growth. A
bilateral effort will be required to improve infrastructure on both sides of the border (13). The
U.S. Congress passed legislation making the forming of Public Private Partnerships permissible
with CBP, to add additional staffing and increase facility size. Section 560 of the Consolidated
and Further Continuation Act of 2013, HR-933 states that because of Federal budget restraints
there is an ever increasing need to reach out to Public (city and state governments), as well as
Private (air and sea carriers, sea and air port authorities, land border and bridge operators) to
form Partnerships to address the need for additional staffing and improvement to facilities.
EFFECTS OF INCREASED BORDER WAIT TIME
Increased BWTs directly affect drivers crossing the border; however, they also indirectly
affect manufacturers, shippers, retailers, and consumers through their impact on just-in-time
inventory, supply chain security, and the economy.
Just-in-Time Inventory
All manufacturers, shippers, retailers, and consumers are affected by increases in BWT.
Some manufacturers and retailers have been forced to abandon their just-in-time inventory
process and now lease or build warehouses to hold products to ensure their availability. This
drives up product prices and also threatens the supply chain security as warehoused goods
become a target for taxing bodies as well as increasing the security risk.
Center for International Intelligent Transportation Research
Texas A&M Transportation Institute Page 9Supply Chain Security
Security is essential in the world today with daily threats of terrorism in the U.S. and abroad.
El Paso and Ciudad Juarez do not escape those threats but also are affected by drug cartels that
produce and smuggle illegal drugs into the U.S. Trucks need to keep moving to ensure the safety
of the driver and the load. The supply chain must also be carefully monitored, and manufacturers
must keep their products and warehouses secure and free from illegal contraband. Therefore, it
is essential that not only drivers but supply chain partners be C-TPAT certified (15).
Economic Impact
Increased BWTs cost the U.S. and Mexico economies billions of dollars each year (14). The
El Paso Port of Entry is the second largest southern land border port by value, and trade has
increased by 100% over the past 12 years (13). The economic impact of increased BWTs
currently results in the loss of $1.5 billion in output, $400 million in wages, $200 million in tax
revenue, and 6700 lost jobs (13) per year. It is estimated that the economic impact due to BWT
will double by 2017 if delays continue to grow and the infrastructure and facility operation
remain the same (13).
The Woodrow Wilson International Center for Scholars reports that longer and unpredictable
border wait times cut away at the competitiveness of regional industries causing many U.S. and
Mexican factories to be offshored to Asia (14). This negative economic impact is also conveyed
in a report commissioned by the U.S. Department of Commerce’s International Trade
Administration. The report suggests that the economic impact of border wait times will more
than double by 2017 as delays grow and if projected infrastructure and operations remain the
same (13).
Trusted Shipper Programs
Trusted shipper programs include the Customs-Trade Partnership Against Terrorism (and the
Free and Secure Trade programs.
Customs-Trade Partnership Against Terrorism (C-TPAT)
C-TPAT was established after the 9/11 attacks to improve security and expedite flow of
goods crossing the border coming into the United States. It is a “voluntary initiative between the
U.S. Customs and Border Protection (CBP) and private business which builds relationships that
strengthen international supply chains and improve U.S. border security” (16).
Membership Benefits. C-TPAT membership benefits include the following:
• fewer border delays,
• front line processing in case of inspections,
• good security practices and procedures,
• better supply chain integrity,
• reduced risk mitigation,
Center for International Intelligent Transportation Research
Texas A&M Transportation Institute Page 10• reduced cargo theft,
• stronger brand equity,
• improved asset utilization,
• higher workforce security,
• better marketability,
• better understanding of the supply chain process and agents,
• training seminars,
• continued processing during terrorist attack,
• increased work and customers, and
• access to FAST lanes.
Many local industry practitioners claim that, “the market requires C-TPAT membership and
that non-compliance usually results in loss of clients” (15). According to Sarai Kuri of CELC,
many of the companies she works with are “proud and take pride in their C-TPAT
memberships.”
Free and Secure Trade (FAST)
The Free and Secure Trade program was also established following 9/11. It is a “commercial
clearance program for known low-risk shipments entering the U.S.” (3). FAST is a joint
initiative that partners United States and importers to move pre-approved eligible goods across
the border quickly by verifying trade compliance away from the border (17). Participation in the
FAST program requires that, “every link in the supply chain, from manufacturer to carrier, to
driver to importer must be certified under the C-TPAT program” (3).
Membership Benefits. FAST membership/enrollment benefits include the following:
• dedicated FAST lanes,
• increased shipment processing speeds,
• reduced inspections,
• front of line processing for inspections,
• enhanced supply chain security, and
• FAST Commercial Driver Card.
Nuevo Esquema de Empresas Certificades (NEEC)
In 2010, Mexican Customs created a pilot security program called NEEC with a membership
cost of $21,800 Mexican Pesos per company. NEEC became official in 2011. In January 2012,
NEEC made changes that required current members to become re-certified to meet increased
security requirements. This was done to make NEEC membership requirements compatible with
C-TPAT membership requirements. The new requirements for NEEC include:
• physical security,
• access controls,
Center for International Intelligent Transportation Research
Texas A&M Transportation Institute Page 11• business partners,
• procedural security,
• Mexican Customs conveyance security,
• personnel security,
• IT security,
• security trainings,
• incident investigation, and
• supply chain security.
Companies eligible for membership include:
• manufacturing companies,
• maquiladoras (twin plant production assembly sites prescribed by NAFTA),
• export businesses, and
• Mexican carriers.
Currently there are 338 manufacturing companies certified in NEEC and 136 companies in
the process of joining. There are currently only three carriers in the process of joining the
program. The Mexican government is currently conducting seminars and conferences to market
the advantages of joining their trusted shipper program. The stated goal of this security program
is to make it compatible to the U.S. trusted shipper programs of C-TPAT and FAST. The desired
outcome of matching the two countries’ trusted shipper programs is to: increase border security,
reduce BWT, and reduce the cost associated with each country maintaining two separate trusted
shipper programs. NEEC would like to be officially recognized by C-TPAT and be able to
certify companies in Mexico for C-TPAT membership. The U.S. CBP is currently evaluating the
NEEC program to determine its validity and effectiveness.
Center for International Intelligent Transportation Research
Texas A&M Transportation Institute Page 12CHAPTER 3:
WHY TRUSTED SHIPPER PROGRAMS ARE NOT BEING USED
The literature review suggests several reasons for companies not becoming members of
trusted shipper programs. In addition, meetings with private companies and government
agencies experienced with border crossing issues revealed and confirmed some of the suspect
reasons as: cost to join and maintain membership, requirements to join, time to process
paperwork and prepare for membership, and not enough staff available to prepare and maintain
requirements for membership.
COST OF TRUSTED SHIPPER PROGRAM MEMBERSHIP
Business expenses associated with manufacturing, warehousing, transportation, and
distribution of cross border cargo are high. Any new or additional cost of doing business cuts
into already low profit margins. Even a small additional cost to doing business can be
detrimental to keeping border crossing companies operating. Some of the initial costs incurred
in joining a trusted shipper program include: hiring new staff, training new and current staff,
improving or building new infrastructure, and improving or purchasing new IT systems (15).
In addition to initial costs, recurring costs to membership include: maintaining physical site
and equipment; updating IT systems; implementing and developing physical and staff security
processes; and increasing work for staff members including the preparation, inspection, and
reporting of current trusted shipper program procedures. There is also a cost to research new
trusted shipper procedures as they arise and/or change frequently. In addition, there are initial
application fees, filing transaction fees, and border crossing fees.
Although any increased cost affects all companies, it appears the cost of the trusted shipper
programs affect large and small companies in different ways. This is represented in the 2011
Customs-Trade Partnership Against Terrorism’s Costs & Savings Survey where the
implementation costs ranged from $280 to more than $4 million U.S. dollars; and the
maintenance costs ranged from $45 to $815,000 (4).
Large Companies
An example of a large cross border company is one which became a C-TPAT member in
2001 at an initial cost of approximately $200,000. The company indicates that it spent
approximately $112,500 annually to maintain its membership. This investment represents an
additional cost to border crossing companies; however, upon membership the company began
saving almost immediately due to decreases in truck inspections. Their inspection rate of 7.6%
in 2001 dropped to 0.66% in 2003, representing a savings of $550,000 per year (15).
Small Companies
Small companies believe they cannot afford the high application fees and maintenance of
security standards for membership to trusted shipper programs. Small companies contend that
Center for International Intelligent Transportation Research
Texas A&M Transportation Institute Page 13they cannot afford the specialized security staff, IT system, new infrastructure to comply with
safety and security processes, and the cost to research new developments in trusted shipper
programs. In a conversation with President of the Foreign Trade Association in El Paso,
Stephanie Caviness agreed and stated that, “the cost associated to join C-TPAT and FAST is too
much for smaller and mid-sized companies.”
In a May 2013 meeting with Bob Gray, Toby Spoon and John Rippe of Secure Origins it was
suggested that many of the El Paso/Ciudad Juarez businesses and maquiladoras have been led to
believe that the cost to join a trusted shipper program is much more than the actual cost. They
suggest that most of the companies already have enough security and staff in place to join
without incurring additional expenses. Mr. Spoon suggested that what the businesses need is to
be educated on the requirements, benefits, and costs of the trusted shipper programs. He
suggested that the trusted shipper program costs need to be presented to the correct person in
each business, and in multiple languages if necessary, so they completely understand that
program membership may not cost as much as they perceive. Companies who are non-members
of trusted shipper programs state that they do not believe the program membership’s benefits are
worth the cost.
OTHER DETERRENTS TO TRUSTED SHIPPER MEMBERSHIP
Another deterrent to trusted shipper membership is the actual membership application
process. The application to join C-TPAT is a long process taking about 1 year from start to
finish. The actual application is 30 pages in length. In addition, warehouses and business
partners of the applicant are asked to complete an 11-page questionnaire regarding security
issues or prove they meet C-TPAT security criteria, usually done through audit procedures.
Even after initial membership there are monthly security meetings and processes to implement,
update, and/or change.
Center for International Intelligent Transportation Research
Texas A&M Transportation Institute Page 14CHAPTER 4:
SURVEY DOCUMENT AND RESULTS
A survey document (see Appendix) was developed and distributed to trucking companies;
logistics service providers; manufacturing companies; customs brokers; importers; and
Maquiladoras, which are also known as “Twin-Plant operators and are provided for in NAFTA.
Maquiladoras are Mexican assembly or manufacturing plants that “operate 330+ plants and
employ more than 178,000 workers in Juarez” (15). It is not surprising that Juarez is birthplace
of the maquiladora industry (18) having “the top ten Maquila industries in Juarez and almost all
of the top 20 suppliers in El Paso” (19).
TTI teamed with Sarai and Oscar Kuri of the Coalición Empresarial Pro Libre Comercio to
develop the survey to determine if the survey participants are members of any of the trusted
shipper programs. CELC is a privately held company in El Paso, Texas, that works with
manufacturers, brokers, drivers, shippers, and maquiladoras to help them with the requirements
to join trusted shipper programs such as C-TPAT and NEEC. It was very helpful having them
team with TTI, as they have many contacts in the trucking industry and they both speak English
and Spanish, and it was vital to get representatives from both U.S. and Mexican companies. The
surveys were prepared in SurveyMonkey®, and survey links were emailed from CELC as they
are a respected and well-known organization in the El Paso/Ciudad Juarez region. CELC
employees acted as facilitators of the survey by promoting participation at local events, by e-
mail, through Internet connectivity, and by telephone. They agreed to how the survey was to be
conducted and to their designated role. CELC representative Sarai Kuri’s experience in teaming
with TTI on the survey follows:
“Our experience conducting the C-TPAT survey with TTI was very enriching.
We sent out the survey to 250 of our clients, including manufacturers, carriers,
importers, and U.S. Brokers all of which use or are planning on using the benefits
of C-TPAT. We believe we had a positive response from our membership.
Several members are interested in the survey results and some of them even
shared the survey with other companies. We sent out e-mails with the survey and
followed up with our clients via telephone and e-mail. We are looking for
answers to the following questions:
• What makes the industry participate in these programs?
• Are companies certified to obtain the benefits of border cross times?
• Are the companies participating in order to increase their security?
Our goal is to increase the participation of the industry in these programs. To
do that we need to know the real reasons they do or do not participate in them and
how they feel about them.
Center for International Intelligent Transportation Research
Texas A&M Transportation Institute Page 15I believe the results to the survey when given were positive. The results
showed the number one reason people get C-TPAT certified is to improve
marketability followed by improved border wait times. I found these surveys
interesting and received real answers that provide insight into membership to
these important programs.”
SURVEY RESPONSE
The survey asked questions concerning: knowledge of membership requirements, costs of
membership, and program benefits. The survey was available in English and Spanish with
versions for trusted shipper program members and non-members. CELC’s assistance in
distributing the survey was vital in reaching the companies from Juarez. It was important for us
to survey both Mexican and U.S. companies. Table 4 shows the combined response rate of all
four versions of the survey document. Eun Sug Park, a statistician with TTI, determined the
number of survey participants needed to maintain a reasonable confidence level and margin of
error for the survey.
Table 4. Survey Response Rate.
C-TPAT Survey Information
Surveys Sent 250
Total Surveys Received 55
English Surveys Received 16
Spanish Surveys Received 39
Confidence Level 90%
Margin of Error 9.81%
As shown in Table 4, the Spanish survey response to the survey was 71% compared to 29%
for the English surveys. This response indicates that the data found will be a clear view of what
Mexican companies know about the trusted shipper programs and their views on BWTs.
Figure 5 shows the percentage of survey participants by company type. Note that
manufacturing and trucking companies were the top two respondents to the survey with 39.5 and
31.0%, respectively. The next highest responding company was customs brokers with a 15%
response rate. These business types represent 85% of those surveyed. The low response rate of
importers, logistic service providers, and others representing a total of 14.5% suggests that the
data from these groups may not be representative of the group as a whole. Therefore, most
conclusions drawn from this survey will represent manufacturing companies, trucking
companies, and customs brokers. Maquiladoras are included in manufacturing companies;
however, one maquiladora listed itself as in the “other” category.
Center for International Intelligent Transportation Research
Texas A&M Transportation Institute Page 16Figure 5. Survey Participants by Company Type.
BORDER CROSSING
The border crossing facilities used in the El Paso/Ciudad Juarez area include the Bridge of
the Americas, the Ysleta–Zaragoza toll bridge, and the crossing at Santa Teresa. Figure 6
displays the facilities’ use by survey participants that commonly cross to and from Mexico into
the United States. The figure addresses the following questions:
• Do you use the border crossing at the Bridge of the Americas (BOTA)?
• Do you use the border crossing at the Ysleta–Zaragoza toll bridge?
• Do you use the border crossing at Santa Teresa?
Santa Teresa Crossing No
Bridge of the Americas Yes
Zaragoza Bridge
0 10 20 30 40 50 60
Figure 6. Border Crossing Use by all Survey Participants.
The responses to Figure 6 were surprising as 93% of the respondents indicated they use the
Ysleta–Zaragoza toll bridge compared to 49% who use the BOTA. Our literature review and
Center for International Intelligent Transportation Research
Texas A&M Transportation Institute Page 17meetings with experts in the region indicated that the BOTA was used more often than the
Ysleta–Zaragoza toll bridge as the BOTA is free and there is a toll charge on the Ysleta–
Zaragoza Bridge. This was the case when our study began in September 2012; however, due to
on-going road construction in Mexico, adjacent to the BOTA, and the increase in manufacturing
near the Ysleta–Zaragoza Bridge crossing, the trend changed and the survey reflects more use for
the toll bridge. These responses indicate that at some point, time becomes more important than
cost in deciding which border crossing route to use.
Table 5 displays the border crossing facility use by company type. The only significant
finding by company type is that 96% of all the manufacturing companies now use the Ysleta–
Zaragoza toll bridge compared to 54% who also use the BOTA. Once again, the toll bridge is
now being used more often even though there is a toll charge.
Table 5. Border Crossing Use by Company Type.
Bridge of the Americas Santa Teresa Ysleta-Zaragosa Bridge
Company Type
Yes No Yes No Yes No
Trucking Company 13 5 8 7 14 4
Logistics Service Provider 1 1 0 2 2 0
Manufacturing Company 13 11 5 19 23 1
Customs Broker 6 2 4 4 7 1
Importer 3 2 0 5 4 1
Total 36 21 17 37 50 7
At the beginning of this research effort in the fall of 2012, the Bridge of the Americas was
the primary border crossing to the United States from Mexico. The data above clearly show
increased use of the Ysleta–Zaragoza Bridge. Border wait times also changed since the
beginning of the study.
BORDER WAIT TIME
Figure 7 displays the survey participants’ perceived BWT at the BOTA and Ysleta–Zaragoza
Bridge. It is interesting that 40% of those responding perceived BWT to be more than 1 hour at
the Ysleta–Zaragoza Bridge compared to the free BOTA where BWT of more than 1 hour was
perceived as 27%. Since the perceived BWT appears to be longer at the Ysleta–Zaragoza
facility, it is interesting that the participants continue to use this facility as there is no perceived
time saving benefit over using the BOTA and drivers also must pay a toll. This leads us to
consider who, when, and why certain border crossings are selected.
Center for International Intelligent Transportation Research
Texas A&M Transportation Institute Page 18Not Applicable
No Wait
More than 1 Hour
1 Hour
1/2 Hour
Zaragoza Bridge
Less than 1/2 Hour Santa Teresa Crossing
Bridge of the Americas (BOTA)
0 5 10 15 20 25 30 35
Number of Survey Participants
Figure 7. Perceived Border Wait Time at the BOTA and Ysleta–Zaragoza Bridge.
BORDER CROSSING ROUTES
Figure 8 displays which entity determines the border crossing route. Again, please note that
39.5% manufacturing and 31% trucking companies represent over 70% of the survey
participants. Over 50% of the time, manufacturing companies select the route drivers are
directed to take when crossing the border making them the most common entity for determining
initial trip routes. Trucking and customs broker companies determine border crossing routes
27% of the time, followed by logistics service providers who determine routes 10% of the time.
0.6
51.0%
0.5
0.4
0.3
0.2 17.0%
10.0% 10.0% 9.0%
0.1
1.5% 1.5%
0
Center for International Intelligent Transportation Research
Texas A&M Transportation Institute Page 19Figure 8. Who Determines Border Crossing Routes.
The chart shown in Figure 9 illustrates when border crossing routes are determined. As
shown, 49% selected that travel route and border crossing is determined immediately prior to
departure. This allows for monitoring of current conditions such as weather and traffic to aid in
selecting the best, safest, and fastest travel route and border crossing facility. It is surprising that
34% of the routes are determined during scheduling without consideration of current conditions.
13.0%
4.0%
34.0%
During scheduling of delivery
Immediately before departure
As determined by driver
Other (please specify)
49.0%
Figure 9. When Travel Routes and Border Crossings Are Determined.
Survey participants were asked who determines route and/or border crossing facility changes
should they need to be made after a trip has already begun. As shown in Figure 10, the
manufacturing and trucking companies most often make those route changes with 41 and 31%,
respectively. This is not surprising as over 70% of the survey respondents were manufacturing
and trucking companies. The top three determining factors for selection of route and border
crossings as indicated in Figure 11 are time, security, and cost.
Center for International Intelligent Transportation Research
Texas A&M Transportation Institute Page 2045.0%
41.0%
40.0%
35.0%
31.0%
30.0%
25.0%
20.0%
15.0%
10.0% 9.0%
8.0%
6.0%
5.0%
5.0%
0.0%
0.0%
Logistics Trucking Manufacturing Customs Broker Importer Driver Other (please
Service Provider Company Company specify)
Figure 10. Entity Responsible for Determining Route and/or Border Crossing Changes
After Trip has Begun.
40.0% 37.0%
35.0%
31.0%
30.0%
25.0%
20.0%
15.0%
15.0%
11.0%
10.0%
6.0%
5.0%
0.0%
Cost Security Time Traffic Other (please specify)
Figure 11. Factors Considered When Selecting Border Crossing Routes.
Center for International Intelligent Transportation Research
Texas A&M Transportation Institute Page 21EXPORT QUESTIONS
Number of Trips
The number of export trips that survey participants take per week is shown in Table 6. Since
most trucks can make 2.5 trips across the border per day, we used this number to determine the
size of the company responding to the survey. The options given on the survey included: 1–5,
6–10, 11–20, 21–40, and over 40. Based on this structure, 1–5, 6–10, and 11–20 are small
companies. Medium companies are 21–40, and those over 40 are considered large companies.
Table 6 displays the number of exports per week and the assigned size of company.
Table 6. Exports per Week and Assigned Company Size.
Exports Per Week Number of Respondents Company Size
1–5 8 Small
6 – 10 11 Small
11 – 20 8 Small
21 – 40 13 Medium
Over 40 12 Large
Warehousing of Goods
Warehousing by companies prior to export is displayed in Figure 12. As can be seen, less
than 20% of the surveyed companies warehouse goods. This indicates that at least these
companies, which are primarily manufacturing and trucking companies, are not yet experiencing
problems with just-in-time inventory.
19.0%
Yes
48.0%
No
Not Applicable
33.0%
Figure 12. Company Use of Warehousing Prior to Exportation of Goods.
Center for International Intelligent Transportation Research
Texas A&M Transportation Institute Page 22TRUSTED SHIPPER MEMBERSHIP QUESTIONS
Qualifications for Membership
To determine the membership qualifications of survey participants the following questions
were included in the survey:
• Are you familiar with supply chain guidelines?
• What certifications does your company have?
• Do you have a Certification of Incorporation?
• Do you have MID, DOT, Broker Serial or Broker Filer Numbers?
The non-C-TPAT member survey participants were asked if they were familiar with the
requirements and the supply chain guidelines required for membership to C-TPAT. As shown in
Table 7, 80% of the non-C-TPAT members responding to the survey indicated they were
familiar with the membership and supply chain guidelines needed to become C-TPAT certified.
Table 7. Requirements and Supply Chain Guidelines Needed for C-TPAT Membership.
Non-Members Response C-TPAT Requirements Supply Chain Guidelines
Yes 12 12
No 3 1
Table 8 presents the certifications held by C-TPAT members and non-members. NEEC is
the Mexican version of C-TPAT. The other certifications include carrier, cart men and
warehouse permits, and licenses. Note that of the 15 non–C-TPAT members, only 2 currently
held any of the certifications needed for membership.
Table 8. Certifications Held by C-TPAT and Non–C-TPAT Members.
C-TPAT
Company Certifications C-TPAT Members
Non-Members
Coalition for Free Commerce (CELC) 37 2
Nuevo Esquema de Empresas Certificades (NEEC) 7 0
Certificate of Incorporation n/a 0
Other (please specify) 17 2
Table 9 displays the different types of identification numbers held by non-members and the
percentage of non-members that have them. The other category represents state and local
permits and licenses. Some of these identifications are needed for various trusted shipper
program memberships.
Center for International Intelligent Transportation Research
Texas A&M Transportation Institute Page 23Table 9. Percent of Non–C-TPAT Members with Identification Numbers.
Types of Identification (ID) Numbers Percent of Non-Members with ID Numbers
MID – Manufacturing 45
DOT – Department of Transportation 18
Broker Serial 24
Broker Filer 27
Other 18
Membership Benefits
To determine membership benefits received by members and membership benefits expected
by non-members, the following questions were included in the survey:
• What benefits would you expect to receive if you are not a member?
• What benefits have you received if you are a member?
• Does membership meet its objectives?
• Does the cost of membership equal or exceed its benefits?
• Are there additional benefits you would like included in membership?
• Would you recommend membership to a non-member?
• If you are not a member why have you not joined?
Figure 13 displays common benefits expected by trusted shipper program members and non-
members.
Other
Improved Marketability
Fewer Inspection Non-Members
Members
Increased Security
Improved Border Cross Time
0 5 10 15 20 25 30 35
Figure 13. Membership Benefits Received by Members and Expected by Non-Members.
Center for International Intelligent Transportation Research
Texas A&M Transportation Institute Page 24As shown in Figure 13, increased security and improved border cross times were cited as the
top two benefits for trusted shipper program members. Non-members selected increased security
and improved marketability as their top two responses. It is possible that marketing toward the
perceived benefits of non-members and advertising the benefits cited by members may help to
increase membership.
The final questions focused on cost of membership versus benefits received. Members of
trusted shipper programs were asked the following questions:
• Does membership meet its objectives?
• Does the cost of membership equal or exceed its benefits?
• Would you recommend membership to a non-member?
Figure 14 indicates that 95% of C-TPAT members from the survey believe that membership
meets its objectives. Figure 15 indicates 87% believe that the benefits meet or exceed its costs.
Finally, 100% of those members responding to the final question responded that they would
recommend membership to a non-member.
95.0% Yes
No
Figure 14. C-TPAT Members Indicating Membership Meets Objectives.
13.0%
87.0% Yes
No
Figure 15. C-TPAT Members Indicating Benefits Meet or Exceed Costs.
Center for International Intelligent Transportation Research
Texas A&M Transportation Institute Page 25CHAPTER 5:
CONCLUSIONS AND RECOMMENDATIONS
When our study began, former El Paso Mayor John Cook’s Border Task Force stated that
there was concern with bridge saturation and increased BWT at both main border crossings
between the United States and Mexico. Mayor Cook commissioned a work group to study
border crossing issues including: Model Commercial Port Project-21 and Frontera 21 Trusted
Shipment Risk Segmentation Lane. There were a number of suggestions that came out of the
Mayor’s border task force that were implemented about the same time TTI was conducting its
study. When we started our study, fewer companies were utilizing the Ysleta–Zaragoza toll
bridge then the BOTA. There was even a proposal suggested by the Customs and Border
Protection to limit the number of hours of service at the BOTA, in order to entice more
commercial traffic to the Ysleta–Zaragoza toll bridge. This proposal was met with a great deal
of “push-back” from the El Paso/Ciudad Juarez trade and transportation community and was not
implemented.
The Mayor’s border task force also looked at ways to increase enrollment in the trusted
shipper programs, C-TPAT and FAST. While our survey was being conducted, the Mayor took
action to relocate commercial traffic from the BOTA to Zaragoza. There was a reduction in
bridge saturation and BWT. There were also changes being made on the Mexican side of the
border to introduce Frontera 21, which segmented C-TPAT and FAST commercial traffic. This
effort also resulted in less BWT and more streamlined border operations.
When our survey was concluded, use of the Ysleta–Zaragoza toll bridge had surpassed that
of the free BOTA. There were also a number of road construction projects at the same time in
Juarez that caused additional commercial truck traffic to shift away from the BOTA to Zaragoza.
There was a new bypass loop constructed in Juarez, which reduced transit time on the Mexican
side to the Ysleta–Zaragoza toll bridge. In addition, manufacturers began to open new plants and
warehouses near the Ysleta–Zaragoza toll bridge
These changes, instituted on both sides of the border, created a temporary fix for the current
congestion and long BWTs at the BOTA. However, our findings indicate that the projected
growth of business will, in a short time, overtake these short-term changes. It will not be long
until the BOTA and the Ysleta–Zaragoza Bridge become saturated again. The most current U.S.
Government General Accountability Office (GAO) report, dated July 2013 and entitled CBP
Action Needed to Improve Wait Time Data and Measure Outcomes of Trade Facilitation Efforts,
substantiates our findings about the need to prepare for future border growth (20).
The negative economic impact due to BWT is estimated to more than double by 2017 as
delays grow and projected infrastructure and operation remain the same (13). All the crossings
at the El Paso/Ciudad Juarez border will become saturated if nothing is done. The Federal
government has stated that due to budgetary cutbacks it will not provide additional funds for
infrastructure improvements. Many companies have relocated their manufacturing plants from
Asia to the border, for more efficient and cost-effective manufacturing and shorter supply lines
to the U.S. markets. El Paso and Ciudad Juarez cannot afford to lose the new business from
Asia, nor stifle economic growth in the region due to increased border delays.
Center for International Intelligent Transportation Research
Texas A&M Transportation Institute Page 26You can also read