Effects and Implications of File Size/Service Time Correlation on Web Server Scheduling Policies
←
→
Page content transcription
If your browser does not render page correctly, please read the page content below
Computer Science Department

                                  Technical Report
                                   NWU-CS-04-33
                                   April 19, 2004

 Effects and Implications of File Size/Service Time
  Correlation on Web Server Scheduling Policies

                   Dong Lu         Huanyuan Sheng          Peter A. Dinda

                                          Abstract
Recently, size-based policies such as SRPT and FSP have been proposed for scheduling
requests in web servers. SRPT and FSP are superior to policies that ignore request size,
such as PS, in both efficiency and fairness given heavy-tailed service times. However, a
central assumption that is usually made in implementing size-based policies in a web
server is that the service time of a request is strongly correlated with the size of the file it
serves. This paper shows how the performance of SRPT and FSP are affected by the
degree of this correlation. We developed a simulator that supports both M/G/1/m and
G/G/n/m queuing models. The simulator can be driven with trace data, which can be
taken from the logs of modified Apache servers, or which can be produced by a workload
generator we have developed that allows us to control the correlation. Using both trace
data and generated data, we find that the degree of correlation has a dramatic effect on
the performance of SRPT and FSP. In response, we propose and evaluate domain-based
scheduling, a simple technique that better estimates connection times by making use of
the source IP address of the request. Domain-based scheduling improves SRPT and FSP
performance on web servers, particularly in regimes where correlation is low, thus
making size-based policies such as these more broadly deployable.

Effort sponsored by the National Science Foundation under Grants ANI-0093221, ACI-
0112891, ANI-0301108, EIA-0130869, and EIA-0224449. Any opinions, findings and
conclusions or recommendations expressed in this material are those of the author and
do not necessarily reflect the views of the National Science Foundation (NSF).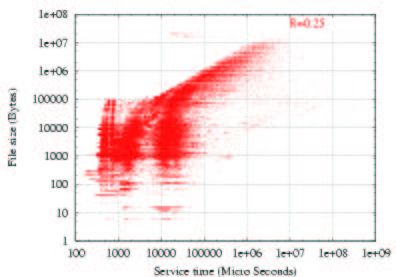
Keywords: Web server scheduling; Queuing models; Simulations; Correlation; SRPT, FSP
Effects and Implications of File Size/Service Time
              Correlation on Web Server Scheduling Policies
                                                          November 6, 2003
                       Dong Lu                               Huanyuan Sheng                             Peter A. Dinda
             Dept. of Computer Science                         Dept. of IEMS                     Dept. of Computer Science
              Northwestern University                      Northwestern University                Northwestern University
                Evanston, IL 60201                           Evanston, IL 60208                     Evanston, IL 60201
             donglu @cs.northwestern.edu
                                              h-            pdinda @cs.northwestern.edu

                                     sheng @northwestern.edu

ABSTRACT                                                                    system until it is complete, the total time from arrival to com-
Recently, size-based policies such as SRPT and FSP have been pro-           pletion being the sojourn time or response time. Scheduling
posed for scheduling requests in web servers. SRPT and FSP are supe-        policies determine which requests in the queue are serviced at
rior to policies that ignore request size, such as PS, in both efficiency   any point in time, how much time is spent on each, and what
and fairness given heavy-tailed service times. However, a central as-
sumption that is usually made in implementing size-based policies in        happens when a new request arrives. Common goals of the
a web server is that the service time of a request is strongly corre-       scheduling policy are to minimize the mean sojourn time (re-
lated with the size of the file it serves. This paper shows how the         sponse time of the request), the average slowdown (the ratio
performance of SRPT and FSP are affected by the degree of this cor-         of its response time to its size), and to behave fairly to all re-
relation. We developed a simulator that supports both M/G/1/ and

                                                                            quests.
G/G/ / queuing models. The simulator can be driven with trace


data, which can be taken from the logs of modified Apache servers, or
which can be produced by a workload generator we have developed             Many policies are possible. First Come First Served (FCFS) is
that allows us to control the correlation. Using both trace data and        a non-preemptive policy in which the requests are run to com-
generated data, we find that the degree of correlation has a dramatic       pletion in the order in which they were received. A more com-
effect on the performance of SRPT and FSP. In response, we propose          mon policy is Processor Sharing (PS), which is preemptive. In
and evaluate domain-based scheduling, a simple technique that better        PS all requests in the queue are given an equal share of the
estimates connection times by making use of the source IP address of        web server’s attention. Generalized Processor Sharing (GPS)
the request. Domain-based scheduling improves SRPT and FSP per-
formance on web servers, particularly in regimes where correlation is       generalizes PS with priorities. Often, FCFS can be combined
low, thus making size-based policies such as these more broadly de-         with PS or GPS, with FCFS dispatching of requests from the
ployable.                                                                   queue to a pool of processes or threads that are collectively
                                                                            scheduled using PS or GPS. These polices ignore the service
                                                                            time of the request.

1. INTRODUCTION                                                             Recently, size-based scheduling policies, those that incorpo-
In a web server, requests continuously arrive to be serviced.               rate the service time of the request into their decisions, have
A request requires a certain service time to be completed, time             been proposed for use in web servers. Harchol-Balter, et al,
whose components include the CPU, the disk, and the network                 have proposed the use of the Shortest Remaining Processing
path. A request is queued when it arrives and remains in the                Time (SRPT) scheduling policy in web servers [21, 22], showed
                                                                            how to incorporate it into actual implementations [20, 22], and
Effort sponsored by the National Science Foundation un-                     studied how SRPT can help a web server to gain performance
der Grants ANI-0093221, ACI-0112891, ANI-0301108, EIA-
0130869, and EIA-0224449. Any opinions, findings and con-                   under both persistent and transient overload [38]. The Fair So-
clusions or recommendations expressed in this material are                  journ Protocol (FSP) is a modified version of SRPT that has
those of the author and do not necessarily reflect the views                been proven to be more efficient and fair than PS given any
of the National Science Foundation (NSF).                                   arrival sequence and service time distribution [18].

                                                                            SRPT has been studied since the 1960s. Shrage first derived
                                                                            the expression for the response time in an M/G/1 queue [36].
                                                                            For a general queuing system (G/G/1) Schrage proved in 1968
                                                                            that SRPT is optimal in the sense that it yields—compared to
                                                                            any other conceivable strategy—the smallest mean value of
                                                                            occupancy and therefore also of waiting and delay time [35].
                                                                            Schassberger obtained the steady state appearance of the M/G/1
                                                                            queue with SRPT policy in 1990. Perera studied the variance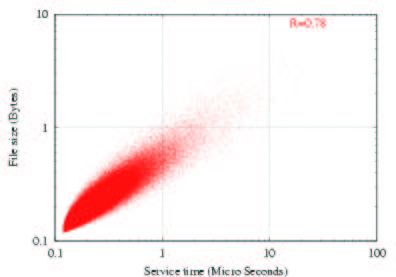
of delay time in queuing systems and con- butions and ( ) parallel servers under pre-emptive re-
cluded that the variance is lower than FIFO and LIFO [33]. sume (PR) scheduling [29]. Boxma, et al considered a GI/G/1
Bux introduced the SRPT principle into packet networks [12] queue in which the service time distribution and/or the inter-
!"
#
in 1983, using the message size as the service time. arrival time distribution has a heavy tail, i.e., a tail behavior
like with , such that the mean is finite but the
An objection to SRPT is that it is possible to design an ad- variance is infinite. Depending on whether the service time
versarial workload in which SRPT leads to the starvation of distribution is heavier than that of the interarrival time distri-
large jobs [40]. In other words, SRPT can behave unfairly. bution, they concluded that the stationary waiting time can be
However, under the workload models that are believed to be modeled as either a Kovalenko distribution or a negative ex-
correct for web servers (A Poisson process modeling requests ponential distribution [11]. Xia, et al analyzed the asymptotic
and a bounded Pareto distribution modeling the heavy-tailed tail distribution of stationary virtual waiting times in a single-
file size distribution, M/G/1) SRPT performs very well [8]. server queue with long-range dependent arrival process and
subexponential service times [44]. However, we are aware of
In the implementation of size-based polices such as SRPT and no analytical results on G/G/ / for SRPT or FSP schedul-
FSP on a web server, the service time of the request is needed. ing in regimes where interarrival times and service times are
The common assumption is that the service time is the size heavy-tailed. The work we describe in this paper is based on
of the file being served, as this is very easy to discover when measurement and simulation.
the request enters the system. More broadly, the assumption
is that the service time is strongly correlated to the file size. Using our infrastructure, and measured and synthesized trace
In this paper, we examine the validity of this assumption, and data, we address the following questions:
the impact that the degree of correlation between file size and
service time has on the performance of SRPT and FSP.
1. What is the actual degree of correlation between file size
and service time in practice? (Section 2)
To evaluate this impact, we developed a simulator that can sup-
port PS, SRPT, and FSP in both M/G/1/ and G/G/ / . The
simulator operates on a trace of request arrivals, which can 2. How does the performance of SRPT, FSP, and PS vary
come either from an augmented Apache [1] web server log, or with the degree of correlation between file size and ser-
from a trace generator. The trace contains the request arrivals, vice time under G/G/ / and M/G/1/ ? (Section 3)
the file sizes, and the actual service times in microseconds.
3. Is there a simple and low-overhead estimator for service
We use traces that we have captured on our department-level
time that would make SRPT and FSP on M/G/1/ and
web server, and traces captured by others on web caches. Our
G/G/ / perform better? (Section 4)
trace generator allows us to control the correlation coefficient
between file size and service time in a trace.
We study G/G/ / in addition to M/G/1/ because previous
It is important to point out that our results in addressing ques-
tions 2 and 3 are largely independent of our results for question
research [32, 16] has shown that Poisson processes are valid 1, and the algorithm we develop in response to question 4 pro-
only for modeling the arrival of user-initiated TCP sessions vides benefits to SRPT and FSP over a wide range of possible
such as the arrival of TELNET connections and FTP connec- answers to question 1.
tions. HTTP arrivals are not Poisson. That is because HTTP
document transmissions are not entirely initiated by the user: Our measurements show that the assumption that file size and
the HTTP client will automatically generate a series of addi- service time are strongly correlated is unwarranted—the corre-
tional requests to download embedded files, thus resulting in a lation is, in fact, often rather weak. We speculate that the rea-
more bursty process. Previous work [16] pointed out that the son for this phenomenon is that the bottleneck for file transfer
aggregated interarrival times of HTTP requests can be mod- is in the network and different clients have different available
eled with a heavy-tailed Weibull distribution. bandwidth to the web server.
Crovella, et al found that WWW traffic showed self-similarity Our simulation experiments with generated traces show that
and proposed possible explanations for the phenomenon [15]. the performance of file size-based SRPT and FSP are strongly
This work also pointed out that many characteristics of web related to the degree of correlation ( ) between file size and
can be modeled using heavy-tailed distributions, including the service time. For low values of , these scheduling policies
distribution of transfer times, the distribution of user requests perform worse than PS. For our web server traces, is indeed
for documents, the underlying distribution of documents sizes low enough that both file-size based SRPT and FSP perform
available in the web, and the interarrival time of requests. Bar- worse than PS. However, we find that SRPT can perform bet-
ford, et al built the discovered web server workload charac-
%$'& (*)+-,/.(*)+-01
ter than PS once crosses a rather low threshold of about
teristics into SURGE [10], a representative synthetic analytic . In other words, SRPT needs some degree
workload generator. of correlation, but not much. As increases, its performance
There has been significant work on the G/G/ queuing model.
continues to improve.
Tabet-Aouel, et al gave analytic approximations for the mean These results led us to believe that a better estimator for ser-
sojourn time of ( ) priority classes in a stable G/G/c/PR vice time was needed. We refer to our estimator as a domain
queue with general class interarrival and service time distri- estimator, and the use of our domain-based estimator with a
Queuing Model
m
Description
Poisson arrival process;
quest given no other requests in the whole end-to-end system
(no load on any resource). In the following sections, we use
General service time distribution;
n m
this definition and argue that our measurement methodology
Single server ; Limited queue capacity .
measures it by verifying that the loads on the resources of the
General arrival process (Pareto and Weibull);
General service time distribution; end-to-end system that we measure are miniscule.
servers ; Limited queue capacity .
To measure correlation between file size and service time we
Figure 2: Queuing models used in the paper. Both Pareto use the correlation coefficient (Pierson’s ) [6]. The correla-
and Weibull service time distributions are considered. tion between two random variables (file size) and (ser-
vice time) is
size-based scheduling policy such as SRPT or FSP as domain-
based scheduling. The basic idea is to use the high order
. $
&
&1
. 1 & 1 (1)
& . 1
& 1
bits of the source IP address to assign the request to one of
domains. For each domain, we estimate the service rate where
& 1
is the covariance of and , is
&"!
. # $ 1
(file size divided by service time) based on all previous com- the variance of and is the variance of . is
& 1 $ (/) % '& $ %
pleted transfers to the domain. The service rate is then used to in the range . Its absolute value denotes the strength
estimate the service time of a new request based on its file’s of correlation. indicates that % of
)( (
size. Based on our traces, there is a strong relationship be- the variance of can be explained by . Our results in this
tween the correlation of these estimates and the actual service paper show only positive correlation . We estimate
time, which grows with the number of bits used. In short, by using sample variance and covariance. A confidence interval
choosing appropriately, we can create enough correlation to can be computed for based on the sample. For our results,
make SRPT and FSP perform well. Surprisingly, can be kept the sample size is quite large, leading to intervals that are tiny
relatively small, making the implementation of domain-based compared to the differences we point out for quite small - *
scheduling feasible and fast. Throughout the paper, we refer values. Hence, we do not plot them.
to the scheduling policies as listed in Figure 1, and refer to the
queuing models used as listed in Figure 2. To answer the question posed by this section, we examine
values for a large trace acquired by us from a typical web
2. IS FILE SIZE A GOOD INDICATOR server, as well as 70 traces collected from web cache servers.
$ (/) ,+
The main conclusion is that can vary considerably from
OF SERVICE TIME? server to server, and can be quite small. for our
Size-based SRPT scheduling appeared in digital communica-
& (*)+.(*) -*1
web server trace, while the web caches have evenly dis-
tion networks research in 1983 [12]. In this context, the service tributed in the range . In subsequent sections, we
time was taken to be equal to the transmission time of a mes- use our web server trace to drive our simulation. However, we
sage, which is proportional to the length of the message stored also use synthetically generated traces in which we can control
in the node buffers. A web server serving static requests ap- directly. While many web server traces are available, none
pears superficially similar in that it transmits files to the client. that we could find record the actual service time of the request
However, there are differences. First, in the digital commu- and thus are not useful for the purposes of our study.
nication network context, the work represented by the service
time is pushing the bits of the message onto the wire, while
for the web server context, the work involves end-to-end coop- 2.1 Measurement on a typical web server
eration along an entire shared heterogeneous path. Although We modified the code of the Apache log module so that it
most transfers are likely to be dominated by the bottleneck records the response time of each request with microsecond
bandwidth in the path and the latency of the path, there are granularity (using the IA32 cycle counter to measure time).
multiple possible bottlenecks along the path and they can vary Under extremely low load conditions, as we document below,
with time due to packet losses and congestion. Second, the this time is equivalent to the service time according to our def-
disk(s), memory system(s), and CPU(s) of the web server and inition above.
the client are also potential bottlenecks. These complexities
suggest that the service time of a request may not be propor- We deployed the module on our department-level web site. We
tional or even well correlated with the size of the file it serves. collected data from September 15, 2003 to October 19, 2003.
This trace includes approximately 1.5 million HTTP requests,
There are several possible definitions for service time in the among which less than 2% are dynamic PHP requests that col-
(/.0
web server context. For example, we could focus on a bot- lectively took less than 1% of the total service time recorded.
tleneck resource on the server, such as the CPU, and define % of our requests and (/. .
% of the service time in the
the service time as the total CPU time needed to execute the trace are for static pages. Hence, our web sever is dominated
request. Alternatively, we could treat the CPU, disk, and net- by static web content. Others claim that static content domi-
work link of the server as a single resource and consider the nates web traffic [25, 24, 22] and thus our results are compa-
total non-blocked time of a request on it. We could also take a rable to theirs. The requests originated from 110 “/8” IP net-
holistic view and consider it the time spent on the bottleneck works, 7220 “/16” IP networks and 31250 “/24” IP networks
resource on the path from server to client. We take the position spread over the world. We claim that this server is typical.
that the service time of a request is the time that the combina- However, the conclusions of this paper are also supported by
tion of server, client, and network would take to finish the re- other measured traces and generated traces.Scheduling Policy Description
PS Processor Sharing scheduling policy.
FSP Ideal Fair Sojourn Protocol, service times are known exactly.
SRPT Ideal Shortest Remaining Processing Time, service times are known exactly.
FSP-FS File size-based Fair Sojourn Protocol, file sizes are used as service times.
SRPT-FS File size-based Shortest Remaining Processing Time, file sizes are used as service times.
FSP-D Domain-based Fair Sojourn Protocol, estimated service times are used as service times.
SRPT-D Domain-based Shortest Remaining Processing Time, estimated service times are used as service times.
Figure 1: Scheduling policies used in the paper.
1 Char read Block read WebRead Char write Block write
y = 0.2349e
-4.1253x 23604.2 1399254.2 29879.3 16777.9 50355.8
0.1 2
R = 0.9559
Log10(P[Load>x])
Figure 5: Hard disk to memory bandwidth, KB/sec.
0.01
0.001
the disk system of the server. The machine’s file systems re-
0.0001
side on a NFS-mounted (over private gigabit Ethernet SAN)
RAID 5 storage server. Figure 4 shows the complementary
0.00001
0 0.2 0.4 0.6 0.8 1 1.2 1.4 1.6 1.8 2
distribution of the storage system reads during the period of
CPU Load
the trace. The vertical axis is log scale to show details. The
distribution can be modeled with a exponential distribution
Figure 3: Complementary distribution of CPU load on the
with & close to 0.99.
web server. We benchmarked the storage system using Bonnie, which is a
widely used utility that measures the performance of Unix file
1
system operations that an application sees [2]. Bonnie reads
y = 0.0723e-0.0001x
0.1 R2 = 0.9855 and writes a 100 MB file (marked uncacheable) by character or
Log10(P[disk read IO>x])
by block. Both sequential and random access are tested. Ran-
0.01
dom block and character throughput give us upper and lower
0.001 bounds on the performance of file system I/O that Apache sees.
We also wrote our own benchmark (WebRead) to get a sense
0.0001
of the typical read performance that Apache sees. WebRead
0.00001 simply reads the files in our access log, in order, as fast as
0.000001
possible. Not surprisingly, the WebRead performance is in be-
tween the character read and block read benchmark given by
0.0000001 Bonnie. WebRead’s performance is shown Figure 4 as a ver-
0 20000 40000 60000 80000 100000
tical line, while all the results are shown Figure 5. We can
(*) ( (*
Hard disk read IO in KB/sec see that probability of read throughput being larger than the
throughput measured in the WebRead benchmark is ,
Figure 4: Complementary distribution of hard disk read while no recorded read throughput was larger than Bonnie’s
I/O on the web server. block read benchmark. Notice also that the highest through-
puts seen are lower than the 125 MB/s throughput limit of the
Ethernet SAN, hence the SAN is also not a bottleneck.
The bottleneck resource of a request in this trace is hardly
ever the CPU of the server. The web server is a dual pro- As it is clear that the CPU, memory, and disk systems are not
cessor Pentium IV Xeon machine running Red Hat Linux 7.3. bottlenecks, if there is any bottleneck it is in the network or
CPU load is defined as the exponentially averaged number of the client. Based on many earlier measurements of load be-
jobs in the run queue of the OS kernel scheduler (the Unix havior on clients that indicate their resources spend much of
load average), The machine can serve two CPU intensive ap- their time idle [27, 17], it is extremely unlikely for a client to
plications with full CPU cycles. Figure 3 plots the comple- be the bottleneck. If there is any bottleneck, it is in the net-
mentary distribution of the CPU load during the period of the work path to the client, which agrees with earlier work [22].
traces with the vertical axis in log scale to better show details. Given the low rate of requests, it is highly likely that a single
& (/) .-
This distribution can be modeled with a exponential distribu- request would perform similarly to the requests in our trace.
& (!1
tion with . Figure 3 shows that the probability Hence, the high-resolution response time that we record in the
is minuscule. The memory system is also Apache log is a close approximation of the service time as de-
clearly not a bottleneck based on these results as significant fined above. Obviously, there are situations where CPU or disk
cache stalls would show up as increased load. can become bottlenecks, such as in virtual server configuration
in which one physical server hosts several web sites, or on a
The bottleneck resource of a request in this trace is hardly ever web server that hosts database-based dynamic web content.ple, if we focus on a particular “/24” LAN subnet (24 bit net-
$ (*) , .
work address) that is contained within the previous network,
. We speculate that the reason for this behavior is
that network bandwidth heterogeneity from the server to the
clients of a domain decreases as the size of the domain de-
creases. This provides a different, but compatible, explanation
for earlier findings [8] that file size-based SRPT scheduling
can decrease mean sojourn time by a factor of 3-8 over PS in a
LAN for load higher than 0.5, but can only decrease the mean
(*) +
sojourn time by 25% on the WAN. In Section 3, our simu-
lations show that when , as on the example LAN,
(*)
file size-based SRPT outperforms PS by a factor of about 3,
$ (*)+ +
but when the (recall that our web trace showed
) file size-based SRPT performs similar to PS and
can perform worse than PS if goes down further, when file
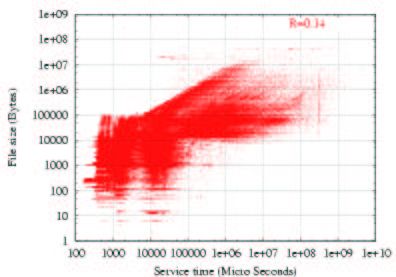
Figure 6: File size versus service time in web trace. sizes are hardly any indicator of service times at all.
File Size We are actively acquiring additional traces, but this is diffi-
KB 0.0616 cult because web server modifications are necessary to acquire
KB 0.1121 fine grain service times. Many available traces, such as those
KB 0.1033
from the Internet Traffic Archive [3], our institution’s other
web servers, and others provide only file size, not service time
Figure 7: depends on file size.
and thus are unsuitable for our work. We have, however, ac-
quired many traces from web caches, described next, and built
a trace generator that allows us to control as well as the dis-
Given the provenance of the trace, we can now use it to an-
tributions of service time and interarrival time, described later.
swer our question. Figure 6 is a log-log scatter plot of file size
versus service time. Visually, we can see hardly any correla-
tion between file size and service time. File transfer times vary 2.2 Measurement on web caches
over several orders of magnitude with same file size. Over the We examined 70 sanitized access logs from Squid web caches,
entire 1.5 million requests in the trace, we find that is a very made available through the ircache site [4]. These traces con-
weak 0.14. varies slightly with file size, as can be seen in tain fine grain service times in addition to file sizes. Inter-
Figure 7. net object caching stores frequently requested Internet objects
(i.e., pages, images, and other data) on caches closer to the re-
Within a domain, is larger. We define precisely what we quester than to the source. Clients can then use a local cache
mean by a domain and connect it with CIDR in Section 4. as an HTTP proxy, reducing access time as well as bandwidth
Here, simply consider it as a single network that may be recur- consumption.
sively decomposed into subnetworks. For example, Figure 8
is a log-log scatter plot of file size versus service time for re- Squid is a high-performance proxy caching server for web
clients. Unlike traditional caching software, Squid handles
$ (*) %
quests originating with a single “/16” IP network, where the
network address is 16 bits. for this situation. As the all requests in a single, non-blocking, I/O-driven process [5],
domain grows smaller (has fewer IP addresses, or more bits making it very easy to determine the service time of a request.
representing its network address), grows larger. For exam- Squid is similar to a web server in that it also accepts HTTP re-
quests and sends back requested files, but it is different in that
the Squid servers form a overlay network that uses the Inter-
net Cache Protocol (ICP) to perform server selection for web
clients and load balancing among the cache servers [42, 41].
A client sees that it typically receives a reply from the near-
est cache server, while from the Squid cache servers’ points
of view, the Internet is divided into several regions with each
cache server typically serving requests for a specific region.
Because a single Squid cache serves clients largely from one
region of the Internet, the bandwidth heterogeneity to the clients
is likely to be less than that seen by a web server, which ser-
vices clients regardless of region. This, we believe, should
lead to larger being measured on Squid caches than on web
servers. The partitioning of the network as seen from the web
server into domains that we describe in Section 4 builds on this
observation.
Figure 8: File size versus service time for particular /16
network. While we cannot (and do not) use web cache traces as prox-1
sizes from bounded Pareto and Weibull distributions, and ser-
0.9 vice times from bounded Pareto. In the synthetic traces, we
0.8 directly control the correlation, , between file size and ser-
0.7 vice time, as described later. Each simulation throughout the
0.6 rest of the paper is repeated 20 times.
P[R>x]
0.5
0.4
We validated our simulator by (a) checking stability and as-
suring that Little’s law is never violated on each run, using
0.3
effective arrival rate is appropriate for limited queue capacity,
0.2
(b) repeating the simulations described in Friedman and Hen-
0.1
derson’s FSP paper [18] with nearly identical results, and (c)
0 comparing our simulation results with the analytic results of
0 0.1 0.2 0.3 0.4 0.5 0.6 0.7 Bansal and Harchol-Balter’s SRPT fairness paper [8].
Correlation Coefficient betw een file size and service tim e
3.2 Controlling in synthetic traces
Figure 9: Complementary distribution of in web cache Given some parametric distribution (exponential, bounded Pareto
traces. or Weibull here) and a target correlation coefficient , we
generate pairs of random numbers where each number of the
ies for web server traces, it is instructive that on the caches pair is chosen from its required distribution and where the two
is also rather weak. Figure 9 shows a complementary distri- numbers of the pair are correlated to degree . To do this,
bution plot of the values in the 70 traces. The traces were we use a simplified Normal-To-Anything (NORTA) method.
collected from 10 squid web cache servers over 7 days Each The basic ideas and proofs behind NORTA were developed $
$
and
by Cario Nelson
[13]. Given the distributions
$ (*)+ $ (*) -/
trace contains from 0.1 to 1.1 million requests. The smallest
, while the largest . The mean is 0.34 with
standard deviation 0.13. Given that we expect that for web
and
, our target correlation coefficient and our
sample size , the following algorithm generates pairs:
servers will be lower than for web caches by the reasoning
1 Set
in the previous paragraph, that measured s on web caches
!#"
%$ .
are low suggests that on web servers is likely to be low as 2 Generate two independent random numbers
well.
4 let /
&
3 let & '
& (*) ,+ " %$
10 ' 2 436587 & %$ ,&
"
& &
.-
$
)
%$
/ 90'2 :36587 " &
where 90'2 :36587 " &
& &
In combination with the low seen on our web server trace,
is
at & for
we believe that we can now answer the question posed by this
; CDF distribution
?>A@
CB
;
<
the value of a standard normal
=< . It can be shown TJR " / $
JN OQP RS
OUthat
section in the negative: The correlation between request file
;FEGIHJ;FKG
size and service time on web servers is weak. 5 let D L7 M / ,
H%G I2 V F; WJG%XF; G
R 7 M
S==R Z [JOQ\=R
]UO^.Y
SR
Z [JOU\
R=]QOQ^_R " $
/ where 7 M
&
Q N OQP RS=OQTJR
,
7 M
3. HOW DOES PERFORMANCE DEPEND
distributions for
are the CDFs of our desired
ON CORRELATION? filesize and service time respectively. 7 M is the inverse of
7 M .
We have seen that request service time on web servers and
` ;FEGIHJsteps
6 Repeat
I2 V ;FWJG XF; Gab$=c . ` D ;FEGIHJ;FKG a
Ud
Je e e
;FKG a 2-5
HG times generating pairs c
caches is not strongly correlated with request file size. Here,
we investigate, via simulation, how the degree of this corre-
"D
and
` H G 2IV ;FWJG XF; G a
Ud
%
J
e
e e
c
are two correlated
lation ( ) affects the performance of size-based scheduling random numbers each following their own distributions.
` ;FEGIHJ;FKGCafc
policies (SRPT and FSP, where actual service time is known 7 Compute the correlation coefficient
` H%G 2IV ;FWJG%XF; G afc _g of D _g ,
a priori, and SRPT-FS and FSP-FS, where the file size is used
as the service time) and compare with a size-oblivious policy
and call it _.g If
decrease and go to step
_g*2.h If , then increase
, then
(PS). Our metrics are the mean sojourn time and mean queue and go to step 2. If then stop.
length. We find that for these metrics, the performance of
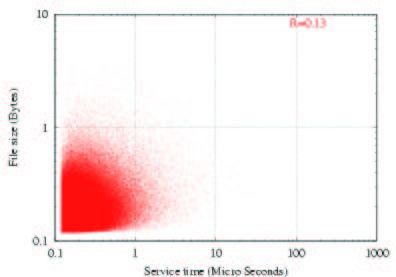
SRPT-FS and FSP-FS is dramatically affected by , falling Figure 10 gives some examples of file size/service time pairs
below that of PS for low values. Furthermore, for a fixed generated for different values of .
low , as we measured on our web server, increasing load
causes increasing divergence of performance of the file-size
$ . & $ (* .-
To show the correctness of this algorithm, we can try follow-
based policies (SRPT-FS, FSP-FS) from their ideal versions
(SRPT, FSP).
$ . & & (*.-1
k k $
ing analysis: First, it is easyI=nto see that
i Ci %
j o UQ , thus l
m m j m
and
m and m
j j
. Second, it can be shown that i is correlated
3.1 Simulator and traces
Our simulator supports both M/G/1/ and G/G/ / queuing l
$&
withm i I
n and $ k k
m a thus som is m withm a . Intuitively it follows that
and
&
U _g are correlated as well. Cario
systems. It is driven by a trace in which each request con- and Nelson showed that (1) p qg is a nondecreasing contin-
tains the arrival time, file size, and service time. In addition to uous function of p , and (2) p and p share the same sign.
the web server trace described in the previous section, we also These properties guarantee the termination of the above sim-
use synthetic traces generated with interarrival times from ex- plified NORTA algorithm and let us bound the values of
ponential, bounded Pareto, and Weibull distributions, and file that can be achieved by NORTA. If we sample p from 0 to 1,3.5
PS
3 FSP
SRPT
Mean sojourn time
2.5
FSP-FS
2 SRPT-FS
1.5
1
(a) R=0.13 (b) R=0.78 0.5
0
Figure 10: Examples of generated file size/service time
0 0.2 0.4 0.6 0.8 1
pairs.
Correlation coefficient R
Lower bound Upper bound
Interarrival 1.32 0.07177
)
Figure 12: Mean sojourn time versus , synthetic traces,
Service time 2.0 0.1188
M/G/1/ , Pareto service times, Poisson arrivals.
Figure 11: Bounded Pareto Distribution Parameters.
14
PS
_g 12 FSP
we can estimate the range of p , producing a set of sets of 10 SRPT
Mean sojourn time
pairs, ordered with increasing as a side effect. This is ex- 8
SRPT-FS
FSP-FS
actly how we generated correlated random pairs of file size and
6
& (*.-1
qg Depending on the structures of different distribu-
service time.
tions, p may not always take a full range of , which 4
is why some of the results we show here have a restricted range 2
of . 0
0 0.2 0.4 0.6 0.8 1
3.3 Simulation with synthetic traces Correlation coefficient R
To study the effects of the correlation between file size and
service time on the performance of SRPT-FS and FSP-FS, we
Figure 13: Mean Sojourn Time versus , synthetic traces,
generated traces with controlled correlation as described in G/G/1/ , Pareto service times, Pareto arrivals.
the previous section. We used bounded Pareto distributions
for both file size and service time. For the arrival process,
we consider Poisson arrivals (exponential interarrival times),
((*)
verges with that of PS, and slowly overtakes it. For Pareto ar-
heavy tailed Pareto arrivals, and heavy tailed Weibull arrivals. rivals, its performance exceeds that of PS only when .
For all the simulations of this section, the load (mean arrival
rate divided by mean service rate) is 0.9, and queue capacity is The performance of SRPT-FS increases much more quickly
5000. A single server is assumed. Multiple servers are consid- with increasing . When is very small, SRPT-FS and FSP-
ered in the next section. Figure 11 shows the parameters of the FS essentially behave like a random scheduling policy, with
bounded Pareto distributions used for the simulations shown
difficulty to predict performance. When exceeds a low thresh-
in Figure 12 and Figure 13. We used identical Bounded Pareto
& (/)+-,*.(/) 0 1
old, SRPT-FS performance exceeds that of PS in both M/G/1/
distribution for both file size and service time distributions. and G/G/1/ . The threshold is in the range . Be-
yond this point, SRPT-FS’s performance increases geomet-
The scheduling policies used (SRPT, SRPT-FS, FSP, FSP-FS,
$ (*)+,+
rically with increasing . Recall that our web trace shows
and PS) are described in Figure 1. Each graph data point we , which suggests that SRPT-FS performance will be
show data point represents several simulations, each of 0.5 similar to PS performance for the trace. The figures clearly
million requests. show that SRPT performance is strongly tied to , even at
high values of . Improvements in estimating actual service
Figure 12 shows the effects of on the mean sojourn time time can dramatically improve SRPT for a wide range of .
of different scheduling polices with a Poisson arrival process,
corresponding to M/G/1/ queuing model, the interarrival mean The lack of accurate service time information has been an
used to generate Poisson process is 0.278. Figure 13 shows the important reason why SRPT is not widely deployed [37, 8].
effects of on the mean sojourn times of different scheduling However, SRPT appears to be better suited than FSP to work-
polices with a heavy tailed Pareto arrival process, correspond- ing under conditions where it is difficult to estimate service
ing to G/G/1/ queuing model. The mean sojourn time of the time, and its performance scales nicely as more accurate ser-
policies with a heavy tailed Weibull arrival process is similar vice time estimates are available. We show in Section 4 that
to that of Pareto arrival except that both SRPT-FS and FSP-FS such improvements are possible for web servers using the sim-
need a slightly bigger R to work better than PS. ple, efficient techniques.
( (*) 0 , when its performance con-
FSP-FS is very sensitive to . For Poisson arrivals, its perfor-
mance is not stable until 3.4 Simulation with web server trace4500000 900000
PS PS
4000000 800000 FSP
FSP
Mean Sojourn Time in Microseconds
SRPT
3500000 SRPT 700000
FSP-FS
Mean Sojourn Time
3000000 FSP-FS 600000 SRPT-FS
2500000 SRPT-FS 500000
2000000 400000
1500000 300000
1000000 200000
500000 100000
0 0
0 0.5 1 1.5 2 0 0.5 1 1.5 2
Load Load
Figure 16: Mean sojourn time versus load, G/G/ / ,
Figure 14: Mean sojourn time versus queue load for web
trace, M/G/1/ , Poisson arrivals Pareto arrivals.
6000
6000 PS
PS FSP
5000
SRPT
5000 FSP
FSP-FS
Mean Queue Length
SRPT 4000
Mean Queue Length
SRPT-FS
4000 FSP-FS
SRPT-FS 3000
3000
2000
2000
1000
1000
0
0 0.5 1 1.5 2
0
Load
0 0.5 1 1.5 2
Load
Figure 17: Mean queue length versus load, G/G/ / ,
Figure 15: Mean queue length versus queue load for web Pareto arrivals.
trace, M/G/1/ , Poisson arrivals.
load, while Figure 17 shows the mean queue length of dif-
ferent scheduling policies with increasing load on the queue.
$ (*)+ +
Here we consider the performance of SRPT, SRPT-FS, FSP,
In both figures, ideal SRPT and FSP perform very well, and
FSP-FS, and PS on the measured web server trace ( )
identically. However, again, SRPT-FS and FSP-FS perform
described in Section 2.1. The mean service time is 1250 mi-
worse, and their behavior diverges from the ideal with increas-
croseconds. The scheduling policies are described in Figure 1.
ing load.
Note that although our web server trace represents very low
load, here we vary the load in the system by controlling the ar-
Finally, we consider what happens if we fix the mean interar-
rival process of the requests represented in the trace. We make
rival time and increase the number of servers, G/G/ / (Pareto
use of Poisson arrivals, Pareto arrivals, and Weibull arrivals
and control their mean rate in order to control the load. Load
control is important, because, as we discussed in Section 2.1, 2000000
PS
the load captured in the trace is rather low. The time units are 1800000
FSP
Mean Sojourn Time (Microseconds)
microseconds throughout the rest of the paper. 1600000
SRPT
1400000 FSP-FS
We begin with M/G/1/ (Poisson arrivals, file sizes and ser- 1200000
SRPT-FS
vice times as in the trace). Figure 14 shows the mean sojourn 1000000
times of different scheduling policies with increasing load, 800000
while Figure 15 shows the mean queue lengths. In both fig- 600000
ures, ideal SRPT and FSP perform very well and identically. 400000
However, SRPT-FS and FSP-FS both perform quite poorly, 200000
and their performance diverges dramatically from their ideal 0
performance with increasing load. SRPT-FS and FSP-FS per- 0 2 4 6 8 10 12 14 16
form worse than SRPT and FSP in all our simulations. Num ber of Servers
Next, we consider G/G/1/ (Pareto arrivals, file sizes and ser- Figure 18: Mean sojourn time versus number of servers,
vice times as in the trace). Figure 16 shows the mean so- G/G/ / , Pareto arrivals, Mean interarrival time 162.5
journ times of different scheduling policies with increasing microseconds.6000
PS
4. DOMAIN-BASED SCHEDULING
5000 FSP We have found that request file size and service time are weakly
SRPT correlated and that the performance of size-based scheduling
FSP-FS
policies are strongly dependent on the degree of this correla-
Mean Queue Length
4000
SRPT-FS
tion. Given these results, a natural question is whether there is
3000
a better service time estimator than file size, one whose esti-
2000
mates are more strongly correlated with actual service time.
Such an estimator must also be lightweight, requiring little
1000 work per request. For this reason, we cannot use active prob-
ing techniques such as those used in tools like the Network
0 Weather Service [43]. We also cannot use passive network-
0 2 4 6 8 10 12 14 16
Num ber of Servers
layer techniques, such as those used in Remos [26], because
we do not have access to the network layer throughout the
path. Instead, we use past web requests as our probes, sim-
Figure 19: Mean queue length versus number of servers,
ilar in spirit to SPAND [39].
G/G/ / , Pareto arrivals, Mean interarrival time 162.5
microseconds.
4.1 Statistical stability of the Internet
Domain-based scheduling relies on the Internet being statisti-
cally stable over periods of time, particularly from the point
arrivals, file sizes and service times as in the trace). We fixed of view of the web server. Fortunately, there is significant evi-
the interarrival mean at 162.5 microseconds, and mean ser- dence that this is the case. This evidence falls into two classes,
vice time for each server at 1250 microseconds. Figure 18 routing stability and spatial and temporal locality of end-to-
shows the mean sojourn times of different scheduling policies end TCP throughput.
with the increasing number of servers. Figure 19 shows the
the mean queue length of different scheduling policies with Routing stability: Paxson [31, 30] proposed two metrics for
increasing load on the queue. Again, we see that ideal SRPT route stability, prevalence and persistency. Prevalence, which
and FSP perform very well and identically, but that SRPT-FS is of particular interest to us here, is the probability of observ-
and FSP-FS perform much more poorly, especially with few ing a given route over time. If a route is prevalent, than the
servers. As the number of servers increases, the differentia- observation of it allows us to predict that it will be used again.
tion between the policies decreases. Not surprisingly, in what Persistency is the frequency of route changes. The two met-
is effectively a low-load regime, there is not much difference rics are not closely correlated. Paxson’s conclusions are that
between the policies. Internet paths are heavily dominated by a single route, but that
the time periods over which routes persist show wide varia-
For a queue with unlimited queue capacity, the mean sojourn tion, ranging from seconds to days. However, 2/3 of the In-
time tends to be infinity if the load is over unity. But our simu- ternet paths Paxson studied had routes that persisted for days
lator takes a limited queue capacity to reflict the reality, there- to weeks. Chinoy found that route changes tend to concen-
fore, the server start to reject jobs when overloaded for some trate at the edges of the network, not in its “backbone” [14].
time (the queue is full) and both mean sojourn time and mean Barford, et al measured the web performance in the wide area
queue length are meanful. They represent the queue behavior network and found that the routes from/to the client to/from a
of the server under transient overload. web servers was asymmetric, but very stable [9].
We have also investigated a Weibull arrival process, where the Spatial locality and temporal locality of end-to-end TCP
interarrival times of requests in the trace are drawn from a throughput: Balakrishnan, et al analyzed statistical models
Weibull distribution. The results are similar to those for the for the observed end-to-end network performance based on
Pareto arrival process shown earlier. extensive packet-level traces collected from the primary web
site for the Atlanta Summer Olympic Games in 1996. They
Our simulations, using both synthetic traces and our measured concluded that nearby Internet hosts often have almost identi-
web server trace have found that the performance of SRPT-FS cal distributions of observed throughput. Although the size of
and FSP-FS, SRPT and FSP where request file size is used as the clusters for which the performance is identical varies as a
request service time, is highly dependent on the correlation function of their location on the Internet, cluster sizes in the
between file size and service time. With low enough , per- range of 2 to 4 hops work well for many regions. They also
formance can degrade so far that PS is preferable to either of found that end-to-end throughput to hosts often varied by less
these policies. Our trace shows such a low . Furthermore, than a factor of two over timescales on the order of many tens
over wide range of , which includes the range seen in the of minutes, and that the throughput was piecewise stationary
web cache traces we examined, increasing dramatically in- over timescales of similar magnitude [7]. Seshan, et al applied
creases performance for SRPT-FS. In the next Section, we de- these findings in the development of the Shared Passive Net-
scribe and evaluate a better estimator for service time that uses work Performance Discovery (SPAND) system [39], which
file size, the network “domain” of the client, and past perfor- collected server performance information from the point of
mance to the domain to produce more accurate service time view of a pool of clients and used that history to predict the
estimates. Using these estimates, SRPT and FSP can be made performance of new requests. Myers, et al examined perfor-
to perform much better than simply using file size. mance from a wide range of clients to a wide range of serversand found that bandwidth to the servers and server rankings 0.8
R (correlation cofficient between actual service
from the point of view of a client were remarkably stable over 0.7
time [28]. Yin Zhang, et al [45] found that three Internet path
time and estimated service time)
properties, loss rate, delay and TCP throughput show various 0.6
degrees of constancy and concluded that one can generally 0.5
count on constancy on at least the time scale of minutes.
0.4
4.2 Algorithm 0.3
Although the Internet, web servers, and clients form a highly 0.2
dynamic system, the stability we pointed out in the previous
section suggests that previous web requests (the web server’s 0.1
access log) are a rich history which can be used to better esti- 0
mate the service time of a new request. We assume that after 0 2 4 6 8 10 12 14 16 18 20 22 24 26 28 30 32
processing a request we know (1) its file size, (2) the actual Bits used to define a dom ain
service time, and (3) the IP address of the client. Collecting
this information is simple and efficient. Our goal is to develop Figure 20: Correlation versus number of bits used to
an efficient estimator that uses a history of such requests, com- define a domain .
bined with the file size and IP address of the current request to
determine the likely service time of the current request. The
correlation between the estimated service time and the ac- the service times for these requests. Notice that updating
tual service time should be higher than the correlation between
this estimate after a request has been processed is trivial:
file size and actual service time. Recall that must exceed a simply add the request’s file size and service time to
threshold in order for SRPT to perform better than PS, and as and , respectively (two reads, two adds, two writes).
increases, the performance of SRPT increases. For each domain, we store and . An array of these
pairs is kept, indexed by the domain address. The total
Classless Inter Domain Routing (CIDR) [23, 34, 19] was state size is floating point numbers.
proposed in 1993 as “a strategy for address assignment of
3. For each incoming client request, the web server first
the existing IP address space with a view to conserve the ad-
extracts the domain address, indexes the array and com-
dress space and stem the explosive growth of routing tables
putes for the domain. S
It then estimates the request’s
in default-route-free routers”. The CIDR strategy has been
widely deployed since 1993. “One major goal of the CIDR
service time as , where l is the re- $
quest file size. The estimator requires a logical shift,
addressing plan is to allocate Internet address space in such a
two reads, a division, and a multiply. For a request from
manner as to allow aggregation of routing information along
topological lines”. Consider a domain, a neighborhood in the a heretofore unobserved domain, which occurs exactly
network topology. The broad use of CIDR implies that routes once per domain, we simply use file size as the estimate.
from machines in the domain to a server outside the domain 4. Apply a size-based scheduling policy such as SRPT us-
will share many hops. Similarly, the routes from the server to ing the estimated service times. We suffix the schedul-
different machines in the domain will also have considerably ing policy with “-D”: SRPT-D, FSP-D.
overlap. This also means that the routes will be likely to share
the same bottleneck network link and therefore have similar
throughput to/from the server. The smaller the domain, the As we might expect, as domains become smaller ( gets larger),
more the sharing. predictive performance increases, at the cost of memory to
store the state. Figure 20 shows the relationship between ,
The aggregation of CIDR is along a hierarchy of increasingly the number of bits used to define a domain and the correlation
larger networks and is reflected in IP addresses. The first between the actual service time and estimated service time.
$ %
The figure is derived from our web server trace. jumps to
!#
bits of an IP address gives the network of which the address
is a part, the first bits give the broader network that 0.26 with bits, beyond the threshold at which SRPT
contains the first network, and so on. We exploit this hierarchy begins to perform better than PS. Notice that this is a mere
$ +
in domain-based scheduling, the algorithm of which is given 32 domains (state size of 256 bytes with 4 byte floats). After
below. bits, there are only very small increases of , probably
because at this point we have divided the Internet into LANs,
where each machine on a LAN shares a common route to ev-
1. Use the high order bits of the client IP address to clas- ery other machine in the Internet, and thus shares the same
sify the clients into domains, where the bits are bottlenecks. The maximum we were able to achieve was
treated as the domain address. 0.704.
2. Aggregate past requests to estimate the service rate (or
representative bandwidth) for each domain. This can be 4.3 Performance evaluation
S
] but our experiments show
"$
done with several estimators, To evaluate domain-based scheduling (SRPT-D and FSP-D,
that the estimator performs
the best. Here also see Figure 1), we use the methodology of Section 3.4.
is the representative service rate, is the sum of the re- We replay our web trace with Poisson, Pareto, and Weibull ar-
quested file sizes from the domain, and is the sum of rivals to control load. We vary , the number of high-order bits4000000 900000
PS PS
FSP 800000 FSP
3500000
SRPT SRPT
FSP-FS 700000 FSP-FS
Mean Sojourn Time
3000000
SRPT_FS SRPT-FS
600000
Mean Sojourn Time
2500000 FSP-D FSP-D
SRPT-D 500000 SRPT-D
2000000
400000
1500000 300000
1000000 200000
100000
500000
0
0 0 2 4 6 8 10 12 14 16 18 20 22 24 26 28 30 32
0 2 4 6 8 10 12 14 16 18 20 22 24 26 28 30 32
Bits Used to define a Dom ain
Bits used to define a dom ain
Figure 23: Mean sojourn time versus for web trace,
Figure 21: Mean sojourn time versus for web trace,
$ ) , %
-(
domain-based scheduling, G/G/1/ , Pareto arrivals
with
domain-based scheduling, M/G/1/ , Poisson arrivals with , Lower bound 84, Upper bound , load
Mean Interarrival time 1269, load 0.90. 0.88.
3000
PS 3000 PS
FSP FSP
2500 SRPT 2500 SRPT
FSP-FS FSP-FS
SRPT-FS SRPT-FS
Mean Queue Length
2000 2000
Mean Queue Length
FSP-D FSP-D
SRPT-D SRPT-D
1500 1500
1000
1000
500
500
0
0 0 5 10 15 20 25 30 35
0 2 4 6 8 10 12 14 16 18 20 22 24 26 28 30 32 34
Bits used to define a dom ain
Bits used to define a dom ain
Figure 24: Mean queue length versus for web trace,
Figure 22: Mean queue length versus for web trace,
$ ) , %
-(
domain-based scheduling, G/G/1/ ; Pareto arrivals
with
domain-based scheduling, M/G/1/ , Poisson arrivals with , Lower bound 84, Upper bound , load
Mean Interarrival time 1269, load 0.90. 0.88.
we use to define a domain. In this section, we used a longer queue length of all the scheduling policies with Pareto arrivals
trace than in the previous sections. The R between file size and as a function of . The effects here are very similar to those
service time remains unchanged, but the mean service time is discussed previously, as are the results for Weibull arrivals.
slightly lower, which is 1145 instead of 1250 microseconds.
Our performance evaluation of SPRT-D and FSP-D demon-
Figures 21 and 22 show the mean sojourn time and mean strates that better, practical estimators of service time are pos-
queue length of all the scheduling policies with Poisson ar- sible and that they can dramatically improve the performance
rivals. Notice that PS, FSP, SRPT, FSP-FS, and SRPT-FS are of size-based scheduling policies on web servers.
flat lines. PS ignores service time. FSP and SRPT have ex-
act knowledge of the service times (they represent the ideal
performance of these policies). FSP-FS and SRPT-FS use file
5. CONCLUSIONS AND FUTURE WORK
This paper has made the following contributions:
size as a proxy for service time (representing current practice).
Notice that as we increase the number of bits used to define a
domain, the performance of SRPT-D and FSP-D first exceeds
We have demonstrated that the assumption that file size
that of PS and finally converges to near the ideal performance. is a good indicator of service time for web servers is
unwarranted. File size and service time are only weakly
While SRPT-D’s performance increases continuously, with di- correlated. The implication is that size-based scheduling
$ - +
minishing returns, with increasing , FSP-D is rather insensi- policies such as SRPT and FSP are likely to perform
tive until to bits, at which point its performance worse than expected.
$ +
jumps dramatically and comes very close to SRPT-D’s. Since
doesn’t increase much beyond bits, as we might
We have evaluated the performance of SRPT-FS and
expect, the performance of SRPT-D and FSP-D plateaus. FSP-FS, SRPT and FSP using the assumption, with vary-
ing correlation between file size and service time. We
Figures 23 and 24 show the mean sojourn time and mean found that their performance does indeed vary dramati-cally with correlation. In some cases SRPT-FS and FSP- [10] B ARFORD , P., AND C ROVELLA , M. Generating representative
FS can actually perform worse than PS. web workloads for network and server performance evaluation.
In SIGMETRICS (98).
We have proposed, implemented, and evaluated a better [11] B OXMA , O., AND C OHEN , J. Heavy-traffic analysis for the
service time estimator that makes use of the hierarchical G/G/1 queue with heavy-tailed distributions. Queueing Systems
nature of routing on the Internet and the history of past 33 (1999), 177–204.
requests available on the web server. We refer to SRPT [12] B UX , W. Analysis of a local-area bus system with controlled
and FSP augmented with our domain-based estimator as access. IEEE Transactions on Computers 32, 8 (1983),
SRPT-D and FSP-D. The state size of our estimator is a 760–763.
parameter. [13] C ARIO , M. C., AND N ELSON , B. L. Numerical Methods for
Fitting and Simulating Autoregressive-to-Anything Processes.
We have found that, with a small state size, SRPT-D INFORMS Journal on Computing 10, 1 (1998), 72–81.
can outperform PS. With a practical state size, SRPT-D [14] C HINOY, B. Dynamics of internet routing information. In
can exhibit close to ideal performance. FSP-D requires SIGCOMM (1993), pp. 45–52.
a significantly larger state size to perform close to its
[15] C ROVELLA , M., AND B ESTAVROS , A. Self-Similarity in
ideal. SRPT reacts very quickly to increasingly accurate World Wide Web Traffic: Evidence and Possible Causes. In
service time estimates. SIGMETRICS’96 (Philadelphia, Pennsylvania, May 1996).
Also, in Performance evaluation review, May 1996,
24(1):160-169.
Fairness is an important concern in the deployment of domain-
[16] D ENG , S. Empirical model of WWW document arivals at
based scheduling. Slowdown has been used in previous re- access links. In IEEE International Conference on
search work [8, 22] as the fairness metric, but slowdown has Communication (June 1996).
two possible interpretations. Slowdown can be defined as so- [17] D INDA , P., AND O’H ALLARON , D. An evaluation of linear
journ time over service time or sojourn time over file size. We models for host load prediction. In 8th IEEE International
have studied fairness using both interpretations and our initial Symposium on High Performance Distributed Computing
results show that SRPT-D outperforms PS in fairness under (HPDC-8) (1999).
most conditions using both. We are working to extend these [18] F RIEDMAN , E. J., AND H ENDERSON , S. G. fairness and
initial results. efficiency in web server protocol. In
SIGMETRICS/Performance (2003).
A limitation of this work is that we have focused on web servers [19] F ULLER , V., L I , T., Y U , J., AND VARADHAN , K. (rfc1519)
that provide static content. We speculate that service time esti- Classless Inter-Domain Routing (CIDR): an address assignment
mators for web servers that provide dynamic content may also and aggregation strategy, September 1993.
be possible. Small improvements in any such estimators would http://www.faqs.org/rfcs/rfc1519.txt.
lead to significant improvements in the performance of algo- [20] H ARCHOL -B ALTER , M., B ANSAL , N., AND S CHROEDER , B.
rithms such as SRPT. We are exploring this possibility. We Implementation of srpt scheduling in web servers. Tech. Rep.
are also considering hierarchical domain-based estimators in CMU-CS-00-170, Carnegie Mellon School of Computer
Science, October 2000.
. !. ) ) )-. (
which a request would match a series of concentric domains
defined by the high order bits of the source [21] H ARCHOL -B ALTER , M., C ROVELLA , M. E., AND PARK , S.
address. The request would then use the service time estimate The case for srpt scheduling in web servers. Tech. Rep.
MIT-LCR-TR-767, MIT lab for computer science, October
provided by smallest domain which has sufficient samples, or
1998.
the domain for which past estimates have been most accurate.
[22] H ARCHOL -B ALTER , M., S CHRDER , B., B ANSAL , N., AND
A GRAWAL , M. Size-based scheduling to improve web
6. REFERENCES performance. ACM Transactions on Computer Systems (TOCS)
[1] The apache software foundation. http://www.apache.org/. 21, 2 (May 2003).
[2] Bonnie, a unix file system benchmark. [23] H INDEN , R. (rfc1517) Applicability statement for the
http://www.textuality.com/bonnie/. implementation of Classes Inter-Domain Routing (CIDR),
[3] The internet traffic archive. http://ita.ee.lbl.gov/. September 1993. http://www.faqs.org/rfcs/rfc1517.txt.
[4] The ircache project. http://www.ircache.net/. [24] K RISHNAMURTHY, B., AND R EXFORD , J. Web Protocols and
Practice: HTTP1.1, Networking Protocols, Caching, and
[5] The squid web proxy cache project. Traffic Measurements. Addison-Wesley, 2001.
http://www.squid-cache.org/.
[25] M ANLEY, S., AND S ELTZER , M. Web Facts and Fantasy. In
[6] A LLEN , A. O. Probability, statistics, and queueing theory with Proceedings of the 1997 Usenix Symposium on Internet
computer science applications. Academic press, Inc., 1990. Technologies and Systems (USITS97) (Monterey, CA, 1997).
[7] B ALAKRISHNAN , H., S ESHAN , S., S TEMM , M., AND K ATZ , [26] M ILLER , N., AND S TEENKISTE , P. Network status
R. H. Analyzing Stability in Wide-Area Network Performance. information for network-aware applications. In Proceedings of
In ACM SIGMETRICS (June 1997). IEEE Infocom 2000 (March 2000). To Appear.
[8] B ANSAL , N., AND H ARCHOL -B ALTER , M. Analysis of SRPT [27] M UTKA , M. W., AND L IVNY, M. The available capacity of a
scheduling: investigating unfairness. In privately owned workstation environment. Performance
SIGMETRICS/Performance (2001), pp. 279–290. Evaluation 12, 4 (July 1991), 269–284.
[9] B ARFORD , P., AND C ROVELLA , M. Measuring web [28] M YERS , A., D INDA , P. A., AND Z HANG , H. Performance
performance in the wide area. Performance Evaluation Review characteristics of mirror servers on the internet. In INFOCOM
27, 2 (1999), 37–48. (1) (1999), pp. 304–312.You can also read