Gut Microbiota Associations with Metabolic Health and Obesity Status in Older Adults - MDPI
←
→
Page content transcription
If your browser does not render page correctly, please read the page content below
nutrients
Article
Gut Microbiota Associations with Metabolic Health
and Obesity Status in Older Adults
Xiaozhong Zhong 1,2 , Janas M. Harrington 3 , Seán R. Millar 3 , Ivan J. Perry 3 , Paul W. O’Toole 2
and Catherine M. Phillips 3,4, *
 1   National Engineering Laboratory for Cereal Fermentation Technology, Jiangnan University, Wuxi 214122,
     China; xiaozhong_zhong@jiangnan.edu.cn
 2   School of Microbiology and APC Microbiome Ireland, University College Cork, Cork, Ireland;
     pwotoole@ucc.ie
 3   HRB Centre for Health and Diet Research, School of Public Health, University College Cork, Cork, Ireland;
     j.harrington@ucc.ie (J.M.H.); s.millar@ucc.ie (S.R.M.); i.perry@ucc.ie (I.J.P.)
 4   School of Public Health, Physiotherapy, and Sports Science, University College Dublin, Dublin 4, Ireland
 *   Correspondence: catherine.phillips@ucd.ie

 Received: 13 July 2020; Accepted: 5 August 2020; Published: 7 August 2020

 Abstract: Emerging evidence links the gut microbiota with several chronic diseases. However,
 the relationships between metabolic syndrome (MetS), obesity and the gut microbiome are inconsistent.
 This study aimed to investigate associations between gut microbiota composition and diversity and
 metabolic health status in older adults (n = 382; median age = 69.91 [± 5 years], male = 50.79%)
 with and without obesity. Gut microbiome composition was determined by sequencing 16S rRNA
 gene amplicons. Results showed that alpha diversity and richness, as indicated by the Chao1
 index (p = 0.038), phylogenetic diversity (p = 0.003) and observed species (p = 0.038) were higher
 among the metabolically healthy non-obese (MHNO) individuals compared to their metabolically
 unhealthy non-obese (MUNO) counterparts. Beta diversity analysis revealed distinct differences
 between the MHNO and MUNO individuals on the phylogenetic distance scale (R2 = 0.007, p = 0.004).
 The main genera contributing to the gut composition among the non-obese individuals were Prevotella,
 unclassified Lachnospiraceae, and unclassified Ruminococcaceae. Prevotella, Blautia, Bacteroides,
 and unclassified Ruminococcaceae mainly contributed to the variation among the obese individuals.
 Co-occurrence network analysis displayed different modules pattern among different metabolic
 groups and revealed groups of microbes significantly correlated with individual metabolic health
 markers. These findings confirm relationships between metabolic health status and gut microbiota
 composition particularly, among non-obese older adults.

 Keywords: gut microbiota; metabolic syndrome; host-microbiota interactions; metabolically healthy
 obesity; obesity phenotypes; older adults

1. Introduction
     Metabolic syndrome (MetS) is characterized by a clustering of metabolic abnormalities and risk
factors for cardiovascular disease (CVD) including central obesity, hypertension, dyslipidemia and
elevated fasting glucose [1,2]. The increasing incidence of MetS is associated with high morbidity
and mortality and concomitant economic and social burden [3]. Thus, MetS represents a significant
public health concern requiring more effective preventative and therapeutic strategies. The etiology of
MetS is not fully understood. Obesity plays a significant role; however, obesity is a heterogeneous
condition and not all individuals with obesity display MetS features [4]. It has been recognized that
some individuals with obesity have preserved metabolic function generally defined as an absence

Nutrients 2020, 12, 2364; doi:10.3390/nu12082364                                www.mdpi.com/journal/nutrients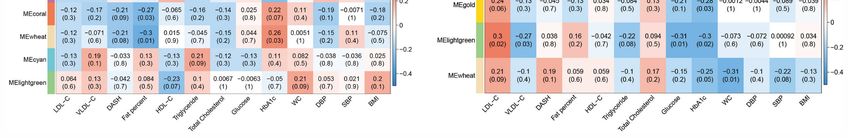
Nutrients 2020, 12, 2364                                                                          2 of 17

of MetS and may be regarded as metabolically healthy obese (MHO). Similarly, not all individuals
without obesity are metabolically healthy; thus a spectrum of metabolic health phenotypes exist from
metabolically healthy non-obese (MHNO) to metabolically unhealthy obese (MUO) [5].
     Gut microbiota is regarded as a central factor co-varying many chronic diseases including CVD,
type 2 diabetes mellitus (T2DM), and MetS [6,7]. Subsequently, specific microbiota-based biomarkers
associated with these conditions have been identified [8–10]. Although previous studies have reported
associations between gut microbiota and metabolic disorders and obesity, no consistent gut microbiota
signatures have been identified for MetS. Some previous studies have reported the relative abundance
of Bacteroidetes members as being lower, and the proportions of Firmicutes members higher, in the
gut microbiota of obese subjects [11,12]. On the contrary, increased relative abundance of Bacteroidetes
members have been observed in overweight and obese subjects [13,14].
     Treatments targeting gut microbiota directly such as probiotics, prebiotics, [15,16], and faecal
transplantation [17] or indirectly via bariatric surgery [18] can positively influence metabolic health.
The heterogeneity of human microbiota, which is influenced by sex, age, race and geographical
location amongst other factors [19–21], is becoming more apparent. It is well documented that aging
is associated with alterations in the gut microbiome [22–24]. Thus, better understanding of the gut
microbiota heterogeneity according to metabolic health and weight status, particularly among older
adults, is warranted, with a view to improving our understanding of the role of gut microbiota in
MetS, obesity-related disease and healthy ageing and for developing novel preventative and treatment
strategies. To our knowledge, no comparative data on gut microbiota according to metabolic health
phenotype, such as metabolically healthy and unhealthy obese and non-obese exist. Therefore, the aim
of this study was to examine associations between metabolic health phenotypes and gut microbiota
composition and diversity in older male and female adults.

2. Materials and Methods

2.1. Study Participants
      Participants were recruited to the Mitchelstown Cohort Rescreen (MCR) Study, which was a
follow-up study to the 2010 Cork and Kerry Diabetes and Heart Disease Study [25]. Of the 2047
participants that took part in the initial phase of the study, 1881 were eligible to participate in the
follow-up phase; the remaining 166 participants from the initial phase of the study had either passed
away between completion of the Cork and Kerry Diabetes and Heart Disease Study and the start of
the MCR Study, or were deemed to be medically ineligible, as determined by their contact General
Practitioner (GP). Between November 2015 and May 2017, 1378 participants returned for the rescreen
study (73% response rate). All participants were between the ages of 55 and 74 years. The MCR sample
is a population-representative random sample, recruited through the Living Health Clinic, a large
primary care center in Ireland. Of the 1378 participants, 435 participants (31.6%), without selecting
for any particular health or disease status, provided stool samples for gut microbiota analysis. After
exclusion of the subjects who used antibiotics in the previous 4 weeks, 382 participants (27.7%) were
included in the current analysis.
      All subjects gave their informed consent for inclusion before they participated in the study.
The study was conducted in accordance with the Declaration of Helsinki, and the protocol was
approved by the Ethics Committee of the Clinical Research Ethics Committee of University College
Cork (Project identification code ECM 4 (nnn) 07/07/15). The MCR Study is General Data Protection
Regulation (GDPR) compliant. All procedures and measurements were conducted by trained research
staff according to study-specific standard operating procedures.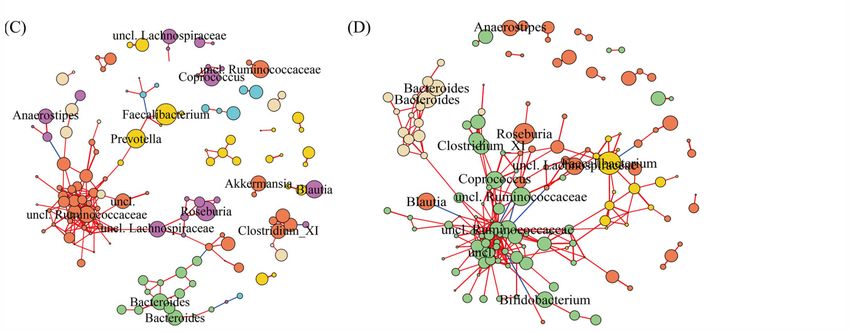
Nutrients 2020, 12, 2364                                                                                3 of 17

2.2. Measurements

2.2.1. Demographic and Covariate Information
      Blood samples were taken following an overnight fast. Fasting plasma glucose (FPG), glycated
haemoglobin A1c (HbA1c ), serum total cholesterol, HDL cholesterol (HDL-C), LDL cholesterol (LDL-C)
and triglyceride levels were measured by Cork University Hospital Biochemistry Laboratory using
fresh blood samples. Resting systolic blood pressure (SBP) and diastolic blood pressure (DBP) were
measured by standard auscultatory methods when the subjects were relaxed. Body composition was
measured via bioelectrical impedance (BIA) (Tanita MC 780_MA Body Composition Analyser, Tanita,
Amsterdam, Netherlands). Height (cm) and weight (kg) were measured without footwear or heavy
outer clothes using a portable stadiometer (Seca, Leicester, United Kingdom) and portable electronic
scales (Tanita, Amsterdam, Netherlands), respectively. Body mass index (BMI) was calculated using
weight and height squared (kg/m2 ). Data on covariates, including age, sex, disease status (CVD and
T2DM), medication use (blood pressure, cholesterol lowering, diabetes medications and antibiotics) and
lifestyle factors (smoking status and alcohol consumption) were obtained by asking each participant to
complete a clinical report form and a computer-assisted personal interview general health questionnaire.
The presence of CVD was based on diagnosis of any one of the following conditions: hypertension, high
cholesterol, heart attack (including coronary thrombosis or myocardial infarction), heart failure, angina,
aortic aneurysm, stroke, narrow leg arteries or any other heart condition reported by the participant.
      In addition, participants also completed a standard validated Food Frequency Questionnaire
(FFQ), from which the Dietary Approaches to Stop Hypertension (DASH) diet quality scores were
derived [26].

2.2.2. Classification of MetS and Metabolic Health Phenotypes
     MetS was defined according to the revised National Cholesterol Education Panel Adult Treatment
Panel III (NCEP ATP III) guidelines which classifies MetS as three or more of the following risk factors [27]:
(1) obesity classified as waist circumference ≥ 102 cm in men or ≥ 88 cm in women, (2) dysglycemia
defined as a FPG level ≥ 5.6 mmol/L, (3) fasting hypertriglyceridemia (triglycerides > 1.7 mmol/L), (4) low
HDL-C level (HDL-C < 1.03 mmol/L in men or < 1.29 mmol/L in women), (5) high blood pressure
(SBP ≥ 130 mmHg or DBP ≥ 85 mmHg or on blood pressure medications). Metabolic health status was
defined according to obesity (BMI ≥ 30 kg/m2 ) with or without the presence of MetS [28], generating
the following groups; metabolically healthy non-obese (MHNO), metabolically healthy obese (MHO),
metabolically unhealthy non-obese (MUNO), and metabolically unhealthy obese (MUO) subjects.

2.3. Gut Microbiota Analyses
      Stool collection was performed by the participant at their home. Participants were provided with
a container to collect the whole bowel motion. They were advised that the stool sample should be
as fresh as possible, ideally produced on the morning of their visit to the clinic where the samples
were stored at −80 ◦ C until extraction. If this was not possible, a sample from the previous night
(within 12 h of their visit to the clinic) was permitted. Microbiota analysis was performed as previously
described [29]. The composition of the gut microbiome in faecal samples was determined by 16S rRNA
gene sequencing. The V3-V4 region of the 16S rRNA gene was amplified and sequenced on an Illumina
MiSeq 2 × 250 bp using the following primers: 341F (50 -CCTACGGGNGGCWGCAG-30 ) and 805R
(50 -GACTACHVGGGTATCTAATCC-30 ). Flash was used to join overlapping paired reads and exclude
reads that have more than 25% incorrect bases in the region of overlap. Quality control was then carried
using Quantitative Insights Into Microbial Ecology (QIIME) 1.9.0. Reads were then summarized to
Operational Taxonomic Units (OTUs), with a 97% identity threshold and chimeric sequences removed
using USEARCH64. In order to calculate alpha (within-participants) and beta (between-participants)
diversity, the complete OTU count Table was rarefied to 10,000 sequences. Alpha and beta diversity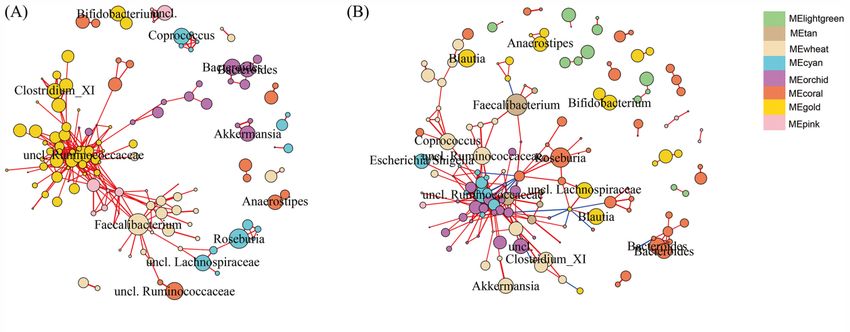
Nutrients 2020, 12, 2364                                                                           4 of 17

metrics were calculated for the rarefied Tables using QIIME 1.9.0. The representative OTU sequences
were assigned taxonomy by Mothur 1.36.1 using the RDP database and the RDP method [29].

2.4. Statistical Analyses
      Statistical analyses were performed using the R statistical package (3.5.1). Normality of variables
was assessed using the Shapiro-Wilk test. Those variables that did not meet normality were analyzed
using a Mann–Whitney U test. A Chi-Square test was used to compare differences for categorical
variables. Multiple linear regression analyses were performed to assess the associations of metabolic
health markers (MetS components) with alpha diversity and abundant taxonomy (relative abundance
> 0.1%) following adjustment for potential confounders, such as age, sex, disease status (CVD and/or
T2DM), medication use (blood pressure, cholesterol lowering, diabetes medications) and lifestyle
factors (DASH score, smoking status and alcohol consumption). An analysis of variance (ANOVA) test
was used to investigate associations between the metabolic health markers and alpha diversity and
relative abundance of taxonomy in linear models. Differences in beta diversity (principal coordinates
analysis, PCoA) were investigated by permutational multivariate analysis of variance based on distance
matrices using adonis in R vegan package, following adjustment for potential confounders. Statistical
significance was initially set at an alpha level of 0.05. Differential abundance at phylum, family and
genus level between MHNO and MUNO, MHO and MUO groups was identified using DESeq2 R
package. In multivariate analyses, p values were corrected with the Benjamini-Hochberg false discovery
rate (FDR < 0.05).

2.5. Co-Occurrence Network Analysis
     OTU read counts were normalized by variance stabilizing transformation in the DESeq2 R
package. Co-occurrence network based on the normalized OTU was constructed using the weighted
gene co-expression network analysis (WGCNA) R package [30]. Briefly, we set deepSplit = 2 and
minModuleSize = 10 as parameters for the module identification using dynamic tree cut. The relationship
between modules and metabolic trait was calculated using the Spearman correlation. Visualization of
the network was performed using the igraph R package.

3. Results

3.1. Participant Characteristics
     Samples from 382 participants (median age = 69.91 (±5 years), male = 50.79%, female = 49.21%) were
analyzed, including 191 individuals with MHNO, 61 with MUNO, 66 with MHO and 64 MUO subjects
(Table 1). Age, sex, total cholesterol, smoking and alcohol consumption were not significantly different
among groups. Anthropometric (BMI, waist circumference) and clinical parameters including SBP,
HbA1c , fasting glucose, VLDL-C and triglyceride concentrations were higher and HDL-C concentrations
were lower among the MUNO and MUO groups compared to their metabolically healthy counterparts
(MHNO and MHO). Although dietary differences (dietary quality and macronutrient composition)
were observed when all four groups were compared, no differences were noted within the non-obese
(MHNO vs. MUNO) or obese groups (MHO vs. MUO).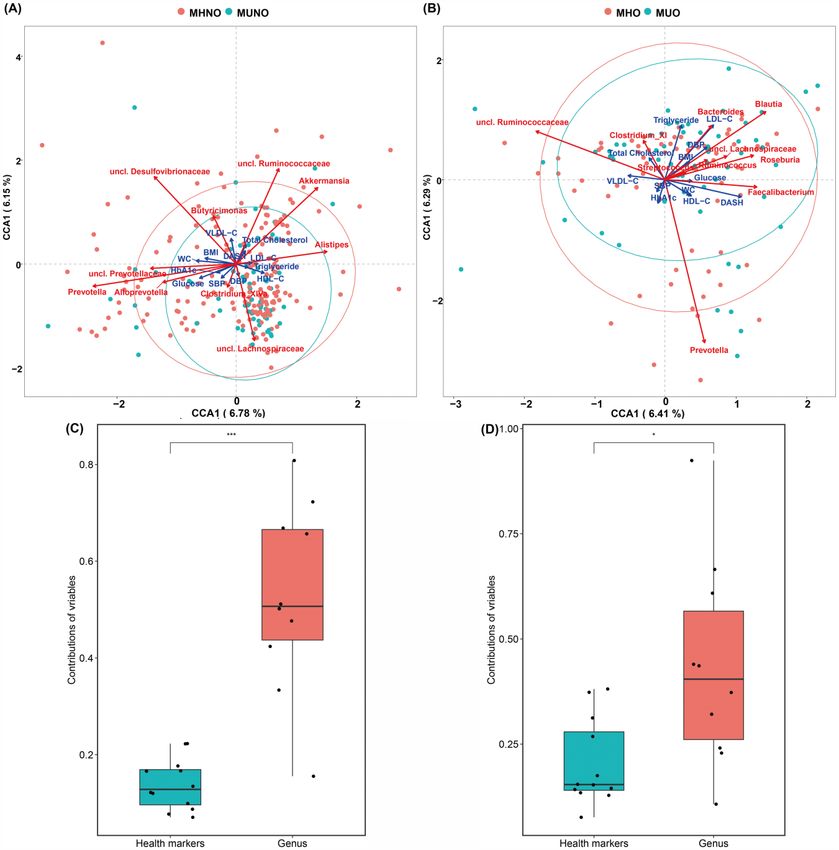
Nutrients 2020, 12, 2364                                                                                                                                                                        5 of 17

                                       Table 1. Descriptive characteristics of the study population according to metabolic health phenotype.

                                                          All                           MHNO               MUNO                                 MHO                MUO
                   Characteristics                                        FDR                                                    FDR                                                    FDR
                                                       (n = 382)                        (n = 191)          (n = 61)                             (n = 66)          (n = 64)
                  Age (years) a                        69.91 (5)          0.174           69 (6)            70 (5)               0.387            69 (5)          68.5 (4)              0.442
                  Sex (male) b                        194 (50.79)         0.425        93 (48.69)         36 (59.01)             0.757         27 (40.91)        38 (59.37)             0.822
                 BMI (kg/m2 ) a                       28.82 (5.52)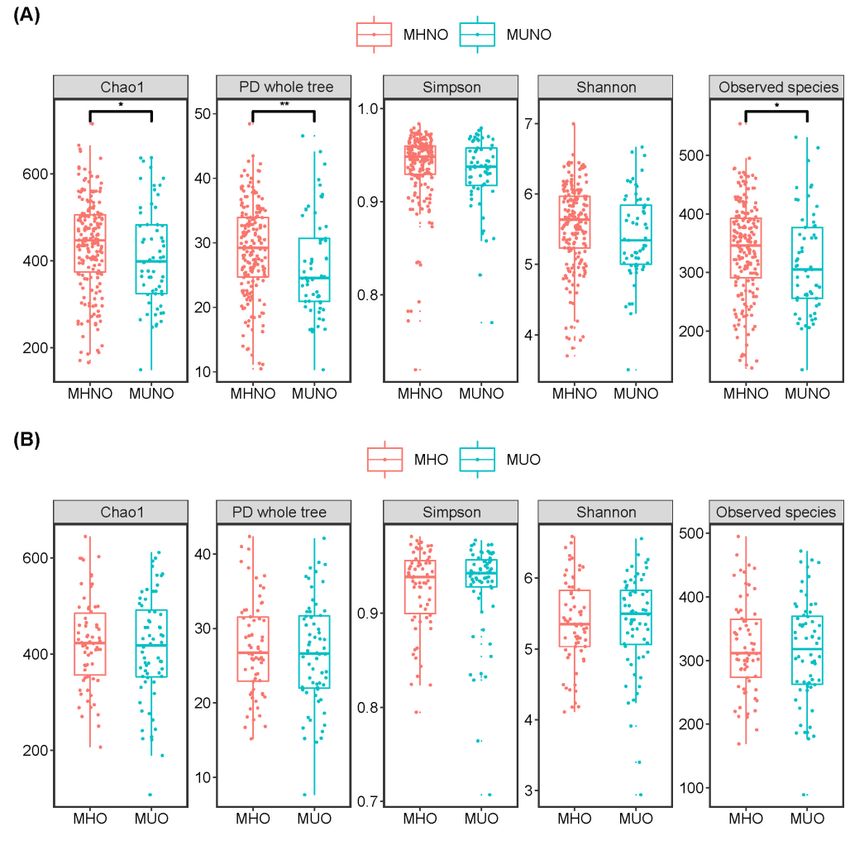
Nutrients 2020, 12, 2364                                                                                            6 of 17

3.2. Metabolic Health Phenotype Associations with Gut Microbiota Alpha Diversity
     Higher gut microbiota alpha diversity was observed among the MHNO participants, relative
to their MUNO counterparts. This was attributed to the significantly higher richness and diversity
as indicated by the Chao1 index (p = 0.038), phylogenetic diversity (p = 0.003) and observed species
(p = 0.038) among the MHNO individuals (Figure 1A). No significant difference in gut microbiota
evenness, as assessed by the Shannon and Simpson indexes, was observed between the MHNO and
MUNO groups. No differences were observed in any measure of alpha diversity between the MHO
and  MUO2020,
  Nutrients groups    (Figure
               12, x FOR PEER 1B).
                              REVIEW                                                        6 of 18

        Figure1.1.Alpha
      Figure       Alphadiversity
                         diversity comparisons   between(A)
                                    comparisons between   (A)MHNO
                                                               MHNOand andMUNO
                                                                            MUNO      individuals,
                                                                                   individuals,  (B)(B)
                                                                                                      MHOMHO  andand
      MUO    individuals. p-values   were calculated  using Mann-Whitney     U  tests for unpaired   groups.
        MUO individuals. p-values were calculated using Mann-Whitney U tests for unpaired groups. Only          Only
      the comparisons   with false  discovery rate-adjusted p values < 0.05 are presented.  * p <  0.05, ** p < 0.01.
        the comparisons with false discovery rate-adjusted p values < 0.05 are presented. * p < 0.05, ** p < 0.01.

  3.3.Associations  between
       Metabolic Health       individual
                        Phenotype          metabolic
                                    Associations       health
                                                 with Gut      markersand
                                                           Microbiota   and  microbiome
                                                                           Beta Diversity alpha diversities were
assessed by multivariate linear regression (Supplementary Table S1). Total cholesterol and LDL-C
showed Beta   diversity
         significant (FDR(PCoA)
                            < 0.05)analysis
                                    positiveshowed      that with
                                              relationships   gut microbiota
                                                                  Chao1, Shannonof MHNO      individualsdiversity
                                                                                     and phylogenetic      was
  significantly (R2 = 0.007, p = 0.004) distinct from that of the MUNO subjects on phylogenetic distance
adjusted for age, sex, disease status and lifestyle factors. Triglyceride and VLDL-C concentrations
  scale (unweighted UniFrac, Figure S1). However, when considering the abundance of OTUs, no
were negatively (FDR < 0.05) associated with Chao1 index. No significant associations were observed
  significant difference was observed between the two groups (Figure S1). In addition, beta diversity
between other metabolic health markers and alpha diversity.
  of the gut microbiota was not significantly different between the obese subjects (MHO vs MUO)
  (Figure
3.3.       S2). Moreover,
     Metabolic             we investigated
                Health Phenotype              whether
                                   Associations        bacterial
                                                  with Gut       community
                                                            Microbiota and Betawas correlated with individual
                                                                                 Diversity
  metabolic health markers by PERMANOVA. In the fully adjusted model, none of the metabolic health
      Beta diversity
  markers            (PCoA) analysis
            were associated             showed that gutdistance
                                with inter-individual      microbiota  of MHNO composition
                                                                   of microbial    individuals was   significantly
                                                                                                  (Bray–Curtis
   2 = 0.007, p = 0.004) distinct from that of the MUNO subjects on phylogenetic distance scale
(Rdistance)  at a FDR of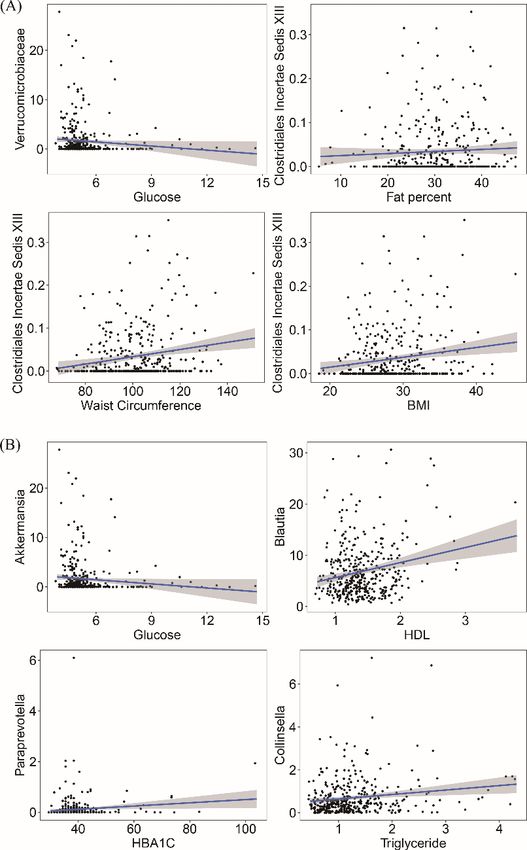
Nutrients 2020, 12, 2364                                                                                              7 of 17

Moreover, we investigated whether bacterial community was correlated with individual metabolic
health markers by PERMANOVA. In the fully adjusted model, none of the metabolic health markers
were associated with inter-individual distance of microbial composition (Bray–Curtis distance) at a
FDR of
Nutrients 2020, 12, 2364                                                                            8 of 17

     In terms of the co-variation of metabolic health markers with the microbiota variation, vectoral
differences of HbA1c , glucose, BMI, WC, and SBP values showed a similar direction of association with
Prevotella genus, while HDL-C and triglyceride formed a directional trend with Alistipes in MHNO and
MUNO groups. For MHO and MUO groups, vectors of LDL−C, triglycerides, DBP and BMI value
gradients showed a similar direction of association to Bacteroides and Blautia; glucose, WC, HDL-C
coincided with genus Faecalibacterium; HbA1c and SBP formed acute vector with Prevotella. However,
among the associations we detected, the contribution of the individual metabolic health markers was
significantly lower than those of the genus factors (Figure 2C,D).

3.4. Fine-Detail Taxonomic Composition of Gut Microbiota
     We further interrogated the composition of gut microbiota at different taxonomic levels (Figures S3
and S4). Sequences were sorted into 6527 OTUs (≥97% identity). Of these OTUs, 490 were present
in at least 20% of the samples. Fecal microbial communities displayed a typical Western diversity
profile dominated by phyla Firmicutes (mean = 76.44%, range = 23.43–98.48%) and Bacteroidetes
(mean = 15.51 %, range = 0.03–58.29%) (Figure S3). Overall, 15 phyla were determined in the
cohort fecal microbial communities, but no significantly different phylum was observed in metabolic
health phenotype groups (Table S3). The most abundant families (90% of total sequences) belong
to Lachnospiraceae (mean = 32.24%, range = 4.37–80.05%), Ruminococcaceae (mean = 28.51%,
range = 0.14–55.63%), Prevotellaceae (mean = 6.87%, range = 0.00–57.67%), and Bacteroidaceae
(mean = 5.70%, range = 0.01–37.69%) (Figure S4). Relative abundance of Lachnospiraceae was
significantly higher among the MUNO individuals relative to the MHNO individuals (Table S4).
At the genus level, 72 main genera were detected in at least 20% of the samples. Faecalibacterium
(mean = 11.20%) was the most abundant phylotype across 382 MCR samples ranging from 0 to
42.27%, followed by unclassified Ruminococcaceae (mean = 11.08%, range = 0.06–42.26%), unclassified
Lachnospiraceae (mean = 9.67%, range = 1.17–24.77%), Blautia (mean = 6.85%, range = 0.41–30.64%)
and Prevotella (mean = 6.68%, range = 0–56.80%) (Figure S5). No genus differences were observed
between the obese metabolic health groups (Table S5).

3.5. Gut Microbiota Taxonomy and Metabolic Health Marker Associations
     We next assessed the associations of the gut microbiota with metabolic health markers. At the
phylum level, only Verrucomicrobia negatively correlated with fasting glucose (R2 = 0.021, FDR = 0.009)
(Table S6). At the family level, 6 significant associations were observed between 12 metabolic health
markers and 29 main families (Table S7). For example, Verrucomicrobiaceae was negatively associated
with FPG while positive associations of Clostridiales Incertae Sedis XIII with BMI, WC and fat percent
were observed (Figure 3A). Figure S5 showed the relative abundance distribution at genus level
according to the MetS groups. We found 72 main genera in at least 20% of the samples (supplementary
notes). Of these genera, 12 genera were significantly associated with metabolic health markers (Table S8).
For instance, Akkermansia was negatively correlated with FPG; Blautia, Paraprevotella and Collinsella
were positively associated with HDL-C, HbA1c and triglycerides and Anaerostipes was negatively
correlated with BMI and WC (Figure 3B and Table S8).
Nutrients 2020, 12, 2364 9 of 17
Nutrients 2020, 12, x FOR PEER REVIEW 9 of 18
Figure 3.
Figure 3. Significant
Significant associations
associations between metabolic health
between metabolic health markers
markers and
and taxonomy.
taxonomy. Examples
Examples ofof
linear regression of metabolic health markers at family level (A) and genus level (B). Permutational
linear regression of metabolic health markers at family level (A) and genus level (B). Permutational
multivariate analysis
multivariate analysis adjusted
adjusted for age, sex,
for age, sex, disease
disease status
status (CVD
(CVD andand T2DM),
T2DM), medication
medication use
use (blood
(blood
pressure, cholesterol
pressure, cholesterollowering
loweringandand diabetes
diabetes medication),
medication), lifestyle
lifestyle factors
factors (DASH (DASH
score,score, smoking
smoking status
status
and and alcohol
alcohol consumption).
consumption).
3.6. OTU Co-Occurrence
3.6. OTU Co-Occurrence Network
Network and
and Metabolic
Metabolic Health
Health Marker
Marker Associations
Associations
To
To identify
identify the
the microbial
microbial communities
communities associated
associated with
with MetS,
MetS, we
we clustered
clustered thethe 490
490 main
main OTUs
OTUs
(relative abundance >
(relative abundance 0.1%) into
> 0.1%) into modules (containing >
modules (containing 10 OTUs)
> 10 OTUs) according
according to to the
the co-occurrence
co-occurrence of of
their relative abundance depending on metabolic health phenotype (Figure 4). The
their relative abundance depending on metabolic health phenotype (Figure 4). The associations of associations of each
module with metabolic
each module health markers
with metabolic are shown
health markers areinshown
Figure in4. Gut microbiota
Figure of MHNO individuals
4. Gut microbiota of MHNO
were divided into six modules (Figure 4A). Few significant correlations were
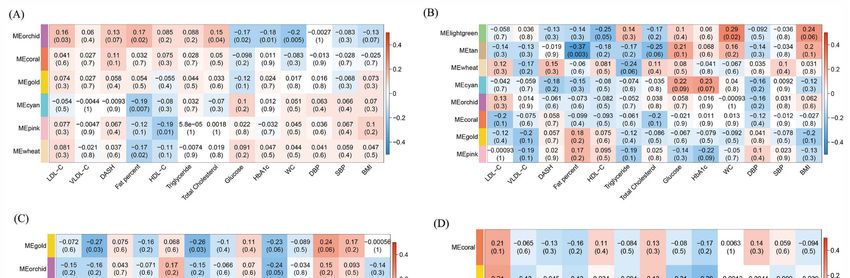
individuals were divided into six modules (Figure 4A). Few significant correlations were found found in the MHNO in
participants. MEorchid which is dominated by Bacteroides
the MHNO participants. The module labeled MEorchid which is dominated by Bacteroides was
The module labeled and Akkermansia and
positively
Akkermansia associated with LDL-C,
was positively fat percent
associated and totalfat
with LDL-C, cholesterol,
percent and andtotal
was negatively
cholesterol,associated
and was
with glucose HbA and WC (Figure 5A). The module MEcyan containing
negatively associated with glucose HbA1c and WC (Figure 5A). The module MEcyan containing
1c Roseburia and MEwheat
containing
Roseburia andFaecalibacterium were negatively
MEwheat containing correlated with
Faecalibacterium fatnegatively
were percent (Figure 5A). Among
correlated the percent
with fat MUNO
individuals,
(Figure 5A). OTUs
Among were
the clustered into eight modules
MUNO individuals, OTUs were (Figure 4B). The
clustered MElightgreen
into eight modules module,
(Figurewhich
4B).
contains less abundant OTUs (relative abundance < 1%) from Ruminococcus
The MElightgreen module, which contains less abundant OTUs (relative abundance < 1%) from and Blautia sp., was
positively
Ruminococcus correlated with WC
and Blautia sp.,counts
was (Figure
positively The Faecalibacterium
5B). correlated with WCdominated module5B).
counts (Figure (MEtan)
The
was also negatively
Faecalibacterium correlated
dominated with fat
module percent
(MEtan) (Figure
was 5B).
also negatively correlated with fat percent (Figure
5B).Nutrients 2020, 12, 2364 10 of 17
Nutrients 2020, 12, x FOR PEER REVIEW 11 of 18
Figure
Figure 4. OTU
4. OTU co-occurrence
co-occurrence network
network according
according to metabolic
to metabolic health
health phenotype.
phenotype. MHNO
MHNO (A),
(A), MUNO
MUNO (B),
(B), MHO (C) and MUO (D). OTUs (nodes) are colored according to WGCNA
MHO (C) and MUO (D). OTUs (nodes) are colored according to WGCNA module colors. Positivemodule colors. Positive
correlations
correlations areare marked
marked byby blueedges
blue edgescorrespond
correspondandand negative
negative correlations
correlationsare
aremarked
markedbybyred edges.
red edges.
Edges
Edges width
width andand lengthare
length arescaled
scaledtotothe
the correlation
correlation coefficient.
coefficient.Any
Anyresulting correlations
resulting correlationswith p
with
value ≥ 0.05 and abs(r) < 0.6 were removed. Circle size indicates the normalized relative
p value ≥ 0.05 and abs(r) < 0.6 were removed. Circle size indicates the normalized relative abundanceabundance
of OTU, and the OTUs with relative abundance > 1% are marked at genus level.
of OTU, and the OTUs with relative abundance > 1% are marked at genus level.
Regarding the obese individuals, the MHO community was divided into six modules (Figure 4C).
The Faecalibacterium and Prevotella dominated module (MEgold) displayed negative correlations
with VLDL-C and triglyceride (Figure 5C). The unclassified Ruminococcaceae, Clostridium XI,
and Akkermansia dominated module (MEcoral) were negatively related to fat percent (Figure 5C).
MEwheat which contains less abundant OTUs from Bifidobacterium and Ruminococcus, was negatively
associated with fat percent, and is positively associated with HbA1c C (Figure 5C). For the MUO
individuals OTUs was clustered into four modules (Figure 4D). Faecalibacterium dominated module
(MEgold) was negatively correlated with HbA1c (Figure 5D). The MElightgreen module which contains
Unclassified Ruminococcaceae, Clostridium XI, and Bifidobacterium, was positively associated with
LDL-C, and was negatively correlated with VLDL-C, triglycerides, FPG and HbA1c (Figure 5D).
Bacteroides dominated module (MEwheat) was negatively associated with WC (Figure 5D).Nutrients 2020, 12, 2364 11 of 17
Nutrients 2020, 12, x FOR PEER REVIEW 12 of 18
Figure 5.
Figure Module–metabolic
5. Module–metabolic health
health markers
markers associations
associations are are shown
shown according
according to metabolic
to metabolic healthhealth phenotype.
phenotype. MHNOMHNO (A), MUNO
(A), MUNO (B),(C)
(B), MHO MHOand (C)
MUO and MUO (D).
(D).
Each cell
Each cellofofthe
thematrix
matrixcontains
containsthe
the coefficient
coefficient between
between oneone
OTUOTU module
module andand a health
a health marker,
marker, andcorresponding
and the the corresponding p value.
p value.Nutrients 2020, 12, 2364 12 of 17
4. Discussion
In this study, we sought to exploit microbiome profile of gut microbiota from a cohort of older
adults, enabling a comprehensive comparison across metabolic health phenotypes among individuals
with and without obesity. Our data indicate that metabolically healthy subjects without obesity
had greater fecal microbiome diversity than their metabolically unhealthy (with MetS) counterparts.
Specific microbes showed associations with metabolic health markers at different taxonomic level.
Groups of co-occurrence microbes according to metabolic health phenotype provided new insights for
microbiota–MetS–obesity relationships. Interestingly, no differences were noted for richness, diversity
or taxonomy between the obese metabolic health phenotypes.
Emerging evidence indicates that the microbiome may play an important role in metabolic
health, although mechanisms are still elusive and controversial [31]. Multiple studies have shown
that alterations in the gut microbiota composition are linked to MetS in association studies [32–34].
Few studies report any relationship between gut microbiota diversity and MetS. We observed reduced
alpha diversity of gut microbiota among older adults with MetS. However, this finding is only observed
in subjects without obesity (MUNO subjects only), suggesting divergent influences of metabolic
health and obesity status. As previously indicated, obesity is a heterogeneous condition and not all
individuals with obesity display MetS features [4]. In addition, strong correlations between obesity
and gut microbiota have been reported [19,35]. Thus, the influence of metabolic health status on
gut microbiota may be more evident in the absence of obesity, whereas among individuals with
obesity for whom many metabolic disturbances may exist, the influence of MetS status may be less
evident. Regarding metabolic health classification, no gold standard metabolic health definition exists.
Most studies focus on presence of MetS using a range of definitions or some of its components; others
additionally include elevated C-reactive protein [36], thus giving rise to disparity in prevalence between
studies. In contrast to our findings, a small study of Mexican women examining healthy (n = 25),
obese (n = 17) and obese plus MetS (n = 25) subjects reported greater microbiota alpha diversity and
richness among both groups of women with obesity relative to the healthy group [37]. Supporting
those findings, a larger German study examining lean non-diabetic (n = 633) and obese individuals
with and without T2DM (n = 153 and n = 494, respectively) revealed that obesity, but not T2DM, was
associated with variation in gut microbiota [37]. Several studies have reported influences of specific
bacterial taxa on metabolic health markers [32,38,39].
Our data show significant associations between gut microbiota and MetS, where a total of
12 unique taxa were significantly associated with 12 metabolic health markers. Decreased abundance of
Akkermansia, Anaerostipes and Phascolarctobacterium was associated with elevated FPG levels, BMI and
WC, and fat percent, respectively. These genera (Akkermansia, Anaerostipes and Phascolarctobacterium)
have been identified as major producers of short chain fatty acids (SCFA) and are inversely related to
fasting glucose level and obesity [40–43]. SCFAs are bioactive by-products of microbial fermentation of
dietary fibers which have a range of metabolic functions relevant to MetS and obesity [37]. Butyrate,
acetate and propionate are the three most abundant SCFAs in the human colon [44].
Our findings also demonstrate increased abundance of genus Blautia correlated with HDL-C
concentrations. This is consistent with a previous study of 1914 Chinese individuals [39]. Blautia
is identified as a butyric acid and acetic acid producer in the gut, which may have the potential to
improve/reduce risk of MetS [45]. In addition, we found that Clostridium IV, Collinsella and Anaerofilum
were positively correlated with serum lipids, such as total cholesterol, LDL-C, triglyceride and VLDL-C
concentrations. Positive associations of anthropometric parameters such as BMI, fat percent and WC
as well as blood pressure were observed with Gemmiger, Parabacteroides, Mogibacterium and Allisonella.
Most of these genera have been reported to be pro-inflammatory bacteria and negatively related to
metabolic health [39,46,47]. We have previously reported more favorable lipoprotein and inflammatory
profiles among metabolically healthy adults regardless of obesity status, highlighting the importance
of metabolic health for all.Nutrients 2020, 12, 2364 13 of 17
The gut microbiota constitutes a complex ecosystem where abundant microbes perform specialized
functions and cohesive interactions as a community. Moreover, complex relationships exist between
gut microbiota and metabolic health markers. Therefore, integrative analysis of the microbiota and
metabolome performed by co-occurrence may provide a better understanding of the functional variation
of community and relationships with metabolic traits occurring in populations [32]. We determined
functional modules of microbial communities based on co-occurrence according to the metabolic health
phenotype. Furthermore, these groups were used to identify associations with traits. The different
functional groups determined in MHNO, MUNO, MHO and MUO confirmed the heterogeneous
condition of the metabolic health obese and non-obese phenotypes. However, OTU co-occurrence
analysis also confirmed generality of the gut microbiota. For instance, the butyrate-producing bacteria
Faecalibacterium dominated group exhibited negative correlations with metabolic health markers
including fat percent, triglycerides and HbA1c . Moreover, the Akkermansia dominated group was
negatively associated with fasting glucose and this genus also showed an inverse association with fasting
glucose, confirming the consistency between different analyses. In addition, OTU co-occurrence-based
associations with metabolic health markers also revealed some new insights into the relationships
between community and traits that were not observed in analysis of single taxonomy-based associations.
For example, the Bifidobacterium dominated group, whose genus was not significantly associated
with metabolic health markers in linear regression analysis, was negatively correlated with VLDL-C,
triglycerides, FPG and HbA1c . This is consistent with a previous study which found that Bifidobacterium
potentially prevented high fat diet-induced diabetes in mice [48].
The current investigation has several strengths including a cohort of well characterized older
adults with evaluable data, permitting a large range of potential confounders to be included in the
analyses, and equal sex representation (50.8% male) who are representative of the source population
reported in the national census data [25]. Limitations of our study should also be considered. Due to
the cross-sectional nature of the study, causation cannot be determined. We explored many potential
associations, increasing the risk of detecting false positives/type 1 errors. To correct for the multiple
testing performed p values were corrected with the Benjamini-Hochberg false-discovery rate in the
multivariate analyses. The findings regarding alpha diversity and co-occurrence analysis were not in
agreement with each other in the obese and non-obese individuals, suggesting limited power to detect
relationships and variations in the complex metabolic intrinsic connections. We did not examine bowel
function or stool consistency, which has recently been linked with microbiome richness [49]. It is also
worth considering obesity classification. BMI does not discriminate between lean and fat mass. It
has been demonstrated that 50% of individuals with obesity may be considered to be metabolically
healthy when classified using dual energy X-ray absorptiometry-derived body fat (the gold standard
measurement) compared to a third by BMI [50]. Interestingly, we have previously demonstrated
that in individuals with MetS, using both fat percentage and BMI to classify obesity may be superior
in identifying cardiometabolic risk factors than BMI alone [51]. Finally, previous population-based
studies had a larger age distribution, whereas our cohort, by virtue of its starting date and recall
nature, involves only older Irish people, which may limit the generalizability of our findings. More
population-based cohort studies are needed to confirm whether there are universal biomarkers of fecal
sample-derived microbiota from subjects with MetS, with and without obesity.
5. Conclusions
In conclusion, our results suggest that specific metabolic health markers and metabolic heath status
are associated with certain gut microbiota whose functions provide biologically plausible explanations
underlying these relationships and metabolic alterations. We report greater microbiome diversity
among the metabolically healthy non-obese individuals relative to their metabolically unhealthy
counterparts. Certain microbes showed associations with metabolic health markers at different
taxonomic levels. Co-occurrence network analysis revealed different patterns among metabolic groups
and individual metabolic health marker correlations with groups of microbes. Our data provide aNutrients 2020, 12, 2364 14 of 17
significant biological resource to confirm previously reported associations between gut microbiota and
MetS and support further studies. The previously reported reduced diversity observed in obesity [12,52]
may have hindered detection of differences between the obese metabolic health phenotypes. Functional
and mechanistic studies are warranted to clarify the interactions between gut microbiota and specific
metabolic phenotypes, to disentangle the specific microbial profiles unique to obesity and metabolic
health status and identify unifying mechanisms. More evidence is required to identify biomarkers
for MetS.
Supplementary Materials: The following are available online at http://www.mdpi.com/2072-6643/12/8/2364/s1.
Figure S1. Principal co-ordinate analysis between MUNO and MHNO groups based on different dissimilarity
distance matrix. Figure S2. Principal co-ordinate analysis between MUO and MHO groups based on different
dissimilarity distance matrix. Figure S3. Gut microbiota composition of MCR cohort at the phylum level. Figure S4.
Gut microbiota composition of MCR cohort at the family level. Figure S5. Gut microbiota composition of MCR
cohort at the genus level. Table S1. Linear regression between MetS risk factors and alpha diversity. Table S2.
Permutational multivariate analysis of variance using Bray-Curtis distance matrices. Table S3. Abundant taxa at
phylum level within metabolic health groups. Table S4. Abundant taxa at family level within metabolic health
groups. Table S5. Abundant taxa at genus level within metabolic health groups. Table S6. Significant results of
linear regression between metabolic health markers and phylum relative abundance. Table S7. Significant results
of linear regression between metabolic health markers and family relative abundance. Table S8. Significant results
of linear regression between metabolic health markers and genus relative abundance.
Author Contributions: X.Z.: Conceptualization, Methodology, Software, Investigation, Visualization, Writing—
original draft. J.M.H.: Methodology, Formal analysis, Software. S.R.M.: Validation, Formal analysis, Data curation,
Software. I.J.P.: Writing—review & editing, Project Administration. P.W.O.: Resources, Conceptualization,
Methodology, Writing—review & editing, Supervision. C.M.P.: Conceptualization, Writing—review & editing,
Supervision. All authors have read and agreed to the published version of the manuscript.
Funding: This work was supported by a research grant from the Irish Health Research Board (reference
HRC/2007/13). Work in PWOT’s laboratory was supported by Science Foundation Ireland through a centre award
to APC Microbiome Ireland. The funders had no role in the study design, data collection and analysis, decision to
publish or preparation of the manuscript.
Conflicts of Interest: The authors declare no conflicts of interest.
References
1. Mottillo, S.; Filion, K.B.; Genest, J.; Joseph, L.; Pilote, L.; Poirier, P.; Rinfret, S.; Schiffrin, E.L.; Eisenberg, M.J.
The Metabolic Syndrome and Cardiovascular Risk. Syst. Rev. Meta Anal. 2010, 56, 1113–1132. [CrossRef]
[PubMed]
2. Gami, A.S.; Witt, B.J.; Howard, D.E.; Erwin, P.J.; Gami, L.A.; Somers, V.K.; Montori, V.M. Metabolic syndrome
and risk of incident cardiovascular events and death: A systematic review and meta-analysis of longitudinal
studies. J. Am. Coll. Cardiol. 2007, 49, 403–414. [CrossRef] [PubMed]
3. Saklayen, M.G. The Global Epidemic of the Metabolic Syndrome. Curr. Hypertens. Rep. 2018, 20, 12.
[CrossRef] [PubMed]
4. Phillips, C.M. Metabolically healthy obesity across the life course: Epidemiology, determinants,
and implications. Ann. N. Y. Acad. Sci. 2017, 1391, 85–100. [CrossRef] [PubMed]
5. Phillips, C.M. Metabolically healthy obesity: Definitions, determinants and clinical implications. Rev. Endocr.
Metab. Disord. 2013, 14, 219–227. [CrossRef] [PubMed]
6. Remely, M.; Hippe, B.; Zanner, J.; Aumueller, E.; Brath, H.; Haslberger, A.G. Gut microbiota of obese,
type 2 diabetic individuals is enriched in Faecalibacterium prausnitzii, Akkermansia muciniphila and
Peptostreptococcus anaerobius after weight loss. Endocr. Metab. Immune Disord. Drug Targets (Former. Curr.
Drug Targets Immune Endocr. Metab. Disord.) 2016, 16, 99–106. [CrossRef]
7. Boulangé, C.L.; Neves, A.L.; Chilloux, J.; Nicholson, J.K.; Dumas, M.-E. Impact of the gut microbiota on
inflammation, obesity, and metabolic disease. Genome Med. 2016, 8, 42. [CrossRef]
8. Qin, J.; Li, Y.; Cai, Z.; Li, S.; Zhu, J.; Zhang, F.; Liang, S.; Zhang, W.; Guan, Y.; Shen, D. A metagenome-wide
association study of gut microbiota in type 2 diabetes. Nature 2012, 490, 55. [CrossRef]
9. Andoh, A.; Nishida, A.; Takahashi, K.; Inatomi, O.; Imaeda, H.; Bamba, S.; Kito, K.; Sugimoto, M.; Kobayashi, T.
Comparison of the gut microbial community between obese and lean peoples using 16S gene sequencing in
a Japanese population. J. Clin. Biochem. Nutr. 2016, 59, 65–70. [CrossRef]Nutrients 2020, 12, 2364 15 of 17
10. Menni, C.; Lin, C.; Cecelja, M.; Mangino, M.; Matey-Hernandez, M.L.; Keehn, L.; Mohney, R.P.; Steves, C.J.;
Spector, T.D.; Kuo, C.-F. Gut microbial diversity is associated with lower arterial stiffness in women. Eur. Heart
J. 2018, 39, 2390–2397. [CrossRef]
11. Armougom, F.; Henry, M.; Vialettes, B.; Raccah, D.; Raoult, D. Monitoring Bacterial Community of Human
Gut Microbiota Reveals an Increase in Lactobacillus in Obese Patients and Methanogens in Anorexic Patients.
PLoS ONE 2009, 4, e7125. [CrossRef] [PubMed]
12. Turnbaugh, P.J.; Hamady, M.; Yatsunenko, T.; Cantarel, B.L.; Duncan, A.; Ley, R.E.; Sogin, M.L.; Jones, W.J.;
Roe, B.A.; Affourtit, J.P. A core gut microbiome in obese and lean twins. Nature 2009, 457, 480. [CrossRef]
[PubMed]
13. Mai, V.; McCrary, Q.M.; Sinha, R.; Glei, M. Associations between dietary habits and body mass index with
gut microbiota composition and fecal water genotoxicity: An observational study in African American and
Caucasian American volunteers. Nutr. J. 2009, 8, 49. [CrossRef] [PubMed]
14. Schwiertz, A.; Taras, D.; Schäfer, K.; Beijer, S.; Bos, N.A.; Donus, C.; Hardt, P.D. Microbiota and SCFA in lean
and overweight healthy subjects. Obesity 2010, 18, 190–195. [CrossRef]
15. Cani, P.D.; Van Hul, M. Novel opportunities for next-generation probiotics targeting metabolic syndrome.
Curr. Opin. Biotechnol. 2015, 32, 21–27. [CrossRef]
16. Delzenne, N.M.; Neyrinck, A.M.; Backhed, F.; Cani, P.D. Targeting gut microbiota in obesity: Effects of
prebiotics and probiotics. Nat. Rev. Endocrinol. 2011, 7, 639–646. [CrossRef]
17. Zhang, Z.; Mocanu, V.; Cai, C.; Dang, J.; Slater, L.; Deehan, E.C.; Walter, J.; Madsen, K.L. Impact of Fecal
Microbiota Transplantation on Obesity and Metabolic Syndrome-A Systematic Review. Nutrients 2019,
11, 2291. [CrossRef]
18. Debedat, J.; Clement, K.; Aron-Wisnewsky, J. Gut Microbiota Dysbiosis in Human Obesity: Impact of
Bariatric Surgery. Curr. Obes. Rep. 2019, 8, 229–242. [CrossRef]
19. Stanislawski, M.A.; Dabelea, D.; Lange, L.A.; Wagner, B.D.; Lozupone, C.A. Gut microbiota phenotypes of
obesity. NPJ Biofilm. Microbiomes 2019, 5, 18. [CrossRef]
20. Hansen, M.E.B.; Rubel, M.A.; Bailey, A.G.; Ranciaro, A.; Thompson, S.R.; Campbell, M.C.; Beggs, W.;
Dave, J.R.; Mokone, G.G.; Mpoloka, S.W.; et al. Population structure of human gut bacteria in a diverse
cohort from rural Tanzania and Botswana. Genome Biol. 2019, 20, 16. [CrossRef]
21. Falony, G.; Joossens, M.; Vieira-Silva, S.; Wang, J.; Darzi, Y.; Faust, K.; Kurilshikov, A.; Bonder, M.J.;
Valles-Colomer, M.; Vandeputte, D.; et al. Population-level analysis of gut microbiome variation. Science
2016, 352, 560. [CrossRef] [PubMed]
22. O’Toole, P.W.; Jeffery, I.B. Gut microbiota and aging. Science 2015, 350, 1214–1215. [CrossRef]
23. Claesson, M.J.; Jeffery, I.B.; Conde, S.; Power, S.E.; O’Connor, E.M.; Cusack, S.; Harris, H.M.; Coakley, M.;
Lakshminarayanan, B.; O’Sullivan, O.; et al. Gut microbiota composition correlates with diet and health in
the elderly. Nature 2012, 488, 178–184. [CrossRef] [PubMed]
24. Jeffery, I.B.; Lynch, D.B.; O’Toole, P.W. Composition and temporal stability of the gut microbiota in older
persons. ISME J. 2016, 10, 170–182. [CrossRef]
25. Kearney, P.M.; Harrington, J.M.; Mc Carthy, V.J.; Fitzgerald, A.P.; Perry, I.J. Cohort profile: The Cork and
Kerry Diabetes and Heart Disease Study. Int. J. Epidemiol. 2013, 42, 1253–1262. [CrossRef] [PubMed]
26. Amagasa, S.; Machida, M.; Fukushima, N.; Kikuchi, H.; Takamiya, T.; Odagiri, Y.; Inoue, S. Is
objectively measured light-intensity physical activity associated with health outcomes after adjustment for
moderate-to-vigorous physical activity in adults? A systematic review. Int. J. Behav. Nutr. Phys. Act. 2018,
15, 65. [CrossRef] [PubMed]
27. Grundy, S.M.; Cleeman, J.I.; Daniels, S.R.; Donato, K.A.; Eckel, R.H.; Franklin, B.A.; Gordon, D.J.; Krauss, R.M.;
Savage, P.J.; Smith, S.C.J.; et al. Diagnosis and Management of the Metabolic Syndrome: An American Heart
Association/National Heart, Lung, and Blood Institute Scientific StatementExecutive Summary. Cardiol. Rev.
2005, 13, 322–326.
28. Phillips, C.M.; Perry, I.J. Depressive symptoms, anxiety and well-being among metabolic health obese
subtypes. Psychoneuroendocrinology 2015, 62, 47–53. [CrossRef]
29. Tran, T.T.T.; Cousin, F.J.; Lynch, D.B.; Menon, R.; Brulc, J.; Brown, J.R.M.; O’Herlihy, E.; Butto, L.F.; Power, K.;
Jeffery, I.B.; et al. Prebiotic supplementation in frail older people affects specific gut microbiota taxa but not
global diversity. Microbiome 2019, 7, 39. [CrossRef]Nutrients 2020, 12, 2364 16 of 17
30. Zhang, B.; Horvath, S. A General Framework for Weighted Gene Co-Expression Network Analysis. Stat. Appl.
Genet. Mol. Biol. 2005, 4, 17. [CrossRef]
31. Dabke, K.; Hendrick, G.; Devkota, S. The gut microbiome and metabolic syndrome. J. Clin. Investig. 2019,
129, 4050–4057. [CrossRef] [PubMed]
32. Org, E.; Blum, Y.; Kasela, S.; Mehrabian, M.; Kuusisto, J.; Kangas, A.J.; Soininen, P.; Wang, Z.; Ala-Korpela, M.;
Hazen, S.L.; et al. Relationships between gut microbiota, plasma metabolites, and metabolic syndrome traits
in the METSIM cohort. Genome Biol. 2017, 18, 70. [CrossRef]
33. Lippert, K.; Kedenko, L.; Antonielli, L.; Kedenko, I.; Gemeier, C.; Leitner, M.; Kautzky-Willer, A.; Paulweber, B.;
Hackl, E. Gut microbiota dysbiosis associated with glucose metabolism disorders and the metabolic syndrome
in older adults. Benef. Microbes 2017, 8, 545–556. [CrossRef]
34. Natividad, J.M.; Agus, A.; Planchais, J.; Lamas, B.; Jarry, A.C.; Martin, R.; Michel, M.-L.; Chong-Nguyen, C.;
Roussel, R.; Straube, M.; et al. Impaired Aryl Hydrocarbon Receptor Ligand Production by the Gut Microbiota
Is a Key Factor in Metabolic Syndrome. Cell Metab. 2018, 28, 737–749. [CrossRef] [PubMed]
35. de la Cuesta-Zuluaga, J.; Corrales-Agudelo, V.; Velásquez-Mejía, E.P.; Carmona, J.A.; Abad, J.M.; Escobar, J.S.
Gut microbiota is associated with obesity and cardiometabolic disease in a population in the midst of
Westernization. Sci. Rep. 2018, 8, 11356. [CrossRef] [PubMed]
36. Phillips, C.M. Metabolically healthy obesity: Personalised and public health implications. Trends Endocrinol.
Metab. 2016, 27, 189–191. [CrossRef]
37. Chávez-Carbajal, A.; Nirmalkar, K.; Pérez-Lizaur, A.; Hernández-Quiroz, F.; Ramírez-del-Alto, S.;
García-Mena, J.; Hernández-Guerrero, C. Gut microbiota and predicted metabolic pathways in a sample of
mexican women affected by obesity and obesity plus metabolic syndrome. Int. J. Mol. Sci. 2019, 20, 438.
[CrossRef]
38. Fu, J.; Bonder, M.J.; Cenit, M.C.; Tigchelaar, E.F.; Maatman, A.; Dekens, J.A.; Brandsma, E.; Marczynska, J.;
Imhann, F.; Weersma, R.K. The gut microbiome contributes to a substantial proportion of the variation in
blood lipids. Circ. Res. 2015, 117, 817–824. [CrossRef]
39. Zeng, Q.; Li, D.; He, Y.; Li, Y.; Yang, Z.; Zhao, X.; Liu, Y.; Wang, Y.; Sun, J.; Feng, X. Discrepant gut microbiota
markers for the classification of obesity-related metabolic abnormalities. Sci. Rep. 2019, 9, 1–10.
40. Dao, M.C.; Everard, A.; Aron-Wisnewsky, J.; Sokolovska, N.; Prifti, E.; Verger, E.O.; Kayser, B.D.; Levenez, F.;
Chilloux, J.; Hoyles, L. Akkermansia muciniphila and improved metabolic health during a dietary intervention
in obesity: Relationship with gut microbiome richness and ecology. Gut 2016, 65, 426–436. [CrossRef]
41. Bui, T.P.N.; de Vos, W.M.; Plugge, C.M. Anaerostipes rhamnosivorans sp. nov. a human intestinal,
butyrate-forming bacterium. Int. J. Syst. Evol. Microbiol. 2014, 64, 787–793. [CrossRef] [PubMed]
42. Chia, L.W.; Hornung, B.V.; Aalvink, S.; Schaap, P.J.; de Vos, W.M.; Knol, J.; Belzer, C. Deciphering the trophic
interaction between Akkermansia muciniphila and the butyrogenic gut commensal Anaerostipes caccae
using a metatranscriptomic approach. Antonie Van Leeuwenhoek 2018, 111, 859–873. [CrossRef] [PubMed]
43. Zhang, X.; Zhao, Y.; Xu, J.; Xue, Z.; Zhang, M.; Pang, X.; Zhang, X.; Zhao, L. Modulation of gut microbiota
by berberine and metformin during the treatment of high-fat diet-induced obesity in rats. Sci. Rep. 2015,
5, 14405. [CrossRef] [PubMed]
44. Canfora, E.E.; Jocken, J.W.; Blaak, E.E. Short-chain fatty acids in control of body weight and insulin sensitivity.
Nat. Rev. Endocrinol. 2015, 11, 577. [CrossRef]
45. Ozato, N.; Saito, S.; Yamaguchi, T.; Katashima, M.; Tokuda, I.; Sawada, K.; Katsuragi, Y.; Kakuta, M.; Imoto, S.;
Ihara, K. Blautia genus associated with visceral fat accumulation in adults 20–76 years of age. NPJ Biofilm.
Microbiomes 2019, 5, 1–9. [CrossRef]
46. Astbury, S.; Atallah, E.; Vijay, A.; Aithal, G.P.; Grove, J.I.; Valdes, A.M. Lower gut microbiome diversity and
higher abundance of proinflammatory genus Collinsella are associated with biopsy-proven nonalcoholic
steatohepatitis. Gut Microbes 2020, 11, 569–580. [CrossRef]
47. Sun, H.; Wang, N.; Cang, Z.; Zhu, C.; Zhao, L.; Nie, X.; Cheng, J.; Xia, F.; Zhai, H.; Lu, Y. Modulation of
Microbiota-Gut-Brain Axis by Berberine Resulting in Improved Metabolic Status in High-Fat Diet-Fed Rats.
Obes. Facts 2016, 9, 365–378. [CrossRef]
48. Cani, P.D.; Neyrinck, A.M.; Fava, F.; Knauf, C.; Burcelin, R.G.; Tuohy, K.M.; Gibson, G.; Delzenne, N.M.
Selective increases of bifidobacteria in gut microflora improve high-fat-diet-induced diabetes in mice through
a mechanism associated with endotoxaemia. Diabetologia 2007, 50, 2374–2383. [CrossRef]Nutrients 2020, 12, 2364 17 of 17
49. Vandeputte, D.; Falony, G.; Vieira-Silva, S.; Tito, R.Y.; Joossens, M.; Raes, J. Stool consistency is strongly
associated with gut microbiota richness and composition, enterotypes and bacterial growth rates. Gut 2016,
65, 57–62. [CrossRef]
50. Shea, J.L.; Randell, E.W.; Sun, G. The prevalence of metabolically healthy obese subjects defined by BMI and
dual-energy X-ray absorptiometry. Obesity 2011, 19, 624–630. [CrossRef]
51. Phillips, C.M.; Tierney, A.C.; Perez-Martinez, P.; Defoort, C.; Blaak, E.E.; Gjelstad, I.M.; Lopez-Miranda, J.;
Kiec-Klimczak, M.; Malczewska-Malec, M.; Drevon, C.A. Obesity and body fat classification in the metabolic
syndrome: Impact on cardiometabolic risk metabotype. Obesity 2013, 21, 154–161. [CrossRef] [PubMed]
52. Le Chatelier, E.; Nielsen, T.; Qin, J.; Prifti, E.; Hildebrand, F.; Falony, G.; Almeida, M.; Arumugam, M.;
Batto, J.-M.; Kennedy, S.; et al. Richness of human gut microbiome correlates with metabolic markers. Nature
2013, 500, 541. [CrossRef] [PubMed]
© 2020 by the authors. Licensee MDPI, Basel, Switzerland. This article is an open access
article distributed under the terms and conditions of the Creative Commons Attribution
(CC BY) license (http://creativecommons.org/licenses/by/4.0/).You can also read