Regional Variation of Cost of Care in the Last 12 Months of Life in Switzerland - boris
←
→
Page content transcription
If your browser does not render page correctly, please read the page content below
ORIGINAL ARTICLE
Regional Variation of Cost of Care in the Last 12 Months of
Life in Switzerland
Small-area Analysis Using Insurance Claims Data
Radoslaw Panczak, PhD,* Xhyljeta Luta, MPH,* Maud Maessen, PhD,* Andreas E. Stuck, MD,w
Claudia Berlin, PhD,* Kurt Schmidlin, DMD, MPH,* Oliver Reich, PhD,z Viktor von Wyl, PhD,y
David C. Goodman, MD, MS,*8 Matthias Egger, MD MSc, FFPH, DTM&H,* Marcel Zwahlen, PhD,*
and Kerri M. Clough-Gorr, DSc, MPH*z
Swiss Francs per person (SD = 33.2k). Cost differed substantially
Background: Health care spending increases sharply at the end of between regions after adjustment for patient age, sex, and cause of
life. Little is known about variation of cost of end of life care death. Variance was reduced by 52%–95% when we added in-
between regions and the drivers of such variation. We studied dividual and regional characteristics, with a strong effect of lan-
small-area patterns of cost of care in the last year of life in guage region. Measures of supply of care did not show associations
Switzerland. with costs. Remaining between and within hospital service area
Methods: We used mandatory health insurance claims data of in- variations were most pronounced for older females and least for
dividuals who died between 2008 and 2010 to derive cost of care. younger individuals.
We used multilevel regression models to estimate differences in Conclusions: In Switzerland, small-area analysis revealed variation
costs across 564 regions of place of residence, nested within 71 of cost of care during the last year of life according to linguistic
source: https://doi.org/10.7892/boris.91446 | downloaded: 7.5.2020
hospital service areas. We examined to what extent variation was regions and unexplained regional differences for older women.
explained by characteristics of individuals and regions, including Cultural factors contribute to the delivery and utilization of health
measures of health care supply. care during the last months of life and should be considered by
Results: The study population consisted of 113,277 individuals. policy makers.
The mean cost of care during last year of life was 32.5k (thousand) Key Words: end of life, health care cost, health insurance, regional
variation, palliative care, Switzerland
From the *Institute of Social and Preventive Medicine, University of Bern;
wDepartment of Geriatrics, Inselspital, Bern University Hospital, and (Med Care 2017;55: 155–163)
University of Bern; zDepartment of Health Sciences, Helsana Insurance
Group; yInstitute for Epidemiology, Biostatistics & Prevention, Uni-
versity of Zurich, Zurich, Switzerland; 8The Dartmouth Institute of
Health Policy & Clinical Practice, Lebanon, NH; and zSection of
Geriatrics, Boston University Medical Center, Boston, MA.
Supported by funds from Swiss National Science Foundation (grant number
T wo factors characterize the Swiss health care system:
high performance and high cost. Health care ex-
penditures (HCE) accounted for 11.4% of the gross domestic
406740_1393333) and by the joint grant of Swiss Medical Association product in 2012.1 Although advances in medicine contribute
(FMH), Konferenz der Kantonalen Ärztegesellschaften (KKA) and to raising health care costs, HCE are unevenly distributed
NewIndex AG.
Preliminary version of findings shown in this manuscript were presented at across the life span and end of life (EOL) is often associated
the 2014 Wennberg International Collaborative meeting in London, UK; with sharp increases in spending on health in an aging
GEOMED 2015 Conference in Florence, Italy; and Swiss Public Health poplation.2,3 A significant proportion of health care costs can
Conference 2015, Geneva, Switzerland. be attributed to the care of EOL patients.4
The authors declare no conflict of interest.
Reprints: Radoslaw Panczak, PhD, Institute of Social and Preventive Med-
Differences in the use of health care between providers
icine (ISPM), University of Bern, Finkenhubelweg 11, Bern CH-3012, and regions have been widely documented.5 However, doc-
Switzerland. E-mail: radoslaw.panczak@ispm.unibe.ch. umenting variation and identifying its causes is a nontrivial
Supplemental Digital Content is available for this article. Direct URL cita- exercise.6 Not all variation is bad or unwarranted and its
tions appear in the printed text and are provided in the HTML and PDF systematic, routine documentation at the local level is the
versions of this article on the journal’s Website, www.lww-medical
care.com. first step in addressing inefficiency of resource allocation and
Copyright r 2016 Wolters Kluwer Health, Inc. All rights reserved. This is overuse or underuse of services.5–8 Variation in intensity and
an open-access article distributed under the terms of the Creative Commons cost of EOL care (EOLC) can be of particular importance in
Attribution-Non Commercial-No Derivatives License 4.0 (CCBY-NC-ND), tracking regional differences in practice patterns.9,10
where it is permissible to download and share the work provided it is
properly cited. The work cannot be changed in any way or used commer-
None of the previous Swiss EOLC studies11–16 has in-
cially without permission from the journal. vestigated small-area variation in costs despite the importance of
ISSN: 0025-7079/17/5502-0155 understanding local practice patterns, identifying unwarranted
Medical Care Volume 55, Number 2, February 2017 www.lww-medicalcare.com | 155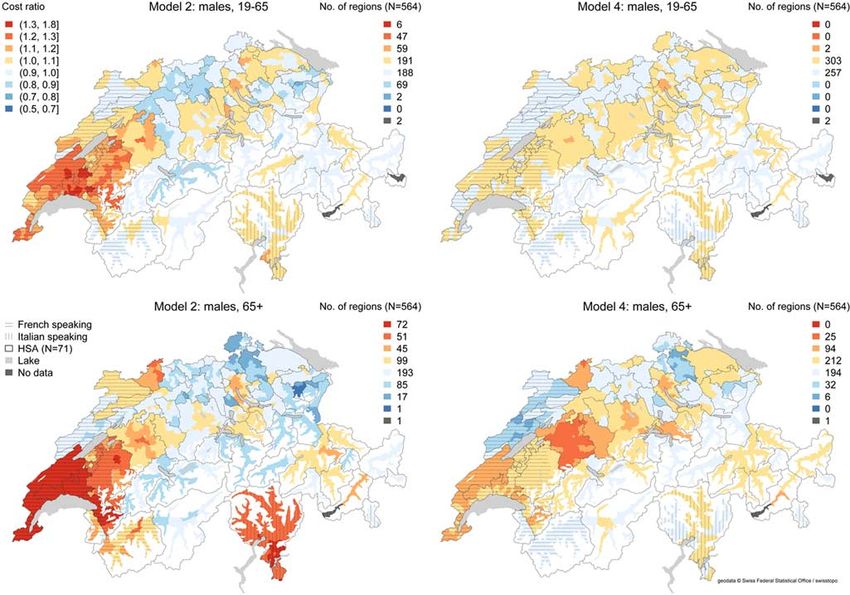
Panczak et al                                                                 Medical Care         Volume 55, Number 2, February 2017

variation, and informing policy makers and clinicians.5,7,9,10,17      approximately 10,000 residents. We further aggregated
Previous work in the United Kingdom and the United States              these into 564 custom regions (hereinafter referred to as
either has not reported small-area variation in EOLC costs,18–20       regions) that best approximated SFSO’s boundaries of Swiss
or has used selected geographical locations19,21 or reported           administrative communities and allowed linkage to other
variation at the level of hospital referral regions.9,10 Such re-      datasets. In total, 71 utilization-based hospital service areas
gions, however, similarly as cantons or language regions that are      (HSA) were created from discharge data of all Swiss hos-
often conveniently used in Swiss health services research, are         pitals in 2010 using methodology described elsewhere22
heterogenous in terms of population size and composition, do           (Fig. 1, SDC, Supplemental Digital Content 1, http://links.
not reflect areas where care is actually delivered and may             lww.com/MLR/B255).
therefore be ill-suited for regional analyses.5,22–24 Furthermore,
analytical approaches used by previous studies have largely            Study Population and Measures
failed to take into account the multilevel nature of data.25                  We aggregated age into 5-year bands. Civil status was
       We studied regional variation in cost of care during the        categorized as single, married, widowed, or divorced; na-
last 12 months of life in Switzerland. We constructed a na-            tionality was recorded as Swiss or foreigner (including
tionally representative dataset of cost of care and modelled           missing values); and religion was recorded as Protestant,
small-area variation in cost. We identified individual and             Catholic, no affiliation, and other/unknown. Primary causes
regional contextual factors and described how they shaped              of death, coded according to the 10th revision of the Inter-
variation in cost. We hypothesized the existence of sig-               national Statistical Classification of Diseases and Related
nificant spatial variation in costs which is largely explained         Health Problems, were aggregated into 16 categories: breast
by individual and regional factors, including measures of              cancer (women only, C50), prostate cancer (men, C61),
health care supply.                                                    colorectal cancer (C18–C21), lung cancer (C33–C34), other
                                                                       cancers (remaining C codes), heart failure27 (I50, I11.0,
                          METHODS                                      I13.0, I13.2, J81), stroke16 (I60–I69), coronary heart dis-
                                                                       ease16 (I20–I25), other cardiovascular diseases (remaining I
Study Design                                                           codes), chronic obstructive pulmonary disease28 (J40–J44,
      This was a retrospective study based on routinely                J47), other respiratory diseases (remaining I codes), de-
collected, Swiss health insurance claims data.                         mentia and Alzheimer’s29 (G30, G31.0, G31.82, G23.1, F00,
                                                                       F01, F02, F03, F05.1), other mental and behavioral disorders
Study Setting
                                                                       (remaining F codes), other diseases of the nervous system
       Switzerland is a small European federal republic of 26
                                                                       (remaining G codes), external causes (V00–V99, W00–W99,
cantons, situated among the Alps, the Swiss Plateau, and the
                                                                       X00–X99, and Y00–Y99), and other.
Jura Mountains. The Swiss health care system is chiefly fi-                   Characteristics of regions of residence included level
nanced by mandatory health insurance (MHI) and out-of-
                                                                       of urbanization (urban, periurban, rural) and language
pocket payments.1 The basic MHI package is compulsory for
                                                                       (German, French, Italian), both deriving from SFSO’s clas-
each Swiss resident and covers all essential benefits deemed
                                                                       sification of communities; and quintiles of median area-
medically and cost-appropriate that are related to illness and
                                                                       based socioeconomic position (Swiss-SEP) index30 (Fig. 1,
pregnancy26 (Text 1, SDC, Supplemental Digital Content 1,
                                                                       SDC, Supplemental Digital Content 1, http://links.lww.com/
http://links.lww.com/MLR/B255).
                                                                       MLR/B255). Ambulatory care supply was measured by
Data Sources                                                           density of physicians per 10,000 inhabitants (regional level);
       We used anonymized MHI claims processed by 6 large              acute care, as number of utilized hospital beds per 10,000
companies that insure approximately 40% of the population              inhabitants (HSA level), and nonacute care as number of
(Table 1, SDC, Supplemental Digital Content 1, http://links.           nursing home beds per 10,000 inhabitants 65 years and older
lww.com/MLR/B255). We included all individuals with MHI                (HSA level; all supply measures in quintiles).
who died during a 3-year period between January 1, 2008 and
December 31, 2010. Information on sex, age, date of birth and          Analyses
death, and place of residence were available. The Swiss Federal               We used all reimbursed claims from the last 12 months
Statistical Office’s (SFSO) database of causes of death was            of life to derive the overall cost of care for each person. We
probabilistically linked to insurance records to derive in-            calculated frequencies and described cost [mean (SD), me-
formation on cause of death, nationality, civil status, and religion   dian, 25th and 75th percentiles] across characteristics and
(Table 2, SDC, Supplemental Digital Content 1, http://link-            regions. We used individual-level data to fit multilevel re-
s.lww.com/MLR/B255). On the basis of SFSO data, we also                gression models; regions of place of residence were nested
assessed representativeness of the study population. Character-        within HSAs and the inverse hyperbolic sine31 transformed
istics of communities, supply of health care together with pop-        cost was the main outcome. In sensitivity analyses we used
ulation denominator were derived from available sources.               the last 3 months of life to derive costs.
                                                                              Guided by previous Swiss EOLC studies,11,12,15,32 we
Analytical Regions                                                     assessed interaction of sex and a binary age indicator
      We used 705 MedStat regions—the smallest delivery                (19–65 y olds vs. those above 65 y) with remaining variables.
unit of health statistics—which SFSO constructs by ag-                 We considered 4 models of increasing complexity: model 1,
gregating postcodes to assure population threshold of                  unadjusted; model 2, adjusted for age and cause of death;

156 | www.lww-medicalcare.com                                          Copyright   r   2016 Wolters Kluwer Health, Inc. All rights reserved.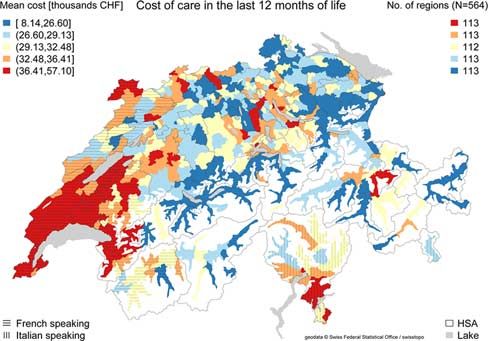
Medical Care        Volume 55, Number 2, February 2017                                              Regional Variation of Cost of Care

model 3, additionally adjusted for civil status, nationality,           with the highest costs, followed by diseases of the nervous
religion, level of urbanization, Swiss-SEP, and 3 supply                system and respiratory diseases. Coronary heart disease,
measures; model 4, additionally adjusted for language                   external causes and, among younger individuals, mental and
region.                                                                 behavioral diseases generated, on average, lower costs. Costs
       To quantify the degree to which individual and re-               tended to be higher among foreigners, married persons, and
gional characteristics accounted for the observed regional              those resident in Latin-speaking parts of Switzerland, and
cost variation, we compared variance estimates of regional              areas of higher SEP. Costs were slightly lower in areas with a
cost variation across a sequence of models. We report the               higher density of nursing home beds and lower density of
percentage of reduction in variance achieved in more com-               hospital beds. Analyses of median cost showed similar trends
plex models in comparison with the simplest model which                 (Table 5, SDC, Supplemental Digital Content 1, http://links.
included neither individual nor region or HSA-specific                  lww.com/MLR/B255).
characteristics. Finally, based on the region-specific and
HSA-specific coefficients we calculated for each region the             Geographical Variation in Costs
ratio by which costs were higher or lower when compared                        There was a 7-fold variation in mean crude costs be-
with the national mean (cost ratios). Data management and               tween regions (Fig. 1). We found evidence of interactions of
analyses were performed in Stata version 14 (StataCorp LP,              sex and age with other variables (Table 6, SDC, Supple-
College Station, TX).                                                   mental Digital Content 1, http://links.lww.com/MLR/B255).
                                                                        We thus used separate models for younger (aged 19–65) and
Ethics                                                                  older (66 and above) men and women. Sequentially includ-
      Ethical approval was obtained from the Ethics Com-                ing more individual and regional characteristics in the
mittee of the Canton of Bern.                                           models gradually reduced cost variance at the HSA level
                                                                        (Fig. 2, SDC, Supplemental Digital Content 1, http://links.
                             RESULTS                                    lww.com/MLR/B255). Model 2, which included only age
                                                                        and cause of death, reduced HSA-level variance by 46% for
Study Population                                                        younger men and 21% for women, with smaller reductions
       The initial dataset consisted of 119,613 individuals.            achieved for older individuals (12% and 4%, respectively).
We excluded 620 (0.5%) individuals below 19 years, 172                  In addition, including further individual and regional char-
(0.1%) individuals who lived abroad, and 364 (0.3%) whose               acteristics and health care supply measures resulted in a
address was missing. The remaining population was proba-                small additional reduction of cost variability at the HSA
bilistically linked to 2008–2010 mortality data with 95.6%              level (model 3). In contrast, also including language region
success rate; 5180 unlinked individuals were similar to the             resulted in a substantial reduction of HSA-level cost varia-
linked ones (Table 2, SDC, Supplemental Digital Content 1,              bility (model 4): compared with model 1 without any in-
http://links.lww.com/MLR/B255) and were excluded. The                   dividual or regional characteristics, HSA-level variance was
study population covered 61.3% of deaths in Switzerland                 decreased by 95% for young males, 87% for females, 73%
between 2008 and 2010. The sex, age, nationality, civil                 for older males, and 51% for females.
status, level of urbanization, language region, Swiss-SEP                      After adjusting for age and cause of death (model 2),
and, most importantly, cause of death distributions were                the highest cost ratios were observed in the western (French-
almost identical to overall mortality in that time period               speaking) parts of the country (regions around cities of
(Table 3, SDC, Supplemental Digital Content 1, http://links.            Lausanne and Geneva), in canton Ticino (Italian-speaking),
lww.com/MLR/B255).                                                      and in the large German-speaking cities (Basel, Bern,
       The final study population consisted of 113,277 in-              Zurich) (Figs. 2, 3, left columns; Fig. 3, SDC, Supplemental
dividuals (Table 1). As expected, women were older at the               Digital Content 1, http://links.lww.com/MLR/B255 shows
time of death and main causes of death were cardiovascular              unadjusted estimates). Higher costs among older individuals
diseases and cancers. Younger individuals were more likely              were also present in parts of cantons Graubünden and Valais.
to die of external causes than older persons. Study partici-            In contrast, costs were lower in the valleys of the Alps and in
pants were mostly Swiss (92%), and either married (39%) or              central and north-western Switzerland. These differences re-
widowed (40%) at the time of death. The distribution across             mained in model 3 when adjusting for individual, regional,
age and sex groups of religious affiliation, level of urban-            and care supply covariates (Fig. 4, SDC, Supplemental Dig-
ization, and neighborhood SEP was similar.                              ital Content 1, http://links.lww.com/MLR/B255) but were
                                                                        attenuated when also adjusting for language region (Figs. 2,
Costs by Individual and Regional Characteristics                        3, right columns). The largest spatial variation remained
      The mean cost of care during the last 12 months of life           among older women and the smallest among young in-
was 32.5k (thousand; SD, 33.2k) Swiss Francs (CHF; 1                    dividuals. Higher costs, mainly among older individuals,
CHF = 0.90 Euro = 1.01 US Dollar, as of May 19, 2016)                   were still present in and around large cities (Basel, Bern,
(Table 4, SDC, Supplemental Digital Content 1, http://links.            Zurich) and in parts of Canton Vaud. A belt of lower costs
lww.com/MLR/B255). For both sexes, spending first tended                stretched, in the north, from the cantons of Neuchatel to the
to increase with age, and then decrease among the oldest age            canton of Thurgau (with the exception of Basel), and in the
groups. Cancer deaths, especially colorectal, breast, and               south along the Alps and the western part of Valais (partic-
prostate cancers among younger individuals, were associated             ularly for older women). Importantly, regional level estimates

Copyright   r   2016 Wolters Kluwer Health, Inc. All rights reserved.                              www.lww-medicalcare.com |      157
Panczak et al Medical Care Volume 55, Number 2, February 2017
TABLE 1. Characteristics of the Study Population
n (%)
Characteristics Males (19–65) Males (65+) Females (19–65) Females (65+) Total
Age group (mean, SD) 53.9 (10.2) 81.4 (8.0) 54.4 (9.8) 85.3 (8.0) 79.0 (13.7)
Cause of death
Breast cancer — — 841 (13) 1747 (3) 2588 (2)
Prostate cancer 156 (1) 2297 (5) — — 2453 (2)
Lung cancer 1165 (10) 2591 (6) 699 (11) 1244 (2) 5699 (5)
Colorectal cancer 363 (3) 1322 (3) 269 (4) 1090 (2) 3044 (3)
Other cancer 2577 (23) 5712 (14) 1656 (25) 5752 (11) 15,697 (14)
Heart failure 81 (1) 1504 (4) 32 (0) 3234 (6) 4851 (4)
Coronary heart disease 1213 (11) 6782 (16) 254 (4) 7518 (14) 15,767 (14)
Stroke 229 (2) 2530 (6) 198 (3) 4298 (8) 7255 (6)
Other cardiovascular diseases 807 (7) 4621 (11) 335 (5) 7337 (14) 13,100 (12)
Chronic obstructive pulmonary disease 180 (2) 1852 (4) 121 (2) 1297 (2) 3450 (3)
Other respiratory diseases 153 (1) 1475 (4) 90 (1) 1866 (3) 3584 (3)
Dementia and Alzheimer’s 32 (0) 926 (2) 46 (1) 2039 (4) 3043 (3)
Other mental and behavioral disorders 293 (3) 2039 (5) 142 (2) 4547 (9) 7021 (6)
Other diseases of the nervous system 285 (3) 1043 (2) 220 (3) 1108 (2) 2656 (2)
External 1976 (18) 1675 (4) 696 (11) 1948 (4) 6295 (6)
Other 1769 (16) 5668 (13) 967 (15) 8370 (16) 16,774 (15)
Nationality
Swiss 9258 (82) 38,523 (92) 5715 (87) 50,704 (95) 104,200 (92)
Foreigner 2021 (18) 3514 (8) 851 (13) 2691 (5) 9077 (8)
Civil status
Single 3183 (28) 3444 (8) 1320 (20) 5792 (11) 13,739 (12)
Married 5899 (52) 25,029 (60) 3444 (52) 9751 (18) 44,123 (39)
Widowed 258 (2) 10,676 (25) 498 (8) 33,802 (63) 45,234 (40)
Divorced 1939 (17) 2888 (7) 1304 (20) 4050 (8) 10,181 (9)
Religion
Protestant 3958 (35) 20,741 (49) 2462 (37) 28,002 (52) 55,163 (49)
Catholic 4047 (36) 14,467 (34) 2345 (36) 18,327 (34) 39,186 (35)
No affiliation 1167 (10) 2178 (5) 632 (10) 1687 (3) 5664 (5)
Other/unknown 2107 (19) 4651 (11) 1127 (17) 5379 (10) 13,264 (12)
Urbanicity
Urban 3534 (31) 12,944 (31) 2095 (32) 18,757 (35) 37,330 (33)
Periurban 4926 (44) 18,327 (44 3017 (46) 22,126 (41) 48,396 (43)
Rural 2819 (25) 10,766 (26) 1454 (22) 12,512 (23) 27,551 (24)
Language region
German 7672 (68) 29,821 (71) 4588 (70) 37,994 (71) 80,075 (71)
French 3084 (27) 10,041 (24) 1722 (26) 12,420 (23) 27,267 (24)
Italian 523 (5) 2175 (5) 256 (4) 2981 (6) 5935 (5)
Swiss-SEP
1st (lowest) 835 (7) 3053 (7) 410 (6) 3477 (7) 7775 (7)
2nd 2455 (22) 9258 (22) 1307 (20) 11,155 (21) 24,175 (21)
3rd quintile 3223 (29) 11,345 (27) 1794 (27) 14,528 (27) 30,890 (27)
4th 3836 (34) 14,070 (33) 2380 (36) 19,150 (36) 39,436 (35)
5th (highest) 930 (8) 4311 (10) 675 (10) 5085 (10) 11,001 (10)
Total 11,279 (100) 42,037 (100) 6566 (100) 53,395 (100) 113,277 (100)
Mean (and SD) of age and frequencies and percentages across sex and age.
See text for the International Statistical Classification of Diseases-10 codes of the causes of death.
Swiss-SEP indicates Swiss neighbourhood index of socioeconomic position (see Panczak et al30 for details).
of cost ratios varied within HSAs with neighboring regional care supply measures had little effect. Sensitivity analyses
estimates of both high and low cost ratios in cantons Bern, based on the last 3 months showed similar results (Table 11,
Geneva, and Zurich. Fig. 5, SDC, Supplemental Digital Content 1, http://links.
The estimates of the covariates changed little between lww.com/MLR/B255).
models 2 and 4 (Tables 7–10, SDC, Supplemental Digital
Content 1, http://links.lww.com/MLR/B255). The fully ad- DISCUSSION
justed model 4 (Fig. 4; Table 10, SDC, Supplemental Digital
Content 1, http://links.lww.com/MLR/B255) showed wide Main Findings
variation of cost across covariates. Adjusting for age, cause Studying geographical variation in cost of care in the
of death had the strongest associations. We found moderate last 12 months of life in Switzerland and assessing associa-
effects of increased cost among individuals from French- tions of costs with individual, regional, and health care
speaking and Italian-speaking parts of Switzerland. Health supply factors, we found cause of death and age of the
158 | www.lww-medicalcare.com Copyright r 2016 Wolters Kluwer Health, Inc. All rights reserved.Medical Care Volume 55, Number 2, February 2017 Regional Variation of Cost of Care
decedent to be the most important determinants at the
individual level. We found that costs varied substantially
between regions and these differences were only partly ex-
plained by confounders. Measures of care supply showed no
associations with costs. When we included language region,
the spatial variation was reduced substantially, but especially
for elderly women, relevant differences between small re-
gions remained.
Strengths
Our study was based on a large and comprehensive
dataset of EOLC. Coverage and representativeness of the
data allowed us to analyze, for the first time, regional var-
iation in the cost of care during the last months of life.
Earlier Swiss studies have used language regions11,16 or
FIGURE 1. Mean cost [in 1000s Swiss Francs (CHF)] of care in cantons12–14 to study regional variation in place of death and
the last 12 months of life among 113,277 individuals across intensity of EOLC. But as this study demonstrated, cantons
564 regions of place of residence, Switzerland 2008–2010. are heterogenous. Unlike other insurance-based studies from
HSA indicates hospital service area. Switzerland,11,13,15 we included cause of death information
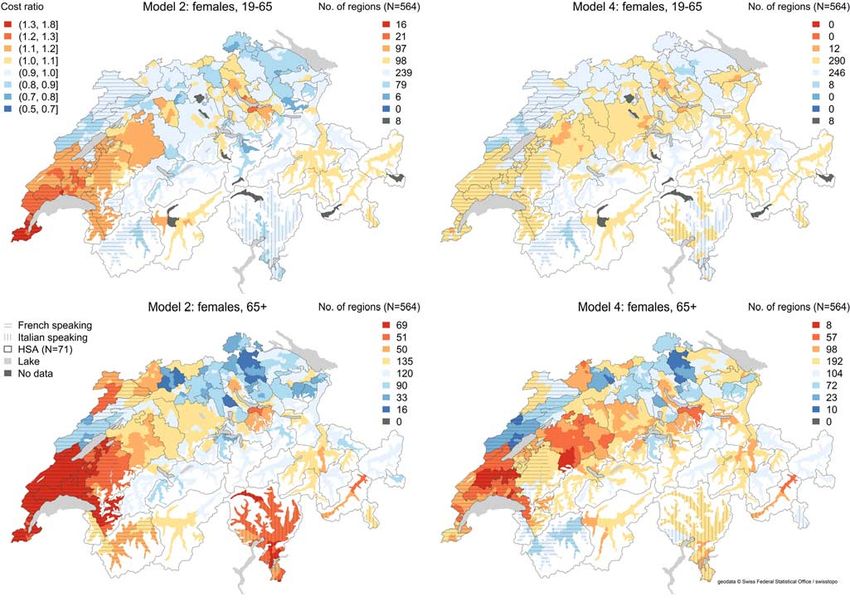
FIGURE 2. Spatial distribution of cost ratios adjusted for age and cause of death (model 2, left column) and fully adjusted (right
column) for males. Regional values derived from exponentiated random effects across 564 regions of place of residence, nested
within 71 hospital service areas (HSAs). Cost ratio represents the ratio by which regional costs are higher or lower when compared
with the national mean; for instance, coefficient of 1.2 indicates 1.2 times (or 20%) higher cost.
Copyright r 2016 Wolters Kluwer Health, Inc. All rights reserved. www.lww-medicalcare.com | 159Panczak et al Medical Care Volume 55, Number 2, February 2017
FIGURE 3. Spatial distribution of cost ratios adjusted for age and cause of death (model 2, left column) and fully adjusted (right
column) for females. Regional values derived from exponentiated random effects across 564 regions of place of residence, nested
within 71 hospital service area (HSAs). Cost ratio represents the ratio by which regional costs are higher or lower when compared
with the national mean; for instance, coefficient of 1.2 indicates 1.2 times (or 20%) higher cost.
and sociodemographic characteristics recorded on the death the Swiss and the American data reinforce the large eco-
certificate. By using MHI claims data, we were able to cover nomic burden EOLC places on the health care system.
the full range of care providers and include costs from am- We found evidence for large geographic variation in
bulatory, inpatient, and nonacute settings. We evaluated in- cost, yet were unable to completely explain its causes.
fluence of supply measures using utilization-based areas, Similarly as in the United States, the cause of death, sex, and
which are better suited for this purpose than administrative age played an important role in determining costs on the
units.7,22,23 individual level,8,20 but these variables did not explain the
substantial spatial variation in costs, particularly among
older females. Nevertheless, the effect of language region
Relation to Other Studies suggests that regional differences in volume and type of care
Our findings of HCE during the last 12 months of life could be factors. We know the differences across Swiss
are comparable with previous Swiss studies. Von Wyl et al15 cantons in overall cost of care,35,36 overall number of hos-
estimated the median cost to be 30.3k CHF for individuals pitalizations,5,37 and intensity of EOLC of cancer pa-
aged 65 and above during the last 12 months of life, whereas tients.12–14 Language region was also associated with
the cost of the last 6 months of life for the general population treatment intensity in ambulatory settings.38 These findings
determined by Reich et al11 was 17.7k CHF. These costs are overlap with ours: costs were higher in many regions of
considerably higher than the mean annual HCE among the French-speaking and Italian-speaking Switzerland. More
general population in Switzerland, which is about 3.5k people died in the hospital than at home or in a nursing home
CHF33; and 6.7k CHF per year for persons aged 65 and in French-speaking and Italian-speaking cantons, and as
above.32 Similar differences between the general and EOL hospital deaths tend to cost more this may be a partial ex-
populations have been reported in the United States.34 Both planation.11,14,16 Doctors’ EOL decisions also vary across
160 | www.lww-medicalcare.com Copyright r 2016 Wolters Kluwer Health, Inc. All rights reserved.Medical Care Volume 55, Number 2, February 2017 Regional Variation of Cost of Care
FIGURE 4. Association of cost of care in the last 12 months of life across selected covariates of model 4 (fully adjusted) across sex
and age strata. Estimates additionally adjusted for age, civil status, nationality, religion, Swiss-SEP30 index, and level of urban-
ization. Exponentiated coefficients of regressing inverse hyperbolic sine31 transformed overall cost of care during the last 12
months of life representing cost ratios across analyzed variables. Cost ratio represents the ratio by which costs in specific category
are higher or lower when compared with the national mean; for instance, coefficient of 1.2 indicates 1.2 times (or 20%) higher
cost. All density of supply measures divided into quintiles of spatial units. CHD indicates coronary heart disease; CVD, car-
diovascular disease; COPD, chronic obstructive pulmonary disease; DNS, diseases of the nervous system; MBD, mental and
behavioral disorders; ref., reference category. See main text for International Statistical Classification of Diseases-10 codes of
the causes of death. See Tables 7–10, Supplemental Digital Content 1, http://links.lww.com/MLR/B255 for exact estimates of
coefficients across all covariates.
cultural regions. Fischer and colleagues demonstrated, for was not associated with cost of care, which resembles pre-
instance, that French-speaking physicians were more likely vious results from Switzerland,40 but not from the United
to manage pain and symptoms aggressively, but were less States.9,10,41,42 Again, these studies used relatively large
willing than their German-speaking colleagues to comply spatial units that could have partly masked regional varia-
with patients’ wishes of minimal or no treatment.39 We tion.7 It is also important to point out that the Swiss health
found no association of costs with urbanization, but after care system can be regarded as a fee-for-service system in
adjustment we found increased EOL costs in and around the which suppliers may respond quickly to meet high demand,
biggest cities. This has been reported earlier using Scottish thus making the effect of supply measures weaker than that
data in which it was suggested that differences in case-mix in studies from other countries. Alternatively, our results
and clinical practice increase cost in large urban centers.18 In may indicate that the mechanisms of supply-induced care do
addition, in Switzerland, deaths at home, which are asso- not operate in EOLC in Switzerland.
ciated with lower cost, are more common in rural areas,
which might explain part of this pattern.11 Implications
Health care supply was not associated with costs and Previous studies tracked variation in EOLC cost in
did not influence geographic variation. Density of physicians Switzerland across place of death11 and across time.15 This
was associated with EOLC intensity in the United States9,10 study adds regional analyses, which can be used to involve
as were intensity and cost of general health care in stakeholders and guide future EOLC studies in Switzerland.
Switzerland in earlier studies.17,35,38 However, these studies Geographical variation in prevailing type of EOLC, the
used data aggregated over large regions7 or lacked adjust- coverage and strength of palliative care institutions, or
ment for individual-level characteristics,8,20 which might family and social support may be important determinants of
have influenced their results. Similarly, hospital bed density cost. High EOLC cost might not only indicate potential
Copyright r 2016 Wolters Kluwer Health, Inc. All rights reserved. www.lww-medicalcare.com | 161Panczak et al Medical Care Volume 55, Number 2, February 2017
waste of resources, but also potential overuse of costly treatments).15 Our sensitivity analyses showed that while
hospital-based services instead of appropriate palliative monetary cost understandably increases when we use cost
care.21 Moreover, past EOLC spending in a region might be corrected for cantonal subsidies of hospital care and differ-
used as an exposure in studies tracking variation in other ences in tariffs for reimbursement of ambulatory care
areas of health care.9 (TARMED),2 the direction and strength of the associations
Supply of care did not seem to play a role; however, were unaffected (Table 12, Fig. 6, SDC, Supplemental Digital
we did identify significant variation that may indicate un- Content 1, http://links.lww.com/MLR/B255).
deruse or overuse of services. But if regions that spend more
offer better quality of care and have higher patient sat- CONCLUSIONS
isfaction, the rest of the country should follow suit. If future MHI claims data show that in Switzerland HCE in the
research finds that this is not the case, then the areas high- last months of life vary strongly across regions, particularly
lighted by our findings should become the focus of regionally among older individuals. The effect of language region
tailored interventions. Finally, regional findings may point to might indicate that the organization of EOLC differs be-
different patient preferences between regions. If meeting tween cultural regions. However, supply of care does not
these preferences, independent of medical needs, is consid- seem to play a major role. In light of the 2012 Swiss-wide
ered a valid social goal,42 then substantial variation in cost of changes to a new inpatient reimbursement system, this study
care in the last months of life in Switzerland will persist. provides a baseline for tracking the effects of these changes
The results of this study align with previous findings on EOLC. Future Swiss and international studies should take
and point to the importance of assessing utilization and into account cultural factors of delivery and utilization of
spending patterns at the local level.7 Large spatial units could health care.
be heterogenous and too crude for planning policies. In ad-
dition, we found that cost of care was associated with lan- ACKNOWLEDGMENTS
guage region; countries with culturally diverse populations The authors are extremely grateful to the insurance
and regions should consider these findings in future studies. companies that were part of the study—CSS, Groupe Mutuel,
Finally, our methodology and findings could contribute to Helsana, Sanitas, SWICA, and Visana. They provided us with the
understanding HCE in countries with similar health care data used in the study and offered helpful comments at the stage
organization and demographics in which the extent of var- of data management. The authors also express their gratitude to
iation has been documented, but the studies of its determi- the Swiss Medical Association (FMH) for providing data on
nants are still scarce. number of Swiss physicians. Original idea, obtaining funding,
and data and exploratory analyses were undertaken by André
Limitations Busato, who deceased on November 12, 2013. The authors thank
Studies based on health insurance claims contain limited Kali Tal and Christopher Ritter for their editorial contributions
patient-level information. Quality or appropriateness of care and Greg Werbin for his helpful comments.
are also difficult to measure from administrative data. We
supplemented this data by linking to other sources, but im-
portant aspects of cost determinants may not be included; for REFERENCES
instance, we could not include measures of illness severity,43 1. Biller-Andorno N, Zeltner T. Individual responsibility and community
patient and family preferences,42,44 functional status,3 presence solidarity—The Swiss Health Care System. N Engl J Med. 2015;373:
2193–2197.
of relative nearby,45 or place of death.16 Second, overall cost is 2. Organisation for Economic Cooperation and Development. OECD
only one possible outcome in analyses of EOLC,43,46,47 so our Reviews of Health Systems: Switzerland, 2011.
ongoing analyses will aim at disaggregating costs across pro- 3. Rosella LC, Fitzpatrick T, Wodchis WP, et al. High-cost health care
viders and exploring alternative measures of intensity of care. users in Ontario, Canada: demographic, socio-economic, and health
status characteristics. BMC Health Serv Res. 2014;14:532.
Third, focusing on the last 12 months of life is an arbitrary
4. Felder S, Meier M, Schmitt H. Health care expenditure in the last
choice and can only be considered a proxy for EOLC, as it months of life. J Health Econ. 2000;19:679–695.
might include unrelated costs.48 However, it is also one of the 5. Organisation for Economic Cooperation and Development. Geographic
most frequently used timeframes and facilitates comparability variations in health care: what do we know and what can be done to
with other studies. A retrospective design efficiently identifies improve health system preformance? OECD Health Policy Studies.
2014.
dying patients so we could construct large representative da- 6. Corallo AN, Croxford R, Goodman DC, et al. A systematic review of
tasets. Our study does not suffer from inaccurate prognosti- medical practice variation in OECD countries. Health Policy. 2014;
cation of survival and incomplete enrolment of patients. 114:5–14.
Langton et al47 describe 2 retrospective and prospective cancer 7. Zhang Y, Baik SH, Fendrick AM, et al. Comparing local and regional
variation in health care spending. N Engl J Med. 2012;367:1724–1731.
EOLC studies with comparable results.49,50 Our sensitivity 8. Zuckerman S, Waidmann T, Berenson R, et al. Clarifying sources of
analyses indicated that shorter timeframe of 3 months provided geographic differences in Medicare spending. N Engl J Med. 2010;363:
similar results. Fourth, relying only on MHI claims could cause 54–62.
us to underestimate overall cost. Our estimates do not include 9. Fisher E, Wennberg D, Stukel T. The implications of regional variations
costs covered by supplementary insurance, claims paid directly in medicare spending. Part 1: the content, quality, and accessibility of
care. Ann Intern Med. 2003;138:273–311.
by patients, or costs not delivered to insurers.11,32 About 50% 10. Fisher E, Wennberg D, Stukel T. The implications of regional variations
of inpatient costs are subsidized by cantons and MHI pays only in spending. Part 2: health outcomes and satisfaction with care. Ann
about 18% of costs of nursing home stays (mainly for medical Intern Med. 2003;138:288–298.
162 | www.lww-medicalcare.com Copyright r 2016 Wolters Kluwer Health, Inc. All rights reserved.Medical Care Volume 55, Number 2, February 2017 Regional Variation of Cost of Care
11. Reich O, Signorell A, Busato A. Place of death and health care 30. Panczak R, Galobardes B, Voorpostel M, et al. A Swiss neighbourhood
utilization for people in the last 6 months of life in Switzerland: index of socioeconomic position: development and association with
a retrospective analysis using administrative data. BMC Health Serv mortality. J Epidemiol Community Health. 2012;66:1129–1136.
Res. 2013;13:116. 31. Burbidge JB, Magee L, Robb AL. Alternative transformations to handle
12. Matter-Walstra KW, Achermann R, Rapold R, et al. Delivery of health extreme values of the dependent variable. J Am Stat Assoc. 1988;83:
care at the end of life in cancer patients of four Swiss cantons: a 123–127.
retrospective database study (SAKK 89/09). BMC Cancer. 2014; 32. Bähler C, Huber CA, Brüngger B, et al. Multimorbidity, health care
14:306. utilization and costs in an elderly community-dwelling population: a
13. Matter-Walstra KW, Achermann R, Rapold R, et al. Cancer-related claims data based observational study. BMC Health Serv Res. 2015;15:
therapies at the end of life in hospitalized cancer patients from four 23.
Swiss cantons: SAKK 89/09. Oncology. 2015;88:18–27. 33. Huber CA, Schneeweiss S, Signorell A, et al. Improved prediction of
14. Matter-Walstra KW, Achermann R, Rapold R, et al. Days spent in acute medical expenditures and health care utilization using an updated
care hospitals at the end of life of cancer patients in four Swiss cantons: chronic disease score and claims data. J Clin Epidemiol. 2013;66:
a retrospective database study (SAKK 89/09). Eur J Cancer Care 1118–1127.
(Engl). 2016. [Epub ahead of print]. 34. Lunney JR, Lynn J, Hogan C. Profiles of older medicare decedents. J
15. von Wyl V, Telser H, Weber A, et al. Cost trajectories from the final life Am Geriatr Soc. 2002;50:1108–1112.
year reveal intensity of end-of-life care and can help to guide palliative 35. Schleiniger R. Health care cost in Switzerland: quantity- or price-
care interventions. BMJ Support Palliat Care. 2015. [Epub ahead of print]. driven? Health Policy. 2014;117:83–89.
16. Hedinger D, Braun J, Zellweger U, et al. Moving to and dying in a 36. Reich O, Weins C, Schusterschitz C, et al. Exploring the disparities of
nursing home depends not only on health—an analysis of socio- regional health care expenditures in Switzerland: some empirical
demographic determinants of place of death in Switzerland. PLoS One. evidence. Eur J Health Econ. 2012;13:193–202.
2014;9:e113236. 37. Pellegrini S, Kohler D, Otto S. Variations géographiques dans les soins
17. Camenzind P. Explaining regional variations in health care utilization de santé. La situation en Suisse [Geographical variations in health care.
between Swiss cantons using panel econometric models. BMC. Health The situation in Switzerland] (Obsan Dossier 42). Neuchâtel; 2014.
Serv Res. 2012;12:62. Available at: http://www.obsan.admin.ch/sites/defaul//files/publications/
18. Geue C, Wu O, Leyland A, et al. Geographic variation of inpatient care 2015/obsan_dossier_42.pdf. Accessed August 12, 2016.
costs at the end of life. Age Ageing. 2016;1(i):1–6. 38. Busato A, Künzi B. Primary care physician supply and other key
19. Guadagnolo BA, Liao K-P, Giordano SH, et al. Variation in intensity determinants of health care utilisation: the case of Switzerland. BMC
and costs of care by payer and race for patients dying of cancer in Texas: Health Serv Res. 2008;8:1–8.
an analysis of registry-linked medicaid, medicare, and dually eligible 39. Fischer S, Bosshard G, Faisst K, et al. Swiss doctors’ attitudes towards
claims data. Med Care. 2015;53:591–598. end-of-life decisions and their determinants: a comparison of three
20. Reschovsky JD, Hadley J, Romano PS. Geographic variation in fee-for- language regions. Swiss Med Wkly. 2006;136:370–376.
service medicare beneficiaries’ medical costs is largely explained by 40. Crivelli L, Filippini M, Mosca I. Federalism and regional health care
disease burden. Med Care Res Rev. 2013;70:542–563. expenditures: an empirical analysis for the Swiss cantons. Health Econ.
21. Kaplan RM. Variation between end-of-life health care costs in Los 2006;15:535–541.
Angeles and San Diego: why are they so different? J Palliat Med. 41. Pritchard RS, Fisher ES, Teno JM, et al. Influence of patient preferences
2011;14:215–220. and local health system characteristics on the place of death. J Am
22. Klauss G, Staub L, Widmer M, et al. Hospital service areas—a new tool Geriatr Soc. 1998;46:1242–1250.
for health care planning in Switzerland. BMC Health Serv Res. 42. Baker L, Bundorf K, Kessler D. Patients’ preferences explain a small
2005;5:33. but significant share of regional variation in medicare spending. Health
23. Goodman DC, Mick SS, Bott D, et al. Primary care service areas: a new Aff. 2014;33:957–963.
tool for the evaluation of primary care services. Health Serv Res. 43. Neuberg GW. The cost of end-of-life care: a new efficiency measure
2003;38(1p1):287–309. falls short of AHA/ACC standards. Circ Cardiovasc Qual Outcomes.
24. Jackson AL, Davies Ca, Leyland AH. Do differences in the 2009;2:127–133.
administrative structure of populations confound comparisons of 44. Kelley AS, Morrison RS, Wenger NS, et al. Determinants of treatment
geographic health inequalities? BMC Med Res Methodol. 2010;10:74. intensity for patients with serious illness: a new conceptual framework.
25. Krumholz HM, Brindis RG, Brush JE, et al. Standards for statistical models J Palliat Med. 2010;13:807–813.
used for public reporting of health outcomes: an American Heart 45. Kelley AS, Ettner SL, Morrison RS, et al. Determinants of medical
Association Scientific Statement from the Quality of Care and Outcomes expenditures in the last 6 months of life. Ann Intern Med. 2011;154:
Research Interdisciplinary Writing Group. Circulation. 2006;113:456–462. 235–242.
26. Thomson S, Busse R, Crivelli L, et al. Statutory health insurance 46. Luta X, Maessen M, Egger M, et al. Measuring intensity of end of life
competition in Europe: a four-country comparison. Health Policy. care: a systematic review. PLoS One. 2015;10:e0123764.
2013;109:209–225. 47. Langton JM, Blanch B, Drew AK, et al. Retrospective studies of end-of-
27. Pivodic L, Pardon K, Morin L, et al. Place of death in the population life resource utilization and costs in cancer care using health
dying from diseases indicative of palliative care need: a cross-national administrative data: a systematic review. Palliat Med. 2014;28:10.
population-level study in 14 countries. J Epidemiol Community Health. 48. Bach PB, Schrag D, Begg CB. Resurrecting treatment histories of dead
2015;70:17–24. patients. A study design that should be laid to rest. JAMA. 2004;
28. López-Campos JL, Ruiz-Ramos M, Soriano JB. Mortality trends in 292:2765–2770.
chronic obstructive pulmonary disease in Europe, 1994-2010: a 49. Setoguchi S, Earle CC, Glynn R, et al. Comparison of prospective and
joinpoint regression analysis. Lancet Respir Med. 2014;2:54–62. retrospective indicators of the quality of end-of-life cancer care. J Clin
29. Teipel S, Fritze T, Ovari A, et al. Regional pattern of dementia and Oncol. 2008;26:5671–5678.
prevalence of hearing impairment in Germany. J Am Geriatr Soc. 2015; 50. Pyenson B, Connor S, Fitch K, et al. Medicare cost in matched hospice
63:1527–1533. and non-hospice cohorts. J Pain Symptom Manage. 2004;28:200–210.
Copyright r 2016 Wolters Kluwer Health, Inc. All rights reserved. www.lww-medicalcare.com | 163You can also read