SMASH - semi-automatic muscle analysis using segmentation of histology: a MATLAB application - Smith and Barton
←
→
Page content transcription
If your browser does not render page correctly, please read the page content below
SMASH – semi-automatic muscle analysis using
segmentation of histology: a MATLAB application
Smith and Barton
                                       Smith and Barton Skeletal Muscle 2014, 4:21
                              http://www.skeletalmusclejournal.com/content/4/1/21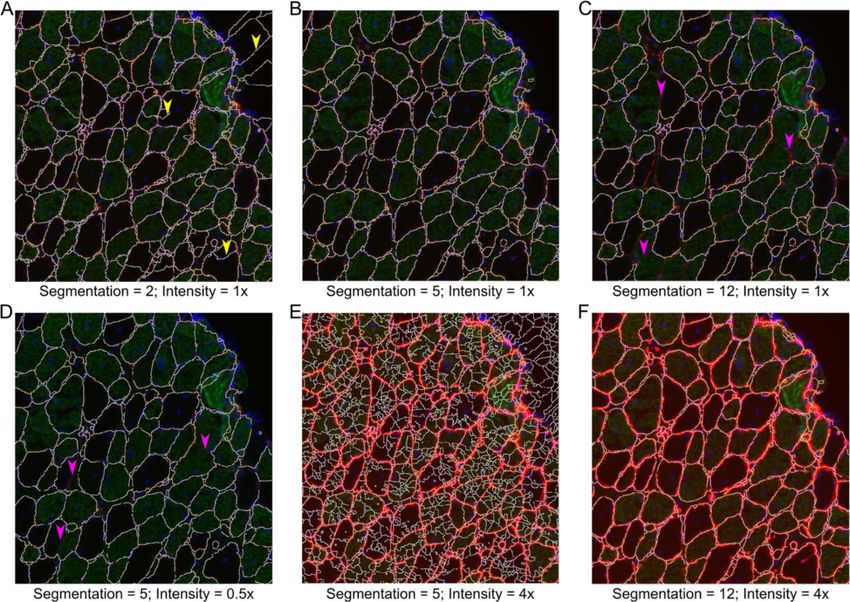
Smith and Barton Skeletal Muscle 2014, 4:21
http://www.skeletalmusclejournal.com/content/4/1/21

 SOFTWARE                                                                                                                                       Open Access

SMASH – semi-automatic muscle analysis using
segmentation of histology: a MATLAB application
Lucas R Smith1,2* and Elisabeth R Barton1,2

  Abstract
  Background: Histological assessment of skeletal muscle tissue is commonly applied to many areas of skeletal
  muscle physiological research. Histological parameters including fiber distribution, fiber type, centrally nucleated
  fibers, and capillary density are all frequently quantified measures of skeletal muscle. These parameters reflect
  functional properties of muscle and undergo adaptation in many muscle diseases and injuries. While standard
  operating procedures have been developed to guide analysis of many of these parameters, the software to freely,
  efficiently, and consistently analyze them is not readily available. In order to provide this service to the muscle
  research community we developed an open source MATLAB script to analyze immunofluorescent muscle sections
  incorporating user controls for muscle histological analysis.
  Results: The software consists of multiple functions designed to provide tools for the analysis selected. Initial
  segmentation and fiber filter functions segment the image and remove non-fiber elements based on user-defined
  parameters to create a fiber mask. Establishing parameters set by the user, the software outputs data on fiber size
  and type, centrally nucleated fibers, and other structures. These functions were evaluated on stained soleus muscle
  sections from 1-year-old wild-type and mdx mice, a model of Duchenne muscular dystrophy. In accordance with
  previously published data, fiber size was not different between groups, but mdx muscles had much higher fiber size
  variability. The mdx muscle had a significantly greater proportion of type I fibers, but type I fibers did not change in
  size relative to type II fibers. Centrally nucleated fibers were highly prevalent in mdx muscle and were significantly
  larger than peripherally nucleated fibers.
  Conclusions: The MATLAB code described and provided along with this manuscript is designed for image processing
  of skeletal muscle immunofluorescent histological sections. The program allows for semi-automated fiber detection
  along with user correction. The output of the code provides data in accordance with established standards of practice.
  The results of the program have been validated using a small set of wild-type and mdx muscle sections. This program
  is the first freely available and open source image processing program designed to automate analysis of skeletal muscle
  histological sections.
  Keywords: Histological muscle analysis, Standardized quantitative analysis, Image segmentation, mdx mouse

Background                                                                             a widely available image processing software package
Skeletal muscle has a robust ability to adapt to the pat-                              specifically designed for muscle histological analysis.
tern of use and to regenerate following injury. These are                                Altering muscle fiber size is one of the primary methods
often quantified using histological techniques. However,                               in which muscle responds to external stimuli. Muscle
the methods for this quantification remain disparate                                   mass may be increased in response to resistance training
among investigators and often require painstaking man-                                 [3] or with potential pharmacological agents like myosta-
ual procedures [1,2]. The goal of this work is to provide                              tin inhibitors [4], while muscle atrophy occurs in response
                                                                                       to disuse [5] and injuries such as denervation [6]. These
* Correspondence: smithlu@dental.upenn.edu                                             conditions primarily reflect hypertrophy or atrophy of
1
 Department of Anatomy and Cell Biology, School of Dental Medicine,                    individual fibers rather than hyper- or hypoplasia [7].
University of Pennsylvania, Philadelphia, PA, USA                                      Muscle fiber size is routinely evaluated using fixed or fro-
2
 Pennsylvania Muscle Institute, University of Pennsylvania, Philadelphia, PA,
USA                                                                                    zen tissue sections. Fiber outlines are visualized using a

                                          © 2014 Smith and Barton; licensee BioMed Central Ltd. This is an Open Access article distributed under the terms of the
                                          Creative Commons Attribution License (http://creativecommons.org/licenses/by/4.0), which permits unrestricted use,
                                          distribution, and reproduction in any medium, provided the original work is properly credited. The Creative Commons Public
                                          Domain Dedication waiver (http://creativecommons.org/publicdomain/zero/1.0/) applies to the data made available in this
                                          article, unless otherwise stated.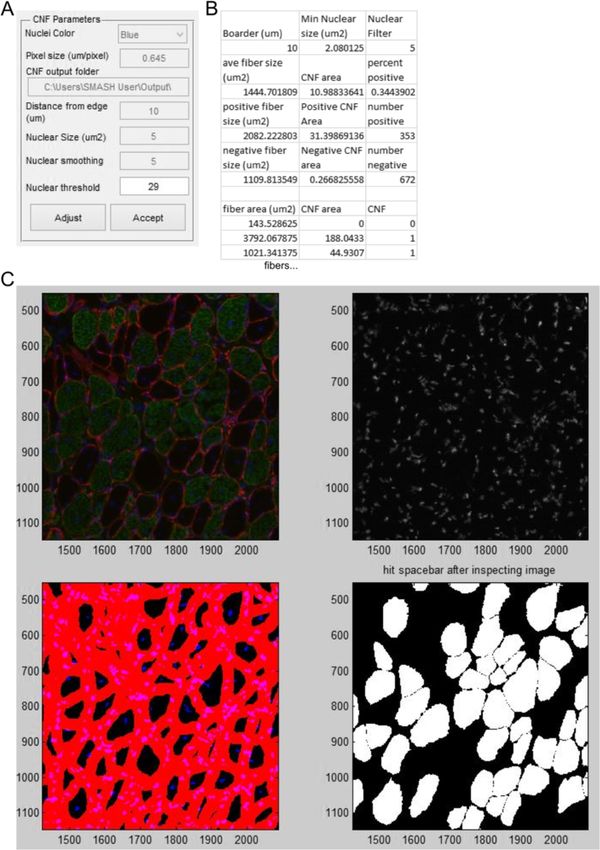
Smith and Barton Skeletal Muscle 2014, 4:21                                                                     Page 2 of 15
http://www.skeletalmusclejournal.com/content/4/1/21

variety of techniques, including hematoxylin and eosin         standard operating procedures developed by TREAT-
staining, laminin immunostaining, dystrophin immuno-           NMD when available using sophisticated boundary de-
staining, and wheat germ aggluttinin staining [8]. While       tection algorithms [2]. The software also includes built-in
these techniques enable visualization of fiber boundaries,     image editing to manually inspect and manipulate fiber
determining fiber cross-sectional area (CSA) is often still    boundaries. Fully automated fiber size determination as
performed by manual tracing of individual fibers. There        well as fiber types and CNFs may be possible with ad-
are software programs available to help automate fiber         equate image acquisition [9,20]. However, these newly
detection, however they are often expensive and are not        designed fully automated programs are not yet available
specifically designed for muscle histology [9].                [9] and/or have a significant cost [20]. Additionally,
   Muscle fiber type distributions are often investigated      allowing the user to have manual control over some as-
in muscle histology as they are known to be altered in         pect of image processing allows users to maintain the
response to exercise, inactivity, and aging [10]. Fiber type   fidelity established by manual techniques. The open na-
is primarily determined by the myosin heavy chain iso-         ture of this software also allows custom usage and fur-
form, which has differential contractile and ATPase ac-        ther advancement of the methods. For users that do not
tivity. Fiber type is often determined by ATPase staining      have access to a MATLAB license or the image process-
[11,12] or with immunostaining for specific myosin             ing toolbox we have compiled an .exe file that runs
heavy chain (MyHC) isoforms individually [13,14]. How-         using the freely available MATLAB Runtime Compiler
ever, methods to determine fiber type can be subjective        (MCR) version 8.3 (http://www.mathworks.com/products/
and tedious when fibers are manually classified. Follow-       compiler/mcr/). Automating a large portion of muscle
ing fiber segmentation, computing the size distribution        histology makes it feasible to analyze full muscle cross-
of single fiber types is easily automated.                     sections, eliminating variability introduced by selecting
   Muscle fibers also undergo changes in morphology as         only a portion of the cross section for analysis. This soft-
they develop. In particular, centrally nucleated fibers are    ware is validated with muscles from mdx mice, which have
often used as a marker for muscle regeneration. While          many alterations of muscle fiber morphology compared to
fully mature fibers have peripheral nuclei, newly regener-     wild-type mice [21]. The purpose of this study is to de-
ated fibers have central nuclei [15]. In many muscular         velop freely available automatic and standardized image
dystrophies, which are characterized by continual cycles       segmentation platform and validate the program using
of degeneration and regeneration, the number of cen-           standard muscle histological analysis.
trally nucleated fibers (CNFs) is substantial while CNFs
are hardly present in healthy muscle. Although nuclei          Implementation
are easily stained with DAPI, determination of CNFs is         Mice
often performed manually. Combined use of automated            All animal experiments were approved by the University
CNF and fiber size determination allows the size of re-        of Pennsylvania Institutional Animal Care and Use Com-
generating fibers to be calculated, providing a measure        mittee. C57Bl/6 mice were used as wild-type controls
of how efficiently regeneration is occurring after acute       and mdx mice were used as a dystrophic model. Both
injury [16].                                                   animal groups were analyzed at 1 year of age.
   Skeletal muscle is a highly metabolically active tissue
requiring large blood supply. As with fiber type shifts,       Immunohistochemistry
capillary density of skeletal muscle may be affected by al-    Soleus muscles from both groups (n = 4 per group) were
tered metabolic demand or in disease [17]. Endothelial         dissected, embedded in OCT, and frozen in liquid nitrogen
cells and capillaries are frequently stained in skeletal       cooled isopentane. Frozen 10 um sections were cut from
muscle with Von Willibrand Factor or PECAM [18,19].            muscles and mounted on slides. Sections were washed in
Automated determination of capillary density in relation       PBS and immunostained using antibodies to laminin
to fiber size and number provides a useful parameter of        (Thermo Scientific), and either myosin heavy chain I (Devel-
skeletal muscle histology.                                     opmental Studies Hybridoma Bank) or platelet endothelial
   All of the methods discussed above are commonly per-        cell adhesion molecule (PECAM; eBiosciences) overnight
formed using immunofluorescence, which provides high           at 4°C. After PBS wash, fluorescent secondary antibodies
contrast in stained and unstained structures. We have          (Sigma) were applied for 1 h at room temperature. Nuclei
developed MATLAB (MATLAB and Image Processing                  were labeled with DAPI incorporated into the mounting
Toolbox 2014a, MathWorks) scripts bundled into a               media (Vectashield). Images were acquired using a Leica
MATLAB App (see Availability and Requirements) that            DM RBE microscope and DFC350FX camera and Open-
automate, or partially automate determination of fiber         Lab software. Individual fields were stitched together to
size, fiber type, centrally nucleated fibers, and capillary    create a composite full view of the muscle cross-section
density. These programs are created to comply with             using Photoshop (Adobe).
Smith and Barton Skeletal Muscle 2014, 4:21 Page 3 of 15
http://www.skeletalmusclejournal.com/content/4/1/21
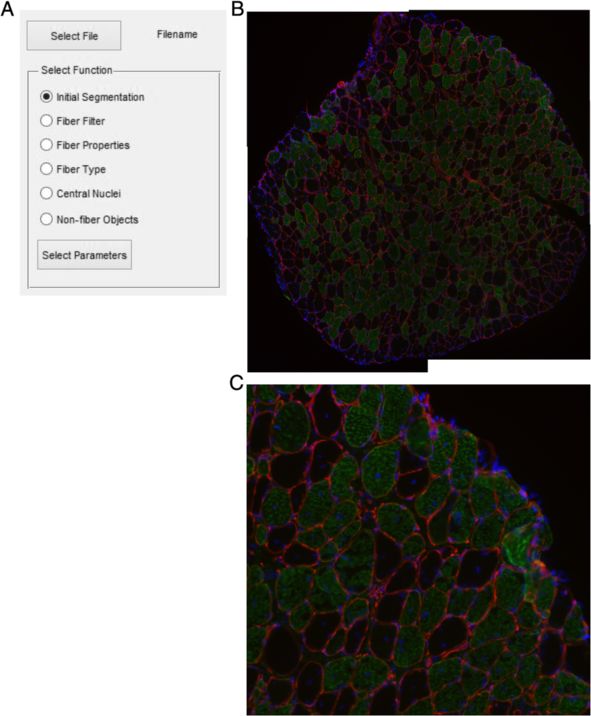
Image selection function. The Initial Segmentation function uses the water-
The software has built in several steps of image processing shed transformation to determine the fiber edges, as it has
tools within the same script. Initially the user must select become one of the most common and standard choices for
an image file (.bmp, .jpg, .png, and .tif.) to be processed. Fol- image segmentation [22,23]. However, the watershed trans-
lowing selection of the appropriate file the user is provided formation often leads to over-segmentation due to local
a list of the built in functions (Figure 1A). A representative minima created from noise within an image [24]. Prior to
image of a soleus muscle from a 1-year-old mdx mouse is applying the watershed transformation, the image is
used which has been immunostained with laminin (red) smoothed with a function that suppresses local minima
and slow myosin heavy chain (green) as well as DAPI (blue) whose depth is below a given threshold. Upon selecting
(Figure 1B and C). Dystrophic muscle can be more difficult this function users are presented with options for segmen-
to process automatically due greater interstitial spaces and tation (Figure 2A). The pixel size measured in μm/pixel is
the examples highlight some manual adjustments that may requested in all functions. The segmentation takes place
be required. The software includes an Excel (Microsoft) file based on a single RGB color channel, which the user pro-
containing default parameter values (Table 1), which may vides designating the color of the fiber outlines. The user
be altered to the needs of the user. The details of each par- also provides an initial value for suppressing local minima
ameter are discussed in the relevant section below. based on 8-bit channel images (0 to 255). Previous experi-
ence shows that a segmentation value of 4 to 10 produces
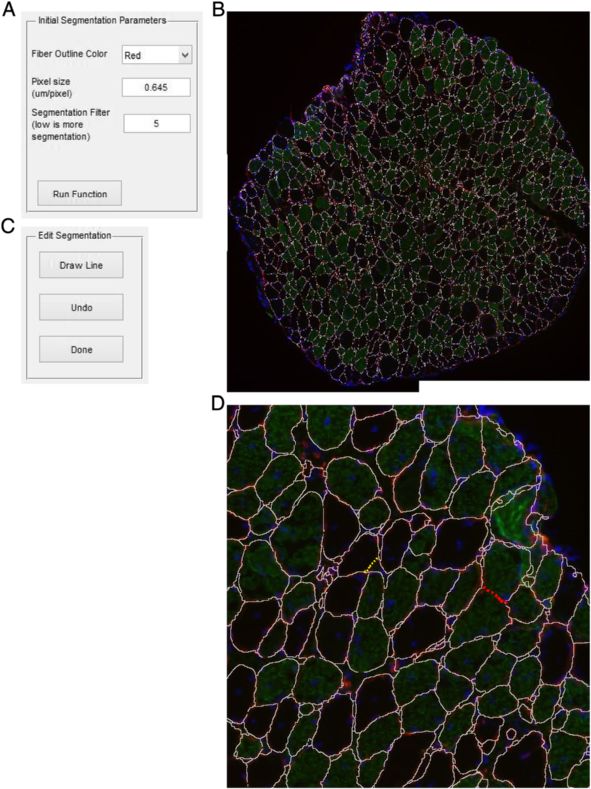
Initial segmentation robust fiber identification, depending on the quality of
Prior to any other function being run, a mask file for staining (Figure 3). However, the segmentation value may
the image must be created with the ‘Initial Segmentation’ need to be adjusted based on the image quality and
Figure 1 Image selection. (A) Dialog box allowing selection of a single function to perform on the selected muscle section. (B) Example muscle
section of 1-year-old soleus muscle from mdx mouse. Red is laminin stain, green is slow muscle myosin heavy chain, and blue is DAPI. (C) Enlarged
portion of (B).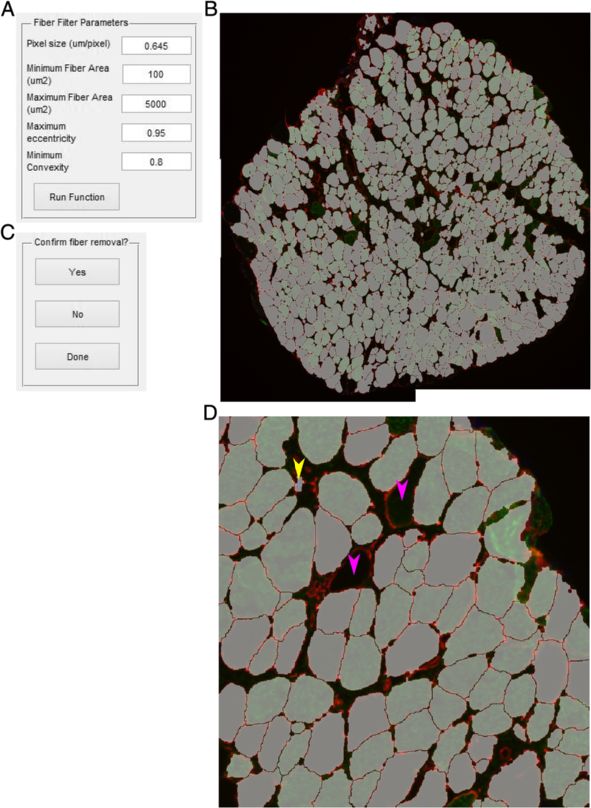
Smith and Barton Skeletal Muscle 2014, 4:21 Page 4 of 15
http://www.skeletalmusclejournal.com/content/4/1/21
Table 1 Default parameters from Excel file convexity. Interstitial space may fit the size requirements
Default parameters Default values of a fiber; however, it will not have a grossly circular shape
Pixel size (μm/pixel) 0.645 in cross section. The eccentricity takes an ellipse with the
Fiber outline channel (red = 1, green = 2, blue = 3) 1
same second moments as the objects and is the ratio be-
tween the distance between the foci of the ellipse and the
Nuclei channel (red = 1, green = 2, blue = 3) 3
major axis. Thus, circles have an eccentricity of 0 and line
Fiber type channel (red = 1, green = 2, blue = 3) 2 segments have an eccentricity of 1. Further, interstitial
Object channel (red = 1, green = 2, blue = 3) 2 space may have a stellate shape between fibers while main-
Segmentation smoothing factor 5 taining high eccentricity. The stellate shape creates regions
Nuclear smoothing factor 5 of concavity, while polygonal fibers have minimal concav-
Object smoothing factor 10
ity and high convexity. The convexity is determined by the
ratio of the object area and the smallest convex polygon
Minimum fiber area (μm2) 100
that can contain the entire region. Thus, a completely con-
Maximum fiber area (μm2) 5,000 vex image will have a convexity of 1. After the filtering pa-
Maximum eccentricity 0.95 rameters have been selected, a new mask is created with
Minimum convexity 0.8 only the objects passing the filter (Figure 4B) [25]. At this
Nuclear distance from boarder (μm) 10 point the user has the option to inspect the mask and se-
Minimum nuclear size (μm2) 5
lect any objects that may have passed the filter but are not
fibers (Figure 4C). This may include areas of interstitial
Fiber properties output folder C:\SMASH\Output
space, vessels, or other structures the user does not want
Fiber type output folder C:\SMASH\Output to include (Figure 4D, yellow arrow). The zoomed ex-
Central nuclei output folder C:\ SMASH\Output ample image shows fibers that were filtered because of
Objects output folder C:\ SMASH\Output high eccentricity and high convexity due to improper sep-
aration of fiber from interstitial space (Figure 4D, pink
exposure (Figure 3). For example, a suboptimal segmenta- arrows). Following user removal of non-fiber objects the
tion can generate false objects (Figure 3A, E) or merge ob- mask file is overwritten.
jects (Figure 3C, E). Once initial parameters have been
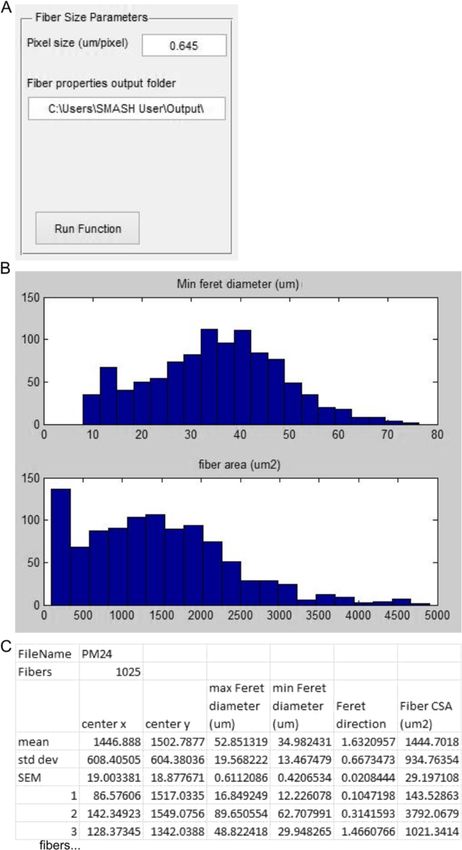
selected, the initial segmentation takes place with the Fiber properties
segmented fiber edges overlaid on the original image After the mask has been filtered to contain only objects
(Figure 2B) [25]. After inspecting the image the user can that are fibers the properties of the fibers may be deter-
decide to re-run the function with alternative parameters. mined. The user is prompted for pixel size and the
Once proper segmentation has been achieved, the user has folder location that the output data should be exported
the option to separate any merged fibers that may have to. The output file is in Excel (.xls) format with the same
arisen from poor staining. The user implements a freehand name as the image file appended by ‘_Props’ (Figure 5A).
drawing tool to separate any fibers that are merged with The Feret diameter properties are obtained from an
other fibers (red dotted line) or interstitial space (yellow incorporated publically available script on MATLAB
dotted line) (Figure 2C). After the user has finished separ- Central [26]. The function displays histograms for fiber
ating any fibers a mask file is saved. Initial segmentation minimal Feret diameter and fiber CSA for inspection
will often produce many small segments in interstitial (Figure 5B). The Feret properties are defined by the
space; however, non-fiber areas will be filtered in the ‘Fiber smallest rectangle that bounds the fiber [27]. The mini-
Filter’ function. All fibers in the mask should be separated mum Feret diameter has been shown to be a more ro-
prior to running the fiber filter function to prevent in- bust measure of fiber size. Feret diameter is much less
appropriate filtering of fibers. sensitive to oblique muscle section compared to fiber
CSA [2]. For each fiber the properties exported are: cen-
Fiber filter troid in x and y in pixels, the maximum Feret diameter
Following the initial segmentation the fiber filter function (μm), minimum Feret diameter (μm), Feret direction (ra-
removes objects based on user-defined criteria (Figure 4A). dians), and fiber area (μm2). The output Excel file is then
Fibers that touch the edge of the image are removed so written with all fiber properties as well as the mean,
partial fibers are not included in further calculations. To standard deviation (SD), and standard error of the mean
provide the proper scale, the pixel size is entered by the (SEM) for each property (Figure 5C).
user in μm/pixel. Any fibers below the minimum fiber
area or above the maximum fiber area entered in μm2 are Fiber typing
removed from the mask and from further analysis. More The fiber typing function uses the fiber mask to inspect
advanced filtering is also included with eccentricity and each fiber area for determination of fiber staining. The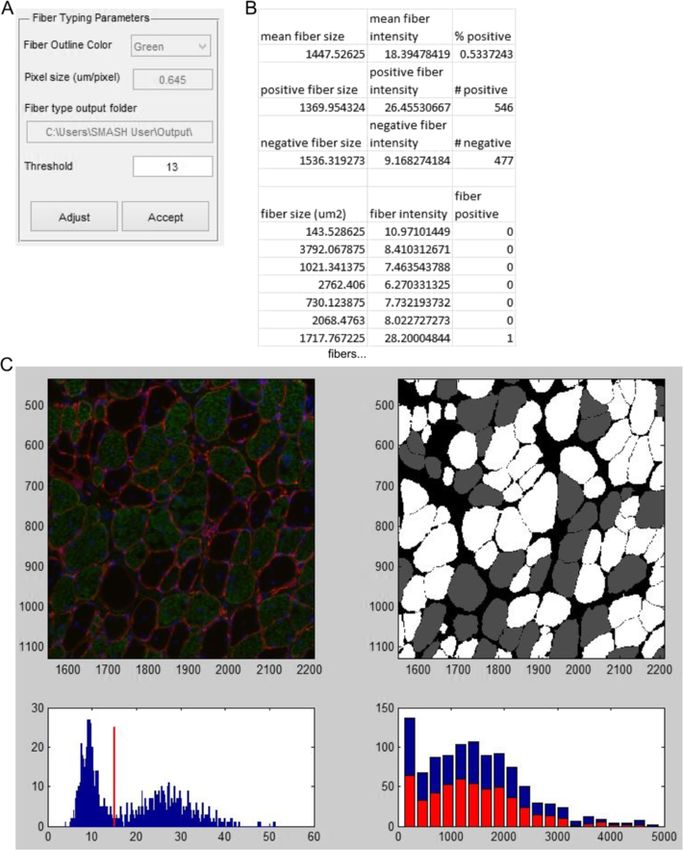
Smith and Barton Skeletal Muscle 2014, 4:21                                                                                         Page 5 of 15
http://www.skeletalmusclejournal.com/content/4/1/21

 Figure 2 Initial segmentation. (A) Input box with options for fiber segmentation. (B) The example image with white lines drawn along fiber
 boarders based on segmentation parameters. (C) Dialog box that appears after separating a fiber. (D) Zoomed in of B. Red dotted lines shows
 where two fibers are separated by the user. Yellow dotted lines shows where a fiber is not separated from intestinal space.

function examines the average intensity of staining within                positively stained fibers. Intermediate values may represent
the individual fiber region determined by the mask to cal-                mixed fibers. A histogram with the CSA of positive fibers
culate an average intensity. A threshold value is used to de-             (red, front) and all fibers (blue, back) is presented to exam-
termine if the fiber is positive or negative based on the                 ine any fiber type-dependent size changes. After inspecting
average intensity. The user inputs the pixel size, the RGB                the figure the user is able to adjust the threshold value and
channel which includes fiber type staining, and the output                the figure is updated. Once the user is satisfied with the
folder location (Figure 6A). The initial threshold value for              analysis they select accept and are prompted to create an
average fiber type intensity is obtained using Otsu’s                     Excel file with each fiber’s average intensity, fiber area, and
method, which calculates the threshold to minimize intra-                 if it is classified as positive (1) or negative (0) (Figure 6B).
class variance of the thresholded binary image [28]. The                  Summary data including average fiber area, average fiber
program then performs an initial calculation of fiber types.              intensity and percent of positive fibers are included for all,
A figure is displayed with the original image and an image                positive, and negative fibers.
where positive fibers are white and negative fibers are grey
(Figure 6D). The figure includes a histogram of staining in-              Centrally nucleated fibers
tensities along with the threshold. The intensity histogram               The CNF function again requires prior creation of a fiber
should have two peaks, with the lower and sharper peak                    mask to analyze the centers of fibers for nuclei. The user
being negative fibers and high intensity peak representing                is prompted to input pixel size as well as the RGB channel
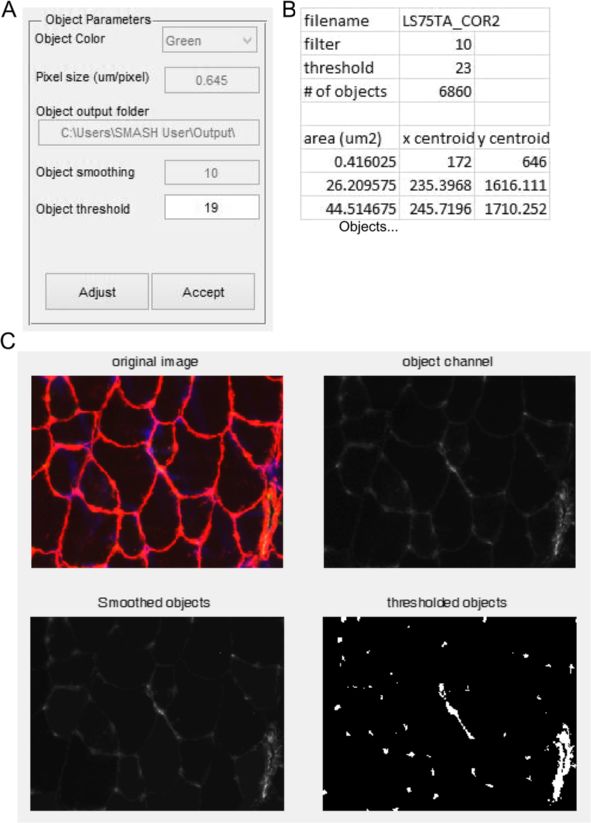
Smith and Barton Skeletal Muscle 2014, 4:21                                                                                               Page 6 of 15
http://www.skeletalmusclejournal.com/content/4/1/21

 Figure 3 Segmentation examples. Example muscle section of 1-year-old soleus muscle from mdx mouse. Red is laminin stain, green is slow muscle
 myosin heavy chain, and blue is DAPI. (A) Segmentation filter value of 2 produces over segmentation of original image. (B) Segmentation filter value
 of 5 produces appropriate segmentation. (C) Segmentation filter value of 12 produces under segmentation of original image. (D) Reducing the
 brightness of laminin staining by 50% (representing poor staining) produces under segmentation. (E) Enhancing the brightness of laminin by
 400% (representing over exposure) produces over segmentation. (F) Overexposure can be compensated for by increasing the segmentation
 filter value to 12. Yellow arrow heads show areas of over segmentation. Pink arrow heads show areas of under segmentation.

that corresponds to nuclear staining (Figure 7A). To re-                     inspecting the image the user may adjust the threshold
strict the inspection to central nuclei the nuclear staining                 value as desired. Mousing over smoothed nuclear image
must be greater than a user-defined distance from the                        may provide useful information for manual threshold-
border of the fiber input in μm. The user is also allowed                    ing. Once a proper threshold is determined, the user is
to specify the minimum area of nuclei to count so that                       prompted if to determine if the results should be output to
random staining is minimized. To minimize the effect of                      Excel. If the answer is yes, a file is created that contains the
streaking that can be present with poor DAPI staining the                    fiber area, the area of positive nuclei staining in the center
image can be smoothed using the same suppression of                          region, and if the fiber is classified as a CNF (1) or not (0)
local minima used for fiber segmentation. An automatic                       (Figure 7B). Summary data include the average fiber area,
threshold is applied after nuclei smoothing using Otsu’s                     area of central nuclei, and percent of CNFs for all fibers,
method. Finally, the user also specifies the output folder                   CNFs, and non-CNFs. If parameter selection was not suffi-
for the Excel data to be written to. After input selection a                 cient, the function can be rerun with new parameters.
figure is displayed that contains the original image and an
image with the borders. The distance not inspected is in                     Capillary density or non-fiber objects
red and the nuclei are in blue, with peripheral nuclei                       It is often useful to identify objects within muscle sections
appearing purple (Figure 7C, bottom left). The figure also                   that are not within fibers. The object counter was designed
contains images of only the smoothed nuclear image                           to identify capillary density using a PECAM staining to
and an image with only CNFs. In some situations the                          identify endothelial cells, however other cell types could be
automatic thresholding of nuclei may be unsuitable. After                    analyzed with the same techniques, such as macrophage
Smith and Barton Skeletal Muscle 2014, 4:21                                                                                                 Page 7 of 15
http://www.skeletalmusclejournal.com/content/4/1/21

 Figure 4 Fiber filter. (A) Input box with options for filtering fibers. (B) Image generated in which fibers passing the filter are randomly colored
 to more easily distinguish adjacent fibers. (C) Zoomed in of (B). Yellow arrows point to possible user selections as non-fiber objects. Pink arrows
 show fibers that did not pass the filter. Lower left pink arrow did not pass due to improper segmentation as depicted in Figure 2D. (D) After selection
 of fibers the user is asked if they would like to indeed delete them or complete the function operation.

infiltration [29]. The user is prompted for pixel size and the                SMASH data verification
RGB channel of the objects to be identified (Figure 8A). Ini-                 To verify the data generated by SMASH we compared
tial values for smoothing the objects, identical to that for                  the same images used in previously published data [30].
nuclei and fiber type, with initial threshold automatically                   In this case legacy methods were done using Openlab
generated using Otsu’s method. The user also identifies the                   software (Improvision, PerkinElmer) with simple thresh-
folder location of the Excel file output. After initial parame-               olding of individual RGB channels for fiber size and fiber
ters are selected a figure is presented with a figure contain-                type. For central nucleation fibers were manually deter-
ing the original image, the object channel image, smoothed                    mined to be CNF or PNF and a marker placed using
object channel image, and thresholded object image                            Openlab to enable counting.
(Figure 8C). After inspection, the user is then prompted to
change the threshold if desired. Once the user has achieved                   Statistical analysis
a suitable threshold the user selects whether to output an                    The C57 and mdx output data were compared using a
Excel file with the data. Each object has its area and cen-                   Student’s t-test. For comparing CNFs and PNFs a paired
troid listed along with summary data including the total                      Student’s t-test was used. All data analyses were per-
number of objects in the image.                                               formed using PRISM (Graphpad Software).
Smith and Barton Skeletal Muscle 2014, 4:21                                                                                        Page 8 of 15
http://www.skeletalmusclejournal.com/content/4/1/21

 Figure 5 Fiber properties. (A) Input box with options for fiber properties. (B) Histograms showing minimum Feret diameter (top) and fiber CSA
 (bottom). (C) Truncated example of Excel output from running fiber properties function.

Results                                                                  multitude of previous reports demonstrate that mean indi-
In order to evaluate the suitability of the software described,          vidual fiber cross-sectional area in mdx muscle is not
skeletal muscle morphologies from a selection of wild-type               consistently altered. However, as the mdx muscle is under-
C57BL6 and mdx mouse soleus muscles were analyzed                        going continual cycles of degeneration and regeneration the
(n = 4 per group). The mdx mouse is a model of Duchenne                  variability in fiber CSA is much greater than wild-type
muscular dystrophy (DMD) that is commonly studied. A                     muscle [2,31]. The results produced here clearly reflect the
Smith and Barton Skeletal Muscle 2014, 4:21                                                                                             Page 9 of 15
http://www.skeletalmusclejournal.com/content/4/1/21

 Figure 6 Fiber type. (A) Input box with options for fiber type function. (B) Truncated example of Excel output from running fiber type function.
 (C) Portion of immunofluorescent image. Red is laminin stain, green is slow muscle myosin heavy chain, and blue is DAPI (top left). Image
 showing negative fibers in gray and positive fibers in white (top right). Histogram of average fiber intensity for fiber type stain with threshold
 value (bottom left). Histogram of fiber CSA with positive fiber in red and all fibers in blue (bottom right).

previous literature on mean CSA and variability of CSA                      increase in the standard deviation of Feret diameter within
(Figure 9A and B). The mean fiber CSA was not different                     an mdx muscle (Figure 9C and D).
between the C57 and mdx muscles; however the standard                          Fiber type determination is commonly performed in
deviation (SD) of CSA within a muscle was much greater                      muscle histological analysis. The muscles studied here
in mdx than C57. While measurements of fiber CSA have                       have been stained for slow myosin heavy chain (Type I).
commonly been used, the fiber CSA is highly dependent on                    The soleus muscle has a large portion of type I fibers of
the angle of the section relative to the axis of the fiber. Use             approximately 40% in wild-type mice [32]. This proportion
of minimal Feret diameter provides a robust measure of                      is close to the value obtained with the software (Figure 9E),
fiber size largely independent of the angle of the section                  however there was a large increase in the percentage of
and is endorsed as a standard operating procedure [2]. Our                  slow fibers in the mdx soleus muscle. This is expected
results on Feret diameter align well with that of CSA show-                 based on the advanced age of these mice of 1 year and that
ing no change in the mean Feret diameter, but a substantial                 type I fibers are more resistant to damage in mdx muscle
Smith and Barton Skeletal Muscle 2014, 4:21                                                                                          Page 10 of 15
http://www.skeletalmusclejournal.com/content/4/1/21

 Figure 7 Centrally nucleated fibers. (A) Input box with options for CNF function. (B) Truncated example of Excel output from running CNF
 function. (C) Portion of immunofluorescent image. Red is laminin stain, green is slow muscle myosin heavy chain, and blue is DAPI (top left).
 Image showing filtered nuclei (top right). Image with boarder regions in red and nuclei above threshold in blue (bottom left). Image in which
 only CNFs are depicted in white (bottom right).

[33]. Determination of the size of various fiber types is an               CNFs. The percentage of CNFs in dystrophic muscle is a
automatic feature of the software. Assuming all unlabeled                  commonly measured histological marker of disease [34].
fibers are type II fibers the results show that C57 type I fi-             The automatic detection demonstrated the expected re-
bers are smaller than type II and the relationship is not                  sults with C57 soleus muscle showing very rare CNFs
different in mdx soleus muscles (Figure 9F).                               while >30% of mdx soleus muscle fibers were CNFs
   Due to the continual cycles of degeneration and regen-                  [33,35] (Figure 9G). While CNF percentage is routinely
eration, dystrophic muscles have a high prevalence of                      performed, often using manual methods, reporting on
CNFs, while uninjured wild-type muscles have very few                      the size of the CNFs is less common. The software
Smith and Barton Skeletal Muscle 2014, 4:21                                                                                          Page 11 of 15
http://www.skeletalmusclejournal.com/content/4/1/21

 Figure 8 Object counter. (A) Input box with options for object counter function. (B) Truncated example of Excel output from running object
 counter function. (C) Portion of immunofluorescent image. Red is laminin stain, green is PECAM, and blue is DAPI (top left). Image showing only
 the objects of interest, here PECAM from the green channel (top right). Image showing objects of interest after smoothing filter is applied
 (bottom left). Binary image showing discrete objects that pass threshold value (bottom right).

makes it trivial to measure the size of the CNF popula-                    process each function in SMASH compared to legacy
tion. The data collected show that within mdx muscle                       methods is reported in Table 3. Smash demonstrates
CNFs are larger than peripherally nucleated fibers                         greatly reduced time of analysis for the muscles tested.
(PNFs) (Figure 9H). This relationship has been previ-
ously observed in the EDL muscle of mdx mice [16,36].                      Discussion
   The difference between data output from legacy                          The manual analysis of skeletal muscle immunofluores-
methods and SMASH for fiber size, fiber size variability,                  cence is often a laborious task. The Semiautomatic
fiber type percentage, and CNF percentage are presented                    Image Processing of Skeletal Muscle Histology Software
in Table 2. There was little discrepancy between values                    described and tested provides researchers with a valuable
obtained for fiber type percentage or CNF percentage.                      tool for measuring multiple facets of muscle histology.
However, the calculated fiber areas were consistently                      While image analysis software is available to conduct
higher using SMASH compared to legacy methods. This                        many of these features, it carries a high monetary cost
is due to the greater and more variable fiber border re-                   and is not specifically designed for skeletal muscle ana-
gion using simple thresholding in legacy systems com-                      lysis. In contrast, this program is available on the widely
pared to SMASH (Figure 10). The time required to                           used MATLAB software and is designed to investigate
Smith and Barton Skeletal Muscle 2014, 4:21                                                                                               Page 12 of 15
http://www.skeletalmusclejournal.com/content/4/1/21

    Figure 9 Comparison of output data from 1-year-old C57 and mdx mouse soleus muscle. (A) Mean of cross-sectional area of fibers in C57
    and mdx muscle sections. (B) Standard deviation of CSA of fibers. (C) Mean of minimum Feret diameter (MFD) of fibers. (D) Standard deviation of
    MFD diameter. (E) Percentage of Type I fibers in C57 and mdx muscle sections. (F) The ratio of mean CSA of type I fibers to type II fibers. (G) The
    percentage of fibers with centrally nucleated fiber (CNF)s. (H) The mean CSA of mdx peripherally nucleated fibers (PNF) and CNFs. *P
Smith and Barton Skeletal Muscle 2014, 4:21 Page 13 of 15
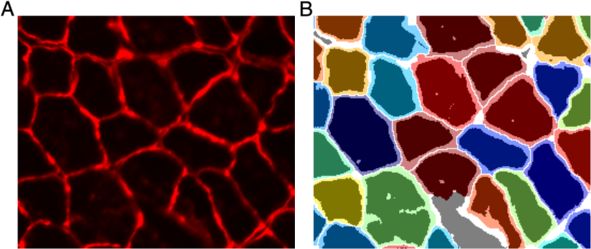
http://www.skeletalmusclejournal.com/content/4/1/21
Figure 10 Comparison of mask file from legacy method and SMASH. (A) Original image of a laminin stained muscle section. (B) Fibers are
colored randomly from SMASH output mask with dark regions corresponding to fiber area using a simple threshold. Dark gray areas are
interstitial in SMASH and fibers using legacy methods while white areas are interstitial in both masks. Figure demonstrates the larger fiber area
obtained with SMASH compared to the legacy method of using a simple threshold for fiber area.
staining. The fiber type function may also be used for done in SMASH provides signal that is more robust to
additional signals internal to fibers such as Evan’s Blue these parameters. SMASH provides a mask more con-
Dye permeability or IgG infiltration of necrotic fibers sistent with manual tracing of fibers than applying a
[2,38]. Automatic determination of CNFs provides a use- threshold. While SMASH reduces the border region be-
ful measure of skeletal muscle histology. Although it is tween adjacent fibers, it is also clearly capable of delin-
not frequently studied, combining fiber size with CNF eating interstitial space between adjacent fibers when
determination may provide a more informative marker there is an appreciable separation as evidenced by the
of muscle health [16]. The computation of this add- white and grey areas in Figure 10. Thus, we attest that
itional parameter is trivial using this software. Analysis SMASH generally provides a more robust and accurate
of structures outside of fibers themselves in skeletal fiber size as well as requiring less manual editing than
muscle is also important. The object counter function was using simple thresholds. It is also noteworthy that fiber
designed to automate analysis of capillary density, as is area is generally more variable than Feret diameter as
done in muscle histological analysis for capillaries per fiber for perfectly round areas it is squaring the difference
and capillaries per area [19]. However, it may also be used and the more elongated the fiber the greater the propor-
to analyze a multitude of other structures within a muscle, tion of border region that may influence the results.
such macrophage infiltration or matrix proteins. In addition the gains in robust analysis Table 3 demon-
The data generated by SMASH are validated against strates that SMASH greatly reduces the time required to
legacy methods showing largely consistent results be- analyze images. Manual editing of the fiber mask is still
tween methods for fiber type and CNF percentages required in the majority of muscle sections for both ini-
(Table 2). However, the discrepancy in fiber area illus- tial segmentation and fiber filtering and take the major-
trates the importance of using a single analytical method ity of the processing time. However, with SMASH this
for a given study and highlights the variability between manual editing is reduced to just a few minutes in the
different approaches. Using a simple threshold to separ- case of the soleus muscles tested. The time gains are es-
ate fibers creates highly variable borders between adja- pecially significant when doing multiple analyses on the
cent fibers that are dependent on parameters such as same image, as manually editing the mask is the major
exposure time and focus during image acquisition. Fil- time consumer and additional functions are able to be
tering the signal and using the watershed function as is processed in just seconds.
Table 3 Run time (mm:ss) comparisons from legacy methods to SMASH
Image Legacy method - functions SMASH - functions Diff
a a
FP FT CNF TOT IS FF FP FT CNF TOT TOT
A 30: 10: 16:30 56:30 1:50 1:49 0:06 0:17 0:12 4:14 52:16
B 30: 10: 13:50 53:50 2:46 3:42 0:05 0:26 0:15 7:14 46:36
C 30: 10: 13:30 53:30 1:45 2:39 0:07 0:14 0:10 4:55 48:35
a
Times are approximate.
CNF functions were performed on different sections than other functions.
CNF: Centrally nucleated fibers function; FF: Fiber filter function; FP: Fiber properties function, including fiber size; FT: Fiber typing function; IS: Initial segmentation
function; TOT: Total time for analysis.Smith and Barton Skeletal Muscle 2014, 4:21 Page 14 of 15
http://www.skeletalmusclejournal.com/content/4/1/21
While this software provides many advantages there previously incorporated functions. Automated functions
are notable limitations. The analysis is currently limited improve the speed and consistency of skeletal muscle
to immunofluorescence and is not compatible with com- histological analysis. Although it requires a MATLAB li-
mon stains such as hematoxylin and eosin. The software cense, this is the only freely available software designed for
does often require manual segmentation and filtration of the analysis of skeletal muscle histology.
fibers based on the current algorithms. These manual
adjustments allow the user more control over the ana- Availability and requirements
lysis, but also increase the time required for analysis and Project name: SMASH - Semiautomatic Image Process-
introduce a degree of subjectivity. Manual adjustments ing of Skeletal Muscle Histology: a MATLAB Application.
are more frequently required in analysis of diseased Project homepage: http://dx.doi.org/10.6084/m9.figshare.
muscle as well. While these algorithms are advanced 1247634
compared to many of the techniques currently in use, Operating System: Platform Independent.
extending fiber segmentation algorithms may provide Programming Language: MATLAB.
more reliable boundaries. The proposed method of Other requirements: SMASH Stand Alone (SMASH_
measuring fiber type is limited to investigation of a sin- Installer.exe) requires MATLAB Compiler Runtime (MCR)
gle fiber type per image, or per color in an RGB image. version R2014a (8.3) which is freely available from Mathworks
Thus to measure each fiber type individually requires (http://www.mathworks.com/products/compiler/mcr/).
multiple image segmentation masks from serial sections. SMASH App (SMASH_App.mlappinstall) requires
Alternatively, using distinguishable fluorophors for each MATLAB version R2014a (8.3) or later with the Image
fiber type [39] would permit the analysis of two fiber Processing Toolbox.
types using the same mask using this software. Using License: CC-BY.
serial sections for fiber typing is standard procedure in Any restrictions to use by non-academics: None.
many labs and it is not enhanced by this software. The
Abbreviations
analysis of myonuclei is limited to CNFs in this software,
CNF: Centrally nucleated fiber; CSA: Cross-sectional area; DAPI: 4′,6-diamidino-
as opposed to providing a measure of myonuclear dens- 2-phenylindole; EDL: Extensor digitorum longus; PECAM: Platelet endothelial
ity with peripheral nuclei [9,20]. The method of measur- cell adhesion molecule; PNF: Peripherally nucleated fiber; RGB: Red, Green, and
Blue image format.
ing CNFs is recommended by TREAT-NMD, however it
causes an issue with very small fibers as the entire CSA Competing interests
may be in the defined border region, making it impos- The authors declare that they have no competing interests.
sible to be labeled as a CNF. The measurement of non-
Authors’ contributions
fiber objects designed for capillary density is currently LRS developed the code, performed histology, conducted analysis, and
preliminary. There is no filtering of objects or a method drafted the manuscript. ERB contributed to the experimental design and
to select an object of interest. However, the output of revision of the manuscript. Both authors read and approved the final
manuscript.
object size does allow filtering based on the objects CSA
within Excel. This program currently is designed for use Acknowledgements
with muscle cross-sections and not designed to analyze We would like to acknowledge our funding sources including support from
the Muscle Core Facilities and Training from the Wellstone Muscle
images from longitudinal muscle sections. As an open
Physiology Core (AR052646) and support from the Pennsylvania Muscle
source program, users may address any of these limita- Institute Training Fellowship (AR053461). We would like to acknowledge
tions as they see fit within the framework of the software members of the Barton Lab for beta testing the software. We would also like
to acknowledge Dr. Gretchen Meyer for providing technical expertise in
platform and MATLAB.
MATLAB programming.
Conclusions Received: 24 August 2014 Accepted: 15 October 2014
Published: 27 November 2014
The software package based in MATLAB provides image
processing tools to analyze immunofluorescent muscle References
cross-sections. The semi-automatic fiber segmentation 1. Papadopulos F, Spinelli M, Valente S, Foroni L, Orrico C, Alviano F,
functions provide advanced algorithms for fiber segmenta- Pasquinelli G: Common tasks in microscopic and ultrastructural image
analysis using ImageJ. Ultrastruct Pathol 2007, 31:401–407.
tion as well as provide an interface for users to manually 2. Briguet A, Courdier-Fruh I, Foster M, Meier T, Magyar JP: Histological parameters
correct any errors. The histological analysis includes func- for the quantitative assessment of muscular dystrophy in the mdx-mouse.
tions for fiber CSA, fiber Feret diameter, fiber typing, Neuromuscul Disord 2004, 14:675–682.
3. Andersen JL, Aagaard P: Effects of strength training on muscle fiber types
CNFs, and capillary density. These functions produced ex- and size; consequences for athletes training for high-intensity sport.
pected results comparing wild-type and dystrophic mouse Scand J Med Sci Sports 2010, 20(Suppl 2):32–38.
muscle. These functions may be purposed for other ana- 4. McPherron AC, Lawler AM, Lee SJ: Regulation of skeletal muscle mass in
mice by a new TGF-beta superfamily member. Nature 1997, 387:83–90.
lyses. This open source platform provides users a frame- 5. Hortobagyi T, Dempsey L, Fraser D, Zheng D, Hamilton G, Lambert J, Dohm L:
work to create their own functions or modification of Changes in muscle strength, muscle fibre size and myofibrillar geneSmith and Barton Skeletal Muscle 2014, 4:21 Page 15 of 15
http://www.skeletalmusclejournal.com/content/4/1/21
expression after immobilization and retraining in humans. J Physiol 2000, 31. Coulton GR, Morgan JE, Partridge TA, Sloper JC: The mdx mouse skeletal
524:293–304. muscle myopathy: I. A histological, morphometric and biochemical
6. Ansved T, Larsson L: Effects of denervation on enzyme-histochemical and investigation. Neuropathol Appl Neurobiol 1988, 14:53–70.
morphometrical properties of the rat soleus muscle in relation to age. 32. Denies MS, Johnson J, Maliphol AB, Bruno M, Kim A, Rizvi A, Rustici K,
Acta Physiol Scand 1990, 139:297–304. Medler S: Diet-induced obesity alters skeletal muscle fiber types of male
7. Taylor NA, Wilkinson JG: Exercise-induced skeletal muscle growth. but not female mice. Physiol Rep 2014, 2:e00204.
Hypertrophy or hyperplasia? Sports Med 1986, 3:190–200. 33. Carnwath JW, Shotton DM: Muscular dystrophy in the mdx mouse:
8. Mula J, Lee JD, Liu F, Yang L, Peterson CA: Automated image analysis of histopathology of the soleus and extensor digitorum longus muscles.
skeletal muscle fiber cross-sectional area. J Appl Physiol (1985) 2013, J Neurol Sci 1987, 80:39–54.
114:148–155. 34. Torres LF, Duchen LW: The mutant mdx: inherited myopathy in the
9. Liu F, Fry CS, Mula J, Jackson JR, Lee JD, Peterson CA, Yang L: Automated mouse. Morphological studies of nerves, muscles and end-plates.
fiber-type-specific cross-sectional area assessment and myonuclei Brain 1987, 110:269–299.
counting in skeletal muscle. J Appl Physiol (1985) 2013, 115:1714–1724. 35. Terada M, Kawano F, Ohira T, Nakai N, Nishimoto N, Ohira Y: Effects of
10. Schiaffino S, Reggiani C: Fiber types in mammalian skeletal muscles. mechanical over-loading on the properties of soleus muscle fibers, with
Physiol Rev 2011, 91:1447–1531. or without damage, in wild type and mdx mice. PLoS One 2012, 7:e34557.
11. Brooke MH, Kaiser KK: Some comments on the histochemical 36. Karpati G, Carpenter S, Prescott S: Small-caliber skeletal muscle fibers
characterization of muscle adenosine triphosphatase. J Histochem do not suffer necrosis in mdx mouse dystrophy. Muscle Nerve 1988,
Cytochem 1969, 17:431–432. 11:795–803.
12. Guth L, Samaha FJ: Qualitative differences between actomyosin ATPase 37. Nagaraju K, Willmann R: Developing standard procedures for murine and
of slow and fast mammalian muscle. Exp Neurol 1969, 25:138–152. canine efficacy studies of DMD therapeutics: report of two expert
13. Schiaffino S, Gorza L, Sartore S, Saggin L, Ausoni S, Vianello M, Gundersen K, workshops on “Pre-clinical testing for Duchenne dystrophy”: Washington
Lomo T: Three myosin heavy chain isoforms in type 2 skeletal muscle DC, October 27th-28th 2007 and Zurich, June 30th-July 1st 2008.
fibres. J Muscle Res Cell Motil 1989, 10:197–205. Neuromuscul Disord 2009, 19:502–506.
14. Gauthier GF, Lowey S: Polymorphism of myosin among skeletal muscle 38. Faber RM, Hall JK, Chamberlain JS, Banks GB: Myofiber branching rather
fiber types. J Cell Biol 1977, 74:760–779. than myofiber hyperplasia contributes to muscle hypertrophy in mdx
15. Ferrari G, Cusella-De Angelis G, Coletta M, Paolucci E, Stornaiuolo A, Cossu mice. Skeletal Muscle 2014, 4:10.
G, Mavilio F: Muscle regeneration by bone marrow-derived myogenic 39. Gregorevic P, Meznarich NA, Blankinship MJ, Crawford RW, Chamberlain JS:
progenitors. Science 1998, 279:1528–1530. Fluorophore-labeled myosin-specific antibodies simplify muscle-fiber
16. Narita S, Yorifuji H: Centrally nucleated fibers (CNFs) compensate the phenotyping. Muscle Nerve 2008, 37:104–106.
fragility of myofibers in mdx mouse. Neuroreport 1999, 10:3233–3235.
17. Duscha BD, Kraus WE, Keteyian SJ, Sullivan MJ, Green HJ, Schachat FH, doi:10.1186/2044-5040-4-21
Pippen AM, Brawner CA, Blank JM, Annex BH: Capillary density of skeletal Cite this article as: Smith and Barton: SMASH – semi-automatic muscle
muscle: a contributing mechanism for exercise intolerance in class analysis using segmentation of histology: a MATLAB application.
Skeletal Muscle 2014 4:21.
II-III chronic heart failure independent of other peripheral alterations.
J Am Coll Cardiol 1999, 33:1956–1963.
18. Miyazaki D, Nakamura A, Fukushima K, Yoshida K, Takeda S, Ikeda S:
Matrix metalloproteinase-2 ablation in dystrophin-deficient mdx muscles
reduces angiogenesis resulting in impaired growth of regenerated
muscle fibers. Hum Mol Genet 2011, 20:1787–1799.
19. Qu Z, Andersen JL, Zhou S: Visualisation of capillaries in human skeletal
muscle. Histochem Cell Biol 1997, 107:169–174.
20. Pertl C, Eblenkamp M, Pertl A, Pfeifer S, Wintermantel E, Lochmuller H,
Walter MC, Krause S, Thirion C: A new web-based method for automated
analysis of muscle histology. BMC Musculoskelet Disord 2013, 14:26.
21. Bulfield G, Siller WG, Wight PA, Moore KJ: X chromosome-linked muscular
dystrophy (mdx) in the mouse. Proc Natl Acad Sci U S A 1984, 81:1189–1192.
22. Khajehpour H, Dehnavi AM, Taghizad H, Khajehpour E, Naeemabadi M:
Detection and segmentation of erythrocytes in blood smear images
using a line operator and watershed algorithm. J Med Signals Sensors
2013, 3:164–171.
23. Saez A, Acha B, Montero-Sanchez A, Rivas E, Escudero LM, Serrano C:
Neuromuscular disease classification system. J Biomed Opt 2013,
18:066017.
24. Liu F, Mackey AL, Srikuea R, Esser KA, Yang L: Automated image segmentation
of haematoxylin and eosin stained skeletal muscle cross-sections.
J Microsc 2013, 252:275–285.
25. Doke J: flattenMaskOverlay. In MATLAB Central. 2011.
26. Legland D: Feret diameter and oriented box. In MATLAB Central. 2011. Submit your next manuscript to BioMed Central
27. Legland D, Beaugrand J: Automated clustering of lignocellulosic fibres and take full advantage of:
based on morphometric features and using clustering of variables.
Ind Crops Prod 2013, 45:253–261. • Convenient online submission
28. Otsu N: A threshold selection method from gray-level histograms.
Syst Man Cybern IEEE Trans on 1979, 9:62–66. • Thorough peer review
29. Malm C, Nyberg P, Engstrom M, Sjodin B, Lenkei R, Ekblom B, Lundberg I: • No space constraints or color figure charges
Immunological changes in human skeletal muscle and blood after
• Immediate publication on acceptance
eccentric exercise and multiple biopsies. J Physiol 2000, 529:243–262.
30. Park S, Brisson BK, Liu M, Spinazzola JM, Barton ER: Mature IGF-I excels in • Inclusion in PubMed, CAS, Scopus and Google Scholar
promoting functional muscle recovery from disuse atrophy compared • Research which is freely available for redistribution
with pro-IGF-IA. J Appl Physiol (1985) 2014, 116:797–806.
Submit your manuscript at
www.biomedcentral.com/submitYou can also read