A Kinetic Model for Blood Biomarker Levels After Mild Traumatic Brain Injury
←
→
Page content transcription
If your browser does not render page correctly, please read the page content below
ORIGINAL RESEARCH
                                                                                                                                                   published: 06 July 2021
                                                                                                                                          doi: 10.3389/fneur.2021.668606

                                               A Kinetic Model for Blood Biomarker
                                               Levels After Mild Traumatic Brain
                                               Injury
                                               Sima Azizi 1*, Daniel B. Hier 1 , Blaine Allen 1 , Tayo Obafemi-Ajayi 2 , Gayla R. Olbricht 3 ,
                                               Matthew S. Thimgan 4 and Donald C. Wunsch II 1,5
                                               1
                                                 Applied Computational Intelligence Laboratory, Department of Electrical and Computer Engineering, Missouri University of
                                               Science and Technology, Rolla, MO, United States, 2 Engineering Program, Missouri State University, Springfield, MO,
                                               United States, 3 Department of Mathematics and Statistics, Missouri University of Science and Technology, Rolla, MO,
                                               United States, 4 Department of Biological Sciences, Missouri University of Science and Technology, Rolla, MO, United States,
                                               5
                                                 ECCS Division, National Science Foundation, Alexandria, VA, United States

                                               Traumatic brain injury (TBI) imposes a significant economic and social burden. The
                                               diagnosis and prognosis of mild TBI, also called concussion, is challenging. Concussions
                                               are common among contact sport athletes. After a blow to the head, it is often difficult to
                                               determine who has had a concussion, who should be withheld from play, if a concussed
                                               athlete is ready to return to the field, and which concussed athlete will develop a
                                               post-concussion syndrome. Biomarkers can be detected in the cerebrospinal fluid and
                            Edited by:         blood after traumatic brain injury and their levels may have prognostic value. Despite
                          Antonio Belli,
             University of Birmingham,
                                               significant investigation, questions remain as to the trajectories of blood biomarker levels
                       United Kingdom          over time after mild TBI. Modeling the kinetic behavior of these biomarkers could be
                        Reviewed by:           informative. We propose a one-compartment kinetic model for S100B, UCH-L1, NF-L,
                      David W. Nelson,
                                               GFAP, and tau biomarker levels after mild TBI based on accepted pharmacokinetic
     Karolinska Institutet (KI), Sweden
                       Kimbra Kenney,          models for oral drug absorption. We approximated model parameters using previously
  Uniformed Services University of the         published studies. Since parameter estimates were approximate, we did uncertainty and
       Health Sciences, United States
                                               sensitivity analyses. Using estimated kinetic parameters for each biomarker, we applied
                   *Correspondence:
                           Sima Azizi
                                               the model to an available post-concussion biomarker dataset of UCH-L1, GFAP, tau,
                      sacc5@mst.edu            and NF-L biomarkers levels. We have demonstrated the feasibility of modeling blood
                                               biomarker levels after mild TBI with a one compartment kinetic model. More work is
                    Specialty section:
                                               needed to better establish model parameters and to understand the implications of the
          This article was submitted to
                          Neurotrauma,         model for diagnostic use of these blood biomarkers for mild TBI.
                a section of the journal
                 Frontiers in Neurology        Keywords: concussion, uncertainty analysis, mathematical modeling, sensitivity analysis, blood biomarkers,
                                               kinetics, mild traumatic brain injury
         Received: 16 February 2021
           Accepted: 09 June 2021
            Published: 06 July 2021
                                               INTRODUCTION
                               Citation:
               Azizi S, Hier DB, Allen B,      Traumatic brain injury (TBI) affects 1.7 million people in the United States each year (1), placing
          Obafemi-Ajayi T, Olbricht GR,
                                               a burden on the health care system and society. Mild traumatic brain injury (mTBI), also known
Thimgan MS and Wunsch DC II (2021)
  A Kinetic Model for Blood Biomarker
                                               as concussion, constitutes 70–90% of patients visiting an Emergency Department (ED) for TBI
     Levels After Mild Traumatic Brain         (2, 3). For athletes, concussive head injuries pose difficult challenges on the playing field and in the
      Injury. Front. Neurol. 12:668606.        ED (4). On the playing field, it is difficult to determine which injured athlete should be withheld
     doi: 10.3389/fneur.2021.668606            from play. In the ED, it is often difficult to determine which concussed patient needs a CT scan

Frontiers in Neurology | www.frontiersin.org                                          1                                             July 2021 | Volume 12 | Article 668606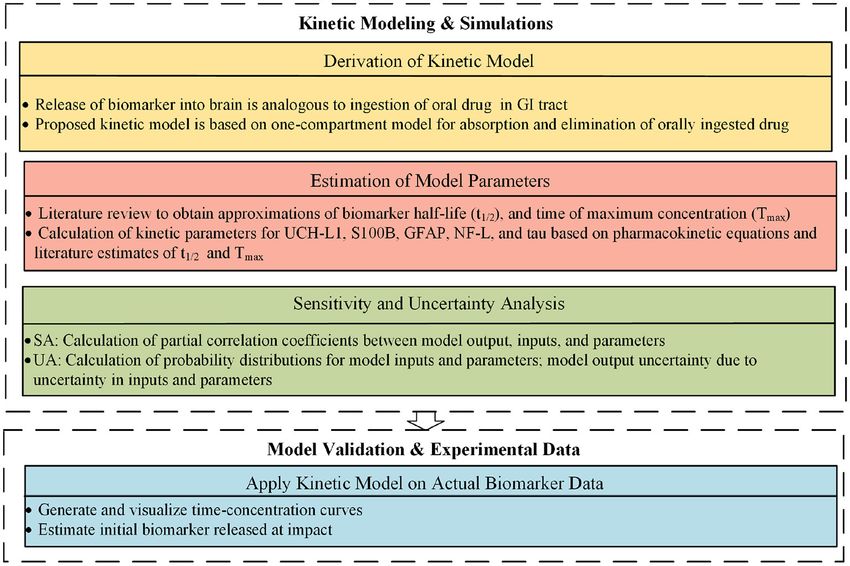
Azizi et al.                                                                                                                                             Kinetic Modeling

or other neuroimaging. Determining readiness to return to play                                   biomarker for each intended use, and cut-off values that should
after concussion is difficult. The early identification of which                                 be used (48–53). Kinetic models of blood biomarker levels inform
mTBI patients are at risk for post-concussion syndrome is                                        answers to these questions.
imprecise. Methods are lacking to assess accumulating damage                                         After a concussion, the blood level of each biomarker rises and
from repetitive head injuries. The prediction of chronic traumatic                               falls over time according to its own distinct pattern (Figure 3).
encephalopathy as a sequelae of mTBI is problematic. These                                       S100B rises early and falls early; NF-L rises late and falls late.
questions have stimulated the investigation of fluid biomarkers                                  Kinetics is the study of how the measured level of a substance
as predictors of mTBI outcome. Fluid biomarkers were first                                       changes over time. A kinetic model uses a mathematical equation
detected in the cerebrospinal fluid (5) of patients with severe TBI.                             to predict biomarker levels at different times. Only a few studies
With improved assay methods these biomarkers can be detected                                     have created kinetic models of blood biomarker levels after mTBI
reliably in the blood at the picogram per ml level in patients with                              (17, 54, 55). A one-compartmental kinetic model was utilized
mild TBI (6, 7).                                                                                 (17) to model the kinetics of ubiquitin C-terminal hydrolase-
    Neurofilament light chain (NF-L), tau, ubiquitin C-terminal                                  L1 (UCH-L1) levels in the cerebrospinal fluid and blood after
hydrolase-L1 (UCH-L1), S100B, and glial acidic fibrillary protein                                severe TBI. Ercole et al. (54) modeled S100B levels after TBI
(GFAP) have been investigated as biomarkers for mild TBI                                         with a hierarchical, Bayesian gamma variate kinetic equation.
(Table 1) (12, 13). After a concussion, neurons and astrocytes                                   Dadas et al. (55) used MATLAB R to build a multi-compartment
are disrupted (7) and biomarkers are released into the brain                                     pharmacokinetic model to predict blood biomarkers levels after
interstitial fluid (Figure 1). Although a precise relationship                                   TBI and to model disruption of the blood barrier.
between impact magnitude and the amount of biomarker                                                 We propose a one-compartment kinetic model (Figure 2) to
released has not been established, greater concussive forces                                     predict blood levels of the biomarkers S100B, UCH-L1, NF-L,
are likely associated with a larger release of biomarker (22).                                   GFAP, and tau after mTBI. The kinetic model provides estimates
Biomarker released into the brain interstitial fluid can reach                                   of blood biomarker levels at different times. If biomarker levels
the blood through a variety of mechanisms. Biomarker in the                                      are known at specific times, an estimate of initial release of
interstitial fluid exchanges freely with the cerebrospinal fluid                                 biomarker at time of impact can be provided. Since precise model
where it can drain to the blood via arachnoid granulations or via                                parameters are not available, we approximated kinetic parameters
lymphatic channels. Another route is direct entry into the blood                                 based on a review of published studies and used sensitivity
via a disrupted blood-brain barrier (Figure 1). Additionally,                                    analysis and uncertainty analysis to assess the implications of
biomarker can drain directly from the interstitial fluid to                                      estimation errors on model accuracy. We applied the model to
the lymphatics via arterial intramural pathways or glymphatic                                    an available dataset of post-concussion biomarker levels (56, 57).
channels (23–32). The relative importance of each of these
drainage pathways is unknown.
    The predictive power of blood biomarkers after mTBI is                                       METHODS
under active investigation. Elevated levels of blood biomarkers
can discriminate between concussed individuals and healthy                                       Kinetic Model
controls (18, 33–35). Blood biomarkers have been investigated                                    The proposed kinetic model is based on a standard one-
as predictors of neuroimaging abnormalities (abnormal CT and                                     compartment model for the oral absorption of a drug from
MRI scans) (9, 20, 35–38). Blood biomarkers have uncertain                                       the GI tract into the blood (58). In a one-compartment model,
value in predicting the late effects of TBI (39–42), in detecting                                ingested drug is absorbed from the GI tract into the blood by
sub-concussive blows to the head (43–46), and in predicting                                      first order kinetics. First order kinetics assumes that the amount
readiness for return to play (47). Questions remain as to the                                    of drug entering the blood per unit time is the amount of drug
preferred time to measure blood biomarkers, the preferred                                        in the GI tract multiplied by a rate constant ka . Once in the
                                                                                                 blood, the drug is eliminated by first order kinetics so that the
                                                                                                 amount of drug eliminated per unit time is the amount of drug
                                                                                                 in the blood multiplied by the elimination rate constant ke . Not
                                                                                                 all of the drug in the GI tract enters the blood. The fraction
TABLE 1 | Estimated kinetic parameters from literature review.
                                                                                                 entering the blood is a unit-less ratio called bioavailability or
Biomarker Normal plasma              t 1 hrs* Tmax hrs* References                               F. The model is considered one-compartment because drug that
                                      2
          level pg/ml                                                                            enters the blood compartment stays there until elimination and
                                                                                                 is not redistributed to other compartments such as the fat or
S100B          45–80                   1.5†         2       (8–16)                               interstitial fluid. After ingestion of a drug there are two primary
UCH-L1         10–40                      8         8       (8, 12, 14, 16–18)                   kinetic phases, an absorption phase when absorption outpaces
tau            1–5                        10        8       (8, 12–14, 19)                       elimination and an elimination phase when elimination outpaces
GFAP           30–70                      36       24       (8, 12–14, 18–20)                    absorption. The kinetic parameter Tmax describes the time when
NF-L           6–20                    500         240      (8, 12–14, 19, 21)                   drug levels are at a peak. Tmax marks the end of the absorption
∗ Value for t 1 and Tmax are mid-range estimates † S100B is eliminated by first order
                                                                                                 phase and the beginning of the elimination phase. The maximum
              2
kinetics. It may undergo redistribution to other compartments before renal elimination and       drug level at Tmax is called Cmax . Another important kinetic
has a shorter half-life than creatinine (15).                                                    parameter is the half-life or t 1 which is the time for blood levels
                                                                                                                               2

Frontiers in Neurology | www.frontiersin.org                                                 2                                      July 2021 | Volume 12 | Article 668606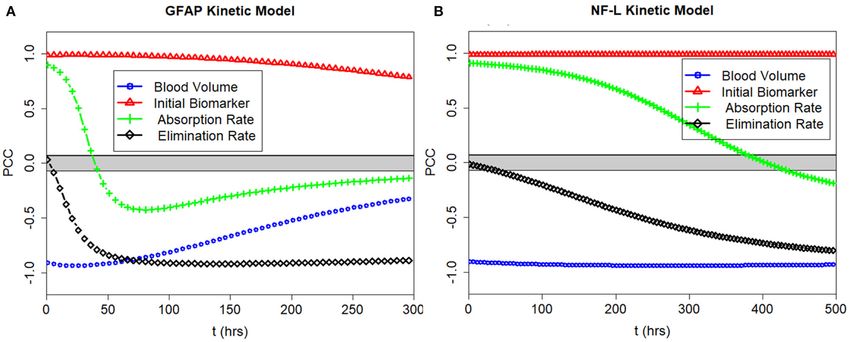
Azizi et al.                                                                                                                                                Kinetic Modeling

  FIGURE 1 | (A) Release of protein biomarkers (black dots) after head injury and entry into the blood via blood-brain barrier and the intramural periarterial drainage
  pathway. (B) One-compartment kinetic model for blood biomarker levels after mTBI.

  FIGURE 2 | Proposed approach.

to fall by 50% during the elimination phase after absorption has                         drug and biomarker model, Cp is the plasma concentration and
ceased. In our model, the release of a biomarker into the brain                          Vd is the volume of distribution (59). Model inputs include:
compartment is analogous to the ingestion of a drug into the GI
                                                                                         • D0 , the amount of biomarker released into the brain at time
tract. For both models, F is the bioavailability (fraction of drug                         of impact t0 . (The model assumes release is complete and
or biomarker entering the blood), ka is the first order absorption                         simultaneous at t0 with no timed or delayed release).
rate constant for entry into the blood, and ke is the first order rate                   • Vd , the volume of distribution (we have approximated Vd as
constant for elimination from the blood. Similarly, for both the                           total blood volume).

Frontiers in Neurology | www.frontiersin.org                                         3                                               July 2021 | Volume 12 | Article 668606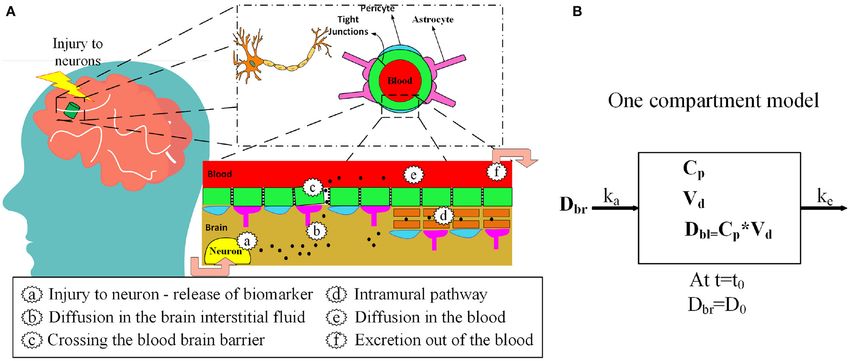
Azizi et al.                                                                                                                                              Kinetic Modeling

Model parameters that depend upon the biomarker modeled
include:
• F, the fraction of biomarker entering the blood from the brain.
• ka , the first order rate constant for absorption of biomarker
  into the blood from the brain compartment.
• ke , the first order rate constant for the elimination of
  biomarker from the blood.
Model variables that vary as a function of time include:
• Dbl , the amount of biomarker in the blood at time t.
• Dbr , the amount of biomarker in the brain at time t.
The model output is the blood biomarker level Cp . In a one-
compartment model, the net change in the amount of biomarker
in the blood at time t is equal to inflow minus outflow (Equation
1). The difference between inflow and outflow is an ordinary
differential equation (Equation 2).
                                                                              FIGURE 3 | Kinetic profiles for five blood biomarkers with parameter values for
                          net = inflow − outflow                 (1)          ka and ke from Table 2, a nominal total blood volume of Vd = 5, 000 ml, and a
                                                                              stipulated biomarker release of biomarker D0 = 400, 000 pg. Kinetic profiles
                                                                              based on Equation (3). The revised NF-L curve reflects a higher ka that
               inflow = F ∗ ka ∗ Dbr = F ∗ ka ∗ D0 ∗ e−ka t                   provides a better fit to the NF-L levels in the NCAA-CARE dataset.

                             outflow = ke ∗ Dbl
                                                                            TABLE 2 | Kinetic models with calculated parameters.

                       dDbl                                                 Biomarker                      Parameter                                    Input
               net =        = F ∗ ka ∗ D0 ∗ e−ka t − ke ∗ Dbl    (2)
                        dt
                                                                            model                 ke ∗           ka ∗          F†        Nominal D0            Nominal Vd
Solving Equation (2) for Dbl , the blood concentration Cp of a
biomarker at time t is modeled as a bi-exponential equation                 S100B                 0.462          0.5           0.8          400,000                5,000
(Equation 3):                                                               UCH-L1                0.0866         0.09          0.8          400,000                5,000
                                                                            tau                   0.0693         0.07          0.8          400,000                5,000
                                           Dbl
                                   Cp =                                     GFAP                  0.0193         0.08          0.8          400,000                5,000
                                           Vd                               NF-L                  0.0014         0.009         0.8          400,000                5,000
                                                                            NF-L Revised          0.0014         0.2           0.8          400,000                5,000
                       F ∗ D0 ∗ ka
                 Cp =                 ∗ (e−ke t − e−ka t )       (3)        ∗ Units for rate constants are hr −1 .
                      Vd ∗ (ka − ke )                                       †F is bioavailability and is a unit-less ratio. Estimates for F are not available in literature.
                                                                            Value was stipulated to be 0.8. Actual values are likely to differ.
Estimation of Kinetic Parameters
We used published estimates of Tmax (time of maximum
concentration) and t 1 (half-life; Table 1) to estimate ka and ke for
                       2
each biomarker (Equations 4 and 5) based on the assumption of               not available in the literature. Based on the impermeability of the
first order kinetics (59). Values in Table 1 are mid range estimates        brain barrier to proteins, it was previously thought that F was low
from reported values. If half-life or Tmax was not specifically             (perhaps 0.01 to 0.05) for most biomarkers (55). We used a higher
mentioned in a research report and a usable time-concentration              estimate of 0.8 based on the high recovery of biomarker in the
curve was available we used the method of Thelin et al. (8) to              blood and lymph after intra-brain and intra-ventricular injection
estimate half-life as the time required for reported levels to drop         of biomarker in animals experiments (28, 60–62).
by 50% and Tmax as the time at which biomarker concentration                   We used Equation (3) to create five models, one for each of the
was at its peak.                                                            biomarkers, to estimate blood levels at time t after concussion
                                                                            (Figure 3 and Table 2). Model parameters ka , ke , and F are
                                          0.693                             biomarker-dependent and we used estimates from Table 1. Vd
                                  t1 =                           (4)
                                   2        ke                              and D0 are concussion-dependent and vary by the individual
                                                                            sustaining a concussion. As a simplification, we used a nominal
                                           ln( kkae )                       value of 5,000 ml for Vd , although total blood volume differs
                               Tmax =                            (5)        by individual (63, 64). D0 is the unknown amount of biomarker
                                          ka − ke
                                                                            released into the brain at time of concussion and varies according
Values for F (the fraction of biomarker released into the brain             to the severity of the concussion. For Figure 3 we stipulated a
that reaches the blood) are likely to vary by biomarker and are             nominal release of 400,000 pg of biomarker at concussion.

Frontiers in Neurology | www.frontiersin.org                            4                                                       July 2021 | Volume 12 | Article 668606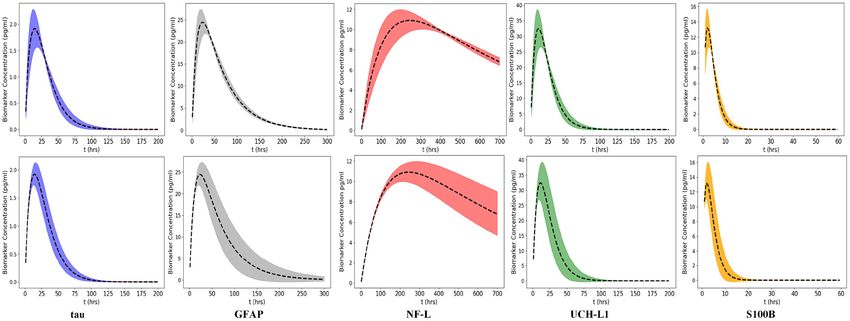
Azizi et al. Kinetic Modeling
where pnom,i is the nominal value of parameter i obtained from
Table 1 and σi is its associated variance. We created lognormal
probability density functions for each model input for each of the
five biomarkers (Figure 4). We assessed how uncertainty in the
model inputs or parameters propagated to uncertainty in model
output using Monte Carlo simulations. For each Monte Carlo
simulation we created a matrix of 1,000 rows × k columns, where
k was the number of inputs or parameters in the model that we
varied simultaneously and ranged between 1 and 5. Each row was
created by randomly sampling the values from the probability
distribution function for parameter of interest (Figure 4). Each
column reflected a different parameter or input. Cp was calculated
1,000 times (Equation 3). All other model inputs were set to their
nominal values.
Estimation of Biomarker Released
The biomarker data utilized for model validation is drawn from
the NCAA Concussion Assessment, Research, and Education
(CARE) study (67), which is available via the Federal Interagency
Traumatic Brain Injury Research (FITBIR) (68) data repository
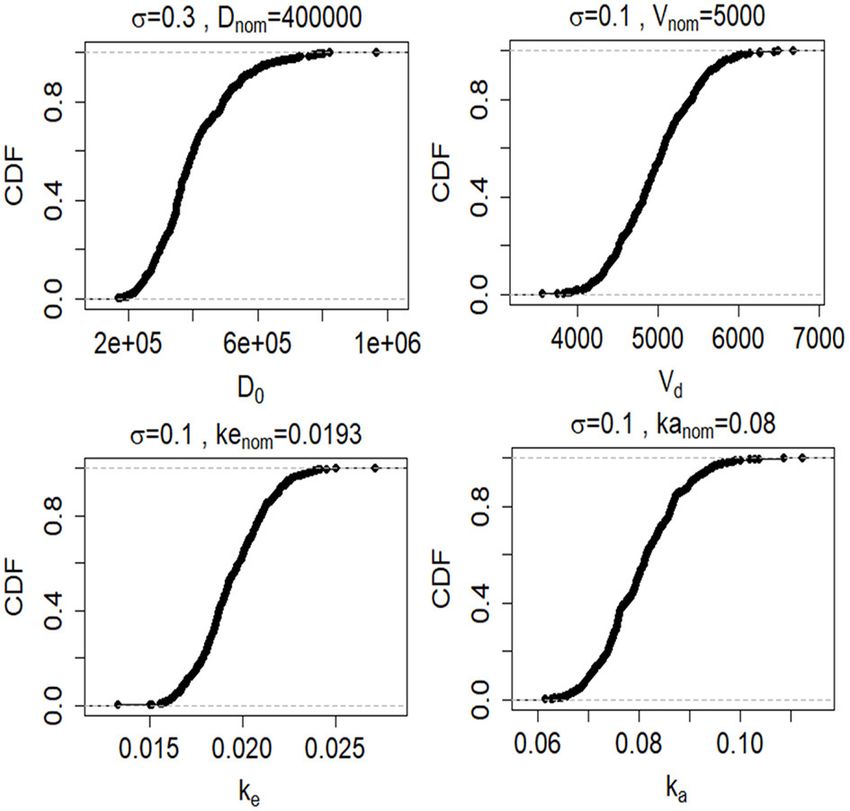
FIGURE 4 | Cumulative distribution functions (CDFs) of 1,000 samples
to approved investigators [the data set was downloaded from
randomly drawn from lognormal probability distributions (described by FITBIR (68) on August 22, 2019]. The study was established
Equation 7) for the four model inputs and parameters (D0 , Vd , ke , and ke ). CFs by the National Collegiate Athletic Association and the US
are shown for the GFAP kinetic model. Department of Defense. For a subset of concussed subjects, blood
biomarker data (NF-L, tau, UCH-L1, and GFAP) were obtained
at 6 h and at 24–48 h after injury, when asymptomatic, and at 7
Sensitivity and Uncertainty Analysis days after return to play. Based on nominal values for our kinetic
To assess the validity of our model, we performed both a model parameters F, ka , ke , and Vd , we derived values of Cp from
sensitivity analysis and uncertainty analysis to explore how the available biomarker data and Equation (3) to estimate the
uncertainty about model inputs (D0 , Vd , and t) and model amount of biomarker released (D0 ) for each concussed subject
parameters (ke , and ka ) influences the output (Cp ). For the in the data set. Note that the data is only utilized for model
sensitivity analysis (65), we calculated the partial correlation validation since the primary focus in this work is model design
coefficient between model inputs (Vd , D0 , ka , and ke ) and model and simulation.
output (Cp ) as a function of time (Figure 5). We used the partial
correlation coefficient to assess the linear relation between a RESULTS
single model input and the model output after adjusting for the
effects of the other model inputs (66). We tested the significance Sensitivity Analysis
of the partial correlation coefficient (γ ) using a t-distribution We calculated the partial correlation coefficient between the
(Equation 6). model output Cp and the model parameters ke , ka and the
model inputs Vd and D0 over time. The partial correlation
coefficients for GFAP and NF-L are shown in Figure 5. The
s
N−2−p
T=γ ∼ tN−2−p , (6) partial correlation coefficient varies between −1 (strong negative
1 − γ2
correlation) and +1 (strong positive correlation). The gray band
where tN−2−p is the t distribution with the N − 2 − p degrees is the area where coefficients are not significantly different from
of freedom, N is the sample size and p is the number of varied zero (obtained using the test statistic in Equation 6). For GFAP
input variables minus one (k − 1). The null hypothesis is that (Figure 5A), at early time intervals (0–6 h), Cp is most correlated
partial correlation coefficient is equal to zero and is rejected if with volume of distribution (Vd ), initial biomarker release (D0 )
the absolute value of the test statistic is higher than the 1 − α/2 and absorption rate (ka ). At later time intervals (30–50 h)
percentile of a t-distribution with N-2-p degrees of freedom GFAP level correlates most with volume of distribution, initial
(where α is the significance level). We created a probability biomarker release, and elimination rate (ke ). Absorption rate
density function for each of the model inputs based on nominal (ka ) is more determinate of biomarker level early on whereas
values from Table 1. Since our model inputs are constrained to elimination rate (ke ) is more determinate in later time intervals
be positive, we chose a lognormal distribution for the probability between 30 and 50 h. As expected, the correlation between
density function: GFAP level and absorption rate is positive, the correlation
between GFAP level and elimination rate is negative. The same
σi2 2 pattern is true for the NF-L kinetic model (Figure 5B), except
pi ∼ lognormal (log(pnom,i ) − , σ ), (7) that the timing differs. Due to lower absorption rate (ka )
2 i
Frontiers in Neurology | www.frontiersin.org 5 July 2021 | Volume 12 | Article 668606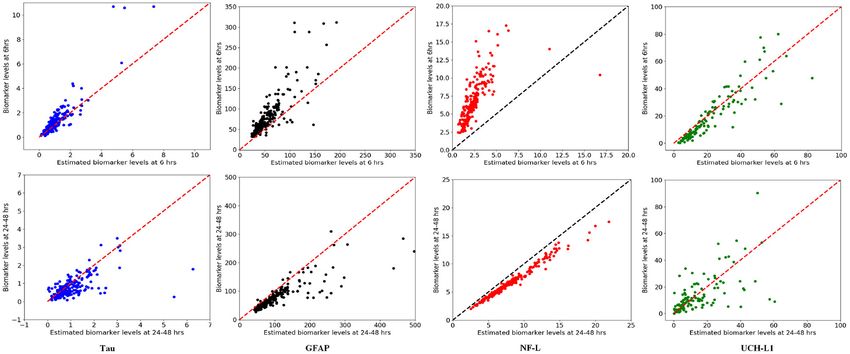
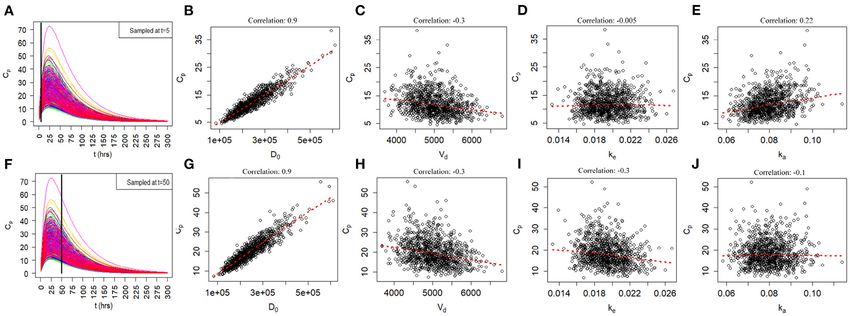
Azizi et al.                                                                                                                                                   Kinetic Modeling

  FIGURE 5 | PCC of the model output with the input parameters ke and ka and the model inputs Vd and D0 plotted over time. (A) Correlations for GFAP model. (B)
  Correlations for NF-L model. Partial correlations near +1.0 and −1.0 show strong correlations between input and output. Partial correlations near 0.0 show weak
  correlations. Note that D0 correlates positively with Cp at all times, and that Vd correlates negatively with Cp at all times. Partial correlations with ke and ka depend on
  time of measurement.

  FIGURE 6 | Monte Carlo simulations to investigate relationship of joint uncertainty in D0 , Vd , ke , and ka on model output for the GFAP model. One thousand runs are
  shown. (A–E) Scatter plots of model output by input and parameter at 5 h. (F–J) Scatter plots of model output by input and parameter at 50 h. Model output (Cp)
  correlates positively with biomarker release D0 and negatively with Vd . Uncertainty in estimates of ka and ke have a smaller influences on model output. The positive
  correlation of ka with Cp is most apparent at 5 h and the negative correlation of ke with Cp is most apparent at 50 h.

and lower elimination rate (ke ) the partial correlation curves                            Model Uncertainty Due to Joint
are shifted to the right suggesting that absorption rate is an                             Uncertainty in ke , ka , Vd , and D0
important determinate of blood biomarker levels for longer after                           Since the exact values for some of the model inputs and
a concussion and that elimination rate becomes an important                                parameters are uncertain, we created a probability distribution
determinate of blood biomarker levels later after a concussion                             based on the nominal value of the model inputs and parameters.
(compared to GFAP). The partial correlation coefficients are also                          We described the probability distribution of volume of
calculated for two other biomarkers of tau and UCH-L1. Due to                              distribution, absorption rate, and elimination rate as a lognormal
the similarity between the pattern of GFAP with tau and UCH-                               distribution (Equation 7). The nominal value for model inputs
L1, their partial correlation coefficient curves over time are not                         and parameters were set to the values in Table 2. The cumulative
included in Figure 5.                                                                      distribution functions of the model inputs are shown in Figure 4.

Frontiers in Neurology | www.frontiersin.org                                           6                                                July 2021 | Volume 12 | Article 668606
Azizi et al.                                                                                                                     Kinetic Modeling

We varied the initial biomarker release (D0 ) over a larger               samples is known it may not be possible to draw the
range (σ = 0.3), while other inputs such as Vd , ka , and                 6 h sample at exactly 6 or 48 h sample at exactly 48
ke varied with a smaller standard deviation of (σ = 0.1).                 h. Since timing of blood samples can be uncertain or
The cumulative distribution functions in Figure 4 are shown               imprecise, we considered two scenarios: a 6-h sample drawn
for the GFAP kinetic model. Similar cumulative distribution               at 6 ± 3 h and a 36 h sample drawn at 36 ± 12 h.
functions were calculated for each biomarker. To examine model            Using a Monte Carlo simulation and a nominal D0 =
uncertainty due to joint uncertainty in ke , ka , Vd , and D0 ,           400,000 pg we calculated the distribution of Cp at 6 and
we performed a Monte Carlo simulations with 1, 000 random                 36 h (Figure 8). As shown, variations from the designated
samples taken from the cumulative function distributions of the           time of measurement has significant effects on measured
two model inputs and two model parameters (Figure 4). Results             biomarker levels, with the exception of the 6-h measurement of
for the GFAP kinetic model are shown in Figures 6A,F. Scatter             NF-L (Figure 8).
plots in Figures 6B–E,G–J demonstrate the relation between
the output (Cp ) and the model inputs at two different times              Model Uncertainty Due to Uncertainty
(Figures 6A,F). The first row corresponds to t = 5 h and the              About Vd
second row corresponds to t = 50 h. The red dashed lines                  Since most of the blood biomarkers for mild TBI stay in the
are the smoothed LOESS fits (69) identify linear, nonlinear and           blood compartment until renal elimination, it is reasonable
correlations between the model outputs and inputs. For GFAP, a            to equate the volume of distribution (Vd ) to the total blood
positive linear correlation is observed between the model output          volume. Although total blood volume varies by height, weight,
and the initial blood biomarker released at time-points t = 5 h and       and sex, Feldschuh and Enson (64) corrections for total
t = 50 h. A negative correlation is found between model output            blood volume are not routinely made. We did 1,000 runs of
and total blood volume. The correlation between the model                 Monte Carlo simulations on blood levels for the biomarker
output and absorption and elimination constants are smaller               GFAP at 6 h using the mean total blood volume ± standard
when compared to the model inputs of biomarker released and               deviation for healthy men and women (64) and the nominal
volume of distribution, suggesting that these model parameters            kinetic parameters for the tau kinetic model (Table 2). The
have less influence on predicted biomarker levels than the model          failure to account for the total blood volume of subjects
inputs D0 and Vd . Further, the relation between these two model          (Figure 9) introduces considerable variability into modeled
parameters and the output varies with time. For instance, there           biomarker level.
is little relation between model output and elimination rate at t
= 5 h (Figure 6D). However, a negative correlation is observed            Kinetic Modeling on Actual Biomarker Data
at t = 50 h. Similarly, there is little relation between absorption       We used available biomarker data from the NCAA-CARE study
rate and the model output at t = 50 h, and a positive correlation         (33) to estimate initial biomarker release (D0 ) in the concussed
is observed at t = 5 h.                                                   subjects. The data set had values for GFAP, UCH-L1, NF-
                                                                          L, and tau blood biomarkers at four specific time-points for
Model Uncertainty Due to Uncertainty                                      356 concussed subjects including subjects with more than one
                                                                          concussion. Date stamps included: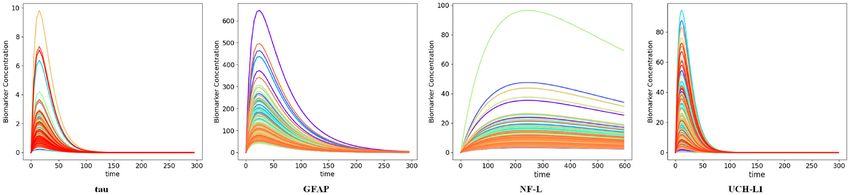
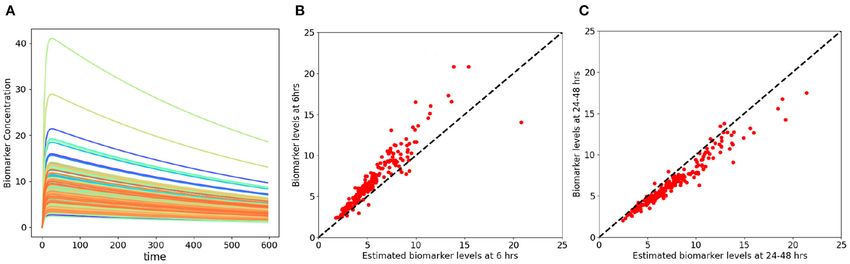
Azizi et al.                                                                                                                                                 Kinetic Modeling

  FIGURE 7 | Uncertainty propagated in the model output caused by variation of two input parameters ka and ke . The uncertainty bands are the 2δ uncertainty of the
  model output (δ is the standard deviation of the model output). Variations in ka and ke are derived from the lognormal probability distributions (defined by Equation 7),
  the standard deviation is 0.2 (Top) Model output uncertainty due to ka . (Bottom) Model output uncertainty due to ke . Peak of each curve corresponds to Cmax at
  Tmax . Curve up to Tmax is absorption phase and curve after Tmax is elimination phase. Uncertainty in ka dominates absorption phase whereas uncertainty in ke
  dominates the elimination phase for all biomarkers. Time intervals of greatest uncertainty depend on the specific values of ke and ka . Note that the x-axis has been
  expanded or compressed depending on the half-life of the biomarker. Confidence limits provide insight as to when the uncertainty about ka or ke causes greatest
  uncertainty about biomarker level Cp .

  FIGURE 8 | Monte Carlo simulations to investigate the effect of uncertainty in time on the blood biomarker levels (Cp ). Simulations were conducted by setting the
  model parameters to the nominal values in Table 1 and the initial biomarker released to D0 = 400, 000 pg. (Top) Histograms of blood biomarker levels at 6 h, with
  time varying in a range of (3, 12). (Bottom) Histograms for blood biomarker levels at 36 h, with time varying in the range of (35, 56). Note that at 36 h, biomarker levels
  of GFAP and NF-L are still rising while levels of tau and UCH-L1 are falling.

for publication). Estimated levels of NF-L, especially at 6 h, fall                       DISCUSSION
below measured levels (Figure 11) suggesting an error in model
parameters for NF-L. Based on our prior sensitivity analysis                              Biomarkers (biological markers) belong to a broad category
(Figure 5) we suspected our approximation of ka was too low                               of medical signs that are objective indicators of a patient’s
and that actual absorption of NF-L was occurring more rapidly                             medical state and that can be measured accurately and
than implied by the model. We re-ran the model for NF-L with                              reproducibly (70). The intent of obtaining blood biomarkers
a shorter Tmax of 24 h and a larger ka of 0.2 hr−1 , resulting in a                       after mild TBI (concussion) is to address diagnostic questions
better qualitative fit of the estimated Cp to compared to measured                        (Did the subject have a concussion? How severe was the
Cp (Figure 12).                                                                           concussion? Should the subject have a CT scan or MRI

Frontiers in Neurology | www.frontiersin.org                                          8                                               July 2021 | Volume 12 | Article 668606
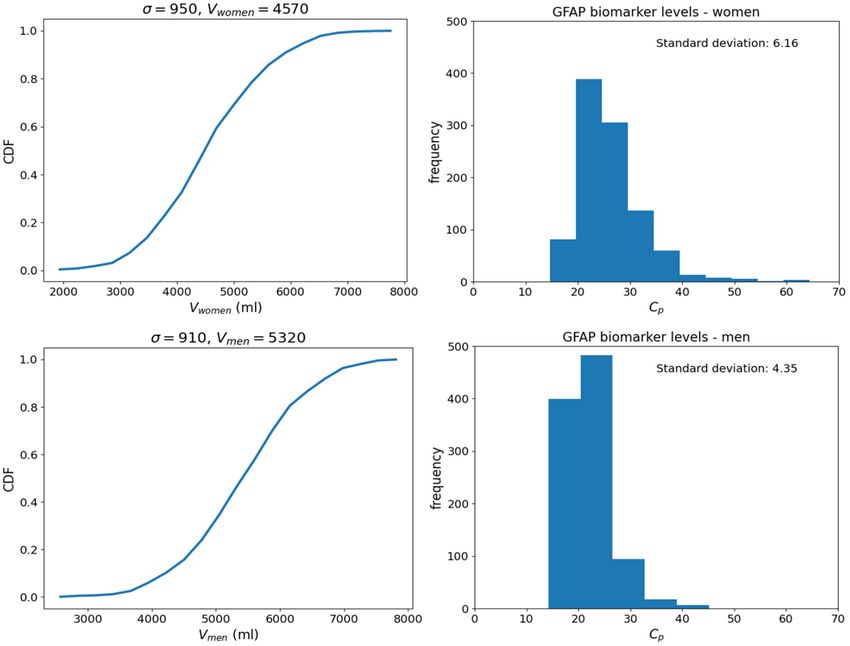
Azizi et al.                                                                                                                                           Kinetic Modeling

  FIGURE 9 | Monte Carlo simulations to investigate the effect of uncertainty in total blood volume on the blood biomarker level (Cp ). Simulations set the model
  parameters to the nominal values in Table 1 and a biomarker release of 400, 000 pg. Normal probability distributions with nominal values of 4,750 and 5, 320 ml were
  used for women and men, respectively. (Top) Histograms for GFAP blood biomarker levels at 6 h for women. (Bottom) Histograms of tau blood biomarker levels at 6
  h for men. Means and standard deviations for blood volumes from published estimates (64).

  FIGURE 10 | Time-concentration curves for concussed subjects with available biomarker data as estimated by the kinetic models. Each curve represents one subject
  in the data. Note resemblance of displayed curves to nominal time-concentration curves shown in Figure 3.

scan?) or prognostic questions (Can the athlete return to play                         the blood biomarker level is a useful surrogate for the brain
immediately? When can the withheld athlete return to play?                             injury that occurred with concussion. Furthermore, if it could
Will the athlete develop post-concussion syndrome?) Ideally                            be known, the amount of biomarker released with concussion

Frontiers in Neurology | www.frontiersin.org                                       9                                             July 2021 | Volume 12 | Article 668606
Azizi et al.                                                                                                                                          Kinetic Modeling

  FIGURE 11 | Model estimated biomarker level at 6 and 24–48 h vs. actual biomarker level for each subject using available data set. (Top) x-axis corresponds to
  estimated Cp at 6 h and y-axis corresponds to measured Cp at 6 h. (Bottom) x-axis corresponds to estimated Cp at 24–48 h and y-axis corresponds to measured Cp
  at 24–48 h. Note that estimated levels for NF-L at 6 h are especially below measured levels.

  FIGURE 12 | NF-L kinetic modeling utilizing modified kinetic parameters of Tmax = 24 h and ka = 0.2 hr −1 . (A) Time concentration curves estimated by the revised
  kinetic parameters for NF-L biomarker. (B,C) Model estimated biomarker level vs. measured biomarker level at 6 and 24–48 h for revised kinetic parameters of NF-L.
  (B) x-axis corresponds to model estimated Cp at 6 h and Y-axis corresponds to measured Cp at 6 h. (C) x-axis corresponds to model estimated Cp at 24–48 h and
  y-axis corresponds to measured Cp at 24–48 h.

should be a better measure of severity than a blood biomarker                          commonly investigated biomarkers for mTBI, we created a one-
level at a single time-point. A single biomarker level is of                           compartment kinetic model to predict blood biomarker levels
limited value. Because blood biomarker levels are changing                             at a given time t (Figure 3). In general, the kinetic profiles are
over time (Figure 3) a blood biomarker level can only be                               aligned with suggested kinetic profiles in the published literature
interpreted in the context of its time of measurement. Unlike                          (8, 12, 16, 17, 71, 71, 72).
a blood biomarker level Cp which is variable, the amount                                   An important limitation of current blood biomarker testing is
of biomarker released at the time of impact is fixed and                               that blood sampling is frequently not done at standardized times.
time constant. If D0 could be known or estimated, it would                             We used uncertainty analysis to assess the effects of uncertainty
be a time-independent correlate to the severity of traumatic                           about the time of blood sampling (Figure 8). The results suggest
brain injury.                                                                          that precise timing of blood samples is important to obtaining
   Kinetic modeling offers an approach to understanding the                            levels of Cp that reflect D0 after mild traumatic injury. If blood
complexities and uncertainties in the use of single blood                              sampling cannot be done at standardized times, adjustment of
biomarker levels for the diagnosis of mild TBI. For each of five                       measured blood biomarker levels for off-standard times may be

Frontiers in Neurology | www.frontiersin.org                                      10                                            July 2021 | Volume 12 | Article 668606
Azizi et al.                                                                                                                          Kinetic Modeling

helpful, especially when measured biomarker levels are applied to             the initial amount of biomarker released at impact (Figure 11).
established cut-offs.                                                         Our thinking is that the amount of biomarker released is a
    Similarly, blood biomarker levels after traumatic brain injury            more reliable indicator of brain injury than is a single biomarker
are not currently corrected for individual differences in renal               level at a single time-point. Although we have demonstrated the
function or total blood volume. Impaired renal function could                 feasibility of this approach, further work is needed to explore
decrease clearance of blood biomarkers and be reflected in                    its utility.
declines in ke (55). Both the sensitivity analysis for ke (Figure 5)              Models can be wrong in at least two ways: their predictions
and the uncertainty analysis for ke (Figure 7, lower band) suggest            can be wrong or their underlying assumptions can be wrong (73).
that changes in ke could elevate biomarker levels after mTBI.                 Our model has several underlying assumptions that could prove
Although blood biomarker levels are not routinely corrected                   wrong. We have assumed that the release of biomarker at impact
for individual differences in total blood volume (a surrogate for             is momentaneous. In fact, the release of biomarker could occur
Vd ), our sensitivity analysis (Figure 5) and uncertainty analysis            more slowly over minutes or hours suggesting a delayed release
(Figure 9) again suggest that variations in total blood volume                of timed-release model would be more appropriate. Furthermore,
could significantly change measured levels of biomarker after                 studies of biomarker levels after mild traumatic injury have
mTBI. These findings raise the question as to whether corrections             not excluded the possibility of either continuing synthesis of
in measured Cp after mTBI should be made for renal impairment                 biomarker or upregulation of biomarker synthesis.
or blood volume.                                                                  We have assumed that blood biomarker levels could be
    A limitation of our kinetic models (Table 2) is the                       modeled as a one-compartment model (with biomarker entering
approximate values for ka and ke . Sensitivity analysis suggests              the blood compartment from the brain and exiting the blood
that the model output may be relatively insensitive to errors in              by renal elimination), However, for S100B in particular, the
our estimates of ke and ka except at certain time measurement                 assumptions of the one-compartment model are likely violated
points that vary by biomarker (Figure 5). Uncertainty analysis                as S100B has significant extra-cerebral sources and may be
(Figure 7) largely confirms the findings of the sensitivity analysis.         redistributed to the fat and other soft tissues prior to renal
The model parameters ka and ke are important but the model                    elimination (8, 9).
may be relatively resistant to small errors (
Azizi et al. Kinetic Modeling
after mTBI based on the real data (Figure 10), the lack of or stage-released. Accurate kinetic models of blood biomarker
exact time-points for blood biomarker measurements has limited levels have the potential to improve the selection of optimal
our ability to do an exact goodness of fit determination. At sampling times and optimal cut points for the blood biomarkers
present we conclude that our model fits the NCAA-CARE dataset used in the diagnosis of mild TBI.
qualitatively (Figure 11). We have already commented above that
our initial approximation for ka for NF-L was likely too low DATA AVAILABILITY STATEMENT
(Figure 12). Modification of model parameters could improve
goodness of fit (Figure 12). Publicly available datasets were analyzed in this study. The CARE
Like McCrea et al. (33), we noted that the biomarker levels biomarker data utilized in this study are available to approved
after mild TBI in the NCAA-CARE dataset were heteroscedastic investigators via the FITBIR (32) data repository, https://fitbir.
and likely not normal. We elected not to log transform the nih.gov/. The data utilized for the kinetic model design are
data to persevere its bi-modality which potentially reflected two available upon request to the corresponding author.
distinct populations after mild TBI. Further investigation of the
heteroscedasticity of blood biomarker levels after mild TBI is AUTHOR CONTRIBUTIONS
needed but is beyond the scope of this paper.
Several improvements in the proposed model are possible. SA, DH, BA, TO-A, GO, MT, and DW: concept and design, data
One improvement would be to add in corrections for subject age, interpretation, drafting, revising, and final approval. TO-A: data
height, weight, and renal function. Our current model is based on acquisition. SA and DH: model parameters and computations.
increases in biomarker levels due to mTBI and does not consider All authors contributed to the article and approved the
the baseline levels of these biomarkers in control subjects. The submitted version.
model could be improved by adding back in corrections for
baseline levels of biomarkers. FUNDING
In conclusion, we have demonstrated the feasibility of creating
a one-compartment kinetic model of blood biomarker levels Research was partially sponsored by the Mary K. Finley
after mild traumatic brain injury. The one-compartment kinetic Missouri Endowment, the Missouri S&T Intelligent Systems
model fits well the observed levels of tau, UCH-L1, and GFAP Center, the National Science Foundation and the Leonard
after mild traumatic brain injury. The accuracy of the key kinetic Wood Institute in cooperation with the U.S. Army Research
parameters of the kinetic model (ka , ke , and F) could be improved Laboratory and was accomplished under Cooperative Agreement
by carefully executed kinetic studies. S100B and NF-L pose Number W911NF-14-2-0034. Additional support came from
special challenges to modeling. S100B is likely absorbed into the NIH Award R15 GM117507-01A1. The views, opinions,
blood from multiple compartments and may be redistributed findings, recommendations, or conclusions contained in this
to other compartments prior to elimination. Hence, S100B may document are those of the authors and should not be
be a poor candidate for a one-compartment kinetic model. The interpreted as representing the views or official policies, either
paucity of kinetic data on NF-L added to the possibility of late expressed or implied, of the Leonard Wood Institute, the
release or NF-L or the upregulation of NF-L synthesis, suggests Army Research Laboratory, the National Science Foundation
that a different model may be needed for NF-L biomarker or the U.S. Government. The U.S. Government is authorized
levels. Additional careful kinetic studies of biomarker levels could to reproduce and distribute reprints for Government purposes
resolve the issue as to whether release at impact is momentaneous notwithstanding any copyright notation heron.
REFERENCES 6. Zetterberg H, Blennow K. Fluid biomarkers for mild traumatic brain
injury and related conditions. Nat Rev Neurol. (2016) 12:563–74.
1. Taylor CA, Bell JM, Breiding MJ, Xu L. Traumatic brain injury-related doi: 10.1038/nrneurol.2016.127
emergency department visits, hospitalizations, and deaths-United States, 7. Filley CM. Progress in the diagnosis of traumatic brain injury. Neurology.
2007 and 2013. MMWR Surveill Summ. (2017) 66:1. doi: 10.15585/mmwr. (2020) 95:235–6. doi: 10.1212/WNL.0000000000009992
ss6609a1 8. Thelin EP, Zeiler FA, Ercole A, Mondello S, Büki A, Bellander BM, et al.
2. World Health Organization. Neurological Disorders: Public Health Challenges. Serial sampling of serum protein biomarkers for monitoring human traumatic
Geneva: World Health Organization (2006). brain injury dynamics: a systematic review. Front Neurol. (2017) 8:300.
3. Centers for Disease Control and Prevention and others. Report to Congress doi: 10.3389/fneur.2017.00300
on Mild Traumatic Brain Injury in the United States: Steps to Prevent a 9. Thelin EP, Nelson DW, Bellander BM. A review of the clinical utility of
Serious Public Health Problem. Atlanta, GA: Centers for Disease Control and serum S100B protein levels in the assessment of traumatic brain injury. Acta
Prevention (2003). Neurochirurg. (2017) 159:209–25. doi: 10.1007/s00701-016-3046-3
4. Alexander MP. Mild traumatic brain injury: pathophysiology, natural 10. Ghanem G, Loir B, Morandini R, Sales F, Lienard D, Eggermont A, et al. On
history, and clinical management. Neurology. (1995) 45:1253–60. the release and half-life of S100B protein in the peripheral blood of melanoma
doi: 10.1212/WNL.45.7.1253 patients. Int J Cancer. (2001) 94:586–90. doi: 10.1002/ijc.1504
5. Zetterberg H, Smith DH, Blennow K. Biomarkers of mild 11. Townend W, Dibble C, Abid K, Vail A, Sherwood R, Lecky F.
traumatic brain injury in cerebrospinal fluid and blood. Rapid elimination of protein S-100B from serum after minor head
Nat Rev Neurol. (2013) 9:201. doi: 10.1038/nrneurol. trauma. J Neurotrauma. (2006) 23:149–55. doi: 10.1089/neu.2006.
2013.9 23.149
Frontiers in Neurology | www.frontiersin.org 12 July 2021 | Volume 12 | Article 668606Azizi et al. Kinetic Modeling
12. Adrian H, Mårten K, Salla N, Lasse V. Biomarkers of traumatic brain 31. Nimmo J, Johnston DA, Dodart J, MacGregor-Sharp MT, Weller RO,
injury: temporal changes in body fluids. Eneuro. (2016) 68:460–73. Nicoll JA, et al. Peri-arterial pathways for clearance of α-Synuclein and
doi: 10.1523/ENEURO.0294-16.2016 tau from the brain: Implications for the pathogenesis of dementias and
13. Kawata K, Liu CY, Merkel SF, Ramirez SH, Tierney RT, Langford D. Blood for immunotherapy. Alzheimer’s Dement Diagn Assess Dis Monitor. (2020)
biomarkers for brain injury: what are we measuring? Neurosci Biobehav Rev. 12:e12070. doi: 10.1002/dad2.12070
(2016) 68:460–73. doi: 10.1016/j.neubiorev.2016.05.009 32. Lei Y, Han H, Yuan F, Javeed A, Zhao Y. The brain interstitial system: anatomy,
14. Manivannan S, Makwana M, Ahmed AI, Zaben M. Profiling biomarkers of modeling, in vivo measurement, and applications. Prog Neurobiol. (2017)
traumatic axonal injury: from mouse to man. Clin Neurol Neurosurg. (2018) 157:230–46. doi: 10.1016/j.pneurobio.2015.12.007
171:6–20. doi: 10.1016/j.clineuro.2018.05.017 33. McCrea M, Broglio SP, McAllister TW, Gill J, Giza CC, Huber DL, et al.
15. Jönsson H, Johnsson P, Höglund P, Alling C, Blomquist S. Elimination of Association of blood biomarkers with acute sport-related concussion
S100B and renal function after cardiac surgery. J Cardiothor Vasc Anesth. in collegiate athletes: findings from the NCAA and Department of
(2000) 14:698–701. doi: 10.1053/jcan.2000.18444 Defense CARE Consortium. JAMA Netw Open. (2020) 3:e1919771.
16. Welch RD, Ellis M, Lewis LM, Ayaz SI, Mika VH, Millis S, et al. Modeling the doi: 10.1001/jamanetworkopen.2019.19771
kinetics of serum glial fibrillary acidic protein, ubiquitin carboxyl-terminal 34. Shahim P, Tegner Y, Wilson DH, Randall J, Skillbäck T, Pazooki D, et al. Blood
hydrolase-L1, and S100B concentrations in patients with traumatic brain biomarkers for brain injury in concussed professional ice hockey players.
injury. J Neurotrauma. (2017) 34:1957–71. doi: 10.1089/neu.2016.4772 JAMA Neurol. (2014) 71:684–92. doi: 10.1001/jamaneurol.2014.367
17. Brophy GM, Mondello S, Papa L, Robicsek SA, Gabrielli A, Tepas III J, et al. 35. Lewis LM, Schloemann DT, Papa L, Fucetola RP, Bazarian J, Lindburg
Biokinetic analysis of ubiquitin C-terminal hydrolase-L1 (UCH-L1) in severe M, et al. Utility of serum biomarkers in the diagnosis and stratification
traumatic brain injury patient biofluids. J Neurotrauma. (2011) 28:861–70. of mild traumatic brain injury. Acad Emerg Med. (2017) 24:710–20.
doi: 10.1089/neu.2010.1564 doi: 10.1111/acem.13174
18. Papa L, Zonfrillo MR, Welch RD, Lewis LM, Braga CF, Tan CN, et al. 36. Jones CMC, Harmon C, McCann M, Gunyan H, Bazarian JJ. S100B
Evaluating glial and neuronal blood biomarkers GFAP and UCH-L1 as outperforms clinical decision rules for the identification of intracranial injury
gradients of brain injury in concussive, subconcussive and non-concussive on head CT scan after mild traumatic brain injury. Brain Injury. (2020)
trauma: a prospective cohort study. BMJ Paediatr Open. (2019) 3:473. 34:407–14. doi: 10.1080/02699052.2020.1725123
doi: 10.1136/bmjpo-2019-000473 37. Calcagnile O, Anell A, Undén J. The addition of S100B to guidelines for
19. Shahim P, Linemann T, Inekci D, Karsdal MA, Blennow K, Tegner Y, et al. management of mild head injury is potentially cost saving. BMC Neurol.
Serum tau fragments predict return to play in concussed professional ice (2016) 16:200. doi: 10.1186/s12883-016-0723-z
hockey players. J Neurotrauma. (2016) 33:1995–9. doi: 10.1089/neu.2014. 38. Welch RD, Ayaz SI, Lewis LM, Unden J, Chen JY, Mika VH, et al. Ability
3741 of serum glial fibrillary acidic protein, ubiquitin C-terminal hydrolase-L1,
20. Gill J, Latour L, Diaz-Arrastia R, Motamedi V, Turtzo C, Shahim P, and S100B to differentiate normal and abnormal head computed tomography
et al. Glial fibrillary acidic protein elevations relate to neuroimaging findings in patients with suspected mild or moderate traumatic brain injury. J
abnormalities after mild TBI. Neurology. (2018) 91:e1385–9. Neurotrauma. (2016) 33:203–14. doi: 10.1089/neu.2015.4149
doi: 10.1212/WNL.0000000000006321 39. Shahim P, Politis A, van der Merwe A, Moore B, Ekanayake V, Lippa
21. Shahim P, Tegner Y, Marklund N, Blennow K, Zetterberg H. Neurofilament SM, et al. Time course and diagnostic utility of NfL, tau, GFAP, and
light and tau as blood biomarkers for sports-related concussion. Neurology. UCH-L1 in subacute and chronic TBI. Neurology. (2020) 95:e623–36.
(2018) 90:e1780–8. doi: 10.1212/WNL.0000000000005518 doi: 10.1212/WNL.0000000000009985
22. Li Y, Zhang L, Kallakuri S, Cohen A, Cavanaugh JM. Correlation 40. Bogoslovsky T, Wilson D, Chen Y, Hanlon D, Gill J, Jeromin A, et al. Increases
of mechanical impact responses and biomarker levels: a new model of plasma levels of glial fibrillary acidic protein, tau, and amyloid β up
for biomarker evaluation in TBI. J Neurol Sci. (2015) 359:280–6. to 90 days after traumatic brain injury. J Neurotrauma. (2017) 34:66–73.
doi: 10.1016/j.jns.2015.08.035 doi: 10.1089/neu.2015.4333
23. Nedergaard M. Garbage truck of the brain. Science. (2013) 340:1529–30. 41. Pattinson CL, Shahim P, Taylor P, Dunbar K, Guedes VA, Motamedi V,
doi: 10.1126/science.1240514 et al. Elevated tau in military personnel relates to chronic symptoms
24. Plog BA, Nedergaard M. The glymphatic system in central nervous system following traumatic brain injury. J Head Trauma Rehabil. (2020) 35:66–73.
health and disease: past, present, and future. Annu Rev Pathol. (2018) doi: 10.1097/HTR.0000000000000485
13:379–94. doi: 10.1146/annurev-pathol-051217-111018 42. Olivera A, Lejbman N, Jeromin A, French LM, Kim HS, Cashion A,
25. Iliff JJ, Wang M, Liao Y, Plogg BA, Peng W, Gundersen GA, et al. A et al. Peripheral total tau in military personnel who sustain traumatic
paravascular pathway facilitates CSF flow through the brain parenchyma and brain injuries during deployment. JAMA Neurol. (2015) 72:1109–16.
the clearance of interstitial solutes, including amyloid β. Sci Transl Med. doi: 10.1001/jamaneurol.2015.1383
(2012) 4:147ra111. doi: 10.1126/scitranslmed.3003748 43. Oliver JM, Jones MT, Anzalone AJ, Kirk KM, Gable DA, Repshas JT, et al. A
26. Jessen NA, Munk ASF, Lundgaard I, Nedergaard M. The glymphatic season of American football is not associated with changes in plasma tau. J
system: a beginner’s guide. Neurochem Res. (2015) 40:2583–99. Neurotrauma. (2017) 34:3295–300. doi: 10.1089/neu.2017.5064
doi: 10.1007/s11064-015-1581-6 44. Huibregtse ME, Nowak MK, Kim JE, Kalbfell RM, Koppineni A, Ejima
27. Dadas A, Janigro D. The role and diagnostic significance of cellular K, et al. Does acute soccer heading cause an increase in plasma
barriers after concussive head trauma. Concussion. (2018) 3:CNC53. S100B? A randomized controlled trial. PLoS ONE. (2020) 15:e0239507.
doi: 10.2217/cnc-2017-0019 doi: 10.1371/journal.pone.0239507
28. Albargothy NJ, Johnston DA, MacGregor-Sharp M, Weller RO, Verma A, 45. Puvenna V, Brennan C, Shaw G, Yang C, Marchi N, Bazarian JJ,
Hawkes CA, et al. Convective influx/glymphatic system: tracers injected et al. Significance of ubiquitin carboxy-terminal hydrolase L1 elevations
into the CSF enter and leave the brain along separate periarterial in athletes after sub-concussive head hits. PLoS ONE. (2014) 9:e96296.
basement membrane pathways. Acta Neuropathol. (2018) 136:139–52. doi: 10.1371/journal.pone.0096296
doi: 10.1007/s00401-018-1862-7 46. Kawata K, Rubin LH, Takahagi M, Lee JH, Sim T, Szwanki V, et al.
29. Hannocks MJ, Pizzo ME, Huppert J, Deshpande T, Abbott NJ, Thorne Subconcussive impact-dependent increase in plasma S100β levels
RG, et al. Molecular characterization of perivascular drainage pathways in collegiate football players. J Neurotrauma. (2017) 34:2254–2260.
in the murine brain. J Cereb Blood Flow Metab. (2018) 38:669–86. doi: 10.1089/neu.2016.4786
doi: 10.1177/0271678X17749689 47. Pattinson CL, Meier TB, Guedes VA, Lai C, Devoto C, Haight T, et al.
30. Morris AW, Sharp MM, Albargothy NJ, Fernandes R, Hawkes CA, Verma Plasma biomarker concentrations associated with return to sport following
A, et al. Vascular basement membranes as pathways for the passage of sport-related concussion in collegiate athletes-a concussion assessment,
fluid into and out of the brain. Acta Neuropathol. (2016) 131:725–36. research, and education (CARE) consortium study. JAMA Netw Open. (2020)
doi: 10.1007/s00401-016-1555-z 3:e2013191. doi: 10.1001/jamanetworkopen.2020.13191
Frontiers in Neurology | www.frontiersin.org 13 July 2021 | Volume 12 | Article 668606Azizi et al. Kinetic Modeling
48. Bogoslovsky T, Gill J, Jeromin A, Davis C, Diaz-Arrastia R. Fluid biomarkers 63. Layon AJ, Gabrielli A, Yu M, Wood KE. Civetta, Taylor, & Kirby’s
of traumatic brain injury and intended context of use. Diagnostics. (2016) 6:37. Critical Care Medicine. Philadelphia, PA: Lippincott Williams & Wilkins
doi: 10.3390/diagnostics6040037 (2017).
49. Papa L, Wang KK. Raising the bar for traumatic brain injury biomarker 64. Feldschuh J, Enson Y. Prediction of the normal blood volume. Relation
research: methods make a difference. J Neurotrauma. (2017) 34:2187–9. of blood volume to body habitus. Circulation. (1977) 56:605–12.
doi: 10.1089/neu.2017.5030 doi: 10.1161/01.CIR.56.4.605
50. Mondello S, Sorinola A, Czeiter E, Vámos Z, Amrein K, Synnot A, et al. Blood- 65. Saltelli A, Ratto M, Andres T, Campolongo F, Cariboni J, Gatelli D, et al. Global
based protein biomarkers for the management of traumatic brain injuries in Sensitivity Analysis: The Primer. West Sussex: John Wiley & Sons (2008).
adults presenting to emergency departments with mild brain injury: a living doi: 10.1002/9780470725184
systematic review and meta-analysis. J Neurotrauma. (2018) 38:1086–106. 66. Partial Correlation. The Concise Encyclopedia of Statistics.
doi: 10.1089/neu.2017.518 New York, NY: Springer (2008). Available online at:
51. Gan ZS, Stein SC, Swanson R, Guan S, Garcia L, Mehta D, et al. https://doi.org/10.1007/978-0-387-32833-1_309. doi: 10.1007/978-0-387-
Blood biomarkers for traumatic brain injury: a quantitative assessment 32833-1
of diagnostic and prognostic accuracy. Front Neurol. (2019) 10:446. 67. Broglio SP, McCrea M, McAllister T, Harezlak J, Katz B, Hack D, et al. A
doi: 10.3389/fneur.2019.00446 National study on the effects of concussion in collegiate athletes and US
52. O’Connell B, Kelly ÁM, Mockler D, Orešič M, Denvir K, Farrell G, et al. Use of military service academy members: the NCAA-DOD concussion assessment,
blood biomarkers in the assessment of sports-related concussion-a systematic research and education (CARE) consortium structure and methods. Sports
review in the context of their biological significance. Clin J Sport Med. (2018) Med. (2017) 47:1437–51. doi: 10.1007/s40279-017-0707-1
28:561–71. doi: 10.1097/JSM.0000000000000478 68. FITBIR. Federal Interagency Traumatic Brain Injury Research. (2019).
53. Maas AI, Lingsma HF. ALERT-TBI study on biomarkers for TBI: has science (Accessed September 20, 2019).
suffered? Lancet Neurol. (2018) 17:737. doi: 10.1016/S1474-4422(18)30275-8 69. Cleveland WS. LOWESS: A program for smoothing scatterplots by
54. Ercole A, Thelin E, Holst A, Bellander B, Nelson D. Kinetic modelling robust locally weighted regression. Am Stat. (1981) 35:54. doi: 10.2307/
of serum S100B after traumatic brain injury. BMC Neurol. (2016) 16:93. 2683591
doi: 10.1186/s12883-016-0614-3 70. Strimbu K, Tavel JA. What are biomarkers? Curr Opin
55. Dadas A, Washington J, Marchi N, Janigro D. Improving the clinical HIV AIDS. (2010) 5:463. doi: 10.1097/COH.0b013e32833
management of traumatic brain injury through the pharmacokinetic ed177
modeling of peripheral blood biomarkers. Fluids Barriers CNS. (2016) 13:21. 71. Wang KK, Yang Z, Zhu T, Shi Y, Rubenstein R, Tyndall JA, et al. An
doi: 10.1186/s12987-016-0045-y update on diagnostic and prognostic biomarkers for traumatic brain injury.
56. Hladky SB, Barrand MA. Mechanisms of fluid movement into, through and Expert Rev Mol Diagn. (2018) 18:165–80. doi: 10.1080/14737159.2018.14
out of the brain: evaluation of the evidence. Fluids Barriers CNS. (2014) 11:26. 28089
doi: 10.1186/2045-8118-11-26 72. Lindblad C, Nelson DW, Zeiler FA, Ercole A, Ghatan PH, von Horn
57. Bacyinski A, Xu M, Wang W, Hu J. The paravascular pathway for brain H, et al. Influence of blood-brain barrier integrity on brain protein
waste clearance: current understanding, significance and controversy. Front biomarker clearance in severe traumatic brain injury: a longitudinal
Neuroanat. (2017) 11:101. doi: 10.3389/fnana.2017.00101 prospective study. J Neurotrauma. (2020) 37:1381–91. doi: 10.1089/neu.201
58. Elbarbry F. ABCs of Pharmacokinetics. Scott Valley, CA: CreateSpace (2017). 9.6741
59. Rosenbaum SE. Basic Pharmacokinetics and Pharmacodynamics: An 73. Box GEP. Science and statistics. J Am Stat Assoc. (1976) 71:791–9.
Integrated Textbook and Computer Simulations. West Sussex: John Wiley & doi: 10.1080/01621459.1976.10480949
Sons (2016).
60. Weller RO, Kida S, Zhang ET. Pathways of fluid drainage from the brain- Conflict of Interest: The authors declare that the research was conducted in the
morphological aspects and immunological significance in rat and man. Brain absence of any commercial or financial relationships that could be construed as a
Pathol. (1992) 2:277–84. doi: 10.1111/j.1750-3639.1992.tb00704.x potential conflict of interest.
61. Knopf P, Cserr H, Nolan S, Wu T, Harling-Berg C. Physiology and
immunology of lymphatic drainage of interstitial and cerebrospinal Copyright © 2021 Azizi, Hier, Allen, Obafemi-Ajayi, Olbricht, Thimgan and
fluid from the brain. Neuropathol Appl Neurobiol. (1995) 21:175–80. Wunsch. This is an open-access article distributed under the terms of the Creative
doi: 10.1111/j.1365-2990.1995.tb01047.x Commons Attribution License (CC BY). The use, distribution or reproduction in
62. Boulton M, Flessner M, Armstrong D, Hay J, Johnston M. Lymphatic drainage other forums is permitted, provided the original author(s) and the copyright owner(s)
of the CNS: effects of lymphatic diversion/ligation on CSF protein transport are credited and that the original publication in this journal is cited, in accordance
to plasma. Am J Physiol Regul Integr Compar Physiol. (1997) 272:R1613–9. with accepted academic practice. No use, distribution or reproduction is permitted
doi: 10.1152/ajpregu.1997.272.5.R1613 which does not comply with these terms.
Frontiers in Neurology | www.frontiersin.org 14 July 2021 | Volume 12 | Article 668606You can also read