Aberrant functional brain connectome in people with antisocial personality disorder
←
→
Page content transcription
If your browser does not render page correctly, please read the page content below
www.nature.com/scientificreports

              OPEN             Aberrant functional brain
                               connectome in people with
                               antisocial personality disorder
 received: 03 December 2015    Yan Tang1,2, Jun Long3, Wei Wang1, Jian Liao1, Hua Xie4, Guihu Zhao3 & Hao Zhang3
     accepted: 27 April 2016
     Published: 03 June 2016
                               Antisocial personality disorder (ASPD) is characterised by a disregard for social obligations and
                               callous unconcern for the feelings of others. Studies have demonstrated that ASPD is associated
                               with abnormalities in brain regions and aberrant functional connectivity. In this paper, topological
                               organisation was examined in resting-state fMRI data obtained from 32 ASPD patients and 32 non-
                               ASPD controls. The frequency-dependent functional networks were constructed using wavelet-based
                               correlations over 90 brain regions. The topology of the functional networks of ASPD subjects was
                               analysed via graph theoretical analysis. Furthermore, the abnormal functional connectivity was
                               determined with a network-based statistic (NBS) approach. Our results revealed that, compared
                               with the controls, the ASPD patients exhibited altered topological configuration of the functional
                               connectome in the frequency interval of 0.016–0.031 Hz, as indicated by the increased clustering
                               coefficient and decreased betweenness centrality in the medial superior frontal gyrus, precentral gyrus,
                               Rolandic operculum, superior parietal gyrus, angular gyrus, and middle temporal pole. In addition, the
                               ASPD patients showed increased functional connectivity mainly located in the default-mode network.
                               The present study reveals an aberrant topological organisation of the functional brain network in
                               individuals with ASPD. Our findings provide novel insight into the neuropathological mechanisms of
                               ASPD.

                               People with antisocial personality disorder (ASPD) often display symptoms of callousness, social anhedonia, irri-
                               tability and impulsivity1. Previous neuroimaging studies have suggested the behavioural abnormalities of ASPD
                               might have a neurobiological basis potentially involving structural, metabolic and functional abnormalities2.
                               Mounting evidence indicates that these abnormalities are related to deficits in the prefrontal cortex, temporal
                               cortex, insula, angular gyrus, parahippocampus, and anterior/posterior cingulate gyrus. In our previous studies,
                               we investigated ASPD-related changes in the regional homogeneity (ReHo) by using resting-state functional
                               MRI (R-fMRI) data, and we found that the ASPD individuals show reduced ReHo in the middle frontal gyrus
                               and elevated ReHo in the inferior temporal gyrus3. In another functional connectivity study4, we determined that
                               ASPD-associated changes occur primarily within and across the default-mode network (DMN). These findings
                               provide new evidence for a disrupted resting-state functional connectivity in people with ASPD, as well as dis-
                               rupted functional integrity among widely distributed brain regions. However, it remains unknown whether an
                               aberrant topological organisation and abnormal assemblages exist within the connectivity networks of ASPD.
                                  Graph theoretical analysis is a powerful tool for exploring the topological architecture of brain networks 5
                               and the full connectivity of networks at a system level. Bullmore et al.6 have demonstrated that the functional
                               networks directly supporting the neurophysiological dynamics of the brain show features of complex networks,
                               such as small-world topology. Moreover, recent studies have indicated that several brain diseases are associated
                               with an aberrant topological organisation pattern in the functional connectome. Such findings have deepened
                               understanding of the human connectome in diseases including Alzheimer’s disease, schizophrenia, anxiety dis-
                               orders, and depressive disorders. Hence, to better understand the topological organisation of ASPD, graph theory
                               analysis was applied to explore the functional connectome in ASPD.

                               1
                                Department of Neurology, Xiangya Hospital, Central South University, Changsha, Hunan 410078, China.
                               2
                                Biomedical Engineering Laboratory, School of Geosciences and Info-physics, Central South University, Changsha,
                               Hunan 410083, China. 3School of Information Science and Engineering, Central South University, Changsha, Hunan
                               410083, China. 4Department of Electrical and Computer Engineering, Texas Tech University, Lubbock, TX 79409,
                               USA. Correspondence and requests for materials should be addressed to J.L. (email: jlong@csu.edu.cn)

Scientific Reports | 6:26209 | DOI: 10.1038/srep26209                                                                                         1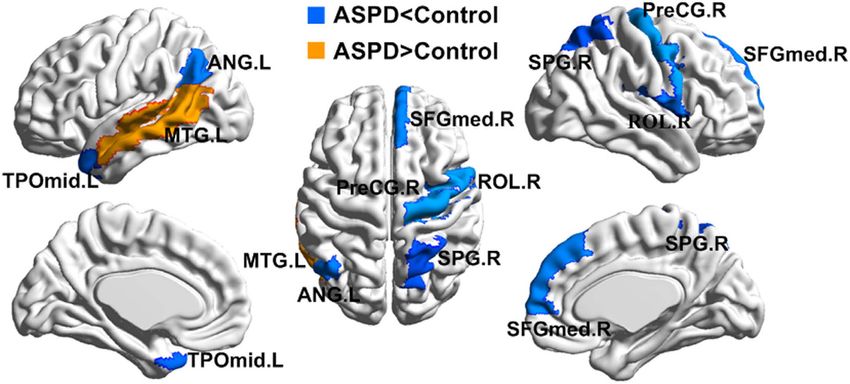
www.nature.com/scientificreports/
ASPD (n = 32) Controls (n = 32) t p
Age (year) 20.5 ± 1.37 21.67 ± 2.54 −0.92 0.36
Education level (year) 8.15 ± 1.54 8.73 ± 0.82 −0.82 0.45
Mean global IQ score 106.66 ± 12.90 106.84 ± 16.6 −0.50 0.51
Antisocial scale of PDQ 5.90 ± 0.4 2.06 ± 0.9 13.80 0.05). Notably, the score of the antisocial
scale, determined by the PDQ (Personality Diagnostic Questionnaire), was significantly higher in the ASPD
group (p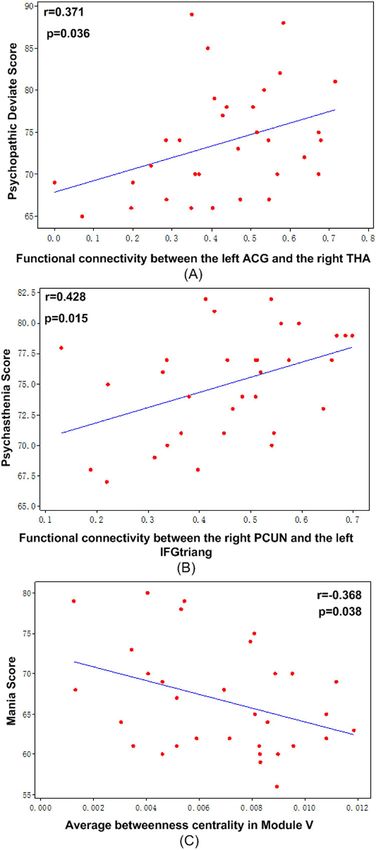
www.nature.com/scientificreports/
Figure 2. Brain regions showing the abnormal nodal betweenness centrality in ASPD compared with
controls (p < (1/N) = 0.011). ANG.L: left angular gyrus; MTG.L: left middle temporal gyrus; TPOmid.L: left
middle temporal pole; SFGmed.R: right medial superior frontal gyrus; PreCG.R: right precental gyrus; ROL.R:
right Rolandic operculum; SPG.R: right superior parietal gyrus; ASPD: Antisocial Personality Disorder.
can capture the characteristics and organisational changes in the functional network. In some reports, e.g., Liao
et al.10, He et al.11, and Cao et al.12, the topological parameters have been analysed without normalisation despite
the different number of connections reported between the disease and control groups. Thus, normalisation was
not used in the subsequent network topological analyses.
Topological organisation of the functional connectome. Both ASPD and control subjects demon-
strated typical features of small-worldness topology, as indicated by γ > 1 and λ ≈ 1. However, the ASPD group
showed a significant decrease in γ (p = 0.0037) and σ (p = 0.0017). Additional comparisons revealed a signifi-
cantly increased Eglob (p = 0.016), Eloc (p = 0.017) and Cp (p = 0.007) but a decreased Lp (p = 0.0497) in the func-
tional brain networks of ASPD versus control subjects (Table 2, in Supplementary Fig. S1).
Between-group differences in betweenness centrality. The significance of the differences between
groups in these metrics and at each region was tested using two-sample t tests. The statistical significance was
corrected for multiple comparisons using a false-positive adjustment13,14 of p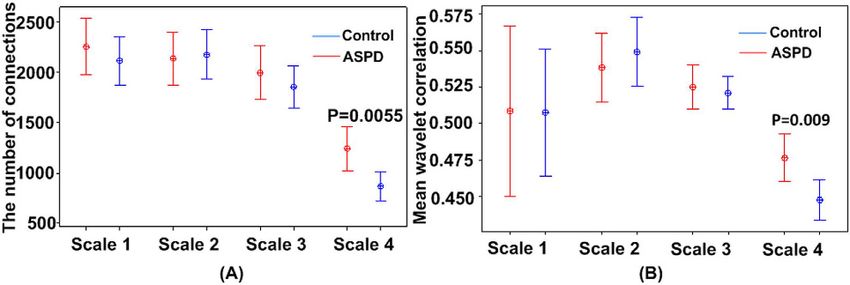
www.nature.com/scientificreports/
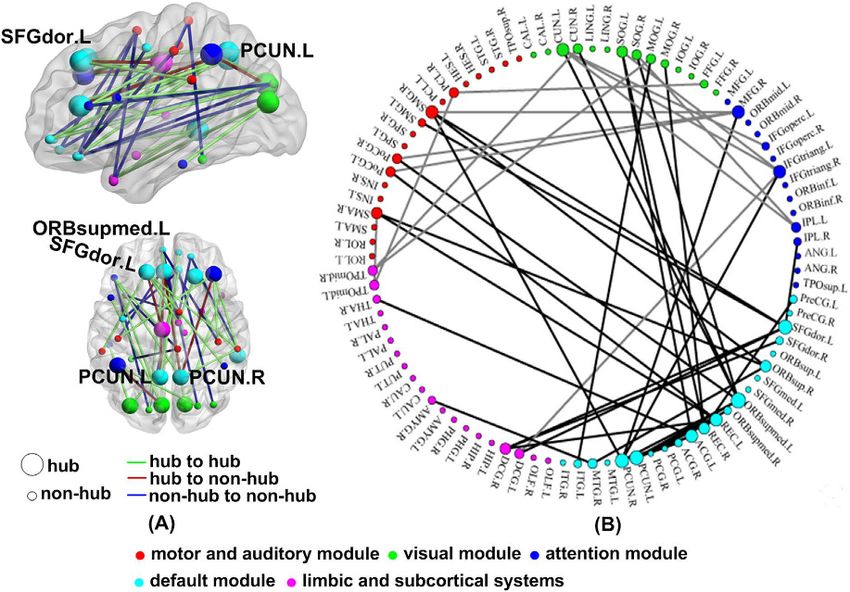
Figure 3. ASPD subjects showed aberrant functional networks according to the network-based statistical
(NBS) analysis method and under a liberal primary threshold of (p < 5 × 10⁻⁴). Regions are colour-coded
by category. The line represents the functional connection. (A) A single network of 47 connections is presented.
(B) Ninety brain regions are displayed, containing five modules in a circle graph. The abnormal functional
connection is demonstrated with a line. The greater the number of connections in a region, the larger the region
is. ASPD: Antisocial Personality Disorder.
Figure 4. The between-group differences (p < (1/N) = 0.011) in the averages betweenness centralities.
Significant differences were found in Module III (p = 0.0022), Module I (p = 0.0034) and Module V
(p = 0.0041). Module I: somatosensory and auditory module; Module II: visual module; Module III: attention
module; Module IV: default-mode network module; Module V: limbic/paralimbic and subcortical systems.
ASPD: Antisocial Personality Disorder.
connections (Euclidean distance > 75 mm)11. In the subsequent analyses, these abnormal functional connec-
tions were divided into three groups: links between the hubs, between the hub and non-hub, and between the
non-hubs. We found the aberrant connections were predominantly links between the hubs and non-hubs (hub
to hub: 5; hub to non-hub: 33; non-hub to non-hub: 14). Additionally, these abnormal connections were mostly
considered to be intermodule connections between the DMN and the other networks (Fig. 3B).
Correlation between topological metrics and clinical variables. None of the global topological
metrics were significantly correlated with the scores for all mental disorders, which included hypochondria-
sis, depression, hysteria, psychopathic deviate, masculinity-femininity, paranoia, psychasthenia, schizophrenia,
mania, and social introversion. The functional connectivity between the right precuneus and the left inferior fron-
tal gyrus was positively correlated with the psychasthenia score (p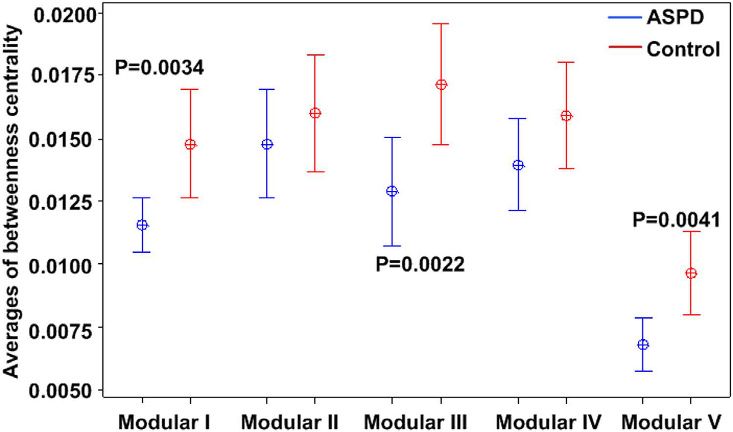
www.nature.com/scientificreports/

                              Figure 5. Correlations between the topological metrics and clinical variables. (A) The functional
                              connectivity between the left anterior cingulate gyrus and the right thalamus was positively (p
www.nature.com/scientificreports/
Parcellation Eglob Eloc Lp Cp λ γ σ
B 0.52 ± 0.136 0.70 ± 0.145 2.19 ± 0.645 0.56 ± 0.130 1.12 ± 0.127 1.50 ± 0.494 1.32 ± 0.372
ASPD
W 0.29 ± 0.080 0.42 ± 0.072 0.833 ± 0.203 0.316 ± 0.072 1.07 ± 0.084 1.46 ± 0.534 1.34 ± 0.411
B 0.45 ± 0.018 0.620 ± 0.135 2.42 ± 0.410 0.49 ± 0.117 1.14 ± 0.06 1.95 ± 0.799 1.7 ± 0.656
Control
W 0.25 ± 0.055 0.38 ± 0.066 0.90 ± 0.141 0.27 ± 0.062 1.09 ± 0.045 1.65 ± 0.550 1.50 ± 0.472
B 0.016* 0.017* 0.0497* 0.007* 0.317 0.0037* 0.0017*
p value
W 0.0086* 0.03* 0.0448* 0.008* 0.231 0.0027* 0.0011*
Table 2. Comparisons of the global network metrics among the control and ASPD group in wavelet scale
four. Data are expressed as the mean ± SD. (*pwww.nature.com/scientificreports/
Unlike previous studies of structural, metabolic and functional abnormalities, the abnormal nodal between-
ness in ASPD subjects was examined in our study to evaluate the influence of a node on the information flow
between the remaining nodes in a network. Nevertheless, the nodal betweenness was significantly positively
correlated with blood flow and metabolism30. Our observations extended the current understanding of the neu-
roanatomical features of individuals with ASPD. All of the abnormal ROIs were related to the symptoms of dep-
ersonalisation (Supplementary Discussion). The abnormal nodal betweenness may suggest high impulsivity, lack
of conscience, and cold-bloodedness in ASPD.
Additionally, to characterise the local properties of the network and to assess the potential effects of the nodes
on the network dynamics, the average within-module betweenness centrality was investigated to reveal informa-
tion flow patterns in brain networks. The average within-module betweenness centrality is high when many nodes
in the module are on the network’s shortest paths, which means many nodes in the module act as the “bridges”
along pathways with the strongest coupling. Therefore, the analysis of the changes in the average betweenness
centrality in a given module reflects the role of the module in the transfer of information through the network. In
our study, some modules in ASPD subjects, such as the somatosensory and auditory modules, attention module
and limbic and subcortical systems, showed a decreased betweenness centrality. These alterations corresponded
to the changes in the functional organisation of the brain network in ASPD subjects. Pham TH31 has provided
support for the hypothesis of selective attention and specific executive function deficits among subjects with
ASPD through a series of psychological scales. Specifically, previous studies have found that ASPD patients have
a deficiency in the orbitofrontal cortex and dorsolateral prefrontal cortex32,33, which constitutes the attention
module. These lesions may be the main cause of disinhibited, impulsive and unconcerned behaviours in subjects
with ASPD34,35, a neurological syndrome significantly defined as an “acquired sociopathy”36. It has been argued
that the deficiency in the attention module may lead to poor cognitive control and reduced attention in individ-
uals with antisocial personalities. Furthermore, many personality disorders involve a dysfunction of subcortical
structures or the limbic or paralimbic cortex37,38. Starkstein et al.39 have observed hypometabolism in subcortical
structures with increased irritability. In this study, it was found that the decreased average betweenness centrality
in the limbic or paralimbic cortex was associated with increased erratic emotions in ASPD subjects. Therefore, it
is argued that the deficient information exchange in the limbic and subcortical systems may be related to ASPD
individuals being irritable, capricious and impulsive.
However, via the NBS analysis, most of the connections with significantly increased functional connectivity
were long-distance connections and between the hub and non-hub nodes. ASPD was associated with a reorgani-
sation of the hub structure (Supplemental Fig. S2), which has been suggested to form during childhood in ASPD
patients40,41. The fine-tuning of connections between functional hubs and non-hub regions may influence and
support developmental improvements in cognition40. Specifically, theses abnormal links occurred predominately
between the DMN and other functional modules, consistently with results from our previously study4. The DMN
is related to emotional regulation, future planning, self-inspection42, and mind-wandering43. Moreover, the func-
tional connectivity between the right precuneus and the left inferior frontal gyrus (triangular part) was positively
correlated with the psychasthenia score, and the functional connectivity between the left anterior cingulate gyrus
and the right thalamus was positively correlated with the psychopathic deviate score. As part of the DMN and the
“hub”, the precuneus was involved in self-consciousness, and the anterior cingulate gyrus was in charge of conflict
monitoring. Therefore, these increased connections between the DMN and other networks may be interpreted as
facilitating transmission of conflicted emotions and hampering the ability to control impulses, which manifests
as irritability and impulsivity in subjects with ASPD.
Together, our results suggest that an abnormal functional network, such as increased connections in the
DMN and decreased betweenness centrality in the limbic systems and attention module, might lead to inflated
self-appraisal, disregard for the rights of others and a lack of empathy, which are characteristics of subjects with
ASPD.
Several issues need to be addressed. Mounting evidence suggests that functional connectivity correlates with
structural (anatomical) connectivity patterns at an aggregate level44,45, and structural networks help to understand
the fundamental architecture of inter-regional connections6. Therefore, more attention should be paid to the rela-
tionship between the structural and functional connectomics in subjects with ASPD in future studies.
To our knowledge, our work is the first to explore frequency-dependent topological alterations in people
with ASPD. Compared with the control group of subjects matched for age, gender and education level, the group
containing individuals with ASPD showed both global and regional topological alterations in the specific and
most salient frequency range between 0.016 and 0.031 Hz. Our findings not only provide novel insight into the
neuropathological mechanisms of ASPD but also highlight the importance of frequency-dependent information
when investigating ASPD.
Materials and Methods
Subjects. In total, 320 volunteers were recruited for the experiment from the School for Youth Offenders of
Hunan Province. All volunteers had received reformatory education in this school because they had committed
misdemeanours. All young offenders had regular daily school hours. “Enclosed-style” management was imple-
mented in this special school. In this study, participants selected for the fMRI experiments were accompanied by
three teachers as they underwent fMRI scanning. All subjects were of legal age to give consent (age > 18) at the
time of the experiment, but they were under the legal age when they first began attending the school.
First, all volunteers were tested in groups by an experienced psychological testing professional using the
Personality Diagnostic Questionnaire-4+ (PDQ-4+). Among the 320 subjects, 122 received an ASPD score that
was equal to or greater than four, whereas the other subjects were excluded from the study. The remaining 122
subjects received further testing with the Personality Disorder Interview (PDI-IV)46, which was conducted by
two senior psychiatrists. The inter-rater consistency of the score of the PDI-IV was 0.897. From these subjects,
Scientific Reports | 6:26209 | DOI: 10.1038/srep26209 7www.nature.com/scientificreports/
45 were selected based on a diagnosis of ASPD and because they did not have a history or current diagnosis of
a serious mental disorder (e.g., depression or anxiety neurosis). However, the data for 13 ASPD of these 45 sub-
jects were removed because they had movement-related artefacts that were identified in post-scanning (see Data
Preprocessing). Therefore, the final experimental population for this study consisted of 32 ASPD individuals.
Meanwhile, to further investigate mental disorders in individuals with ASPD, the 32 ASPD subjects completed
handwritten versions of the MMPI-2 (Minnesota Multiphasic Personality Inventory) questionnaires47. The relia-
bility, cross-instrument validity and factor structure of Chinese adaptations of the PDQ-4 and PDI- IV in psychi-
atric patients have been evaluated by Yang et al.48, who have suggested that the psychometric properties of these
two instruments are comparable across different cultures.
The remaining 198 volunteers who did not meet the ASPD criteria of the PDQ-4+were also tested with the
PDI-IV. Fifty participants with no history or current diagnosis of a serious mental disorder, (e.g., depression or
anxiety neurosis), were selected as the non-ASPD controls. Eighteen control subjects also were removed because
they exhibited movement-related artefacts that were identified in post-processing (see Data Preprocessing), and
32 subjects remained as the control group.
All participants were male and native Chinese speakers, and they had no access to alcohol or illicit drugs for
at least six months prior to the brain scan. Overall, the participants were strongly right-handed, as judged by
the Lateral Dominance Test49 and had normal or corrected-to-normal vision. In addition, a short version of the
Wechsler Adult Intelligence-Scale Revised in China (WAIS-RC)50, including four combinations of information,
similarities, picture completion and block design subtests, was used to measure the intelligence quotient (IQ) of
all volunteers.
After receiving a detailed description of the study, all volunteers provided written informed consent. All the
potential participants made the choice based on their free will, and those who declined to participate or did not
participate for other reasons were treated in the same way as those who participated. Written informed consent,
was obtained from each subject before the experiment. All experimental protocols were approved by the research
ethical committee of Central South University of China. The methods were carried out in accordance with the
approved guidelines.
Image acquisition. Each participant underwent an R-fMRI scan using a Siemens Avanto 1.5-T system
at the Xiangya Hospital of Central South University, Changsha, with the following parameters: TR = 2000 ms,
TE = 50 ms, slice thickness = 5 mm, flip angle = 90°, matrix = 64 × 6 4, slices number = 2 3, and voxel
size = 3.75 × 3.75 × 6.25 mm. For each participant, 150 image volumes were acquired over five minutes. During
data acquisition, all subjects were instructed to keep their eyes closed, relax their minds and move as little as
possible.
The structural data were acquired by T1-weighted brain MRI scans using a standard sagittal 3D MP-RAGE
sequence (TR = 2400 ms, TE = 3.61 ms, flip angle = 8°, FOV = 240 × 240 mm, slice thickness = 1.2 mm, slices
number = 160, voxel size = 1 × 1 × 1 mm).
Data preprocessing. The fMRI images were pre-processed using the SPM8 package (www.fil.ion.ucl.
ac.uk/spm; Wellcome Trust Centre for Neuroimaging, University College London, United Kingdom) and Data
Processing Assistant for Resting-State fMRI (DPARSF)51 (http://www.restfmri.net). For each subject, the first five
volumes of the scanned data were discarded because of T1 equilibration effects, leaving 145 images available for
the analysis. Subsequent data preprocessing steps included within-subject slice timing, head motion correction
and between-subject spatial normalisation to the standard Montreal Neurological Institute (MNI) template with
a resampled voxel size of 3 × 3 × 3 mm.
After the head motion correction procedure, the magnitude of head motion at each time point was deter-
mined for each subject by using six parameters (three for shift and three for rotation). Subjects with head motion
exceeding a maximum displacement of 1 mm at any axis and the angular motion of 1° in any direction were
excluded from the further analysis, based on which 13 ASPD subjects and 18 control subjects were excluded,
leaving 32 ASPD subjects and 32 control subjects. The average head motion parameters of shift and rotation were
then calculated, but they showed no significant differences in head motion between the two groups (p > 0.05).
Detrending and temporal high-pass filtering (HPF cutoff frequency = 0.01 Hz) were applied.
Network construction. Given the concerns of the accuracy of the result of the affine linear registration on
the cerebellum52, a subset of 90 non-cerebellar regions-of-interest (ROIs) as the nodes in brain networks (45 for
each hemisphere, according to AAL atlas53) were used to investigate abnormal functions in ASPD individuals.
The mean time series were obtained for each subject by averaging the fMRI time series across all voxels in
each of the 90 regions. Six head motion parameters were regressed out from the extracted time series as nuisance
covariates. The global signal was kept in our analysis to avoid the anti-correlations trend caused by removing
global signal during the preprocessing of R-fMRI data54,55 and coincide with results from previous studies of
wavelet-based functional brain network studies.
The maximal overlap discrete wavelet transform (MODWT) over the first four scales was applied to the
mean time series of each ROI. The resulted frequency range of the kth scale of the wavelet decomposition was
[2(−k−1)/TR, 2(−k)/TR] corresponding to four scales (scale 1, 0.125–0.250 Hz; scale 2, 0.063–0.125 Hz; scale 3,
0.031–0.063 Hz; and scale 4, 0.016–0.031 Hz)8. The wavelet coefficient was used as a measure of functional con-
nectivity23. Inter-regional pairwise Pearson correlations and their corresponding statistical significance levels
(i.e., p values) were computed for each of the four scales, which led to four 90 × 90 correlation matrices for each
subject. A detailed description can be found in Percival and Walden8 and is available in the waveslim package in
the R language (www.cran.r-project.org).
Scientific Reports | 6:26209 | DOI: 10.1038/srep26209 8www.nature.com/scientificreports/
The binary connection matrix can capture the underlying functional connectivity patterns of the human
brain11 and facilitate understanding of complex systems, which was constructed from the correlation matrix in
our initial study. The p value, instead of the correlation coefficient, was used as a threshold because it allows for a
greater certainty of the inner-correlation between two ROIs10. He et al.9 have shown that the networks produced
with the same p value threshold also capture the network characteristics and the organisational changes in the
functional network.
Because the correlation analysis was performed over all 90 × 89/2 = 4005\combinations of ROIs, a multiple
comparisons correction was needed to test the significance of these correlations. A strict Bonferroni correction
was applied for multiple comparisons with the threshold equal to 0.05/4005 = 1.2484 × 10⁻⁵ to remove spurious
correlations. Using this threshold (p 1, normalised charac-
Cp
Lp γ
teristic path length λ = ≈ 1 and small-worldness index σ = > 1.
L rand λ
p
The regional characteristics of the brain networks that measure a given node connecting with all other nodes
may indicate the importance of specific brain areas in the network. To characterise the local properties of nodes,
the betweenness centrality was adopted, which is defined as the fraction of all shortest paths in the network. It
is important to note that such a definition is very different from a measure based on degree in which only the
number of connections is taken into account. Thus, betweenness centrality is less sensitive to the eventual infla-
tion induced by the community size56. Betweenness centrality Bi, where i is defined as the fraction of all shortest
paths in the network, is a relatively more sensitive measure than other metrics to identify central nodes25, which
is calculated as follows:
1 ρ hj (i)
Bi =
(n − 1)(n − 2)
∑ ρ hj
h ,j∈ N
h≠j ,h≠i ,j ≠i (2)
where ρhj is the number of shortest paths between node h and node j, and ρ hj (i) is the number of shortest paths
between node h and node j that pass through node i. Therefore, betweenness centrality may be normalised to the
range [0, 1].
To identify highly central nodes in a network, the betweenness centrality was further normalised as follows:
Bi
bi =
< B> (3)
where is the average betweenness centrality of the network. In this paper, bi of the cortical region for each
participant was examined and then averaged across the two groups. The ROIs with the large normalised between-
ness centrality were identified as hubs (bi > 1.5, i.e., a node with 1.5 times greater than the average betweenness
centrality of the network)57. The altered hubs in the topological organisation were focused.
In addition, the mean betweenness centrality in different modules of the network was also investigated using
a modular architecture which was derived from the resting-state functional connectome modularity study15,
including the following five modules: Module I, the somatosensory and auditory module; Module II, the visual
module; Module III, the attention module; Module IV, DMN module; and Module V, the limbic/paralimbic and
subcortical systems. Between-group differences of the average betweenness centrality within modules were fur-
ther identified.
Statistical analysis. The significant differences in the topological attributes of the group (both global and
nodal measures) were determined via nonparametric permutation tests. For each network metric, the mean val-
ues of the between-group differences were computed, which were randomly reallocated into two groups, and
the mean differences between the two randomised groups were calculated. This randomisation procedure was
repeated 10,000 times, and the 95th percentile points of the empirical distribution were used as the critical values
for a one-tailed test of the null hypothesis with a probability of a type I error of 0.05.
Scientific Reports | 6:26209 | DOI: 10.1038/srep26209 9www.nature.com/scientificreports/
An abnormal functional connectivity in ASPD individuals was identified using the NBS approach, the techni-
cal details of which are described in a previous publication58. In brief, a primary threshold was first used to deter-
mine a set of supra threshold links, within which any connected components, as well as their sizes (number of
links), were then determined. To estimate the significance of each component, a corrected p value was calculated
using the null distribution of the maximally connected component size, which was empirically derived from the
aforementioned nonparametric permutation approach (10,000 permutations).
When significant between-group differences were observed in any network metrics, the relationships between
these metrics and clinical variables (the scores of mental disorder in the MMPI-2 such as hypochondriasis,
depression, hysteria, psychopathic deviate, masculinity-femininity, paranoia, psychasthenia, schizophrenia,
mania, and social introversion) were further analysed. Multiple linear regression analyses with age as a con-
founding factor were performed.
Reproducibility. Three effects were discussed to validate the reproducibility of our results. First, the effects
of using different regional parcellation were evaluated, which might pose influence on the brain graph metrics,
and two additional parcellation schemes, including the L-Crad (200 nodes)16 and H-1024 (1024 nodes)17, were
employed to reanalyse the data and explore the reproducibility of our findings.
Second, the weights in functional networks representing respective magnitudes of correlational interactions
were used to build a weighted network. Because the weighted characterisation usually focused on somewhat
different and complementary aspects of network organisation, the parameters of topological organisations in the
weighted networks were recalculated, and the difference was compared between the ASPD and control group.
Third, head motion effects were considered. Recently, several R-fMRI studies have reported the influence of
head motion on the calculated functional connectivity19. To evaluate the substantial effects of head motion on our
results, a “scrubbing” method was performed on the pre-processed images. For each subject, the pre-processed
functional images with a frame-wise displacement between two time points greater than 0.5 mm were replaced by
linear interpolating frames19. Then, the resulting “scrubbed” data were reanalysed.
References
1. Brady, K. T., Myrick, H. & McElroy, S. The relationship between substance use disorders, impulse control disorders, and pathological
aggression. Am J Addict 7, 221–230, doi: 10.1111/j.1521-0391.1998.tb00340.x (1998).
2. Müller, J. L. et al. Gray matter changes in right superior temporal gyrus in criminal psychopaths. Evidence from voxel-based
morphometry. PSYCHIAT RES:NEUROIM 163, 213–222, doi: 10.1016/j.pscychresns.2007.08.010 (2008).
3. Tang, Y. et al. Altered spontaneous activity in antisocial personality disorder revealed by regional homogeneity. Neuroreport 24,
590–595, doi: 10.1097/WNR.0b013e3283627993 (2013).
4. Tang, Y., Jiang, W., Liao, J., Wang, W. & Luo, A. Identifying individuals with antisocial personality disorder using resting-state FMRI.
PLos one 8, e60652, doi: 10.1371/journal.pone.0060652 (2013).
5. Sporns, O., Tononi, G. & Kötter, R. The human connectome: a structural description of the human brain. PLos Comp. Biol. 1, e42,
doi: 10.1371/journal.pcbi.0010042 (2005).
6. Bullmore, E. & Sporns, O. Complex brain networks: graph theoretical analysis of structural and functional systems. Nat. Rev.
Neurosci. 10, 186–198, doi: 10.1038/nrn2575 (2009).
7. Han, Y. et al. Frequency-dependent changes in the amplitude of low-frequency fluctuations in amnestic mild cognitive impairment:
a resting-state fMRI study. Neuroimage 55, 287–295, doi: 10.1016/j.neuroimage.2010.11.059 (2011).
8. Percival, D. B. & Walden, A. T. Wavelet methods for time series analysis. Vol. 4, 594 (Cambridge university press, 2006).
9. He, Y. et al. Impaired small-world efficiency in structural cortical networks in multiple sclerosis associated with white matter lesion
load. Brain 132, 3366–3379, doi: 10.1093/brain/awp089 (2009).
10. Liao, W. et al. Altered functional connectivity and small-world in mesial temporal lobe epilepsy. PLos one 5, e8525, doi: 10.1371/
journal.pone.0008525 (2010).
11. He, Y., Chen, Z. J. & Evans, A. C. Small-world anatomical networks in the human brain revealed by cortical thickness from MRI.
Cereb. Cortex 17, 2407–2419, doi: 10.1093/cercor/bhl149 (2007).
12. Cao, M. et al. Topological organization of the human brain functional connectome across the lifespan. Dev Cogn Neurosci 7, 76–93,
doi: 10.1016/j.dcn.2013.11.004 (2014).
13. Fornito, A., Yoon, J., Zalesky, A., Bullmore, E. T. & Carter, C. S. General and specific functional connectivity disturbances in first-
episode schizophrenia during cognitive control performance. Biol. Psychiatry 70, 64–72, doi: 10.1016/j.biopsych.2011.02.019 (2011).
14. Lynall, M.-E. et al. Functional connectivity and brain networks in schizophrenia. J. Neurosci. 30, 9477–9487, doi: 10.1523/
JNEUROSCI.0333-10.2010 (2010).
15. He, Y. et al. Uncovering intrinsic modular organization of spontaneous brain activity in humans. PLos one 4, e5226, doi: 10.1371/
journal.pone.0005226 (2009).
16. Craddock, R. C., James, G. A., Holtzheimer, P. E., Hu, X. P. & Mayberg, H. S. A whole brain fMRI atlas generated via spatially
constrained spectral clustering. Hum. Brain Mapp. 33, 1914–1928, doi: 10.1002/hbm.21333 (2012).
17. Zalesky, A. et al. Whole-brain anatomical networks: does the choice of nodes matter? Neuroimage 50, 970–983, doi: 10.1016/j.
neuroimage.2009.12.027 (2010).
18. Li, Y. et al. Brain anatomical network and intelligence. PLos Comp. Biol. 5, e1000395, doi: 10.1371/journal.pcbi.1000395 (2009).
19. Power, J. D., Barnes, K. A., Snyder, A. Z., Schlaggar, B. L. & Petersen, S. E. Spurious but systematic correlations in functional
connectivity MRI networks arise from subject motion. NeuroImage 59, 2142–2154, doi: 10.1016/j.neuroimage.2011.10.018 (2012).
20. Zuo, X.-N. et al. The oscillating brain: complex and reliable. Neuroimage 49, 1432–1445, doi: 10.1016/j.neuroimage.2009.09.037
(2010).
21. Penttonen, M. & Buzsáki, G. Natural logarithmic relationship between brain oscillators. Thalamus Related Systems 2, 145–152, doi:
10.1017/S1472928803000074 (2003).
22. Luo, Q. et al. Frequency Dependant Topological Alterations of Intrinsic Functional Connectome in Major Depressive Disorder. Sci.
Rep 5, 9710, doi: 10.1038/srep09710 (2015).
23. Wylie, K. P., Rojas, D. C., Tanabe, J., Martin, L. F. & Tregellas, J. R. Nicotine increases brain functional network efficiency. Neuroimage
63, 73–80, doi: 10.1016/j.neuroimage.2012.06.079 (2012).
24. Van Wijk, B. C., Stam, C. J. & Daffertshofer, A. Comparing brain networks of different size and connectivity density using graph
theory. PLoS ONE 5, e13701, doi: 10.1371/journal.pone.0013701 (2010).
25. Rubinov, M. & Sporns, O. Complex network measures of brain connectivity: uses and interpretations. Neuroimage 52, 1059–1069,
doi: 10.1016/j.neuroimage.2009.10.003 (2010).
Scientific Reports | 6:26209 | DOI: 10.1038/srep26209 10www.nature.com/scientificreports/
26. Feusner, J. D. et al. Brain Connectivity and Prediction of Relapse after Cognitive-Behavioral Therapy in Obsessive–Compulsive
Disorder. Front Psychiatry 6, 74, doi: 10.3389/fpsyt.2015.00074 (2015).
27. Ma, S., Calhoun, V. D., Eichele, T., Du, W. & Adalı, T. Modulations of functional connectivity in the healthy and schizophrenia
groups during task and rest. Neuroimage 62, 1694–1704, doi: 10.1016/j.neuroimage.2012.05.048 (2012).
28. Douw, L. et al. Cognition is related to resting-state small-world network topology: an magnetoencephalographic study. Neuroscience
175, 169–177, doi: 10.1016/j.neuroscience.2010.11.039 (2011).
29. Calzada-Reyes, A., Alvarez-Amador, A., Galán-García, L. & Valdés-Sosa, M. Electroencephalographic abnormalities in antisocial
personality disorder. J Forensic Leg Med 19, 29–34, doi: 10.1016/j.jflm.2011.10.002 (2012).
30. Liang, X., Zou, Q., He, Y. & Yang, Y. Coupling of functional connectivity and regional cerebral blood flow reveals a physiological
basis for network hubs of the human brain. PNAS 110, 1929–1934, doi: 10.1073/pnas.1214900110 (2013).
31. Pham, T. H., Vanderstukken, O., Philippot, P. & Vanderlinden, M. Selective attention and executive functions deficits among
criminal psychopaths. Aggressive Behav 29, 393–405, doi: 10.1002/ab.10051 (2003).
32. Raine, A. & Yang, Y. Neural foundations to moral reasoning and antisocial behavior. Soc Cogn Affect Neurosci 1, 203–213, doi:
10.1093/scan/nsl033 (2006).
33. Fumagalli, M. & Priori, A. Functional and clinical neuroanatomy of morality. Brain 135, 2006–2021, doi: 10.1093/brain/awr334
(2012).
34. Brower, M. & Price, B. Neuropsychiatry of frontal lobe dysfunction in violent and criminal behaviour: a critical review. J. Neurol.
Neurosurg. Psychiatry 71, 720–726, doi: 10.1136/jnnp.71.6.720 (2001).
35. Rolls, E. T., Hornak, J., Wade, D. & McGrath, J. Emotion-related learning in patients with social and emotional changes associated
with frontal lobe damage. J. Neurol. Neurosurg. Psychiatry 57, 1518–1524, doi: 10.1136/jnnp.57.12.1518 (1994).
36. Saver, J. L. & Damasio, A. R. Preserved access and processing of social knowledge in a patient with acquired sociopathy due to
ventromedial frontal damage. Neuropsychologia 29, 1241–1249, doi: 10.1016/0028-3932(91)90037-9 (1991).
37. Kiehl, K. A. et al. Limbic abnormalities in affective processing by criminal psychopaths as revealed by functional magnetic resonance
imaging. Biol. Psychiatry 50, 677–684, doi: 10.1016/S0006-3223(01)01222-7 (2001).
38. Kiehl, K. A. A cognitive neuroscience perspective on psychopathy: Evidence for paralimbic system dysfunction. Psychiatry Res. 142,
107–128, doi: 10.1016/j.psychres.2005.09.013 (2006).
39. Starkstein, S. E. et al. Mania after brain injury: neuroradiological and metabolic findings. Ann. Neurol. 27, 652–659, doi: 10.1002/
ana.410270612 (1990).
40. Hwang, K., Hallquist, M. N. & Luna, B. The development of hub architecture in the human functional brain network. Cereb. Cortex
23, 2380–2393, doi: 10.1093/cercor/bhs227 (2013).
41. Kasen, S., Cohen, P., Skodol, A. E., Johnson, J. G. & Brook, J. S. Influence of child and adolescent psychiatric disorders on young
adult personality disorder. A. J. Psychiatry 156, 1529–1535, doi: 10.1176/ajp.156.10.1529 (1999).
42. Sylvester, C. et al. Functional network dysfunction in anxiety and anxiety disorders. Trends Neurosci. 35, 527–535, doi: 10.1016/j.
tins.2012.04.012 (2012).
43. Gilbert, S. J., Dumontheil, I., Simons, J. S., Frith, C. D. & Burgess, P. W. Comment on” Wandering minds: The default network and
stimulus-independent thought”. Science 317, 43–43, doi: 10.1126/science.1140801 (2007).
44. Honey, C. et al. Predicting human resting-state functional connectivity from structural connectivity. PNAS 106, 2035–2040, doi:
10.1073/pnas.0811168106 (2009).
45. van den Heuvel, M. P., Mandl, R. C., Kahn, R. S., Pol, H. & Hilleke, E. Functionally linked resting‐state networks reflect the
underlying structural connectivity architecture of the human brain. Hum. Brain Mapp. 30, 3127–3141, doi: 10.1002/hbm.20737
(2009).
46. Widiger, T. A. & Costa, P. T. Jr Personality and personality disorders. J. Abnorm. Psychol. 103, 78, doi: 10.1037/0021-843X.103.1.78
(1994).
47. Butcher, J. N., Cheung, F. M. & Kim, J. Use of the MMPI-2 with Asian populations. Psychol Assess 15, 248, doi: 10.1037/1040-
3590.15.3.248 (2003).
48. Yang, J. et al. The cross-cultural generalizability of Axis-II constructs: an evaluation of two personality disorder assessment
instruments in the People’s Republic of China. J. Personal. Disord. 14, 249, doi: 10.1521/pedi.2000.14.3.249 (2000).
49. Spreen, O. A compendium of neuropsychological tests: Administration, norms, and commentary. 401–567 (Oxford University Press,
1998).
50. Minshew, N. J., Turner, C. A. & Goldstein, G. The application of short forms of the Wechsler intelligence scales in adults and children
with high functioning autism. J. Autism Dev. Disord. 35, 45–52, doi: 10.1007/s10803-004-1030-x (2005).
51. Yan, C. & Zang, Y. DPARSF: a MATLAB toolbox for” pipeline” data analysis of resting-state fMRI. Front Syst Neurosci 4, 13, doi:
10.3389/fnsys.2010.00013 (2010).
52. Sanz-Arigita, E. J. et al. Loss of ‘small-world’ networks in Alzheimer’s disease: graph analysis of FMRI resting-state functional
connectivity. PLos one 5, e13788, doi: 10.1371/journal.pone.0013788 (2010).
53. Tzourio-Mazoyer, N. et al. Automated anatomical labeling of activations in SPM using a macroscopic anatomical parcellation of the
MNI MRI single-subject brain. Neuroimage 15, 273–289, doi: 10.1006/nimg.2001.0978 (2002).
54. Murphy, K., Birn, R. M., Handwerker, D. A., Jones, T. B. & Bandettini, P. A. The impact of global signal regression on resting state
correlations: are anti-correlated networks introduced? Neuroimage 44, 893–905, doi: 10.1016/j.neuroimage.2008.09.036 (2009).
55. Fox, M. D., Zhang, D., Snyder, A. Z. & Raichle, M. E. The global signal and observed anticorrelated resting state brain networks. J.
Neurophysiol. 101, 3270–3283, doi: 10.1152/jn.90777.2008 (2009).
56. Hänggi, J., Wotruba, D. & Jäncke, L. Globally altered structural brain network topology in grapheme-color synesthesia. J. Neurosci.
31, 5816–5828, doi: 10.1523/JNEUROSCI.0964-10.2011 (2011).
57. Yan, C. et al. Sex-and brain size–related small-world structural cortical networks in young adults: a DTI tractography study. Cereb.
Cortex, bhq111, doi: 10.1093/cercor/bhq111 (2010).
58. Zalesky, A., Fornito, A. & Bullmore, E. T. Network-based statistic: identifying differences in brain networks. Neuroimage 53,
1197–1207, doi: 10.1016/j.neuroimage.2010.06.041 (2010).
Acknowledgements
The authors thank Drs. Yong He and Mingrui Xia for their constructive advice and suggestions in small-world
methodologies. This paper is supported by the National special projects for Science and Technology in China
(Construction of public service platform for the national biotechnology evaluation: 2012ZX09304003-005).
Author Contributions
Y.T., J.L. and W.W. designed the experiment; Y.T. and J.L. analysed the data; G.Z. and H.Z. prepared the figures;
Y.T. wrote the manuscript and H.X. proofread it. All authors reviewed the manuscript.
Additional Information
Supplementary information accompanies this paper at http://www.nature.com/srep
Scientific Reports | 6:26209 | DOI: 10.1038/srep26209 11www.nature.com/scientificreports/
Competing financial interests: The authors declare no competing financial interests.
How to cite this article: Tang, Y. et al. Aberrant functional brain connectome in people with antisocial
personality disorder. Sci. Rep. 6, 26209; doi: 10.1038/srep26209 (2016).
This work is licensed under a Creative Commons Attribution 4.0 International License. The images
or other third party material in this article are included in the article’s Creative Commons license,
unless indicated otherwise in the credit line; if the material is not included under the Creative Commons license,
users will need to obtain permission from the license holder to reproduce the material. To view a copy of this
license, visit http://creativecommons.org/licenses/by/4.0/
Scientific Reports | 6:26209 | DOI: 10.1038/srep26209 12You can also read


