Intellige: A User-Facing Model Explainer for Narrative Explanations
←
→
Page content transcription
If your browser does not render page correctly, please read the page content below
Intellige: A User-Facing Model Explainer for Narrative Explanations
                                                                  Jilei Yang, LinkedIn Corporation, jlyang@linkedin.com
                                                             Diana Negoescu, LinkedIn Corporation, dnegoescu@linkedin.com
                                                            Parvez Ahammad, LinkedIn Corporation, pahammad@linkedin.com

                                                                                                Abstract
                                             Predictive machine learning models often lack interpretability, resulting in low trust from model end users despite
arXiv:2105.12941v1 [stat.ML] 27 May 2021

                                             having high predictive performance. While many model interpretation approaches return top important features to
                                             help interpret model predictions, these top features may not be well-organized or intuitive to end users, which
                                             limits model adoption rates. In this paper, we propose Intellige, a user-facing model explainer that creates
                                             user-digestible interpretations and insights reflecting the rationale behind model predictions. Intellige builds an
                                             end-to-end pipeline from machine learning platforms to end user platforms, and provides users with an interface
                                             for implementing model interpretation approaches and for customizing narrative insights. Intellige is a platform
                                             consisting of four components: Model Importer, Model Interpreter, Narrative Generator, and Narrative Exporter.
                                             We describe these components, and then demonstrate the effectiveness of Intellige through use cases at LinkedIn.
                                             Quantitative performance analyses indicate that Intellige’s narrative insights lead to lifts in adoption rates of
                                             predictive model recommendations, as well as to increases in downstream key metrics such as revenue when
                                             compared to previous approaches, while qualitative analyses indicate positive feedback from end users.

                                             Keywords: model interpretation, user-digestible narrative explanation, sales & marketing insights.

                                                                                                     1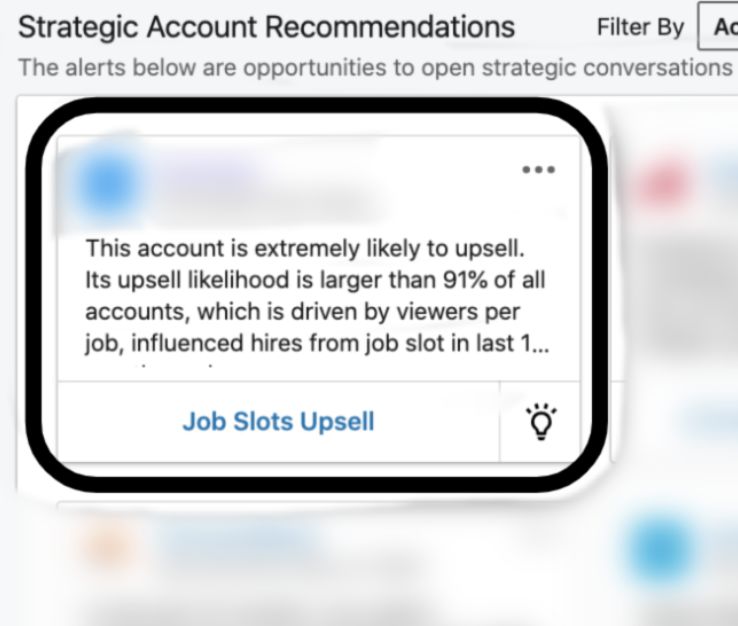
1. Introduction                                                    ing model interpretation results to end users such as sales
                                                                   teams:
Predictive machine learning models are widely used in a va-
riety of areas in industry. For example, in sales and market-
                                                                     1. Feature names in top important feature list may not be
ing, predictive models can help determine which potential
                                                                        easily understood by sales teams. For example, feature
customers are likely to purchase a product, and in healthcare,
                                                                        names such as hire cntr s3 and conn cmp s4
they can assist clinicians in detecting the risks of certain
                                                                        may be too abstract for sales team to extract meaningful
diseases. Complex predictive models such as random for-
                                                                        information.
est, gradient boosted trees, and deep neural networks can
produce more accurate predictions than simple models such            2. Top important feature lists may not be well-organized.
as linear regression and decision trees, and are therefore              For example, some features are closely related to each
preferred in many use cases where prediction accuracy is                other and can be grouped, some features contain too
of utmost importance. However, one important challenge is               many details for sales team to digest, and some fea-
explaining model predictions to end users who are experts               tures are not very meaningful to sales team and can be
in their domains, using application-specific platforms and              removed.
language. Previous literature points out that users can be re-
luctant to use the predictive models if they do not understand       3. Top important feature lists may not be easily inte-
how and why these models make predictions [1], [2]. There-              grated into sales management platforms which use
fore, building a user-facing model explainer that provides              sales-friendly language, resulting in low adoption rates
model interpretation and feature reasoning becomes cru-                 by sales teams on predictive modeling intelligence.
cial for engendering trust in prediction results and creating
meaningful insights based on them.                                 A desired resolution is to convert these non-intuitive model
Unfortunately, most complex predictive models with high            interpretation results into user-digestible narrative insights
predictive performance are intrinsically opaque, causing           as shown in the right panel of Table 1.
difficulties in intuitive interpretations. Even though some        Two common approaches for creating narratives in the lit-
models output a list of globally important features to inter-      erature are generation-based and template-based [6]. The
pret the overall model prediction, usually no interpretations      former relies on neural-network-based natural language gen-
at individual sample level are produced. For example, in           eration techniques, and can generate narrative explanations
sales prediction, it may be that for customer A, browsing          in an automatic way to effectively save human effort. How-
time is the most important feature whereas for customer            ever, the generation-based approach usually requires a large
B, discount is the most important. A sales team may                training data set, which may not exist in many use cases
strategize different customers individually by learning each       – for example, in sales prediction, our main use case, ex-
customer’s own top features. Therefore, developing a user-         isting narratives for sales recommendations are very lim-
facing model explainer which provides feature reasoning at         ited, as sales teams usually do not write logs of how they
individual sample level is of critical need [3].                   reached decisions about their customers. On the other hand,
There exist several state-of-the-art model interpretation ap-      template-based approaches can achieve a much higher gen-
proaches that enable sample-level feature reasoning, e.g.,         eralizability than generation-based approaches, as they do
LIME [3], KernelSHAP [4], and TreeSHAP [5]. These                  not rely on such training data. For this reason, we choose the
approaches produce feature importance scores for each sam-         template-based approach for creating narrative explanations.
ple, indicating how much each feature has contributed to           In this paper, we propose a template-based, user-facing
the model prediction. A typical example of model pre-              model explainer - Intellige, which aims to create user-
diction and interpretation results using LIME for a jobs           understandable interpretation and insights, and to reflect
upsell model in LinkedIn sales prediction is shown in Table        the rationale behind machine learning models. In contrast
1. Here, a random forest model predicts how likely each            with sample-level model interpretation approaches, Intellige
LinkedIn customer is to purchase more job slot products at         has added follow-up steps to convert non-intuitive model
contract renewal by using over 100 features covering areas         interpretation results into user-digestible narrative insights.
such as job slots usage, job seeker activity, and company          In contrast with other approaches, such as rule-based narra-
level attributes.                                                  tive generation systems, Intellige is more scalable as it has
The left panel of Table 1 displays the model outputs with          leveraged machine learning models to conduct automatic
the interpretation results for a specific customer in jobs         narrative ranking.
upsell prediction. Here, even though we have conducted             To our knowledge, Intellige is the first user-facing model
sample-level feature reasoning by providing top important          explainer employed in industry that provides a user-friendly
feature lists, there still exist several challenges when surfac-   interface to conduct model interpretation and narrative cus-
Table 1. Model prediction & interpretation result (left panel) and narrative insights (right panel).
Model Prediction & Interpretation (Non-Intuitive) Narrative Insights (User-Friendly)
Propensity score: 0.85 (Top 2%) This account is extremely likely to upsell. Its upsell like-
Top important features (with importance score): lihood is larger than 98% of all accounts, which is driven
by:
• paid job s4: 0.030
• Paid job posts changed from 10 to 15 (+50%) in the
• job view s4: 0.013 last month.
• hire cntr s3: 0.011 • Views per job changed from 200 to 300 (+50%) in the
• conn cmp s4: 0.009 last month.
• ··· • ···
tomization. Besides sales and marketing, Intellige is appli- based and template-based. Examples of neural network
cable in a variety of use cases in industry. For example, in generation-based approaches include synthesizing explana-
healthcare, Intellige can help identify top signals in disease tions triggered by the word “because” [17][18], leveraging
risk prediction, and then translate them into clinical reports LSTM to generate explanation sentences [19], creating tips
which are digestible to clinicians. In credit card applica- for Yelp restaurants based on GRU [20], and developing a
tions, narratives containing main reasons why applicants get multi-task recommendation model which performs rating
rejected can be generated by Intellige from credit risk pre- prediction and recommendation explanation simultaneously
diction models, and then surfaced to credit card applicants [21]. However, generation-based approaches highly depend
for their reference. on the quality and quantity of training data, thus are less
generalizable than template-based approaches.
The rest of the paper is organized as follows. Section 2 lists
related work in the area of model interpretation and narrative Recent work on creating narrative explanations via template-
generation; Section 3 describes the design of Intellige; Sec- based approaches includes imputing the predefined narra-
tion 4 presents use cases of Intellige at LinkedIn, including tive templates with the most important features to explain
performance evaluation results; Section 5 points out some the recommendation models [22][23][24]. In [25], a Java
limitations of Intellige and discusses future directions; and package provides narrative justifications for logistic/linear
Section 6 concludes our work. regression models, [26] propose a way to generate narra-
tive explanations using logical knowledge translated from
2. Related Work a decision tree model, and [27] introduce a rule-based ex-
plainer for a GDPR automated decision which applies to
Model interpretation approaches that focus on sample-level explainable models. However, all these aforementioned
feature reasoning have been widely explored in recent years. templated-based approaches are only applicable to a subset
Examples include Shapley Value [7][8], Local Gradient of machine learning models, and can easily fail when facing
[9], Integrated Gradient [10], Quantitative Input Influence a more complex model such as a random forest. More-
(QII) [11], Leave-One-Covariate-Out (LOCO) [12], LIME over, the templates used in these approaches are predefined,
[3], KernelSHAP [4], and TreeSHAP [5]. Moreover, many with limited variations, and as a result, the generated nar-
model interpretation platforms have also been developed ratives can become repetitive and hard to customize. In
to facilitate the implementation of these approaches in a Intellige, we overcome these limitations by implementing
unified way, e.g., Microsoft InterpretML [13] and Machine model-agnostic interpretation approaches which apply to
Learning Interpretability (MLI) in H2O Driverless AI [14]. arbitrary predictive machine learning models, and by pro-
All these model interpretation approaches and platforms can viding a user-friendly interface that allows customizing an
easily suffer from one challenge when interpretation results unlimited number of narrative templates.
are presented to end users: feature importance scores in
tabular/bar-chart format may not be very intuitive, resulting 3. Intellige Design
in low adoption rates.
3.1. Overview
To overcome this limitation, user-digestible narrative-based
model interpretations have been proposed [15][16]. Two We propose Intellige as a self-service platform for user-
common approaches for such interpretations are generation- facing explanation. Intellige demystifies the outputs of pre-dictive models by assigning feature importance scores, and 3.2. Model Importer
converts non-intuitive model predictions and top important
As we move toward machine learning platforms such as
features into user-understandable narratives. This enables
ProML from LinkedIn,1 AutoML from Google,2 and Create
end users to obtain insights into model predictions, and to
ML from Apple,3 it is very likely that different platforms
build trust in model recommendations.
produce model outputs in very different formats, resulting in
Intellige is designed to support all the commonly-used black- low efficiency of developing model explainers specifically
box supervised machine learning models, including but not for each platform. A natural resolution is to first convert
limited to support vector machines, bagging, random forests, these model outputs into standardized format. This leads to
gradient boosted trees, and deep neural networks. the development of Model Importer.
Several challenges existed in the design and deployment of The Model Importer takes the model output from a set of
Intellige: machine learning platforms as its input, and produces stan-
dardized machine learning model output, which will be used
1. How to consume outputs from a range of machine in the following Model Interpreter and Narrative Generator.
learning platforms implementing machine learning For use cases at LinkedIn, the set of machine learning plat-
models? forms includes ProML and other internal platforms built by
data science teams. A typical standardized machine learn-
2. How to enable flexibility in choosing model interpreta- ing model output consists of feature vectors and prediction
tion approaches for different use cases? scores of all the samples, and optionally the predictive model
itself with a unified interface (i.e., the interface should take
3. How to efficiently generate template-based narratives standardized input (feature vectors) and produce standard-
while allowing narrative customization? ized output (prediction scores)). We set the predictive model
4. How to produce narratives compatible with a range of to be optional, since the following Model Interpreter can
end user platforms? sometimes work well even without access to the original
model, and the Narrative Generator does not depend on the
original model.
To address the above challenges, we designed Intellige as
a flexible platform consisting of four components: Model
3.3. Model Interpreter
Importer, Model Interpreter, Narrative Generator and Nar-
rative Exporter. These four components resolved the above Model Interpreter is the second component of Intellige, aim-
challenges in sequential order. Figure 1 shows these four ing to reveal insights behind machine learning model rec-
components: ommendations. It takes the output of Model Importer as its
input, and produces sample-level top important feature lists
1. Model Importer: Consumes model output from ma- by calculating feature importance scores for each sample,
jor machine learning platforms and transforms it into which are then conveyed to the Narrative Generator as one
standardized machine learning model output. of its inputs.
The Model Interpreter consists of a collection of model
2. Model Interpreter: Implements a collection of model
interpretation approaches with a unified input format (i.e.,
interpretation approaches to process the standardized
standardized machine learning model output) and a uni-
machine learning model output, and produces sample-
fied output format (i.e., sample-level top important feature
level top important feature lists.
lists). The collection of model interpretation approaches
3. Narrative Generator: Creates user-digestible narra- includes state-of-the-art methods that produce sample-level
tives via a template-based approach, based on the stan- feature importance scores, e.g., LIME [3], KernelSHAP &
dardized machine learning model output, and addi- DeepSHAP [4], and TreeSHAP [5]. The Model Interpreter
tional feature information and narrative templates pro- need not have the model itself accessible – the model may be
vided by Intellige users; Selects top narratives by using trained in a separate system/device or there exist privacy/se-
top important feature list for each sample. curity concerns. If that is the case, high-performing model
interpretation approaches, such as K-LIME, are available
4. Narrative Exporter: Surfaces sample-level top nar- [14].
ratives onto major end user platforms with necessary 1
https://engineering.linkedin.com/blog/2019/01/scaling-
format adjustments.
machine-learning-productivity-at-linkedin
2
https://cloud.google.com/automl
3
In the following sections, we introduce these four compo- https://developer.apple.com/machine-learning/create-ml
nents in more detail.Figure 1. Intellige Components.
Intellige users have the flexibility to choose the appropriate To enable narrative customization, we introduce Insights
interpretation approach in their use cases: For example, if Design, an additional input to Narrative Generator provided
the input machine learning platform implements a restricted by Intellige users. Insights Design contains information
set of machine learning algorithms (e.g., only tree-based from domain knowledge owners which cannot be directly
algorithms or neural-network-based algorithms), then In- extracted from the model itself, but is essential to narrative
tellige users can choose model-specific interpretation ap- construction. Insights Design has two components: Fea-
proaches such as TreeSHAP and DeepSHAP as they are ture Info File and Narrative Templates. The Feature Info
usually more computationally-efficient than model-agnostic File contains additional information for each model feature,
ones; On the contrary, if the original platform keeps a large including feature hierarchy information, detailed feature
set of candidate algorithms, then model-agnostic interpreta- descriptions, and narrative template imputation rules. The
tion approaches such as LIME and KernelSHAP are recom- Narrative Templates file contains a collection of templates
mended. for imputing appropriate feature values.
In the following sections, we describe key features of Narra-
3.4. Narrative Generator tive Generator in detail.
Narrative Generator is the key innovative part of Intellige, as
it generates human-understandable narratives for interpret- 3.4.1. F OUR -L AYER F EATURE H IERARCHY
ing model predictions. Its input consists of the outputs from An intuitive way to understand feature meaning and the in-
Model Importer and Model Interpreter, as well as Insights trinsic relationship between different features is to construct
Design, which in turn consists of a Feature Info File and a hierarchical structure for these features. In Intellige, we
Narrative Templates (shown in Figure 1, details provided in propose a four-layer feature hierarchy, where the original
Section 3.4.1-3.4.4). The design of Narrative Generator is features are set to be the first layer. This feature hierarchy is
challenging: Information solely from the model itself such manually constructed with the help of model owners, and is
as feature name, feature value, and feature importance score specified by Feature Info File in Insights Design. In prac-
may not be comprehensive enough for narrative construc- tice, feature correlation analysis can also help in finding
tion. Additional information such as feature descriptions the appropriate hierarchical structure by providing feature
and narrative templates are needed as well. grouping information.
To address the above challenge, we propose the Narrative Table 2 shows a sample feature hierarchy for 8 selected
Generator, with the goal of minimizing the human effort in features from the jobs upsell model introduced in Section 1.
narrative generation while keeping the flexibility in narrative There are four hierarchical layers for features in Table 2:
customization. Many heavy tasks, such as feature value
extraction, template imputation, and narrative ranking are
handled inside the Narrative Generator in an automated way. • Original-feature layer (1st layer): This layer con-
tains all the original features used in the model.Table 2. Feature hierarchy for selected features from jobs upsell model.
Original-Feature Super-Feature Ultra-Feature Category
job qty job slots job slots product booking
job dprice usd job slots job slots product booking
job view s3 views per job job view product performance
job view s4 views per job job view product performance
job viewer s3 viewers per job job view product performance
job viewer s4 viewers per job job view product performance
job applicant s3 applicants per job job applicant product performance
job applicant s4 applicants per job job applicant product performance
• Super-feature layer (2nd layer): This layer is used super-feature layers as its input, as these two layers seemed
to group closely related original-features for narra- necessary and sufficient in narrative generation. However,
tive construction. For each super-feature, one nar- as more and more requests for narrative deduplication and
rative will be constructed, and every original-feature narrative concatenation came in from Intellige users, we
under this super-feature will have the opportunity to decided to add the ultra-feature and the category layers,
appear in this narrative. Another important function- in order to realize these two additional functionalities. In
ality of this layer is to conduct feature name explana- practice, Intellige users can choose whether to specify the
tion. As we can see from Table 2, the super-feature ultra-feature and category layers based on their own use
names are much more understandable than the original- cases. For example, specifying the ultra-feature layer is
feature names, and they themselves are likely to ap- recommended if the generated narratives contain too much
pear in the narrative as well. For example, one narra- redundant information, and specifying the category layer
tive will be constructed for the super-feature views is recommended if end users prefer reading paragraphs. If
per job, where the values of the original-features Intellige users find it unnecessary to specify either of these
job view s3 and job view s4 as well as the su- two layers, they can simply set them the same as the super-
per feature name views per job are likely to be feature layer to reduce preparation effort.
incorporated into the narrative. We discuss the details
of how to construct narratives in Section 3.4.2. 3.4.2. NARRATIVE T EMPLATE I MPUTATION
• Ultra-feature layer (3rd layer): This layer is used An important prerequisite for narrative construction is build-
to identify and filter out super-features with (almost) ing the narrative templates in Insights Design. Narrative
duplicated information to end users. For example, templates are manually constructed with the help of model
in Table 2, both super-features views per job owners, and then translated into appropriate code for imput-
and viewers per job are under ultra-feature job ing feature values in Narrative Generator. An example of
view as they are very likely to contain overlapped in- how to translate narrative templates into code can be found
formation. If we show one narrative of views per in Section A.1 in the Appendix.
job to end users, then the marginal benefit to show the Table 3 shows sample narrative templates for the jobs upsell
other narrative of viewers per job will be low. use case. Here, we refer to value change as an “insight
We discuss how to filter out super-features under one type”: Each super-feature corresponds to one insight
ultra-feature in Section 3.4.3. type, which determines the specific narrative template to
use. prev value and current value in the template
• Category layer (4th layer): This layer is used to
value change are “insight items”: each original-feature
group relevant narratives and concatenate them into
under one super-feature corresponds to one insight item,
paragraphs. For example, in Table 2, both ultra-
which determines the position to impute the original-feature
features job view and job applicant belong
value into the narrative template. For example, as shown
to category product performance, and their cor-
in Table 4, the original-features job view s3 and
responding narratives can then be concatenated into
job view s4 under the super-feature views per
one paragraph by using conjunction phrases. We dis-
job correspond to insight items prev value and
cuss the details of narrative concatenation in Section
current value respectively, where prev value and
3.4.4.
current value can be identified as two positions in the
template value change in Table 3. percent change
We note that when the Narrative Generator was initially is an example of an “extra insight item” whose value
designed, it only consumed the original-feature and themay not be directly extracted from original-features under each ultra-feature (Recall that the ultra-feature is in a
but can be derived by extra calculations on the existing higher hierarchy of the super-feature, which groups those
insight items. For example, here percent change = super-features sharing the overlapped information). We can
(current value-prev value)/prev value*100. set K = 1 to make the generated narratives most concise.
We note that the appearance of the original-features within One example of conducting narrative ranking and dedupli-
a given narrative is solely determined by the design of the cation in jobs upsell use case can be found in Section A.3 in
narrative template, rather than the importance scores of the the Appendix (Table 8).
original-features – we discuss the usage of these importance
Finally, we point out that narrative ranking has inherited a
scores in Section 3.4.3. We also mention that, by default,
good property from feature ranking in Model Interpreter:
all the original-features under one super-feature will appear
narrative ranking is sample-specific. A narrative with the
in its corresponding narrative.
same content, e.g., views per job, can be ranked as No.
The introduction of “insight type” and “insight item” en- 1 for customer A but No. 5 for customer B, indicating its
ables the reusability of narrative templates. For example, different contributions in supporting the recommendations
both super-features views per job and applicants for different customers.
per job share the same insight type, and thus their narra-
tives are constructed based on the same template. Moreover, 3.4.4. NARRATIVE C ONCATENATION
“insight item” enables the construction of sample-specific
Narrative concatenation is enabled by the category layer of
narratives, as each sample has its own feature values to be
the four-layer feature hierarchy, where relevant narratives
imputed.
under the same category can be concatenated as a paragraph
In addition to Narrative Templates, we are now able to rather than a bullet-point list. The major goal is to make the
specify the complete version of Feature Info File within narratives better-organized so that the narratives focusing
Insights Design: The Feature Info File consists of all the on different aspects of the sample will not be mixed. In
columns in Table 2 and 4: Original-Feature, Super-Feature, Intellige, narrative concatenation is optional.
Ultra-Feature, Category, Insight Type, and Insight Item,
We conduct narrative concatenation by using conjunction
which contains essential feature information for narrative
phrases such as “and”, “moreover” and “what’s more”. For
construction. Three additional columns: Insight Threshold,
example, for narratives corresponding to super-features
Insight Weight, and Source, can also be incorporated as
views per job and applicants per job, the
optional columns to make the narrative generation process
paragraph after narrative concatenation is “Views per job
more customizable. The detailed introduction of these three
changed ..., and applicants per job changed ...”. We also
columns can be found in Section A.2 in the Appendix.
introduce paragraph importance score to rank these para-
graphs. Similar to narrative importance score, the paragraph
3.4.3. NARRATIVE R ANKING
importance score is determined as the largest narrative im-
By introducing the feature info file and narrative templates, portance score among all the narratives incorporated in the
we are able to construct a collection of narratives for each paragraph.
sample. However, too many narratives may overwhelm end
users, so instead we aim to present them with a few selected 3.4.5. NARRATIVE G ENERATOR D ESIGN
ones which show the strongest signals to support the model
We now describe the design of Narrative Generator. Figure
recommendations.
2 shows the six major steps in Narrative Generator:
To select the most important narratives in a scalable way, we
leverage the sample-level top important feature list created I Construct super-feature mapping based on feature info
from Model Interpreter to rank all the narratives, and then file and feature vectors: For each super-feature, this
present the end users with the top ones. To this end, we mapping records its corresponding original-feature ids
introduce the narrative importance score, which reflects (i.e., positions in feature vector), ultra-feature, category,
how large the contribution of each narrative is to the model insight type and insight items.
prediction. We set the score to be the maximum importance
score among all the original-features under the super-feature II Collect information of all super-features for each sam-
corresponding to the narrative. The intuition behind this ple: For each super-feature in one sample, we extract
setting is that one narrative is important as long as at least its corresponding original-feature values from feature
one of its corresponding original-features is important. vectors according to super-feature mapping from Step
I.
We conduct narrative deduplication by retaining only the top
K narratives with the largest narrative importance scores III Obtain top super-feature list for each sample: Based on
sample-level top feature lists from Model InterpreterTable 3. Narrative templates for interpreting jobs upsell model.
Insight Type Narrative Template
quantity Purchased {quantity num} {super name} for
${total price}.
value change {super name} changed from {prev value} to
{current value} ({percent change}%) in the last
month.
Table 4. Insight type and insight item for selected features from jobs upsell model.
Original-Feature Super-Feature Insight Type Insight Item
job qty job slots quantity quantity num
job dprice usd job slots quantity total price
job view s3 views per job value change prev value
job view s4 views per job value change current value
job viewer s3 viewers per job value change prev value
job viewer s4 viewers per job value change current value
job applicant s3 applicants per job value change prev value
job applicant s4 applicants per job value change current value
and super-feature mapping from Step I, we rank each 4. Use Cases at LinkedIn
sample’s top super-features by calculating narrative im-
portance scores, and then use ultra-features to conduct LinkedIn leverages data to empower decision making in
deduplication (Section 3.4.3). every area. One such area is sales, where data scientists
built predictive machine learning models for account rec-
ommendation, covering the entire business landscape from
IV Obtain information of top super-features for each sam- customer acquisition to existing customer retention. Most
ple: For each sample, we join the information of all of these predictive models are black-box models, making it
super-features from Step II onto the top super-feature challenging for data scientists to surface model outputs to
list from Step III. sales teams in an intuitive way.
V Construct top narratives for each sample: For each Furthermore, LinkedIn sales teams use multiple internal
sample, we conduct narrative template imputation for intelligence platforms. One typical platform, Merlin, aims
each top super-feature (Section 3.4.2). to help sales representatives close deals faster by providing
personalized and actionable sales recommendations/alerts.
Before Intellige, all these sales recommendations were rule-
VI (Optional) Construct top paragraphs for each sample: based. A typical example of rule-based recommendations
For each sample, we conduct narrative concatenation is based on exploratory data analysis: Recommend the jobs
according to category name (Section 3.4.4). upsell opportunity if views per job increased more than 10%,
or the number of job posts increased more than 20% in the
past month. As we can see, these rule-based recommenda-
3.5. Narrative Exporter tions were neither very accurate as model predictions nor
scalable in their generation process.
The generation of user-digestible narratives may not be
the last step of a user-facing model explainer, instead the Intellige has assisted LinkedIn data scientists in converting
narratives should be further surfaced to various end user machine intelligence from business predictive models into
platforms such as sales/marketing intelligence platforms, sales recommendations on platforms such as Merlin, where
Tableau dashboards and emails. Our solution is to incorpo- LinkedIn data scientists are typically both model owners
rate an extra step called Narrative Exporter after the Nar- and Intellige users, while sales teams are the end users
rative Generator, to unify the narrative surfacing process. applying Intellige’s narrative insights to their work. One
Specifically, Narrative Exporter takes top narratives from typical example of Intellige-based sales recommendations
Narrative Generator as its input, and converts them into a on Merlin is with jobs upsell alerts. As introduced in Section
few specific formats of choice, such as html or email format. 1, the jobs upsell model predicts how likely each account is
This step completes the end-to-end pipeline from machine to purchase more job slots.
learning platforms to end user platforms in Intellige.Figure 2. Narrative Generator - Major Steps.
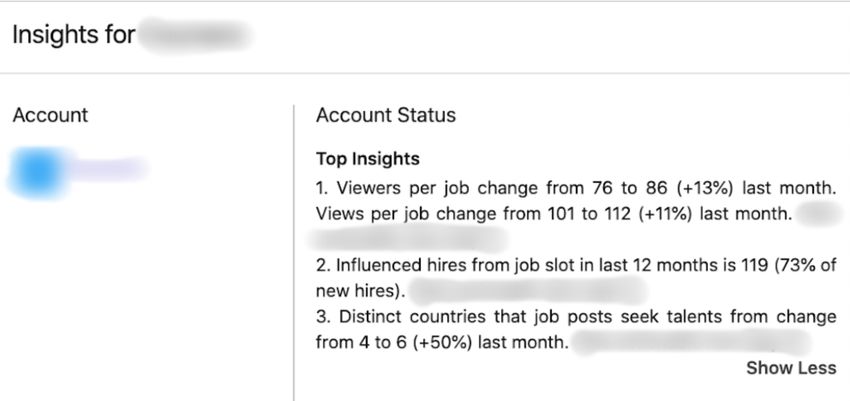
Figure 3 shows how the jobs upsell alerts appear on Mer- proposed in [15] and [27], where the authors argued that
lin. When a sales representative logs into Merlin, a list “subjective satisfaction is the only reasonable metrics to
of account alerts including jobs upsell alerts are displayed evaluate success in explanation”. We have conducted a sur-
on the Merlin homepage (Figure 3(a)). On the summary vey within a small group of sales representatives on the
page of the account, we see a sentence describing its helpfulness of Intellige-based sales recommendations (rat-
propensity score. To learn more about the underlying ings from 1 - not helpful at all to 5 - couldn’t do my job
reasons behind its recommendation, sales representatives without them). Ten responses have been received with aver-
can click the “Job Slots Upsell” button which will direct age satisfaction rating of 3.5 (standard error 0.4). We have
them to the account status page with more account de- also collected positive feedback from a broader group of
tails (Figure 3(b)). In the Account Status section, top sales representatives, which we summarized into three main
narrative insights are listed, e.g., both viewers per points (A collection of feedback in the original can be found
job and distinct countries that job posts in Section A.4 in the Appendix):
seek talents from largely increased in the last
month, which serve as strong signals of upsell propensity. 1. Top narrative insights are clear to understand and ef-
Besides Merlin, Intellige-based sales recommendations have fectively help sales representatives build trust in the
also been surfaced onto other sales platforms for different account recommendations. These narrative insights
audiences and use cases with the help of Narrative Exporter. bring important metrics to their attention, and prompt
By the end of 2020, six Intellige-based sales recommenda- them to work on accounts that they may have not con-
tions across four lines of LinkedIn business - Talent Solu- sidered otherwise.
tions (LTS), Marketing Solutions (LMS), Sales Solutions
2. Intellige-based sales recommendations serve as a com-
(LSS) and Learning Solutions (LLS) have been on-boarded
prehensive information center. Sales representatives
onto four internal sales intelligence platforms, which have
appreciate that the top narrative insights are consoli-
been surfaced to more than five thousand sales representa-
dated all in one place, to save their time of gathering
tives overseeing more than three million accounts.
information from different sources.
4.1. Evaluation Results 3. Intellige-based sales recommendations provide a di-
To understand how helpful Intellige-based sales recommen- rectional guidance for next steps. The top narrative
dations are to sales representatives, we turned to qualitative insights allow sales representatives to act strategically,
and quantitative evaluations of Intellige performance. e.g., prepare customer-specific conversations.
In our qualitative evaluation, we collected feedback from Another way to evaluate the performance of Intellige-based
sales representatives via questionnaires, interviews, and sales recommendations is via quantitative evaluation, which
other feedback channels. Similar approaches have been we conducted in two phases:(a) (b)
Figure 3. Jobs Upsell Alerts on Merlin.
1. Phase I: Compare the adoption rate between Intellige- ing period of recruiters upsell alerts was during the
based recommendations and rule-based recommenda- COVID-19 crisis, where severe hiring freezes likely
tions. Table 5 shows the interaction rates on all the negatively impacted the market of recruiters products
Intellige-based and rule-based Merlin Alerts across [28], leading to lower than expected numbers of cre-
sales representatives in LTS and LLS respectively in ated opportunities and upsell opportunities in Table
the same 3-month time period, where the interaction 6. As a result, the corresponding upsell rate lift of
rate is defined as # clicks / # impressions. Intellige- recruiters product is not statistically significant, and its
based alerts have a significantly higher interaction rate average spend per account possesses a relatively large
than rule-based alerts, indicating that sales representa- standard error.
tives are more engaged with Intellige-based alerts. We
note that potential confounding factors in this compari-
4.2. Lessons from Deployment
son may exist, e.g., the novelty of new alerts may lead
to increased interactions. To address this novelty effect, We list key lessons we have learned from the deployment of
we started our measurements of # impressions and # Intellige at LinkedIn:
clicks one month after the new alerts launch date, in the
hope that most of the sales representatives have already 1. Initial feedback we received after the launch of our
been familiarized with them. We have also extended first-ever Intellige-based sales recommendations - jobs
the time period of measurements to three months to upsell alerts, was from sales representatives who found
further reduce this potential novelty effect. some narratives confusing. For example, one narrative
was “Distinct countries of job posts changed value”,
2. Phase II: Identify the differences with/without Intellige- which was identified as a vague statement: Did this
based recommendations via A/B testing. In the A/B mean “distinct countries where job post viewers come
testing design, for each sales representative, we ran- from” or “distinct countries where job posts seek tal-
domly split his/her account book into treatment/control ents from”?
groups, and we show the Intellige-based recommenda- To resolve the above issue, we worked with data scien-
tions to all the eligible accounts in the treatment group tists who built sales predictive models to host multiple
only. We then compare key metrics between the treat- working sessions with sales representatives. During
ment and control groups, e.g., upsell rate and revenue working sessions, we walked through the top narrative
for upsell recommendations (upsell rate = # success- insights with sales representatives, asked them about
ful upsell opportunities / # sales opportunites created), meaningfulness of feature descriptions and whether
and churn rate and revenue lost for churn risk notifi- more granular information was needed, and then re-
cations. Table 6 shows the A/B testing results of jobs vised the feature descriptions and narrative templates
upsell alerts and recruiters upsell alerts after a 3-month in Insights Design accordingly. For example, when we
testing period, where “recruiters” is another LinkedIn identified which description was correct for “distinct
product. We observe boosts in both key metrics: up- countries of job posts”, we updated the correspond-
sell rate and average spend per account, indicating that ing super-feature in Insights Design, which solved the
the Intellige-based sales recommendations work effec- above issue. Overall, we found it useful to iterate
tively in driving the right sales decisions and bringing through several rounds of improvements and feedback
in revenue to the company. We note that the A/B test- from our end users.Table 5. Interaction rate (# clicks / # impressions) of Merlin Alerts, Intellige-based vs rule-based (standard error in parathesis).
LLS LTS
Intellige-based Alerts # impressions 694 7,188
# clicks 41 167
interaction rate (s.e.) 5.9% (0.9%) 2.3% (0.2%)
Rule-based Alerts # impressions 1,031 5,445
# clicks 25 91
interaction rate (s.e.) 2.4% (0.5%) 1.7% (0.2%)
Interaction Rate Lift lift (%) +141% +39%
lift (p-value)6. Conclusion References
In recent years, requests from end users of predictive models [1] D. Martens and F. Provost, “Explaining data-driven
of understandable model outputs have become widespread, document classifications,” Mis Quarterly, vol. 38,
motivating the development of user-facing model explainers. no. 1, pp. 73–100, 2014.
In this paper, we proposed Intellige, a novel user-facing
model interpretation and narrative generation tool, which [2] J. Moeyersoms, B. d’Alessandro, F. Provost, and
produces user-digestible narrative insights and reveals the D. Martens, “Explaining classification models built
rationale behind predictive models. The evaluation results on high-dimensional sparse data,” arXiv preprint
in LinkedIn’s use cases demonstrate that the narrative in- arXiv:1607.06280, 2016.
sights produced by Intellige boost the adoption rate of model
recommendations and improve key metrics such as revenue. [3] M. T. Ribeiro, S. Singh, and C. Guestrin, “Why should
i trust you?: Explaining the predictions of any clas-
sifier,” in Proceedings of the 22nd ACM SIGKDD In-
Acknowledgements ternational Conference on Knowledge Discovery and
We would like to express our special thanks to our col- Data Mining, pp. 1135–1144, ACM, 2016.
leagues at LinkedIn that put this work together, including
Saad Eddin Al Orjany, Harry Shah, Yu Liu, Fangfang Tan, [4] S. M. Lundberg and S.-I. Lee, “A unified approach to
Jiang Zhu, Jimmy Wong, Jessica Li, Jiaxing Huang, Kunal interpreting model predictions,” in Advances in neural
Chopra, Durgam Vahia, Suvendu Jena, Ying Zhou, Rodrigo information processing systems, pp. 4765–4774, 2017.
Aramayo, William Ernster, Eric Anderson, Nisha Rao, An-
[5] S. M. Lundberg, G. Erion, H. Chen, A. DeGrave, J. M.
gel Tramontin, Zean Ng, Ishita Shah, Juanyan Li, Rachit
Prutkin, B. Nair, R. Katz, J. Himmelfarb, N. Bansal,
Arora, Tiger Zhang, Wei Di, Sean Huang, Burcu Baran,
and S.-I. Lee, “From local explanations to global un-
Yingxi Yu, Sofus Macskassy, Rahul Todkar and Ya Xu. We
derstanding with explainable ai for trees,” Nature ma-
particularly thank Justin Dyer, Ryan Rogers and Adrian
chine intelligence, vol. 2, no. 1, pp. 2522–5839, 2020.
Rivera Cardoso for their helpful comments and feedback.
[6] Y. Zhang and X. Chen, “Explainable recommenda-
tion: A survey and new perspectives,” arXiv preprint
arXiv:1804.11192, 2018.
[7] E. Strumbelj and I. Kononenko, “An efficient explana-
tion of individual classifications using game theory,”
The Journal of Machine Learning Research, vol. 11,
pp. 1–18, 2010.
[8] E. Štrumbelj and I. Kononenko, “Explaining predic-
tion models and individual predictions with feature
contributions,” Knowledge and information systems,
vol. 41, no. 3, pp. 647–665, 2014.
[9] D. Baehrens, T. Schroeter, S. Harmeling, M. Kawan-
abe, K. Hansen, and K.-R. Müller, “How to explain
individual classification decisions,” The Journal of
Machine Learning Research, vol. 11, pp. 1803–1831,
2010.
[10] M. Sundararajan, A. Taly, and Q. Yan, “Ax-
iomatic attribution for deep networks,” arXiv preprint
arXiv:1703.01365, 2017.
[11] A. Datta, S. Sen, and Y. Zick, “Algorithmic trans-
parency via quantitative input influence: Theory and
experiments with learning systems,” in 2016 IEEE
symposium on security and privacy (SP), pp. 598–617,
IEEE, 2016.[12] J. Lei, M. G’Sell, A. Rinaldo, R. J. Tibshirani, and [23] N. Wang, H. Wang, Y. Jia, and Y. Yin, “Explainable
L. Wasserman, “Distribution-free predictive inference recommendation via multi-task learning in opinion-
for regression,” Journal of the American Statistical ated text data,” in The 41st International ACM SIGIR
Association, vol. 113, no. 523, pp. 1094–1111, 2018. Conference on Research & Development in Informa-
tion Retrieval, pp. 165–174, 2018.
[13] H. Nori, S. Jenkins, P. Koch, and R. Caruana, “In-
terpretml: A unified framework for machine learn- [24] Y. Tao, Y. Jia, N. Wang, and H. Wang, “The fact:
ing interpretability,” arXiv preprint arXiv:1909.09223, Taming latent factor models for explainability with
2019. factorization trees,” in Proceedings of the 42nd In-
ternational ACM SIGIR Conference on Research and
[14] P. Hall, An introduction to machine learning inter- Development in Information Retrieval, pp. 295–304,
pretability. O’Reilly Media, Incorporated, 2019. 2019.
[15] E. Reiter, “Natural language generation challenges
[25] O. Biran and K. McKeown, “Justification narratives
for explainable ai,” arXiv preprint arXiv:1911.08794,
for individual classifications,” in Proceedings of the
2019.
AutoML workshop at ICML, vol. 2014, pp. 1–7, 2014.
[16] I. Baaj, J.-P. Poli, and W. Ouerdane, “Some insights
[26] R. Calegari, G. Ciatto, J. Dellaluce, and A. Omicini,
towards a unified semantic representation of expla-
“Interpretable narrative explanation for ml predictors
nation for explainable artificial intelligence,” in Pro-
with lp: A case study for xai.,” in WOA, pp. 105–112,
ceedings of the 1st Workshop on Interactive Natural
2019.
Language Technology for Explainable Artificial Intel-
ligence (NL4XAI 2019), pp. 14–19, 2019. [27] F. Sovrano, F. Vitali, and M. Palmirani, “The differ-
ence between explainable and explaining: require-
[17] S. Antol, A. Agrawal, J. Lu, M. Mitchell, D. Batra,
ments and challenges under the gdpr,” 2019.
C. Lawrence Zitnick, and D. Parikh, “Vqa: Visual
question answering,” in Proceedings of the IEEE in- [28] K. Kimbrough, “Measuring the first full month of
ternational conference on computer vision, pp. 2425– covid-19’s impact on hiring in the u.s..” https:
2433, 2015. //www.linkedin.com/pulse/measuring
-first-full-month-covid-19s-impact
[18] L. A. Hendricks, Z. Akata, M. Rohrbach, J. Donahue,
-hiring-us-karin-kimbrough, 2020.
B. Schiele, and T. Darrell, “Generating visual explana-
tions,” in European Conference on Computer Vision,
pp. 3–19, Springer, 2016.
[19] F. Costa, S. Ouyang, P. Dolog, and A. Lawlor, “Auto-
matic generation of natural language explanations,” in
Proceedings of the 23rd International Conference on
Intelligent User Interfaces Companion, pp. 1–2, 2018.
[20] P. Li, Z. Wang, Z. Ren, L. Bing, and W. Lam, “Neu-
ral rating regression with abstractive tips generation
for recommendation,” in Proceedings of the 40th In-
ternational ACM SIGIR conference on Research and
Development in Information Retrieval, pp. 345–354,
2017.
[21] Y. Lu, R. Dong, and B. Smyth, “Why i like it: multi-
task learning for recommendation and explanation,” in
Proceedings of the 12th ACM Conference on Recom-
mender Systems, pp. 4–12, 2018.
[22] Y. Zhang, G. Lai, M. Zhang, Y. Zhang, Y. Liu, and
S. Ma, “Explicit factor models for explainable recom-
mendation based on phrase-level sentiment analysis,”
in Proceedings of the 37th international ACM SIGIR
conference on Research & development in information
retrieval, pp. 83–92, 2014.A. Appendix 1. super name: The name of super-feature. E.g.,
views per job.
A.1. Translate Narrative Templates into Code
2. insight item: A Scala Map which maps all the in-
We use the narrative template value change as an exam-
sight items in the narrative template to their correspond-
ple to show how we can translate it into Scala code. This
ing feature values for each sample. E.g., for customer
example can be easily generalized to other narrative tem-
A, insight item = Map("prev value" ->
plates and programming languages. Just to recap, the narra-
100, "current value" -> 150).
tive template value change is: “{super name} changed
from {prev value} to {current value} ({percent change}%)
in the last month”. In practice, we can conduct narrative template imputation by
simply calling this Scala function. For example, we can run
To calculate the extra insight item percent change, the following Scala code if we want to construct narrative
we can first build a helper function changePercent in insight of super-feature views per job for customer A:
Scala:
1 val narrativeInsightA =
1 def changePercent(current_value: Double, valueChangeInsight("views per job", Map
previous_value: Double): String = { ("prev_value" -> 100, "current_value"
2 val change_percent = -> 150))
3 (current_value, previous_value) match {
4 case (0, 0) => 0.0
The output will be “Views per job changed from 100 to 150
5 case (a, b) => (a / b - 1) * 100
6 } (+50%) in the last month”.
7 change_percent match {
8 case x if x.isInfinity => " " A.2. Additional Columns in Feature Info File
9 case x if x >= 0 => " (+" ++
change_percent ++ "%) " We briefly introduce three additional columns Insight
10 case _ => " (" ++ change_percent ++ " Threshold, Insight Weight and Source in Feature Info File.
%) " A sample Feature Info File for the jobs upsell use case with
11 }
12 } these three columns included is shown in Table 7 (Due to
space limitations, we omit columns that already exist in
This helper function is used to first calculate the percent Table 2 and 4). Intellige users can work with model owners
change from prev value to current value as to fill in these three columns, and adjust their values based
change percent, and then convert change percent on feedback collected from end users:
into a more user-friendly format: Empty if
change percent is infinite (e.g., changed from 0 to 4), Table 7. Feature Info File for selected features from jobs upsell
(+X%) if change percent is positive (e.g., changed model.
from 2 to 4 (+100%)), and (-X%) if change percent is Original- ··· Insight Insight Source
negative (e.g., changed from 4 to 2 (-50%)). Feature Threshold Weight
job qty ··· 0.8 model
With the help of this helper function, we then build the job dprice usd ··· 0.8 user
Scala function valueChangeInsight for the narrative job view s3 ··· percent 1 model
template value change which enables feature value im- change>10
putation:
job view s4 ··· percent 1 model
1 def valueChangeInsight(super_name: String change>10
, insight_item: Map[String, Double]): job viewer s3 ··· percent 1 model
String = {
2 val change_percent_desc: String = change>10
3 changePercent(insight_item(" job viewer s4 ··· percent 1 model
current_value"), change>10
4 insight_item("prev_value")) job applicant s3 ··· percent 1 model
5 (super_name.capitalize ++ " changed change>5
from "
6 ++ insight_item("prev_value") ++ " to " job applicant s4 ··· percent 1 model
7 ++ insight_item("current_value") change>5
8 ++ change_percent_desc ++ " in the last
month.")
9 }
• Insight threshold: This threshold can be used
This Scala function has two inputs: to filter out those narratives not meeting certaincriteria, so that the remaining narratives can be A.3. Narrative Ranking Example
more relevant to end users. For example, the in-
Table 8 shows one example of conducting narrative ranking
sight threshold for super-feature views per job
and deduplication in jobs upsell use case for customer A.
is percent change>10, thus only the narratives
We set K = 1 in narrative deduplication.
with the increment of job views larger than 10(%) will
be shown to end users.
Table 8. Example of narrative ranking and deduplication in jobs
• Insight weight: This weight can be used to make upsell use case.
adjustments to the narrative ranking. It takes val- Original- Super- Ultra- Feature
ues between 0 and 1 (default is 1), and is multiplied Feature Feature Feature Imp. Score
with the feature importance score from Model Inter- job qty job slots job slots 0.3
preter to determine the final importance score for each job dprice usd job slots job slots 0.4
original-feature. The motivation is to incorporate do- job view s3 views job view 0.2
main knowledge into narrative ranking: If we believe per job
some original-features are predictive in modeling but job view s4 views job view 0.6
not that informative to end users, we can lower their per job
insight weights to prevent prioritizing their correspond- job viewer s3 viewers job view 0.3
ing narratives. per job
• Source: Sometimes additional features from external job viewer s4 viewers job view 0.2
data sources can also be used in narrative construction per job
(together with model features). These additional fea- ⇓ Narrative Importance Score Calculation
tures are usually in the formats incompatible with the
predictive models (e.g., name, date and url), however, Super- Ultra- Narrative Narrative
they can help make the generated narratives more infor- Feature Feature Imp. Score
mative. For example, a narrative can be “This customer job slots job slots Purchased 30 0.4
spent 15 hours browsing websites last week, with the job slots ...
most visited website xyz.com”, where 15 is a model views job view Views per job 0.6
feature, and xyz.com is an additional feature which per job changed ...
can not be fed into the model directly. We can set viewers job view Viewers per job 0.3
“source” to be model or user to specify the source per job changed ...
of each original-feature. Note that one narrative cannot
⇓ Narrative Deduplication
be constructed by using only the additional features,
i.e., the additional features must be paired with at least Top Ultra- Top Narrative Narrative
one model features under the same super-feature, to Feature Imp. Score
make sure that a valid narrative importance score can job view Views per job changed ... 0.6
be assigned for narrative ranking. job slots Purchased 30 job slots ... 0.4
A.4. Feedback from Sales Representatives
We list several comments from sales representatives in their
original words:
• “These are awesome. I LOVE that you’ve called out
the % of employees. All of these are SUPER helpful.
The top insights are clear and concise. It would have
taken me a lot of time to find all of that information, so
I love that it is all laid out. It also prompts me to think
more strategically, which I love.”
• “Most accounts were on my radar, but perhaps not for
the reasons highlighted in the insights—so calling that
out provides a new perspective on potential entry point
into an account/ways to actively engage with relevant
insight/reason.”• “This SAR is clear to understand and is valuable by bringing important metrics to my attention. As I dig into SARs a bit more, time will tell which insights are most valuable to me.” • “As someone new to LI, this is incredibly helpful. It points me into the right direction and allows me to take action quickly and in a way that correlates to an activity we are seeing in Sales Navigator.” • “I love that the insights are consolidated all in one place, versus needing to run different reports in Mer- lin to gather the same information. I love the piece that highlights how many days reps are logging onto LinkedIn and searching on the platform.” • “Yes it’s very valuable and useful for conversations. It helps with next steps and the insights will help it lots of different ways to tell a story to a customer depending on where that conversation is at or to help prospect in.”
You can also read