Decreased grey matter volumes in unaffected mothers of individuals with autism spectrum disorder reflect the broader autism endophenotype
←
→
Page content transcription
If your browser does not render page correctly, please read the page content below
www.nature.com/scientificreports
OPEN Decreased grey matter
volumes in unaffected mothers
of individuals with autism spectrum
disorder reflect the broader autism
endophenotype
Kyung‑min An1,2*, Takashi Ikeda1,2, Tetsu Hirosawa1,2, Ken Yaoi1,2, Yuko Yoshimura1,2,3,
Chiaki Hasegawa1, Sanae Tanaka1,2, Daisuke N. Saito1,2* & Mitsuru Kikuchi1,2,4
Autism spectrum disorder (ASD) is a neurodevelopmental disorder with an early onset and a strong
genetic origin. Unaffected relatives may present similar but subthreshold characteristics of ASD. This
broader autism phenotype is especially prevalent in the parents of individuals with ASD, suggesting
that it has heritable factors. Although previous studies have demonstrated brain morphometry
differences in ASD, they are poorly understood in parents of individuals with ASD. Here, we estimated
grey matter volume in 45 mothers of children with ASD (mASD) and 46 age-, sex-, and handedness-
matched controls using whole-brain voxel-based morphometry analysis. The mASD group had smaller
grey matter volume in the right middle temporal gyrus, temporoparietal junction, cerebellum, and
parahippocampal gyrus compared with the control group. Furthermore, we analysed the correlations
of these brain volumes with ASD behavioural characteristics using autism spectrum quotient (AQ) and
systemizing quotient (SQ) scores, which measure general autistic traits and the drive to systemize.
Smaller volumes in the middle temporal gyrus and temporoparietal junction correlated with higher
SQ scores, and smaller volumes in the cerebellum and parahippocampal gyrus correlated with higher
AQ scores. Our findings suggest that atypical grey matter volumes in mASD may represent one of the
neurostructural endophenotypes of ASD.
Autism spectrum disorder (ASD) is an early-onset neurodevelopmental disorder that is characterized by social
and communication deficits, restricted interests, and repetitive behaviours1. ASD may develop as a result of com-
plex interactions between genetic vulnerability and environmental factors during critical neurodevelopmental
periods2. Although the exact cause of ASD remains unclear, ASD is one of the most heritable major neurodevel-
opmental disorders3,4. A recent meta-analysis reported its heritability as between 61 and 91%, suggesting that
ASD has a substantial genetic c omponent5.
According to genetic epidemiological data, relatives of individuals with ASD express subclinical autism-like
personality traits6,7. When Kanner and Asperger described autism, they reported that parents of individuals
with ASD have autistic traits, such as mild obsessiveness, late speech onset, and problems relating to the outside
world8,9. Most previous studies have reported that relatives of individuals with ASD experience more impaired
communication, rigid behaviour, mentalizing d eficits10–16, and general autistic t raits17,18 than the general popula-
tion. In relatives of individuals with ASD, autistic traits have been observed not only in behavioural and cognitive
aspects, but also in dysregulated neurochemical features, such as whole blood serotonin l evels19, reelin levels20,
and amino acid m etabolism21.
It has been suggested that these types of subthreshold autistic traits are part of the broader autism phenotype
(BAP)22. BAP traits are more prevalent in first-degree relatives of ASD probands compared with other groups,
1
Research Center for Child Mental Development, Kanazawa University, 13‑1 Takara‑machi, Kanazawa 920‑8640,
Japan. 2Division of Socio‑Cognitive‑Neuroscience, Department of Child Development, United Graduate School
of Child Development, Osaka University, Kanazawa University, Hamamatsu University School of Medicine,
Chiba University, and University of Fukui, Kanazawa, Japan. 3Institute of Human and Social Sciences, Kanazawa
University, Kanazawa, Japan. 4Department of Psychiatry and Behavioral Science, Kanazawa University, Kanazawa,
Japan. *email: eirene.akmin@gmail.com; sdaisuke@med.kanazawa-u.ac.jp
Scientific Reports | (2021) 11:10001 | https://doi.org/10.1038/s41598-021-89393-z 1
Vol.:(0123456789)
www.nature.com/scientificreports/
which supports the assumption of the genetic heritability of A SD23,24. By studying the parents of individuals with
ASD, it may be possible to further understand the different endophenotypes (also called intermediate pheno-
types) of ASD25,26. An endophenotype is a heritable and quantitative trait that is intermediary between disease
symptoms and the genes associated with the d isease27.
Regarding brain structure and function in ASD, previous neuroimaging studies have reported that indi-
viduals with ASD show abnormalities in many brain regions, including the superior temporal sulcus, middle
temporal gyrus (MTG), temporoparietal junction (TPJ), fusiform gyrus, amygdala, anterior cingulate cortex,
medial prefrontal cortex, inferior frontal gyrus, hippocampus, parahippocampal gyrus, corpus callosum, and
cerebellum28–34. Although atypical brain structures in ASD have frequently been reported, the brain structures
of parents of individuals with ASD are poorly understood and findings remain c ontroversial25,26,35,36. Rojas et al.
reported that the parents of individuals with ASD showed greater left hippocampal volume than a control g roup36.
Peterson et al. found that the parents of individuals with ASD had increased volumes in some brain areas, includ-
ing the superior temporal gyri, inferior and middle frontal gyri, superior parietal lobule, and anterior cingulate,
as well as decreased volume in the left anterior cerebellar hemisphere35. In contrast, Palmen et al. reported no
significant differences in brain structure of parents of individuals with ASD compared with a control g roup26.
The discrepant findings between previous studies on the parents of individuals with ASD may be the result of
different analytical methods (e.g. manual tracing, automatic tracing, or whole-brain voxel-based morphometry
[VBM]), subject numbers (which is related to statistical power), or sex distribution of subjects.
In the present study, we applied whole-brain VBM analysis to 45 mothers of children with ASD (mASD) and
46 age-, sex-, and handedness-matched controls. We compared grey matter (GM) volume between the mASD
and control groups to investigate the heritable aspects of brain structure and the neuroendophenotypes of ASD.
We hypothesized that the mASD group would show some of the atypical brain structure patterns that have
been previously reported in individuals with ASD. Furthermore, we aimed to determine whether brain volume
abnormalities in mASD are correlated with scores on the autism spectrum quotient (AQ) and the systemizing
quotient (SQ), which measure general autistic traits and the drive to s ystemize37,38.
Methods
Participants. We recruited 46 healthy mothers of children with ASD (mASD group) and 48 age-matched
healthy mothers of typically developing children (control group). Owing to low data quality, we excluded the
data of one participant from the mASD group and the data of two participants from the control group. We ana-
lysed the data of 45 healthy mothers of children with ASD for the mASD group (mean age = 38.33 years, standard
deviation [SD] = 4.33). We confirmed the diagnoses of the children with ASD using the Diagnostic and Statistical
Manual of Mental Disorders Fifth Edition (DSM-V) c riteria1, the Diagnostic Interview for Social and Com-
munication Disorders39, and/or the Autism Diagnostic Observational Schedule–Generic40. All diagnoses were
confirmed by local psychiatrists and clinical speech therapists. We used data from 46 age-matched healthy moth-
ers of typically developing children for the control group (mean age = 38.78 years, SD = 3.98). All participants
were recruited from public nursery schools in Kanazawa city, Kanazawa University Hospital, and prefectural
hospitals in Toyama. Parents who reported difficulties in daily life because of their own intelligence level, or who
were being treated for any mental illness, were excluded from this study. None of the participants had received
an official diagnosis of autism. All participants provided full written informed consent to participate in the study,
and the procedures were approved by the ethics committee of Kanazawa University Hospital. All methods were
performed in accordance with the Kanazawa University Hospital Ethics Committee guidelines and regulations.
The Edinburgh Handedness Inventory41 revealed that most participants were right-handed, except for one
left-handed and one ambidextrous participant per group. We matched the groups on age, sex, and handedness
to reduce potential confounding factors.
To evaluate the autistic-like behavioural features of the two groups, we used the AQ, which measures autistic
traits38, and the SQ, which measures the drive to s ystemize37. Both assessments are self-report questionnaires.
Total AQ scores can range from 0 to 50; a higher AQ score indicates that the individual has more ‘autistic-like’
behaviours. Total SQ scores can range from 0 to 80; a higher SQ score corresponds to a greater drive to systemize
and is a behavioural characteristic of ASD. Additional participant details are shown in Table 1.
Magnetic resonance imaging (MRI) acquisition. Structural MRI scans were acquired using a 1.5 T MRI
scanner (SIGNA Explorer, GE Healthcare, Chicago, IL, USA) with a T1-weighted Fast SPGR sequence using the
following parameters: repetition time = 8.364 ms, echo time = 3.424 ms, flip angle = 12°, field of view = 260 mm,
matrix size = 512 × 512 pixels, slice thickness = 1 mm, and 176 transaxial images.
VBM analysis. VBM was performed using the Computational Anatomical Toolbox 12 (CAT12; Structural
Brain Mapping Group, Jena University Hospital, Jena, Germany) implemented in Statistical Parametric Mapping
12 (SPM12; Wellcome Trust Centre for Neuroimaging, London, UK).
T1-weighted anatomical images were corrected for bias-field inhomogeneities, and were then segmented
into GM, white matter (WM), and cerebrospinal fluid (CSF)42. The total GM, WM, and CSF volume was cal-
culated as the total intracranial volume (TIV). Each tissue class was spatially normalized into the DARTEL
template in Montreal Neurological Institute space, which is derived from 555 healthy subjects aged between 20
and 80 years from the IXI-database43. The segmentation process was further extended by accounting for partial
volume estimations44. We tested data quality and sample homogeneity using Mahalanobis distance algorithms
implemented in CAT12. Mahalanobis distance combines weighted overall image quality, which is a measure of
noise and other image artefacts (e.g. motion) before preprocessing, and mean correlation, which is a measure of
the data homogeneity after preprocessing. We excluded the data of one participant from the mASD group and
Scientific Reports | (2021) 11:10001 | https://doi.org/10.1038/s41598-021-89393-z 2
Vol:.(1234567890)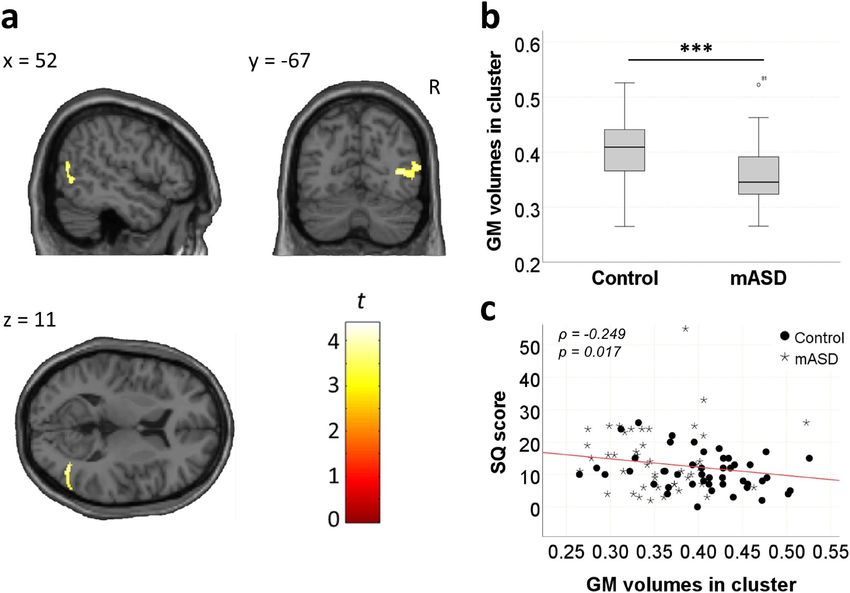
www.nature.com/scientificreports/
Characteristics Controls (n = 46) mASD (n = 45) t P
Age in years 38.78 ± 3.98 38.33 ± 4.33 0.516 0.607
Handedness (right/left/ambidextrous) 44/1/1 43/1/1
AQ 14.74 ± 6.74 17.31 ± 7.40 − 1.734 0.086
SQ 10.98 ± 5.75 14.60 ± 10.02 − 2.109 0.039
TIV 1396.44 ± 88.17 1355.37 ± 92.19 2.172 0.033*
TGM 619.62 ± 37.97 606.73 ± 37.79 1.623 0.108
TWM 486.82 ± 42.48 464.50 ± 39.75 2.587 0.011*
CSF 289.47 ± 40.04 283.62 ± 49.27 0.623 0.535
Table 1. Participant characteristics. Means ± standard deviations and accompanying statistics (two-sided
t-tests) for participant characteristics. There were no significant differences in age, AQ score, or SQ score
between the control and mASD groups (two-sample t-tests with FDR multiple corrections). TIVs were
significantly different between the control and mASD groups. *P < 0.05. AQ autism spectrum quotient, mASD
mothers of individuals with autism spectrum disorder, SQ systemizing quotient, TIV total intracranial volume,
TGM total grey matter volume, TWM total white matter volume, CSF cerebrospinal fluid, FDR false discovery
rate.
the data of two participants from the control group, because the Mahalanobis distance was larger than 2 SDs for
these data. For further analysis, we used data from 45 mASD group participants and 46 control group partici-
pants. The preprocessed scans were smoothed using a Gaussian kernel of 6 mm (full width at half maximum).
Statistical analysis. We compared absolute volumes of GM structures using modulated images. To analyse
the GM differences between the mASD and control groups, we performed voxel-wise two-sample t-tests using
the general linear model implemented in SPM12, which uses Gaussian random field theory. We used the covari-
ates of total GM and age as potential confounders in the general linear model.
The clusters were considered significant at P < 0.05 after correcting for false discovery rate (FDR) comparisons
(with initial peak-level thresholding at P < 0.001 and clusters > 200 voxels). Automated anatomical labelling was
used to label the significant clusters45.
The volumes of the significant clusters were extracted, and Spearman’s rho test was conducted with AQ and
SQ scores using the Statistical Package for Social Sciences (SPSS, Version 25). For all statistical analyses, we used
an alpha level of 0.05 with FDR multiple corrections.
Ethics approval and consent to participate. This study was approved by the ethics committee of
Kanazawa University Hospital. After receiving a complete explanation of the study, all participants provided full
written informed consent.
Results
For autistic-like behavioural features, there was no significant difference in AQ and SQ scores between the two
groups with FDR correction (AQ scores: t(89) = − 1.734, P = 0.086; SQ scores: t(89) = − 2.109, P = 0.039).
The VBM analysis demonstrated that GM volumes in several brain regions were smaller in the mASD group
relative to the control group. Two clusters showed statistically significant differences between the mASD and
control groups (Fig. 1).
We observed the first significant cluster in the right MTG (88.42%) and OUTSIDE (9.60%) regions (Table 2).
The anatomical label “OUTSIDE” indicates that this part of the region is outside the brain parcellation. This clus-
ter comprised the posterior part of the MTG and stretched into the parietal side. According to a previous study
on brain anatomy of the TPJ46, the parietal part of this cluster can be defined as the brain region at or outside
the posterior and inferior edge of the TPJ. The mASD group had smaller GM volume in this cluster compared
with the control group (t(89) = 4.330, P = 0.000) (Fig. 2a,b). Furthermore, the mASD group also had smaller GM
volume in the second cluster (t(89) = 3.528, P = 0.001) (Fig. 3a,b). The second cluster was labelled as the right
cerebellum (85.71%) and the parahippocampal gyrus (9.07%) (Table 2). There were no significant increases in
GM volume in the mASD group relative to the control group.
We also identified correlations between the significant GM volume clusters and behavioural traits, using
Spearman’s rho test. AQ scores were negatively correlated with the second cluster (ρ = − 0.252, P = 0.016) (Fig. 3c).
However, they were not correlated with the first cluster (P > 0.05). In contrast, SQ scores were negatively cor-
related with the first cluster (ρ = − 0.249, P = 0.017) (Fig. 2c), but were not correlated with the second cluster
(P > 0.05).
Discussion
ASD is one of the most heritable major neurodevelopmental disorders. Unaffected relatives of individuals with
ASD, and especially the parents of individuals with ASD, have been widely reported to have subclinical forms of
behavioural and neurobiological patterns that are characteristic of ASD. This feature of the parents of individuals
Scientific Reports | (2021) 11:10001 | https://doi.org/10.1038/s41598-021-89393-z 3
Vol.:(0123456789)www.nature.com/scientificreports/
Figure 1. Grey matter volume differences between the mASD and control groups. (a) Areas of decreased grey
matter volume in the mASD group, compared with the control group, from the voxel-wise two-sample t-test.
All clusters shown in the results survived thresholding at P < 0.05 after FDR correction. (b) Two clusters were
significantly smaller in the mASD group. Numbers denote MNI coordinates. The colour intensity represents
t-statistic values at the voxel level. The results are visualized on standard normalized T1-weighted images
in selected slices and displayed in accordance with neurological convention (i.e. right hemisphere on the
right). mASD mothers of individuals with autism spectrum disorder, FDR false discovery rate, MNI Montreal
Neurological Institute.
with ASD has been termed the BAP. However, the brain structural features of parents of individuals with ASD
are poorly understood and findings remain controversial.
In the present study, we observed the phenomenon of BAP through the subthreshold autistic-like behavioural
features of mASD. We found qualitative differences in AQ and SQ scores between the mASD and control groups,
although these were not significant when corrected for multiple comparisons. These findings suggest that parents
of children with ASD have subclinical elevations in ASD traits.
To investigate the brain structural features of parents of individuals with ASD, we used VBM to examine
brain GM volume in 45 unaffected mASD and 46 age-, sex-, and handedness-matched controls. We identified
smaller GM volume in the MTG, TPJ, cerebellum, and parahippocampal gyrus in the mASD group. Moreover,
we found that the volume of the significant MTG and TPJ cluster was negatively correlated with SQ scores, which
assess the autistic drive to analyse or construct systems. Additionally, the volume of the significant cerebellum
and parahippocampal gyrus cluster was negatively correlated with AQ scores, which measure autistic traits.
Scientific Reports | (2021) 11:10001 | https://doi.org/10.1038/s41598-021-89393-z 4
Vol:.(1234567890)www.nature.com/scientificreports/
Peak MNI coordinates in mm
Cluster size qFDR x y z Brain regions (AAL)
mASD < control
Temporal_Mid_R (88.42%)
354 0.014 42 − 69 8
OUTSIDE (9.60%)
Cerebellum_4_5_R (54.67%)
364 0.014 18 − 41 − 24 Cerebellum_3_R (31.04%)
ParaHippocampal_R (9.07%)
mASD > control
None
Table 2. Brain regions with significant volume differences between the mASD and control groups. Only
clusters with qFDR < 0.05 and their maximum peak voxels are presented; only AAL-defined regions
comprising ≥ 5% of a cluster are listed. The “OUTSIDE” anatomical label indicates a part of the region outside
the parcellation. AAL automated anatomical labelling, MNI Montreal Neurological Institute, mASD mothers of
individuals with autism spectrum disorder, qFDR false discovery rate q-value.
Figure 2. Grey matter volume differences between the mASD and control groups in the first cluster. (a) The
first significant cluster was observed in the right middle temporal gyrus. (b) Grey matter volume of the cluster
was significantly different between the mASD and control groups (t(89) = 4.330, P = 0.000). (c) Scatter plot
showing negative correlation between the grey matter extraction of the cluster and SQ scores for all subjects. The
grey matter volume of the cluster was negatively correlated with SQ scores (ρ = − 0.249, P = 0.017). ***P < 0.001.
GM grey matter, mASD mothers of individuals with autism spectrum disorder, SQ systemizing quotient.
The MTG is associated with language, emotion, and social cognition (i.e. theory of mind or mentalization)47–50
and may be related to dysfunctions in mentalization and social processing in ASD51–56. Structural and functional
imaging studies have shown that the MTG is atypical in individuals with ASD, but findings remain controver-
sial. A previous study reported that an ASD group showed decreased GM volume in the MTG, similar to our
findings that the mASD group had smaller MTG v olume57. In contrast, several previous meta-analytic studies
Scientific Reports | (2021) 11:10001 | https://doi.org/10.1038/s41598-021-89393-z 5
Vol.:(0123456789)www.nature.com/scientificreports/
Figure 3. Grey matter volume differences between the mASD and control groups in the second cluster. (a) The
second significant cluster was observed in the right cerebellum and parahippocampal gyrus. (b) Grey matter
volume of the cluster was significantly different between the mASD and control groups (t(89) = 3.528, P = 0.001).
(c) Scatter plot showing negative correlation between the grey matter extraction of the cluster and AQ scores
for all subjects. The grey matter volume of the cluster was negatively correlated with AQ scores (ρ = − 0.252,
P = 0.016). **P < 0.01. GM grey matter, mASD mothers of individuals with autism spectrum disorder, AQ autism
spectrum quotient.
found that an ASD group had increased GM volume in the M TG58,59. Other meta-analytic studies have reported
both increased and decreased GM volume in the MTG in ASD p articipants60,61. Regarding brain connectivity,
individuals with ASD have hypoconnectivity of the posterior part of the MTG, indicating an association between
the MTG and social cognition62,63.
The TPJ is a multimodal association area that receives and integrates input from the thalamus and multiple
sensory modalities. Abnormalities in the higher-order integration area have been associated with lack of a
mentalizing ability (i.e. theory of mind)64,65. The TPJ may play an important role in mentalizing, and mental-
izing deficits are considered a key characteristic of A SD66–70. Moreover, TPJ abnormalities are one of the most
consistent findings of brain structure71,72 and f unction67,73 in ASD.
The MTG and TPJ have often been implicated as aspects of the social brain, along with the superior tempo-
ral sulcus, fusiform gyrus, amygdala, anterior cingulate cortex, medial prefrontal cortex, and inferior frontal
g yrus28,29,74,75. Abnormalities in the social brain regions have been widely suggested to result in poor social
interactions in individuals with A SD30,31,73,76–78.
In the present study, smaller GM volumes within the MTG and TPJ correlated with higher SQ scores. The
SQ assesses the drive to systemize, analyse, control, and construct rule-based systems, and all these features are
involved in A SD37. Systemizing characteristics may mean that an individual is more interested in objects and/
or rule-based systems than in social communication37,79. We thus speculate that a stronger drive to systemize
is correlated with a smaller volume in social brain areas such as the MTG and TPJ. We suggest that the atypical
GM volume of these social parts of the brain (i.e. the MTG and TPJ) may represent a potential neuroendophe-
notype of ASD.
We also identified a smaller volume in the cerebellum and parahippocampal gyrus of the mASD group.
Although the cerebellum accounts for only 10% of the brain’s volume, it contains over half of all brain neurons80.
The cerebellum plays an integrative role in the brain and connects many brain r egions32,81–84. The cerebellum
receives sensory information and conveys outputs to influence motor function through the cerebello-thalamo-
cortical loops84–86. The cerebello-thalamocortical loops also have interconnections with the cerebral cortices and
contribute to cognitive processing, including visuospatial perception, auditory processing, executive functions,
Scientific Reports | (2021) 11:10001 | https://doi.org/10.1038/s41598-021-89393-z 6
Vol:.(1234567890)www.nature.com/scientificreports/
and language skills81,83,84,86,87. The cerebellum is also linked to the frontal cortex88 and is involved in high-order
cognitive functions82,83. Together, these findings indicate that the cerebellum is associated not only with motor
coordination, but also with various forms of cognitive processing81,89,90.
Cerebellar abnormalities have been reported in individuals with ASD from early life through to
adulthood33,34,91–94. Several previous studies on brain structure in ASD have reported decreased GM volume in the
cerebellum in ASD groups, similar to our findings for the mASD group58,59. However, some meta-analytic studies
have found that ASD groups showed decreased as well as increased GM volume in the cerebellum60,95. Recently,
cerebellar neuropathology has gained attention as a means of explaining the characteristics of ASD32,87,96. Cerebel-
lar abnormalities may be related to some ASD characteristics, such as a high rate of motor dysfunction, atypical
sensory responsiveness, and impaired c ommunication97–99.
The parahippocampal gyrus is an important pathway to the hippocampus and mediates convergent neo-
cortical information for memory r epresentations100. Functional MRI studies have shown that the right anterior
parahippocampal gyrus is involved in the interactions between memory and e motion101, and may contribute to
involuntary reactions associated with contextual fear memory that result in avoidance b ehaviour102. Previous
brain structure studies have reported that individuals with ASD have abnormal patterns in the parahippocampal
gyrus34,103,104. Furthermore, a reduction in parahippocampal GM volume may be related to the tendency to ignore
dangers in individuals with ASD104.
In the present study, smaller GM volumes within the cerebellum and parahippocampal gyrus were related to
higher levels of autistic traits. The cerebellum and parahippocampal gyrus play a role in receiving information
from the cerebral cortex, and contribute to influencing emotional processing and various types of cognitive
processing. We speculate that abnormalities in these brain areas may result in an atypical mediating pattern for
emotional and cognitive processing in ASD. The small GM volumes in these brain regions might be related to
subclinical ASD behavioural features, and may reflect a heritable neurobiological feature of ASD.
Our findings did not replicate the results of previous structural MRI studies of parents of individuals with
ASD. There have been three such studies and they have reported inconsistent fi ndings26,35,36. Rojas et al. meas-
ured volume in the hippocampus and amygdala in ASD individuals, the parents of individuals with ASD, and
control subjects using manual-tracing t echniques36. Both ASD individuals and parents of individuals with ASD
had increased left hippocampal volume compared with the control group. In contrast, Palmen et al. used a semi-
automatic procedure to compare the volume of the total brain, cortical lobes, cerebral GM and WM, cerebellum,
and ventricles in the parents of individuals with ASD and a control group26. They found no significant differ-
ences in brain volume between the two groups. Peterson et al. used a VBM-based approach to compare regional
GM volumes between a relatively small number of subjects (23 parents of individuals with ASD and 23 control
subjects; 15 mothers and 8 fathers per group)35. They reported that the parents of individuals with ASD had
increased volumes of the superior temporal gyri, inferior and middle frontal gyri, superior parietal lobule, and
anterior cingulate, as well as decreased left anterior cerebellar hemisphere volume. The discrepancies between
these three studies may result from both different analytical methods (manual-tracing technique, semi-automatic
technique, or VBM methods) and participant characteristics (the number or sex of subjects).
Limitations. In the present study, we examined the GM volume in mothers of children with ASD, to exclude
any potential confounding factors related to sex. To increase the generalizability of our findings, additional
studies should include data from the fathers of children with ASD. In addition, further studies are required to
investigate the relationship between brain imaging and gene expression, to provide more solid evidence for BAP
neuroendophenotypes. We used AQ and SQ scores to assess autistic-like behavioural features of the participants.
A study limitation is that these are self-report measures. We found that a considerable part of the first cluster
was outside the anatomy parcellations (i.e. outside the brain) and the second cluster spans biologically distinct
structures. These results may have been affected by motion, although we checked for noise and discarded noisy
data using the Mahalanobis distance algorithm. It is necessary to confirm the present results using motion detec-
tion techniques in the future study.
Conclusions
Previous findings on brain structure in individuals with ASD and their parents are controversial. In the present
study, we calculated GM volume in mASD and control groups using the whole-brain VBM method. We found
that compared with the control group, the mASD group had smaller GM volumes in the MTG, TPJ, cerebellum,
and parahippocampal gyrus. Our findings provide evidence to clarify controversial findings regarding inter-
mediate neurobiological patterns observed in relatives of individuals with ASD, which we hope will ultimately
help elucidate the underlying neurobiology of ASD. We suggest that these brain regions represent heritable brain
structural features of ASD.
Data availability
The datasets generated and/or analysed during the current study are not publicly available as they contain infor-
mation that could compromise the privacy of research participants but are available from the corresponding
author on reasonable request.
Received: 27 October 2020; Accepted: 26 April 2021
References
1. American Psychiatric Association. Diagnostic and Statistical Manual of Mental Disorders, Fifth Edition. (2013).
Scientific Reports | (2021) 11:10001 | https://doi.org/10.1038/s41598-021-89393-z 7
Vol.:(0123456789)www.nature.com/scientificreports/
2. Rossignol, D. A., Genuis, S. J. & Frye, R. E. Environmental toxicants and autism spectrum disorders: A systematic review. Transl.
Psychiatry 4, e360. https://doi.org/10.1038/tp.2014.4 (2014).
3. Abrahams, B. S. & Geschwind, D. H. Advances in autism genetics: On the threshold of a new neurobiology. Nat. Rev. Genet. 9,
341–355. https://doi.org/10.1038/nrg2346 (2008).
4. Levy, S. E., Mandell, D. S. & Schultz, R. T. Autism. Lancet 374, 1627–1638. https://doi.org/10.1016/S0140-6736(09)61376-3
(2009).
5. Tick, B., Bolton, P., Happe, F., Rutter, M. & Rijsdijk, F. Heritability of autism spectrum disorders: A meta-analysis of twin studies.
J. Child Psychol. Psychiatry 57, 585–595. https://doi.org/10.1111/jcpp.12499 (2016).
6. Dell’Osso, L., Dalle Luche, R. & Maj, M. Adult autism spectrum as a transnosographic dimension. CNS Spectr. 21, 131–133.
https://doi.org/10.1017/S1092852915000450 (2016).
7. Freitag, C. M. The genetics of autistic disorders and its clinical relevance: A review of the literature. Mol. Psychiatry 12, 2–22.
https://doi.org/10.1038/sj.mp.4001896 (2007).
8. Asperger, H. Die autistischen Psychopathen im Kindersalter. Arch. Psychiatr. Nervenkr. 117, 76–136 (1944).
9. Kanner, L. Autistic disturbances of affective contact. Nervous Child 2, 217–250 (1943).
10. Baron-Cohen, S. & Hammer, J. Parents of children with Asperger syndrome: What is the cognitive phenotype?. J. Cogn. Neurosci.
9, 548–554 (1997).
11. Gerdts, J. & Bernier, R. The broader autism phenotype and its implications on the etiology and treatment of autism spectrum
disorders. Autism Res. Treat. 2011, 545901. https://doi.org/10.1155/2011/545901 (2011).
12. Gillberg, C., Gillberg, I. C. & Steffenburg, S. Siblings and parents of children with autism: A controlled population-based study.
Dev. Med. Child Neurol. 34, 389–398. https://doi.org/10.1111/j.1469-8749.1992.tb11450.x (1992).
13. Lainhart, J. E. et al. Autism, regression, and the broader autism phenotype. Am. J. Med. Genet. 113, 231–237. https://doi.org/10.
1002/ajmg.10615 (2002).
14. Landa, R. et al. Social language use in parents of autistic individuals. Psychol. Med. 22, 245–254. https://doi.org/10.1017/s0033
291700032918 (1992).
15. Piven, J. et al. Personality and language characteristics in parents from multiple-incidence autism families. Am. J. Med. Genet.
74, 398–411 (1997).
16. Sucksmith, E., Roth, I. & Hoekstra, R. A. Autistic traits below the clinical threshold: Re-examining the broader autism phenotype
in the 21st century. Neuropsychol. Rev. 21, 360–389. https://doi.org/10.1007/s11065-011-9183-9 (2011).
17. Hasegawa, C. et al. Broader autism phenotype in mothers predicts social responsiveness in young children with autism spectrum
disorders. Psychiatry Clin. Neurosci. 69, 136–144. https://doi.org/10.1111/pcn.12210 (2015).
18. Wheelwright, S., Auyeung, B., Allison, C. & Baron-Cohen, S. Defining the broader, medium and narrow autism phenotype
among parents using the Autism Spectrum Quotient (AQ). Mol. Autism 1, 10. https://doi.org/10.1186/2040-2392-1-10 (2010).
19. Leboyer, M. et al. Whole blood serotonin and plasma beta-endorphin in autistic probands and their first-degree relatives. Biol.
Psychiatry 45, 158–163. https://doi.org/10.1016/s0006-3223(97)00532-5 (1999).
20. Fatemi, S. H., Stary, J. M. & Egan, E. A. Reduced blood levels of reelin as a vulnerability factor in pathophysiology of autistic
disorder. Cell Mol. Neurobiol. 22, 139–152. https://doi.org/10.1023/a:1019857620251 (2002).
21. Aldred, S., Moore, K. M., Fitzgerald, M. & Waring, R. H. Plasma amino acid levels in children with autism and their families. J.
Autism Dev. Disord. 33, 93–97. https://doi.org/10.1023/a:1022238706604 (2003).
22. Piven, J., Palmer, P., Jacobi, D., Childress, D. & Arndt, S. Broader autism phenotype: Evidence from a family history study of
multiple-incidence autism families. Am. J. Psychiatry 154, 185–190. https://doi.org/10.1176/ajp.154.2.185 (1997).
23. Bailey, A., Palferman, S., Heavey, L. & Le Couteur, A. Autism: The phenotype in relatives. J. Autism Dev. Disord. 28, 369–392.
https://doi.org/10.1023/a:1026048320785 (1998).
24. Losh, M., Childress, D., Lam, K. & Piven, J. Defining key features of the broad autism phenotype: a comparison across parents
of multiple- and single-incidence autism families. Am. J. Med. Genet. B Neuropsychiatr. Genet. 147B, 424–433, doi:https://doi.
org/10.1002/ajmg.b.30612 (2008).
25. Billeci, L. et al. The broad autism (Endo)Phenotype: Neurostructural and neurofunctional correlates in parents of individuals
with autism spectrum disorders. Front. Neurosci. 10, 346. https://doi.org/10.3389/fnins.2016.00346 (2016).
26. Palmen, S. J. et al. Brain anatomy in non-affected parents of autistic probands: A MRI study. Psychol. Med. 35, 1411–1420. https://
doi.org/10.1017/S0033291705005015 (2005).
27. Gottesman, I. I. & Gould, T. D. The endophenotype concept in psychiatry: Etymology and strategic intentions. Am. J. Psychiatry
160, 636–645. https://doi.org/10.1176/appi.ajp.160.4.636 (2003).
28. Adolphs, R. The neurobiology of social cognition. Curr. Opin. Neurobiol. 11, 231–239. https://doi.org/10.1016/s0959-4388(00)
00202-6 (2001).
29. Kennedy, D. P. & Adolphs, R. The social brain in psychiatric and neurological disorders. Trends Cogn. Sci. 16, 559–572. https://
doi.org/10.1016/j.tics.2012.09.006 (2012).
30. Sato, W. et al. Reduced gray matter volume in the social brain network in adults with autism spectrum disorder. Front. Hum.
Neurosci. 11, 395. https://doi.org/10.3389/fnhum.2017.00395 (2017).
31. Williams, J. H. et al. Neural mechanisms of imitation and “mirror neuron” functioning in autistic spectrum disorder. Neuropsy-
chologia 44, 610–621. https://doi.org/10.1016/j.neuropsychologia.2005.06.010 (2006).
32. Wang, S. S., Kloth, A. D. & Badura, A. The cerebellum, sensitive periods, and autism. Neuron 83, 518–532. https://doi.org/10.
1016/j.neuron.2014.07.016 (2014).
33. Stanfield, A. C. et al. Towards a neuroanatomy of autism: A systematic review and meta-analysis of structural magnetic resonance
imaging studies. Eur. Psychiatry 23, 289–299. https://doi.org/10.1016/j.eurpsy.2007.05.006 (2008).
34. Abell, F. et al. The neuroanatomy of autism: A voxel-based whole brain analysis of structural scans. NeuroReport 10, 1647–1651.
https://doi.org/10.1097/00001756-199906030-00005 (1999).
35. Peterson, E. et al. A voxel-based morphometry study of gray matter in parents of children with autism. NeuroReport 17, 1289–
1292. https://doi.org/10.1097/01.wnr.0000233087.15710.87 (2006).
36. Rojas, D. C. et al. Hippocampus and amygdala volumes in parents of children with autistic disorder. Am. J. Psychiatry 161,
2038–2044. https://doi.org/10.1176/appi.ajp.161.11.2038 (2004).
37. Baron-Cohen, S., Richler, J., Bisarya, D., Gurunathan, N. & Wheelwright, S. The systemizing quotient: An investigation of adults
with Asperger syndrome or high-functioning autism, and normal sex differences. Philos. Trans. R. Soc. Lond. B Biol. Sci. 358,
361–374. https://doi.org/10.1098/rstb.2002.1206 (2003).
38. Baron-Cohen, S., Wheelwright, S., Skinner, R., Martin, J. & Clubley, E. The autism-spectrum quotient (AQ): Evidence from
Asperger syndrome/high-functioning autism, males and females, scientists and mathematicians. J. Autism Dev. Disord. 31, 5–17.
https://doi.org/10.1023/a:1005653411471 (2001).
39. Wing, L., Leekam, S. R., Libby, S. J., Gould, J. & Larcombe, M. The diagnostic interview for social and communication disorders:
background, inter-rater reliability and clinical use. J. Child. Psychol. Psychiatry 43, 307–325. https://doi.org/10.1111/1469-7610.
00023 (2002).
40. Lord, C. et al. The autism diagnostic observation schedule-generic: A standard measure of social and communication deficits
associated with the spectrum of autism. J. Autism Dev. Disord. 30, 205–223 (2000).
Scientific Reports | (2021) 11:10001 | https://doi.org/10.1038/s41598-021-89393-z 8
Vol:.(1234567890)www.nature.com/scientificreports/
41. Oldfield, R. C. The assessment and analysis of handedness: The Edinburgh inventory. Neuropsychologia 9, 97–113. https://doi.
org/10.1016/0028-3932(71)90067-4 (1971).
42. Ashburner, J. & Friston, K. J. Unified segmentation. Neuroimage 26, 839–851. https://doi.org/1 0.1 016/j.n euroimage.2005.0 2.018
(2005).
43. Ashburner, J. A fast diffeomorphic image registration algorithm. Neuroimage 38, 95–113. https://doi.org/10.1016/j.neuroimage.
2007.07.007 (2007).
44. Tohka, J., Zijdenbos, A. & Evans, A. Fast and robust parameter estimation for statistical partial volume models in brain MRI.
Neuroimage 23, 84–97. https://doi.org/10.1016/j.neuroimage.2004.05.007 (2004).
45. Tzourio-Mazoyer, N. et al. Automated anatomical labeling of activations in SPM using a macroscopic anatomical parcellation
of the MNI MRI single-subject brain. Neuroimage 15, 273–289. https://doi.org/10.1006/nimg.2001.0978 (2002).
46. Schurz, M., Tholen, M. G., Perner, J., Mars, R. B. & Sallet, J. Specifying the brain anatomy underlying temporo-parietal junction
activations for theory of mind: A review using probabilistic atlases from different imaging modalities. Hum. Brain Map. 38,
4788–4805. https://doi.org/10.1002/hbm.23675 (2017).
47. Haxby, J. V., Hoffman, E. A. & Gobbini, M. I. The distributed human neural system for face perception. Trends Cogn. Sci. 4,
223–233. https://doi.org/10.1016/s1364-6613(00)01482-0 (2000).
48. Mosconi, M. W., Mack, P. B., McCarthy, G. & Pelphrey, K. A. Taking an “intentional stance” on eye-gaze shifts: A functional
neuroimaging study of social perception in children. Neuroimage 27, 247–252. https://doi.org/10.1016/j.neuroimage.2005.03.
027 (2005).
49. Vollm, B. A. et al. Neuronal correlates of theory of mind and empathy: A functional magnetic resonance imaging study in a
nonverbal task. Neuroimage 29, 90–98. https://doi.org/10.1016/j.neuroimage.2005.07.022 (2006).
50. Whitney, C., Jefferies, E. & Kircher, T. Heterogeneity of the left temporal lobe in semantic representation and control: Priming
multiple versus single meanings of ambiguous words. Cereb. Cortex 21, 831–844. https://doi.org/10.1093/cercor/bhq148 (2011).
51. Assaf, M. et al. Mentalizing and motivation neural function during social interactions in autism spectrum disorders. Neuroimage
Clin. 3, 321–331. https://doi.org/10.1016/j.nicl.2013.09.005 (2013).
52. Critchley, H. D. et al. The functional neuroanatomy of social behaviour: Changes in cerebral blood flow when people with autistic
disorder process facial expressions. Brain 123(Pt 11), 2203–2212. https://doi.org/10.1093/brain/123.11.2203 (2000).
53. Georgescu, A. L. et al. Neural correlates of “social gaze” processing in high-functioning autism under systematic variation of
gaze duration. Neuroimage Clin. 3, 340–351. https://doi.org/10.1016/j.nicl.2013.08.014 (2013).
54. Koshino, H. et al. fMRI investigation of working memory for faces in autism: Visual coding and underconnectivity with frontal
areas. Cereb. Cortex 18, 289–300. https://doi.org/10.1093/cercor/bhm054 (2008).
55. Monk, C. S. et al. Neural circuitry of emotional face processing in autism spectrum disorders. J. Psychiatry Neurosci. 35, 105–114.
https://doi.org/10.1503/jpn.090085 (2010).
56. von dem Hagen, E. A., Stoyanova, R. S., Rowe, J. B., Baron-Cohen, S. & Calder, A. J. Direct gaze elicits atypical activation of the
theory-of-mind network in autism spectrum conditions. Cereb. Cortex 24, 1485–1492. https://doi.org/10.1093/cercor/bht003
(2014).
57. Greimel, E. et al. Changes in grey matter development in autism spectrum disorder. Brain Struct. Funct. 218, 929–942. https://
doi.org/10.1007/s00429-012-0439-9 (2013).
58. Lukito, S. et al. Comparative meta-analyses of brain structural and functional abnormalities during cognitive control in attention-
deficit/hyperactivity disorder and autism spectrum disorder. Psychol. Med. 50, 894–919. https://doi.org/10.1017/S003329172
0000574 (2020).
59. Yang, X. et al. Brain gray matter alterations and associated demographic profiles in adults with autism spectrum disorder: A
meta-analysis of voxel-based morphometry studies. Aust. N Z J. Psychiatry 50, 741–753. https://doi.org/10.1177/0004867415
623858 (2016).
60. Cauda, F. et al. Grey matter abnormality in autism spectrum disorder: An activation likelihood estimation meta-analysis study.
J. Neurol. Neurosurg. Psychiatry 82, 1304–1313. https://doi.org/10.1136/jnnp.2010.239111 (2011).
61. Duerden, E. G., Mak-Fan, K. M., Taylor, M. J. & Roberts, S. W. Regional differences in grey and white matter in children and
adults with autism spectrum disorders: An activation likelihood estimate (ALE) meta-analysis. Autism Res. 5, 49–66. https://
doi.org/10.1002/aur.235 (2012).
62. Itahashi, T. et al. Alterations of local spontaneous brain activity and connectivity in adults with high-functioning autism spectrum
disorder. Mol. Autism 6, 30. https://doi.org/10.1186/s13229-015-0026-z (2015).
63. Xu, J. et al. Specific functional connectivity patterns of middle temporal gyrus subregions in children and adults with autism
spectrum disorder. Autism Res. 13, 410–422. https://doi.org/10.1002/aur.2239 (2020).
64. Adolphs, R. The social brain: Neural basis of social knowledge. Annu. Rev. Psychol. 60, 693–716. https://doi.org/10.1146/annur
ev.psych.60.110707.163514 (2009).
65. Gallagher, H. L. & Frith, C. D. Functional imaging of “theory of mind”. Trends Cogn. Sci. 7, 77–83. https://doi.org/10.1016/
s1364-6613(02)00025-6 (2003).
66. Baron-Cohen, S., Leslie, A. M. & Frith, U. Does the autistic child have a “theory of mind”?. Cognition 21, 37–46. https://doi.org/
10.1016/0010-0277(85)90022-8 (1985).
67. Castelli, F., Frith, C., Happe, F. & Frith, U. Autism, Asperger syndrome and brain mechanisms for the attribution of mental states
to animated shapes. Brain 125, 1839–1849. https://doi.org/10.1093/brain/awf189 (2002).
68. Frith, U. Mind blindness and the brain in autism. Neuron 32, 969–979. https://doi.org/10.1016/s0896-6273(01)00552-9 (2001).
69. Lombardo, M. V., Chakrabarti, B., Bullmore, E. T., Consortium, M. A. & Baron-Cohen, S. Specialization of right temporo-parietal
junction for mentalizing and its relation to social impairments in autism. Neuroimage 56, 1832–1838. https://doi.org/10.1016/j.
neuroimage.2011.02.067 (2011).
70. Zilbovicius, M. et al. Autism, the superior temporal sulcus and social perception. Trends Neurosci. 29, 359–366. https://doi.org/
10.1016/j.tins.2006.06.004 (2006).
71. Boddaert, N. et al. Superior temporal sulcus anatomical abnormalities in childhood autism: A voxel-based morphometry MRI
study. Neuroimage 23, 364–369. https://doi.org/10.1016/j.neuroimage.2004.06.016 (2004).
72. Levitt, J. G. et al. Cortical sulcal maps in autism. Cereb. Cortex 13, 728–735. https://doi.org/10.1093/cercor/13.7.728 (2003).
73. Pelphrey, K. A. & Carter, E. J. Brain mechanisms for social perception: Lessons from autism and typical development. Ann. N
Y Acad. Sci. 1145, 283–299. https://doi.org/10.1196/annals.1416.007 (2008).
74. Blakemore, S. J., den Ouden, H., Choudhury, S. & Frith, C. Adolescent development of the neural circuitry for thinking about
intentions. Soc. Cogn. Affect. Neurosci. 2, 130–139. https://doi.org/10.1093/scan/nsm009 (2007).
75. Frith, C. D. & Frith, U. Implicit and explicit processes in social cognition. Neuron 60, 503–510. https://doi.o rg/1 0.1 016/j.n
euron.
2008.10.032 (2008).
76. Dapretto, M. et al. Understanding emotions in others: Mirror neuron dysfunction in children with autism spectrum disorders.
Nat. Neurosci. 9, 28–30. https://doi.org/10.1038/nn1611 (2006).
77. Hadjikhani, N., Joseph, R. M., Snyder, J. & Tager-Flusberg, H. Anatomical differences in the mirror neuron system and social
cognition network in autism. Cereb. Cortex 16, 1276–1282. https://doi.org/10.1093/cercor/bhj069 (2006).
78. Patriquin, M. A., DeRamus, T., Libero, L. E., Laird, A. & Kana, R. K. Neuroanatomical and neurofunctional markers of social
cognition in autism spectrum disorder. Hum. Brain Map. 37, 3957–3978. https://doi.org/10.1002/hbm.23288 (2016).
Scientific Reports | (2021) 11:10001 | https://doi.org/10.1038/s41598-021-89393-z 9
Vol.:(0123456789)www.nature.com/scientificreports/
79. Wheelwright, S. et al. Predicting autism spectrum quotient (AQ) from the systemizing quotient-revised (SQ-R) and empathy
quotient (EQ). Brain Res. 1079, 47–56. https://doi.org/10.1016/j.brainres.2006.01.012 (2006).
80. Herculano-Houzel, S. Coordinated scaling of cortical and cerebellar numbers of neurons. Front. Neuroanat. 4, 12. https://doi.
org/10.3389/fnana.2010.00012 (2010).
81. Broussard, D. M. The Cerebellum: Learning Movement, Language, and Social Skills. (John Wiley & Sons, Inc., 2014).
82. Schmahmann, J. D. Disorders of the cerebellum: Ataxia, dysmetria of thought, and the cerebellar cognitive affective syndrome.
J. Neuropsychiatry Clin. Neurosci. 16, 367–378. https://doi.org/10.1176/jnp.16.3.367 (2004).
83. Schmahmann, J. D. The role of the cerebellum in cognition and emotion: Personal reflections since 1982 on the dysmetria of
thought hypothesis, and its historical evolution from theory to therapy. Neuropsychol. Rev. 20, 236–260. https://d oi.o
rg/1 0.1 007/
s11065-010-9142-x (2010).
84. Strick, P. L., Dum, R. P. & Fiez, J. A. Cerebellum and nonmotor function. Annu. Rev. Neurosci. 32, 413–434. https://doi.org/10.
1146/annurev.neuro.31.060407.125606 (2009).
85. Prevosto, V., Graf, W. & Ugolini, G. Cerebellar inputs to intraparietal cortex areas LIP and MIP: Functional frameworks for
adaptive control of eye movements, reaching, and arm/eye/head movement coordination. Cereb. Cortex 20, 214–228. https://
doi.org/10.1093/cercor/bhp091 (2010).
86. Voogd, J., Schraa-Tam, C. K., van der Geest, J. N. & De Zeeuw, C. I. Visuomotor cerebellum in human and nonhuman primates.
Cerebellum 11, 392–410. https://doi.org/10.1007/s12311-010-0204-7 (2012).
87. Fatemi, S. H. et al. Consensus paper: Pathological role of the cerebellum in autism. Cerebellum 11, 777–807. https://doi.org/10.
1007/s12311-012-0355-9 (2012).
88. Krienen, F. M. & Buckner, R. L. Segregated fronto-cerebellar circuits revealed by intrinsic functional connectivity. Cereb. Cortex
19, 2485–2497. https://doi.org/10.1093/cercor/bhp135 (2009).
89. Bolduc, M. E. et al. Regional cerebellar volumes predict functional outcome in children with cerebellar malformations. Cerebel-
lum 11, 531–542. https://doi.org/10.1007/s12311-011-0312-z (2012).
90. Bolduc, M. E. et al. Spectrum of neurodevelopmental disabilities in children with cerebellar malformations. Dev. Med. Child
Neurol. 53, 409–416. https://doi.org/10.1111/j.1469-8749.2011.03929.x (2011).
91. Becker, E. B. & Stoodley, C. J. Autism spectrum disorder and the cerebellum. Int. Rev. Neurobiol. 113, 1–34. https://doi.org/10.
1016/B978-0-12-418700-9.00001-0 (2013).
92. Courchesne, E. et al. Unusual brain growth patterns in early life in patients with autistic disorder: An MRI study. Neurology 57,
245–254. https://doi.org/10.1212/wnl.57.2.245 (2001).
93. Scott, J. A., Schumann, C. M., Goodlin-Jones, B. L. & Amaral, D. G. A comprehensive volumetric analysis of the cerebellum in
children and adolescents with autism spectrum disorder. Autism Res. 2, 246–257. https://doi.org/10.1002/aur.97 (2009).
94. Wegiel, J. et al. The neuropathology of autism: Defects of neurogenesis and neuronal migration, and dysplastic changes. Acta
Neuropathol. 119, 755–770. https://doi.org/10.1007/s00401-010-0655-4 (2010).
95. DeRamus, T. P. & Kana, R. K. Anatomical likelihood estimation meta-analysis of grey and white matter anomalies in autism
spectrum disorders. Neuroimage Clin. 7, 525–536. https://doi.org/10.1016/j.nicl.2014.11.004 (2015).
96. Hampson, D. R. & Blatt, G. J. Autism spectrum disorders and neuropathology of the cerebellum. Front. Neurosci. 9, 420. https://
doi.org/10.3389/fnins.2015.00420 (2015).
97. Leekam, S. R., Nieto, C., Libby, S. J., Wing, L. & Gould, J. Describing the sensory abnormalities of children and adults with
autism. J. Autism Dev. Disord. 37, 894–910. https://doi.org/10.1007/s10803-006-0218-7 (2007).
98. Markram, K. & Markram, H. The intense world theory: A unifying theory of the neurobiology of autism. Front. Hum. Neurosci.
4, 224. https://doi.org/10.3389/fnhum.2010.00224 (2010).
99. Fournier, K. A., Hass, C. J., Naik, S. K., Lodha, N. & Cauraugh, J. H. Motor coordination in autism spectrum disorders: A syn-
thesis and meta-analysis. J. Autism Dev. Disord. 40, 1227–1240. https://doi.org/10.1007/s10803-010-0981-3 (2010).
100. Eichenbaum, H. A cortical-hippocampal system for declarative memory. Nat. Rev. Neurosci. 1, 41–50. https://doi.org/10.1038/
35036213 (2000).
101. Erk, S. et al. Emotional context modulates subsequent memory effect. Neuroimage 18, 439–447. https://doi.org/10.1016/s1053-
8119(02)00015-0 (2003).
102. Paquette, V. et al. “Change the mind and you change the brain”: effects of cognitive-behavioral therapy on the neural correlates
of spider phobia. Neuroimage 18, 401–409. https://doi.org/10.1016/s1053-8119(02)00030-7 (2003).
103. Jiao, Y. et al. Predictive models of autism spectrum disorder based on brain regional cortical thickness. Neuroimage 50, 589–599.
https://doi.org/10.1016/j.neuroimage.2009.12.047 (2010).
104. Ke, X. et al. Voxel-based morphometry study on brain structure in children with high-functioning autism. NeuroReport 19,
921–925. https://doi.org/10.1097/WNR.0b013e328300edf3 (2008).
Acknowledgements
The authors thank Sachiko Kitagawa, Yukiko Saotome, and Sumie Iwasaki for conducting the behavioural and
MRI experiments. They also thank Mutsumi Ozawa and Yoko Morita for preparing the experiments. We par-
ticularly appreciate the help of the children and their parents who participated in this study.
Author contributions
K.A. designed and conceptualized the study, analysed the data, drafted the manuscript, and revised the manu-
script. T.I., K.Y., Y.Y., and D.N.S. recorded neuroimaging data and revised the manuscript. C.H. and S.T. contrib-
uted to ASD ascertainment and recorded neuroimaging and behavioural data. T.H. contributed to ASD ascertain-
ment and revised the manuscript. M.K. secured funding, designed and conceptualized the study, contributed to
ASD ascertainment, drafted the manuscript, and revised the manuscript.
Funding
This work was supported by a grants from the Center of Innovation Program from the Japan Science and Tech-
nology Agency (https://www.coistream.osaka-u.ac.jp/en) and the Collaborative Resarch Program of the Col-
laborative Research Network for Asian Children with Developmental Disorders. The funder had no role in the
study design, data collection and analysis, decision to publish, or preparation of the manuscript.
Competing interests
The authors declare no competing interests.
Scientific Reports | (2021) 11:10001 | https://doi.org/10.1038/s41598-021-89393-z 10
Vol:.(1234567890)www.nature.com/scientificreports/
Additional information
Correspondence and requests for materials should be addressed to K.A. or D.N.S.
Reprints and permissions information is available at www.nature.com/reprints.
Publisher’s note Springer Nature remains neutral with regard to jurisdictional claims in published maps and
institutional affiliations.
Open Access This article is licensed under a Creative Commons Attribution 4.0 International
License, which permits use, sharing, adaptation, distribution and reproduction in any medium or
format, as long as you give appropriate credit to the original author(s) and the source, provide a link to the
Creative Commons licence, and indicate if changes were made. The images or other third party material in this
article are included in the article’s Creative Commons licence, unless indicated otherwise in a credit line to the
material. If material is not included in the article’s Creative Commons licence and your intended use is not
permitted by statutory regulation or exceeds the permitted use, you will need to obtain permission directly from
the copyright holder. To view a copy of this licence, visit http://creativecommons.org/licenses/by/4.0/.
© The Author(s) 2021
Scientific Reports | (2021) 11:10001 | https://doi.org/10.1038/s41598-021-89393-z 11
Vol.:(0123456789)You can also read