Imaging and Impact of Myocardial Fibrosis in Aortic Stenosis
←
→
Page content transcription
If your browser does not render page correctly, please read the page content below

JACC: CARDIOVASCULAR IMAGING                                                                                               VOL. 12, NO. 2, 2019

ª 2019 THE AUTHORS. PUBLISHED BY ELSEVIER ON BEHALF OF THE AMERICAN

COLLEGE OF CARDIOLOGY FOUNDATION. THIS IS AN OPEN ACCESS ARTICLE UNDER

THE CC BY LICENSE (http://creativecommons.org/licenses/by/4.0/).

FOCUS ISSUE: IMAGING IN AORTIC STENOSIS: PART II

STATE-OF-THE-ART PAPER

Imaging and Impact of
Myocardial Fibrosis in Aortic Stenosis
Rong Bing, MBBS, BMEDSCI,a João L. Cavalcante, MD,b Russell J. Everett, MD, BSC,a Marie-Annick Clavel, DVM, PHD,c
David E. Newby, DM, PHD, DSC,a Marc R. Dweck, MD, PHDa

    ABSTRACT

    Aortic stenosis is characterized both by progressive valve narrowing and the left ventricular remodeling response that
    ensues. The only effective treatment is aortic valve replacement, which is usually recommended in patients with severe
    stenosis and evidence of left ventricular decompensation. At present, left ventricular decompensation is most frequently
    identified by the development of typical symptoms or a marked reduction in left ventricular ejection fraction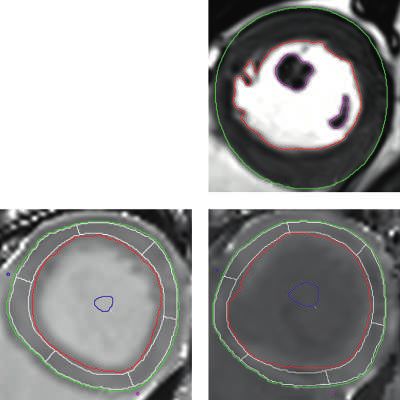
284           Bing et al.                                                                                JACC: CARDIOVASCULAR IMAGING, VOL. 12, NO. 2, 2019

              Imaging and Impact of Myocardial Fibrosis in Aortic Stenosis                                                             FEBRUARY 2019:283–96

ABBREVIATIONS                         remains AVR, either by surgical aortic valve                fibrosis and left ventricular decompensation in aortic
AND ACRONYMS                          replacement (SAVR) or transcatheter aortic                  stenosis, the imaging techniques that can be used to
                                      valve replacement (TAVR) approaches. The                    detect it, and how these might be employed to track
AVR = aortic valve
replacement
                                      uptake of TAVR has grown exponentially                      myocardial health and optimize the timing of AVR.

CI = confidence interval
                                      (3,8), as interventions that were initially
                                      offered only to elderly, inoperable patients                PATHOLOGY
CMR = cardiac magnetic
resonance                             are now being performed in younger, lower-
CT = computed tomography
                                      risk patients with excellent results (9–13).                It is useful to consider aortic stenosis as a disease of
                                      Decisions about if, when, and how to inter-                 both the valve and the myocardium (4). In addition,
ECV% = extracellular volume
fraction                              vene have therefore become increasingly                     the importance of arterial stiffness and systemic
HR = hazard ratio                     complex, requiring careful assessment of in-                pulsatile arterial load cannot be underestimated in
iECV = indexed extracellular          dividual patients within a multidisciplinary                this elderly population (18,19). A detailed discussion
volume                                heart team.                                                 of events within the valve is beyond the scope of this
LGE = late gadolinium                     Current guidelines recommend interven-                  review (20); however, an understanding of the path-
enhancement                           tion in patients with severe aortic stenosis                ological factors driving the hypertrophic remodeling
SAVR = surgical aortic valve          and evidence of left ventricular decompen-                  response and its subsequent decompensation are
replacement
                                      sation. Most commonly this is in the form of                critical to understanding the rationale for myocardial
TAVR = transcatheter aortic
                                      development of typical symptoms, but other                  fibrosis imaging (Central Illustration).
valve replacement
                                      markers include a reduction in ejection                       Progressive    valve   narrowing     causes   pressure
                            fraction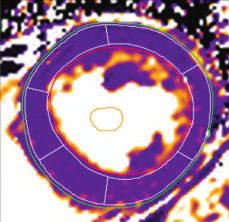
JACC: CARDIOVASCULAR IMAGING, VOL. 12, NO. 2, 2019                                                                                                       Bing et al.    285
FEBRUARY 2019:283–96                                                                                   Imaging and Impact of Myocardial Fibrosis in Aortic Stenosis

   C ENTR AL I LL U STRA T I O N Summary of Left Ventricular Remodeling and Decompensation in Patients With
   Aortic Stenosis

                                                  Increased afterload                                  Cellular hypertrophy

                                              Supply-demand ischemia
                                                  Mechanical stress                                       Diffuse fibrosis
                                              Myofibroblast infiltration
                                            Extracellular matrix expansion

                                                                                                       Replacement fibrosis
                                                  Myocyte cell death

                                                                                                           Heart failure
                                                                                                           Cardiac death

   Bing, R. et al. J Am Coll Cardiol Img. 2019;12(2):283–96.

   Schematic of the left ventricular remodeling response in aortic stenosis, describing the transition from hypertrophy to fibrosis, heart failure, and cardiac death.

histological studies have now demonstrated an asso-                          (Table 1). These approaches have been used to assess
ciation between myocardial fibrosis at the time of                            myocardial fibrosis in a range of cardiovascular
AVR and both impaired recovery of left ventricular                           conditions including aortic stenosis and are described
systolic function and poor long-term outcomes                                in the following text.
following valve replacement (17,27–29). Although it is
                                                                             CARDIAC MAGNETIC RESONANCE. CMR provides
certainly plausible that myocardial fibrosis might
                                                                             unparalleled soft tissue characterization and can be
directly contribute to such outcomes, a causal
                                                                             used to identify and measure both diffuse and
relationship is yet to be demonstrated.
                                                                             replacement forms of fibrosis in a single scan without
IMAGING MODALITIES FOR THE ASSESSMENT                                        the use of ionizing radiation. When utilized together,
OF MYOCARDIAL FIBROSIS                                                       the CMR techniques described in the following
                                                                             text offer the best available method of capturing
Although myocardial biopsy and histological analysis                         the full spectrum of fibrotic changes within the left
are still considered the gold standard assessments of                        ventricular myocardium (26).
myocardial fibrosis, they have several important                              Late     gadolinium          enhancement. Gadolinium-based
limitations precluding their routine clinical applica-                       contrast agents (GBCAs) partition into areas of
tion. Myocardial biopsy is an invasive procedure                             extracellular expansion (myocardial edema, necrosis,
that carries an attendant risk of complications (30).                        infiltration, or fibrosis). Interpretation of delayed
Additionally, as only small areas of the myocardium                          imaging using GBCAs requires clear differences in
can be sampled, biopsy is prone to sampling error. By                        signal    intensity      between        healthy      and     diseased
contrast, modern imaging techniques, in particular                           myocardium in a relatively discrete distribution.
those provided by cardiovascular magnetic resonance                          Consequently, late gadolinium enhancement (LGE) is
(CMR), allow comprehensive, noninvasive assess-                              an excellent marker of focal replacement fibrosis,
ments of fibrosis across the entire myocardium as                             but is insensitive for the detection of more diffuse
well as quantification of its functional consequences                         interstitial fibrosis.
286          Bing et al.                                                                                          JACC: CARDIOVASCULAR IMAGING, VOL. 12, NO. 2, 2019

             Imaging and Impact of Myocardial Fibrosis in Aortic Stenosis                                                                              FEBRUARY 2019:283–96

                                                                                                        validated imaging method for detecting myocardial
 T A B L E 1 Performance of Different Imaging Modalities in Aortic Stenosis
                                                                                                        fibrosis in aortic stenosis. Multiple independent
                                      Ventricular      Diffuse       Replacement        Long-Term       studies have described a noninfarct (or mid-wall)
                       Severity      Performance       Fibrosis        Fibrosis         Prognosis
                                                                                                        pattern of LGE in patients with aortic stenosis that
 TTE                       þþþ           þþþ               -                -              þþþ
                                                                                                        is distinct from the pattern of scarring seen in other
 CT                        þþ             þþ              þ                 þ                þ
 CMR                       þ             þþþ
                                                                                                        pathologies such as myocardial infarction (Figure 1).
      Native T1                                           þþ                þ                þ          On     histology,       noninfarct       LGE     co-localizes       with
      ECV%/iECV                                           þþ                þ                þ          microscars and replacement fibrosis, whereas clinical
      LGE                                                  -             þþþ               þþþ          studies have validated it against other markers of left
      FT                    -            þþþ               -                -                þ          ventricular decompensation and demonstrated a
                                                                                                        close association with advanced left ventricular hy-
 CMR ¼ cardiac magnetic resonance; CT ¼ computed tomography; ECV% ¼ extracellular volume fraction;
 FT ¼ feature tracking; iECV ¼ indexed extracellular volume; LGE ¼ late gadolinium enhancement;         pertrophy, increased myocardial injury, electrocar-
 TTE ¼ transthoracic echocardiogram.
                                                                                                        diographic changes, impaired diastolic and systolic
                                                                                                        function, and reduced exercise capacity (25,39–41).
                                                                                                        Once noninfarct LGE becomes established, it pro-
                                 LGE is now well established and widely used as a                       gresses rapidly. Although the process is arrested
                            method for detecting replacement myocardial fibrosis                         by aortic valve intervention, replacement fibrosis
                            in a broad range of cardiovascular conditions such as                       appears irreversible once established. Thus, the
                            ischemic cardiomyopathy, nonischemic dilated car-                           burden of replacement fibrosis a patient accumulates
                            diomyopathy, cardiac sarcoidosis, cardiac amyloid-                          while waiting for valve intervention persists with
                            osis, myocarditis, and hypertrophic cardiomyopathy                          them until death (42). The clinical implications are
                            (31–38). In each condition, replacement fibrosis                             important, as noninfarct LGE is associated with a poor
                            detected by LGE serves as an independent and                                long-term prognosis. Indeed, 5 studies and a recent
                            powerful predictor of mortality and adverse cardio-                         meta-analysis (43) have confirmed noninfarct LGE
                            vascular events. LGE is also the most studied and best                      to be an independent predictor of mortality, of

      F I G U R E 1 Late Gadolinium Enhancement Patterns in Aortic Stenosis

        A                                        B                                       C                                         D

      Each panel shows short-axis (top) and corresponding long-axis (bottom) late gadolinium images from cardiac magnetic resonance scans. (A to C) Focal noninfarct late
      gadolinium enhancement typical of the replacement fibrosis seen in aortic stenosis. (D) Subendocardial late gadolinium enhancement in coronary artery territories,
      consistent with scar due to infarction rather than focal noninfarct fibrosis. Areas of infarction such as these should be excluded when calculating extracellular volume
      fraction. Red arrows indicate areas of late gadolinium enhancement.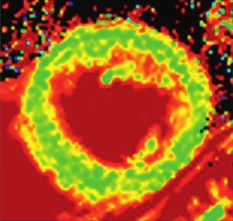
JACC: CARDIOVASCULAR IMAGING, VOL. 12, NO. 2, 2019                                                                                Bing et al.   287
FEBRUARY 2019:283–96                                                             Imaging and Impact of Myocardial Fibrosis in Aortic Stenosis

incremental value to valve assessments, comorbidity,         extracellular environments, while the addition of a
and left ventricular ejection fraction (28,41,44–46)         GBCA facilitates targeted interrogation of the extra-
(Table 2).                                                   cellular space.
  The poor prognosis associated with non-infarct               Various protocols for T 1 mapping have been stud-
LGE appears to persist long after AVR is performed,          ied (49). The original Look-Locker technique (50) has
in keeping with the irreversible nature of replacement       been largely superseded by modern variations. The
fibrosis. In the largest study to date, the British           modified Look-Locker imaging sequence (51) is the
Society for Cardiovascular Magnetic Resonance Valve          most studied inversion-recovery technique, whereas
Consortium performed comprehensive CMR assess-               variants such as the shortened modified Look-Locker
ments in over 650 patients with severe aortic stenosis       imaging sequence require a shorter breath hold (52).
just prior to SAVR or TAVR (46). At a median follow-         Optimization of protocols has improved accuracy,
up of 3.6 years, LGE (present in 50% of patients)            acquisition time, and ease of use via reduction in
was a powerful independent predictor of all-cause            heart rate dependence and breath holds. Moreover,
(26.4% vs. 12.9%; p < 0.001) and cardiovascular              post-processing and analysis of T1 mapping data can
mortality (15.0% vs. 4.8%; p < 0.001) following              now be performed with fast and reproducible tech-
AVR.    Furthermore,      this     association   appeared    niques utilizing standardized protocols. T 1 mapping
dose-dependent: with every 1% increase in left               techniques are now readily accessible in many CMR
ventricular myocardial scar burden, all-cause and            units and will be discussed below.
cardiovascular mortality increased by 11% and 8%,            Native T1. As fibrosis increases, native T 1 values
respectively (hazard ratio [HR]: 1.11; 95% confidence         increase. Quantitative T1 measurements therefore
interval [CI]: 1.05 to 1.17; p < 0.001; and HR: 1.08;        allow detection of focal or diffuse fibrosis without the
95% CI: 1.01 to 1.17; p < 0.001). Similar effects            use of GBCAs, although the T 1 signal also changes
were observed for both infarct and noninfarct LGE.           with other pathological processes such as edema or
Noninfarct LGE was also demonstrated to be an                myocardial infiltration. Native T 1 has been utilized
independent predictor of both all-cause and cardio-          in conditions such as myocardial infarction, myocar-
vascular mortality.                                          ditis, dilated cardiomyopathy, cardiac amyloid, and
  LGE is reliable, well-validated, and easily inte-          Fabry disease (48), and has demonstrated significant
grated into the standard workflow, with post-                 prognostic power beyond that of LGE alone (53,54).
processing         and           qualitative      analysis   Although less robust, data is also emerging for native
readily performed in
288 Bing et al. JACC: CARDIOVASCULAR IMAGING, VOL. 12, NO. 2, 2019
Imaging and Impact of Myocardial Fibrosis in Aortic Stenosis FEBRUARY 2019:283–96
T A B L E 2 CMR Studies Investigating Myocardial Fibrosis in Aortic Stenosis
Study (Ref. #) Year n Population CMR Biopsy Findings
Native T1 Studies
Bull et al. (55) 2013 109 Severe AS undergoing SAVR 1.5-T 19 Native T1 correlated with CVF (r ¼ 0.65; p ¼ 0.002) and
Asymptomatic moderate or severe AS Native T1 increased with disease severity.
shMOLLI
Lee et al. (56) 2015 80 Asymptomatic moderate 3-T 20 Native T1 correlated with histology (r ¼ 0.777; p < 0.001)
or severe AS Native T1 and TTE measures of diastolic dysfunction, and was
MOLLI increased compared with control patients, with overlap.
ECV Studies
Flett et al. (62) 2010 18 Severe AS undergoing SAVR 1.5-T 18 ECV% correlated with CVF (r2 ¼ 0.86; p < 0.001).
ECV%
EQ-CMR
FLASH-IR
Fontana et al. (77) 2012 18 Severe AS undergoing SAVR 1.5-T 18 ECV% correlated with CVF (r2 ¼ 0.685). ShMOLLI was superior
ECV% to FLASH-IR.
EQ-CMR shMOLLI
FLASH-IR
White et al. (66) 2013 18 Severe AS undergoing SAVR 1.5-T 18 ECV% by both methods correlated with CVF
ECV% (r2 ¼ 0.69; p < 0.01 and r2 ¼ 0.71; p < 0.01).
EQ-CMR DynEQ-CMR
shMOLLI
Flett et al. (78) 2012 63 Severe AS undergoing SAVR 1.5-T — ECV% was increased compared with control subjects, with
ECV% overlap. At 6 months, LVH had regressed but diffuse
EQ-CMR fibrosis was unchanged.
FLASH-IR
LGE Studies
Weidemann et al. (27) 2009 46 Severe AS undergoing AVR LGE 46 LGE appeared to be concordant with histology (88% with
severe fibrosis had $2 positive segments; 89% with no
fibrosis had no positive segments) and did not regress at
9 months post-AVR.
Azevedo et al. (28) 2010 28 Severe AS undergoing AVR 1.5-T 28 LGE was present in 61%.
LGE LGE correlated with histology (r ¼ 0.67; p < 0.001).
LGE was an independent predictor of all-cause mortality
(HR: 1.26; 95% CI: 1.03–1.54; p ¼ 0.02).
Debl et al. (79) 2006 22 Symptomatic AS 1.5-T — LGE was present in 27%.
LGE LGE correlated with more severe AS and LVH.
Rudolph et al. (80) 2009 21 Any AS 1.5-T — LGE was present in 62%.
LGE LGE correlated with increased LV mass and end-diastolic
volume index.
Dweck et al. (44) 2011 143 Moderate or severe AS 1.5-T — LGE present in 66%.
LGE Midwall LGE present in 38%.
Midwall LGE was an independent predictor of all-cause
mortality (HR: 5.35; 95% CI: 1.16–24.56; p ¼ 0.03).
Baron-Rochette et al. 2014 154 Severe AS undergoing AVR 1.5-T — LGE present in 29%.
(45) LGE LGE was an independent predictor of all-cause mortality
(HR: 2.8; 95% CI: 1.1 to 6.9; p ¼ 0.025).
Rajesh et al. (81) 2017 109 Severe AS 1.5-T — LGE present in 43%.
LGE Midwall LGE present in 31%.
LGE predicted heart failure/hospitalization and a fall in
LVEF but did not predict mortality.
Musa et al. (46) 2018 674 Severe AS undergoing AVR 1.5-T, 3-T — LGE present in 51%.
LGE Noninfarct LGE present in 33%.
Scar associated with all-cause (26.4% vs 12.9%; p < 0.001)
and cardiovascular (15.0% vs 4.8%; p < 0.001) mortality
in a dose-dependent fashion (for every 1% increase in scar,
HR: 1.11; 95% CI: 1.05–1.17; p < 0.001 for all-cause and HR:
1.08; 95% CI: 1.01–1.17; p < 0.001 for cardiovascular
mortality).
Infarct and noninfarct scar were both associated with adverse
outcomes.
de Meester et al. (82) 2015 12 Severe AS undergoing SAVR 3-T 12 LGE was present in 17 of 31 patients (from total cohort).
Native T1 Only ECV% correlated with histology (r ¼ 0.79; p ¼ 0.011).
ECV%
LGE
MOLLI
Kockova et al. (57) 2016 31 Severe AS undergoing SAVR 1.5-T 31 Patient with severe MF (>30%) on histology had higher native
Native T1 T1 times and ECV%. Native T1 $1,010 ms and ECV $0.32
ECV% had AUC of 0.82 and 0.85, respectively, for severe MF.
MOLLI
Continued on the next pageJACC: CARDIOVASCULAR IMAGING, VOL. 12, NO. 2, 2019 Bing et al. 289
FEBRUARY 2019:283–96 Imaging and Impact of Myocardial Fibrosis in Aortic Stenosis
T A B L E 2 Continued
Study (Ref. #) Year n Population CMR Biopsy Findings
Chin et al. (41) 2017 166 Any AS 3-T 11 Midwall LGE was present in 27%.
iECV iECV correlated with histology (r ¼ 0.87; p < 0.001) and was
LGE increased compared with control subjects.
MOLLI iECV þ LGE predicted unadjusted all-cause mortality (36 vs.
8 deaths/1,000; p ¼ 0.009).
Treibel et al. (26) 2018 133 Severe AS undergoing AVR 1.5-T 133 LGE was present in 60%; noninfarct pattern was more
ECV% common.
LGE Complex MF patterns. LGE, but not ECV%, correlated with CVF
MOLLI in all biopsies (r2 ¼ 0.28; p < 0.001) but more in biopsies
with endocardium (r2 ¼ 0.501; p < 0.001). Combined
LGE þ ECV% best predicted LV remodeling and functional
capacity.
Child et al. (83) 2018 25 Severe AS 3-T 12 Noninfarct LGE was present in 20%.
Native T1 Sequences differed in discrimination between health and
ECV% disease as well as association with CVF. Native T1 with
LGE MOLLI correlated best (r ¼ 0.582; p ¼ 0.027).
MOLLI, shMOLLI,
SASHA
Chin et al. (59) 2014 20 Any AS 3-T — ECV displayed excellent scan-rescan reproducibility and was
Native T1 higher in AS than control subjects. Native T1 was not as
ECV% reproducible and was not significantly higher in AS than
MOLLI control subjects.
Chin et al. (40), 2014 122 Any AS 3-T — Midwall LGE was present in 28%.
Shah et al. (39) ECV% ECV% and LGE were associated with elevated TnI and ECG
LGE evidence of strain.
MOLLI
Dusenberry et al. (84) 2014 35 Congenital AS 1.5-T — LGE was present in 24%.
ECV% ECV% was increased compared to control patients and
LGE correlated with TTE measures of diastolic dysfunction.
Look-Locker
Treibel et al. (25) 2018 116 Severe AS undergoing AVR 1.5-T — At 1 yr, cellular and matrix volume regressed. LGE was
iECV unchanged.
LGE
MOLLI
Everett et al. (42) 2018 99 61 asymptomatic AS 38 severe AS 1.5-T, 3-T — Midwall LGE was present in 26%.
undergoing AVR iECV LGE progressed from baseline and was most rapid in patients
LGE with more severe stenosis.
In patients undergoing AVR, iECV reduced by 11% (4%–16%)
but there was no change in LGE.
Lee et al. (58) 2018 127 Moderate or severe AS 3-T — LGE was present in 32.3%.
Native T1 Native T1 was increased compared with control patients,
LGE with overlap.
MOLLI Native T1 and LGE were independent predictors of poor
prognosis.
AS ¼ aortic stenosis; AUC ¼ area under the curve; CI ¼ confidence interval; CMR ¼ cardiac magnetic resonance; CVF ¼ collagen volume fraction; DynEQ-CMR ¼ dynamic equilibrium contract-cardiac magnetic
resonance; ECV% ¼ extra-cellular volume fraction; EQ-CMR ¼ equilibrium contrast cardiac magnetic resonance; FLASH-IR ¼ fast low angle single shot inversion recovery; HR ¼ hazard ratio; iECV ¼ indexed
extracellular volume; LGE ¼ late gadolinium enhancement; LVEF ¼ left ventricular ejection fraction; LVH ¼ left ventricular hypertrophy; MOLLI ¼ modified Look-Locker inversion recovery; SASHA ¼
saturation recovery single-shot acquisition; SAVR ¼ surgical aortic valve replacement; shMOLLI ¼ shortened modified Look-Locker inversion recovery; TnI ¼ troponin I; TTE ¼ transthoracic echocardiography.
holds major appeal as a marker of diffuse fibrosis that and even within the same individual on different
does not require contrast administration and is days. Standardized normal values are again lacking,
favored as a technique by various experts in the field, and consequently, post-contrast T 1 mapping is not
its specific role in aortic stenosis requires further in widespread use.
research. Extracellular volume fraction. The extracellular volume
Post-contrast T1 mapping. GBCAs do not cross cell fraction (ECV%) corrects post-contrast myocardial T 1
membranes and therefore distribute throughout mapping values for blood pool and pre-contrast
the extracellular space in the myocardium. Post- myocardial T 1 , thereby accounting for differences in
contrast T 1 mapping techniques therefore allow blood concentrations of GBCAs. By incorporating the
more specific interrogation of the extracellular hematocrit, ECV% calculates the fraction of the
space due to gadolinium’s shortening effects on T1 myocardium comprised by the extracellular space
relaxation times. Unfortunately, standardization according to the formula ECV% ¼ ( D [1/T1 myo]/D [1/
of post-contrast T1 mapping values is difficult due to T1blood ]) (1 hematocrit), where D (1/T1) is the
variation in gadolinium kinetics between patients difference in myocardial or blood T 1 pre- and290 Bing et al. JACC: CARDIOVASCULAR IMAGING, VOL. 12, NO. 2, 2019
Imaging and Impact of Myocardial Fibrosis in Aortic Stenosis FEBRUARY 2019:283–96
F I G U R E 2 T 1 Mapping
1600 ms 1000 ms 60%
0 ms 0 ms 0%
Native T1 Map Post-Contrast T1 Map ECV% Map
1300 800 35
Extracellular Volume Fraction (%)
p = 0.29 p = 0.58 p < 0.001
750
1250
Myocardial T1 (ms)
Myocardial T1 (ms)
30
700
1200
650
25
1150
600
1100 550 20
Healthy Patients with Healthy Patients with Healthy Patients with
Volunteers Aortic Stenosis Volunteers Aortic Stenosis Volunteers Aortic Stenosis
Three different cardiac magnetic resonance T1 maps are demonstrated. Native T1 and post-contrast T1 maps are generated by the signal intensity encoded within each
voxel, depending on the T1 relaxation time; color coding according to T1 times is applied for visual reference. ECV% maps are generated using the formula ECV% ¼
(D[1/T1myo]/D[1/T1blood]) (1 hematocrit), where D(1/T1) is the difference in myocardial or blood T1 pre-contrast and post-contrast. ECV% can be used to assess the
proportion of the myocardium comprised by extracellular space. Note that there is significant overlap between health and disease with native and post-contrast T1, in
contrast to ECV%. Graphs adapted from Chin et al. (59) by permission of Oxford University Press. ECV% ¼ extracellular volume fraction; iECV ¼ indexed extracellular
volume.
post-contrast (62). A key feature of myocardial ECV% potentially corrects for differences in T1 values
fibrosis is the deposition of excess collagen in the on different scanners and sequences, making it
interstitial space and the subsequent expansion of the appealing as a technique for multicenter research.
extracellular space. ECV% has therefore been inves- A number of clinical studies have validated ECV%
tigated as a method for detecting diffuse myocardial against histology in aortic stenosis and have demon-
fibrosis in a range of cardiovascular conditions strated the association between ECV% and other
including myocardial infarction, nonischemic car- markers of LV decompensation, including ECG
diomyopathy, and aortic stenosis (63,64). changes of hypertrophy and strain and elevation
Current scanning techniques assume a dynamic in biomarkers such as troponin and N-terminal
equilibrium between blood and myocardium w10 to pro-brain natriuretic peptide (26,39–41) (Table 2).
15 mins after a bolus injection of contrast (65,66). A ECV% also demonstrates excellent scan-rescan
synthetic ECV% has also been described that derives reproducibility (59), while guidelines to standardize
hematocrit from the longitudinal relaxation rate of post-processing have been developed and recom-
blood, obviating the need for blood sampling (67), mend that areas of noninfarct LGE are included and
while a more recent noninvasive point-of-care probe areas of infarct LGE excluded from regions of interest
to derive hematocrit has demonstrated promising in ECV% calculation (69). However, data assessing the
results when compared with both standard and syn- prognostic value of ECV% in aortic stenosis are
thetic ECV% (68). ECV% has thus become easier to limited, and overlap between disease groups is again
measure and more clinically applicable. Moreover, observed. In addition, the effect of AVR on ECV%JACC: CARDIOVASCULAR IMAGING, VOL. 12, NO. 2, 2019 Bing et al. 291
FEBRUARY 2019:283–96 Imaging and Impact of Myocardial Fibrosis in Aortic Stenosis
F I G U R E 3 iECV calculation
iECV: Biomarker of the Total Myocardial Fibrosis
Burden Indexed to Patient Size
ECV% = (Δ(1/T1myo) / Δ(1/
T1blood)) × (1 - hematocrit)
Indexed Extracellular Volume (mL/m2)
50
iECV = myocardial volume 40
indexed to BSA × ECV%
30
Myocardial volume
20
10
P < 0.0001
0
1 1 Controls Mild Moderate Severe
AS Severity
Cut off for extracellular expansion
Pre-contrast T1 Post-contrast T1
The cardiac magnetic resonance short-axis images provide examples of the pre-contrast and post-contrast contours required to calculate
iECV. Systolic and diastolic contours are drawn using the short-axis stack to calculate myocardial volume, which is necessary to derive iECV.
Color look-up tables have not been applied to the T1 images. iECV provides a surrogate of the total myocardial fibrosis burden according to the
formula demonstrated in the figure. iECV demonstrates good correlation with histological fibrosis burden and severity of aortic stenosis.
Graph adapted from Chin et al. (41), Creative Commons Attribution License: https://creativecommons.org/licenses/by/4.0/. BSA ¼ body
surface area; other abbreviations as in Figure 2.
may be somewhat counterintuitive as values can in- Chin et al. (41) demonstrated that a threshold of
crease after surgery—a weakness of assessing the 22.5 ml/m 2 (derived from 37 age- and sex-matched
extracellular component of the myocardium as a healthy volunteers and defined as 2 SDs above the
fraction of the ventricular mass when both the mean) could be used to differentiate healthy
intracellular and extracellular compartments are un- myocardium from diseased myocardium infiltrated
dergoing reverse remodeling (25). by diffuse fibrosis, and in doing so, identify patients
Indexed extracellular volume. Whereas ECV% provides with early evidence of left ventricular decompensa-
a percentage estimate, the indexed extracellular tion and adverse long-term outcome (41).
volume (iECV) quantifies the total left ventricular iECV and ECV% have recently been used in
extracellular myocardial volume indexed to body combination to study changes in the composition of
surface area by multiplying ECV% by the indexed left the intracellular and extracellular compartments
ventricular myocardial volume: iECV ¼ ECV% before and after AVR. This has provided important
indexed left ventricular myocardial volume (Figure 3). insights into left ventricular remodeling and reverse
Furthermore, cellular volume can be calculated: remodeling after relief of loading conditions.
(1 ECV%) left ventricular volume). This can also Changes in iECV are not accounted for by changes in
be indexed to body surface area. In combination with total left ventricular mass alone. Prior to AVR, iECV
LV mass, ECV% and iECV can together provide an (representing total extracellular matrix, or fibrosis,
understanding of ventricular remodeling and reverse burden) and left ventricular mass appear to increase
remodeling with respect to both the cellular and in a broadly balanced manner so that ECV% remains
extracellular myocardial compartments. Two studies largely unchanged. Following AVR, left ventricular
have utilized iECV or matrix volume as a novel mass decreases. Cellular and extracellular mass
assessment of myocardial fibrosis burden (25,41), regress, but cellular mass regresses more rapidly,
with iECV demonstrating a close association with thereby resulting in an apparently paradoxical in-
histological fibrosis assessments. Importantly, iECV crease in ECV% as the ratio of matrix to total mass is
appears to provide greater discrimination between increased (25,42). iECV, however, decreases as it
disease states than other T1 mapping parameters. represents the extracellular matrix as a total volume,292 Bing et al. JACC: CARDIOVASCULAR IMAGING, VOL. 12, NO. 2, 2019
Imaging and Impact of Myocardial Fibrosis in Aortic Stenosis FEBRUARY 2019:283–96
multicenter prognostic studies that are ultimately
F I G U R E 4 Schematic for the Development of Myocardial Fibrosis in Aortic Stenosis
and Response to AVR
required. Of the T1 mapping parameters currently in
use, we believe that ECV% and iECV currently pro-
AVR vide the most complete understanding of cellular and
extracellular remodeling in aortic stenosis, although
native T1 provides important advantages, particularly
with regard to ease of calculation and the avoidance
Severity
of contrast administration.
OTHER IMAGING MODALITIES. Alternative imaging
techniques to assess myocardial fibrosis in aortic
stenosis are limited. Research into computed tomog-
raphy (CT) assessments of myocardial fibrosis re-
Time
mains exploratory, with only limited data available
Baseline 1 year 2 year
that has largely focused on measuring ECV on CT
scans performed after the administration of iodinated
contrast agents (Table 3). These techniques are
worthy of further investigation given the widespread
LV Cellular Mass Diffuse Fibrosis Replacement Fibrosis use of CT imaging in patients being considered for
TAVR and the emerging utility of CT calcium scoring
As aortic stenosis progresses, left ventricular (LV) mass gradually increases, followed as a marker of stenosis severity. Strain imaging on
by the development of diffuse fibrosis. Replacement fibrosis occurs later but accelerates echocardiography or CMR can be a valuable nonin-
rapidly once established. Following relief of pressure-loading conditions after aortic valve vasive tool to evaluate and quantify myocardial
replacement (AVR), LV cellular mass and extracellular matrix both regress at different
deformation before any identifiable changes in ejec-
rates. The burden of replacement fibrosis, however, persists. The insets show short-
tion fraction; however, despite an association with
axis cardiac magnetic resonance late gadolinium enhancement imaging slices of a patient
with aortic stenosis. At baseline, there is focal late gadolinium enhancement representing imaging markers of myocardial fibrosis (27,29) and
discrete focal replacement fibrosis (white arrow). After 1 year, the burden of this potential prognostic utility (70,71), this approach is
replacement fibrosis has increased with the development of several new discrete unable to measure myocardial fibrosis directly.
deposits (red arrows). The patient subsequently underwent AVR. One year later,
despite regression of LV mass, there is no regression of replacement fibrosis FUTURE DIRECTIONS
(white arrows).
Myocardial fibrosis is well established as a hallmark
pathological feature of left ventricular decompensa-
rather than a percentage. The reduction in iECV is tion in patients with aortic stenosis; yet, it is
therefore in keeping with the potential for reversal not routinely assessed in clinical practice. In part, this
of diffuse fibrosis. This effect has been confirmed has reflected the limitations of myocardial biopsy,
independently by 2 different groups in separate co- many of which have now been overcome with
horts and stands in contrast to the irreversible na- advanced noninvasive imaging. The next step is to
ture of replacement fibrosis as assessed by LGE assess whether these imaging techniques will prove
(Figure 4). iECV requires further exploration and of clinical value in monitoring myocardial health,
validation but is a promising method to track identifying left ventricular decompensation, and
myocardial fibrosis. optimizing the timing of AVR.
In summary, T 1 mapping is an exciting and LGE is the best validated of these approaches, is
emerging research field in aortic stenosis research relatively simple to perform and analyze, and is
that provides the only method of identifying revers- supported by powerful prognostic data. Whether
ible diffuse myocardial fibrosis. It holds particular noninfarct LGE can be used to optimize the timing of
potential as a method to track myocardial health over valve intervention is currently being tested in
time, with important clinical implications. Standard- the EVOLVED (Early Valve Replacement Guided by
ization of sequences and protocols have resulted in Biomarkers of LV Decompensation in Asymptomatic
reproducible and powerful prognostic T 1 mapping Patients With Severe AS) trial (NCT03094143) (47)
data in a variety of myocardial disease states (Figure 5). This multicenter randomized controlled
(41,53,54,58). However, T 1 mapping in aortic stenosis trial will recruit asymptomatic patients with severe
is in a relatively early stage of development. Further aortic stenosis for CMR imaging. Those patients with
work is required to establish validated thresholds to noninfarct LGE will then be randomized 1:1 to early
aid decision making, paving the way for future valve intervention (SAVR or TAVR) versus theJACC: CARDIOVASCULAR IMAGING, VOL. 12, NO. 2, 2019 Bing et al. 293
FEBRUARY 2019:283–96 Imaging and Impact of Myocardial Fibrosis in Aortic Stenosis
T A B L E 3 CT to Detect Myocardial Fibrosis
Study (Ref. #) Year n Population CT Biopsy CMR Findings
Bandula et al. (85) 2013 23 Severe AS undergoing SAVR Iohexol equilibrium 23 shMOLLI ECVCT correlated with ECVCMR (r ¼ 0.73; p < 0.001)
bolus and and histological fibrosis (r ¼ 0.71; p < 0.001).
infusion protocol
Hong et al. (86) 2016 20 Rabbits Dual-energy CT 20 3-T ECVCT correlated with ECVCMR (r ¼ 0.89;
4 healthy Iopamidol bolus MOLLI p < 0.001) and histological fibrosis (r ¼ 0.925;
16 DCM p < 0.001).
Treibel et al. (87) 2017 73 Validation cohort: 64-detector 18 — Good correlation between synthetic and
28 severe AS 27 amyloid Iohexol bolus conventional ECVCT (r2 ¼ 0.96; p < 0.001).
18 severe AS underdoing SAVR Good correlation between synthetic and
conventional ECVCT and histology (both
r2 ¼ 0.50; p < 0.001).
ECVCT was higher in amyloidosis.
Nacif et al. (88) 2012 24 11 healthy 320-detector — 3-T Correlation between CMR and CT (r ¼ 0.82;
13 HF Iopamidol bolus 3(3)5 MOLLI p < 0.001).
ECV lower in healthy patients for both CMR and
CT (p ¼ 0.03).
Nacif et al. (89) 2013 24 9 healthy 320-detector — — Mean 3D ECV significantly higher in HFrEF than
10 HFrEF Iopamidol bolus other groups (p ¼ 0.02).
5 HFpEF
Treibel et al. (90) 2015 47 27 severe AS 26 amyloid 64-detector — 1.5-T shMOLLI ECVCT at 5 min and 15 min correlated with ECVCMR
Iodixanol dynamic (r2 ¼ 0.85; r2 ¼ 0.74; p < 0.001).
equilibrium bolus ECVCT was higher in amyloidosis and correlated
protocol with markers of severity.
Lee et al. (91) 2016 30 7 healthy Dual-energy CT — 3-T Good agreement between ECVCT and ECVCMR on
6 HCM Iopamidol bolus 3(3)5 MOLLI per-subject (Bland-Altman bias 0.06%; 95% CI:
9 DCM 1.19–1.79) and per-segment level.
4 amyloid
4 sarcoid
CT ¼ computed tomography; DCM ¼ dilated cardiomyopathy; HF ¼ heart failure; HFpEF ¼ heart failure with preserved ejection fraction; HFrEF ¼ heart failure with reduced ejection fraction; other ab-
breviations as in Table 2.
conventional approach of watchful waiting until
F I G U R E 5 Proposed Integration of Myocardial Fibrosis Into the Classical Description
symptom development or clinical heart failure. To of the Natural History of Aortic Stenosis
mitigate the costs of CMR, patients will initially be
screened with high-sensitivity troponin and an elec-
trocardiogram, both of which are predictors of non-
infarct LGE (72); only those patients with an abnormal CMR EVOLVED - early AVR
• Native T1
electrocardiogram or a troponin $6 ng/l will proceed • ECV% CMR
Outcome
• iECV • LGE Routine AVR
to CMR. The primary endpoint is a composite of
• Strain
all-cause mortality and unplanned aortic stenosis–
related hospital admissions. This is the first random-
ized trial to offer targeted early intervention in
patients with myocardial fibrosis and left ventricular
decompensation, and the results will be of great in-
Time
terest. Similar randomized controlled trials will ulti-
Diffuse Fibrosis Replacement Fibrosis Symptoms
mately be required to establish the clinical utility of
other myocardial fibrosis assessments, given that
Adaption of the outcome curve originally proposed by Braunwald in 1968 (76). Prior to
aortic valve intervention is not without risk.
the onset of symptoms, there is a long latent period in aortic stenosis where subclinical
CMR assessments of diffuse fibrosis in aortic ste- myocardial changes take place, including the development of reversible diffuse fibrosis
nosis require further validation but offer the potential followed by irreversible replacement fibrosis. These changes may be assessed with the
to identify the earlier stages of myocardial disease imaging modalities denoted in the figure. Exploratory data suggest that diffuse fibrosis
is associated with an adverse long-term outcome in aortic stenosis. The prognostic data
and track myocardial health with time. T1 mapping is
related to the noninfarct pattern of late gadolinium enhancement (LGE) as a marker of
the only available imaging technique that is able to
replacement fibrosis is comparatively robust, establishing LGE as a powerful indepen-
offer an assessment of diffuse fibrosis, and as such, it dent predictor of long-term clinical outcomes. According to current guidelines and
is crucial that ongoing research is conducted to pro- routine clinical practice, AVR is performed after the onset of symptoms. Future and
vide standardization of sequences and protocols ongoing trials, including the EVOLVED trial, are required to determine whether targeted
early intervention utilizing cardiac magnetic resonance (CMR) to detect fibrosis will lead
across sites and vendors to delineate clear cutoffs for
to improved clinical outcomes. Abbreviations as in Figures 2 and 4.
health and disease in aortic stenosis. As T 1 mapping294 Bing et al. JACC: CARDIOVASCULAR IMAGING, VOL. 12, NO. 2, 2019
Imaging and Impact of Myocardial Fibrosis in Aortic Stenosis FEBRUARY 2019:283–96
research expands, this approach may offer clear ad- bias, which remains an issue in the published
vantages over LGE. For example, future investigation medical data (75).
of antifibrotic therapies will require biomarkers to
monitor myocardial health and treatment effects; T 1 CONCLUSIONS
mapping will be indispensable in this regard.
Further work to investigate the role of emerging Myocardial fibrosis plays a key role in the patho-
CT techniques is also warranted, particularly as physiology of aortic stenosis. Modern imaging tech-
they may be more easily integrated into current niques now allow assessment of both replacement
clinical care pathways and workflows than and diffuse interstitial fibrosis as well as their func-
CMR. There has also been early investigation of tional consequences. These techniques hold promise
collagen- and elastin-specific CMR contrast agents, in tracking myocardial health in patients with aortic
which may provide greater contrast to noise ratio stenosis, aiding risk stratification and potentially
compared with current GBCAs, but further advances optimizing the timing of aortic valve intervention,
in this field are awaited (73,74). Finally, there is with ongoing trials currently testing the clinical effi-
considerable interest in developing novel positron- cacy of these approaches.
emission tomography tracers to measure myocar-
dial fibrosis activity, in contrast to the structural ADDRESS FOR CORRESPONDENCE: Dr. Marc R.
and functional assessments that have been devel- Dweck, BHF Centre for Cardiovascular Science, Uni-
oped to date. We await further studies to demon- versity of Edinburgh, Chancellors Building, 47 Little
strate this potential. As interest in this field France Crescent, Edinburgh, Midlothian EH16 4TJ,
progresses and new techniques emerge, it is of United Kingdom. E-mail: Marc.dweck@ed.ac.uk.
course important to be cognizant of publication Twitter: @MarcDweck.
REFERENCES
1. Nkomo VT, Gardin JM, Skelton TN, stenosis in patients who cannot undergo surgery. deterioration and compensatory mechanisms. Cir-
Gottdiener JS, Scott CG, Enriquez-Sarano M. N Engl J Med 2010;363:1597–607. culation 2003;107:984–91.
Burden of valvular heart diseases: a population-
10. Smith CR, Leon MB, Mack MJ, et al. Trans- 18. Yotti R, Bermejo J, Gutierrez-Ibanes E, et al.
based study. Lancet 2006;368:1005–11.
catheter versus surgical aortic-valve replacement Systemic vascular load in calcific degenerative
2. Iung B, Vahanian A. Epidemiology of valvular in high-risk patients. N Engl J Med 2011;364: aortic valve stenosis: insight from percutaneous
heart disease in the adult. Nat Rev Cardiol 2011;8: 2187–98. valve replacement. J Am Coll Cardiol 2015;65:
162–72. 11. Adams DH, Popma JJ, Reardon MJ, et al. 423–33.
3. Osnabrugge RL, Mylotte D, Head SJ, et al. Transcatheter aortic-valve replacement with a 19. Lindman BR, Otto CM, Douglas PS, et al. Blood
Aortic stenosis in the elderly: disease prevalence self-expanding prosthesis. N Engl J Med 2014; pressure and arterial load after transcatheter
and number of candidates for transcatheter aortic 370:1790–8. aortic valve replacement for aortic stenosis. Circ
valve replacement: a meta-analysis and modeling 12. Leon MB, Smith CR, Mack MJ, et al. Trans- Cardiovasc Imaging 2017;10:e006308.
study. J Am Coll Cardiol 2013;62:1002–12. catheter or surgical aortic-valve replacement in 20. Pawade TA, Newby DE, Dweck MR. Calcifica-
4. Dweck MR, Boon NA, Newby DE. Calcific aortic intermediate-risk patients. N Engl J Med 2016; tion in aortic stenosis: the skeleton key. J Am Coll
stenosis: a disease of the valve and the myocar- 374:1609–20. Cardiol 2015;66:561–77.
dium. J Am Coll Cardiol 2012;60:1854–63. 13. Reardon MJ, Van Mieghem NM, Popma JJ, 21. Kandalam V, Basu R, Moore L, et al. Lack of
et al. Surgical or transcatheter aortic-valve tissue inhibitor of metalloproteinases 2 leads to
5. Rosenhek R, Zilberszac R, Schemper M, et al.
replacement in intermediate-risk patients. N Engl exacerbated left ventricular dysfunction and
Natural history of very severe aortic stenosis.
J Med 2017;376:1321–31. adverse extracellular matrix remodeling in
Circulation 2010;121:151–6.
14. Nishimura RA, Otto CM, Bonow RO, et al. 2014 response to biomechanical stress. Circulation
6. Coffey S, Cox B, Williams MJ. The prevalence,
AHA/ACC guideline for the management of pa- 2011;124:2094–105.
incidence, progression, and risks of aortic valve
tients with valvular heart disease: a report of the 22. Weber KT, Brilla CG. Pathological hypertrophy
sclerosis: a systematic review and meta-analysis.
American College of Cardiology/American Heart and cardiac interstitium. Fibrosis and renin-
J Am Coll Cardiol 2014;63:2852–61.
Association Task Force on Practice Guidelines. angiotensin-aldosterone system. Circulation
7. Genereux P, Stone GW, O’Gara PT, et al. Natural J Am Coll Cardiol 2014;63:e57–185. 1991;83:1849–65.
history, diagnostic approaches, and therapeutic
15. Baumgartner H, Falk V, Bax JJ, et al. 2017 ESC/ 23. Heymans S, Schroen B, Vermeersch P, et al.
strategies for patients with asymptomatic severe
EACTS guidelines for the management of valvular Increased cardiac expression of tissue inhibitor of
aortic stenosis. J Am Coll Cardiol 2016;67:
heart disease. Eur Heart J 2017;38:2739–91. metalloproteinase-1 and tissue inhibitor of
2263–88.
16. Krayenbuehl HP, Hess OM, Monrad ES, metalloproteinase-2 is related to cardiac fibrosis
8. Durko AP, Osnabrugge RL, Van Mieghem NM, Schneider J, Mall G, Turina M. Left-ventricular and dysfunction in the chronic pressure-
et al. Annual number of candidates for trans- myocardial structure in aortic-valve disease overloaded human heart. Circulation 2005;112:
catheter aortic valve implantation per country: before, intermediate, and late after aortic-valve 1136–44.
current estimates and future projections. Eur replacement. Circulation 1989;79:744–55.
Heart J 2018;39:2635–42. 24. Yang W, Wang BH, Wang I, et al. Inhibition of
17. Hein S, Arnon E, Kostin S, et al. Progression apoptosis signal-regulating kinase 1 attenuates
9. Leon MB, Smith CR, Mack M, et al. Trans- from compensated hypertrophy to failure in the myocyte hypertrophy and fibroblast collagen
catheter aortic-valve implantation for aortic pressure-overloaded human heart: structural synthesis. Heart Lung Circ 2017;12:e0187459.JACC: CARDIOVASCULAR IMAGING, VOL. 12, NO. 2, 2019 Bing et al. 295
FEBRUARY 2019:283–96 Imaging and Impact of Myocardial Fibrosis in Aortic Stenosis
25. Treibel TA, Kozor R, Schofield R, et al. Reverse magnetic resonance imaging in nonischemic cardiomyopathy: all-cause mortality and heart
myocardial remodeling following valve replace- dilated cardiomyopathy: a review and meta-anal- failure. J Am Coll Cardiol Img 2016;9:40–50.
ment in patients with aortic stenosis. J Am Coll ysis. J Am Coll Cardiol Img 2018;11:1274–84.
54. Puntmann VO, Carr-White G, Jabbour A, et al.
Cardiol 2018;71:860–71.
39. Shah AS, Chin CW, Vassiliou V, et al. Left Native T1 and ECV of noninfarcted myocardium
26. Treibel TA, Lopez B, Gonzalez A, et al. Reap- ventricular hypertrophy with strain and aortic and outcome in patients with coronary artery
praising myocardial fibrosis in severe aortic ste- stenosis. Circulation 2014;130:1607–16. disease. J Am Coll Cardiol 2018;71:766–78.
nosis: an invasive and non-invasive study in 133
40. Chin CW, Shah AS, McAllister DA, et al. High- 55. Bull S, White SK, Piechnik SK, et al. Human
patients. Eur Heart J 2018;39:699–709.
sensitivity troponin I concentrations are a marker non-contrast T1 values and correlation with his-
27. Weidemann F, Herrmann S, Stork S, et al. of an advanced hypertrophic response and adverse tology in diffuse fibrosis. Heart 2013;99:932–7.
Impact of myocardial fibrosis in patients with outcomes in patients with aortic stenosis. Eur
56. Lee SP, Lee W, Lee JM, et al. Assessment of
symptomatic severe aortic stenosis. Circulation Heart J 2014;35:2312–21.
diffuse myocardial fibrosis by using MR imaging in
2009;120:577–84.
41. Chin CWL, Everett RJ, Kwiecinski J, et al. asymptomatic patients with aortic stenosis. Radi-
28. Azevedo CF, Nigri M, Higuchi ML, et al. Prog- Myocardial fibrosis and cardiac decompensation in ology 2015;274:359–69.
nostic significance of myocardial fibrosis quantifi- aortic stenosis. J Am Coll Cardiol Img 2017;10:
57. Kockova R, Kacer P, Pirk J, et al. Native T1
cation by histopathology and magnetic resonance 1320–33.
relaxation time and extracellular volume fraction
imaging in patients with severe aortic valve dis-
42. Everett RJ, Tastet L, Clavel MA, et al. Pro- as accurate markers of diffuse myocardial fibrosis
ease. J Am Coll Cardiol 2010;56:278–87.
gression of hypertrophy and myocardial fibrosis in in heart valve disease- comparison with targeted
29. Herrmann S, Stork S, Niemann M, et al. Low- aortic stenosis: a multicenter cardiac magnetic left ventricular myocardial biopsy. Circ J 2016;80:
gradient aortic valve stenosis myocardial fibrosis resonance study. Circ Cardiovasc Imaging 2018;11: 1202–9.
and its influence on function and outcome. J Am e007451.
58. Lee H, Park JB, Yoon YE, et al. Noncontrast
Coll Cardiol 2011;58:402–12.
43. Chen H, Zeng J, Liu D, Yang Q. Prognostic myocardial T1 mapping by cardiac magnetic reso-
30. Yilmaz A, Kindermann I, Kindermann M, et al. value of late gadolinium enhancement on CMR in nance predicts outcome in patients with aortic
Comparative evaluation of left and right ventric- patients with severe aortic valve disease: a sys- stenosis. J Am Coll Cardiol Img 2018;11:974–83.
ular endomyocardial biopsy: differences in tematic review and meta-analysis. Clin Radiol
59. Chin CW, Semple S, Malley T, et al. Optimi-
complication rate and diagnostic performance. 2018;73:983. e7–14.
zation and comparison of myocardial T1 tech-
Circulation 2010;122:900–9.
44. Dweck MR, Joshi S, Murigu T, et al. Midwall niques at 3T in patients with aortic stenosis. Eur
31. Weng Z, Yao J, Chan RH, et al. Prognostic value fibrosis is an independent predictor of mortality in Heart J Cardiovasc Imaging 2014;15:556–65.
of LGE-CMR in HCM: a meta-analysis. J Am Coll patients with aortic stenosis. J Am Coll Cardiol
Cardiol Img 2016;9:1392–402. 60. Podlesnikar T, Delgado V, Bax JJ. Cardiovas-
2011;58:1271–9.
cular magnetic resonance imaging to assess
32. Raina S, Lensing SY, Nairooz RS, et al. Prog- 45. Barone-Rochette G, Pierard S, De Meester de myocardial fibrosis in valvular heart disease. Int J
nostic value of late gadolinium enhancement cmr Ravenstein C, et al. Prognostic significance of LGE Cardiovasc Imaging 2018;34:97–112.
in systemic amyloidosis. J Am Coll Cardiol Img by CMR in aortic stenosis patients undergoing
2016;9:1267–77. 61. Dabir D, Child N, Kalra A, et al. Reference
valve replacement. J Am Coll Cardiol 2014;64:
values for healthy human myocardium using a T1
33. Hulten E, Agarwal V, Cahill M, et al. Presence 144–54.
mapping methodology: results from the Interna-
of late gadolinium enhancement by cardiac mag- 46. Musa TA, Treibel TA, Vassiliou VS, et al. tional T1 Multicenter cardiovascular magnetic
netic resonance among patients with suspected Myocardial scar and mortality in severe aortic resonance study. J Cardiovasc Magn Reson 2014;
cardiac sarcoidosis is associated with adverse car- stenosis. Circulation 2018;138:1935–47. 16:69.
diovascular prognosis: a systematic review and
47. Dweck M. Early Valve Replacement Guided by 62. Flett AS, Hayward MP, Ashworth MT, et al.
meta-analysis. Circ Cardiovasc Imaging 2016;9:
Biomarkers of LV Decompensation in Asymptom- Equilibrium contrast cardiovascular magnetic
e005001.
atic Patients With Severe AS (EVoLVeD). Available resonance for the measurement of diffuse
34. Di Marco A, Anguera I, Schmitt M, et al. Late at: https://clinicaltrials.gov/ct2/show/NCT03 myocardial fibrosis: preliminary validation in
gadolinium enhancement and the risk for ventric- 094143. Accessed May 2, 2018. humans. Circulation 2010;122:138–44.
ular arrhythmias or sudden death in dilated
48. Puntmann VO, Peker E, Chandrashekhar Y, 63. Ugander M, Oki AJ, Hsu LY, et al. Extracellular
cardiomyopathy: systematic review and meta-
Nagel E. T1 mapping in characterizing myocardial volume imaging by magnetic resonance imaging
analysis. J Am Coll Cardiol HF 2017;5:28–38.
disease: a comprehensive review. Circ Res 2016; provides insights into overt and sub-clinical
35. Halliday BP, Gulati A, Ali A, et al. Association 119:277–99. myocardial pathology. Eur Heart J 2012;33:
between midwall late gadolinium enhancement
49. Taylor AJ, Salerno M, Dharmakumar R, Jer- 1268–78.
and sudden cardiac death in patients with dilated
osch-Herold M. T1 mapping: basic techniques and 64. Wong TC, Piehler K, Meier CG, et al. Associa-
cardiomyopathy and mild and moderate left ven-
clinical applications. J Am Coll Cardiol Img 2016;9: tion between extracellular matrix expansion
tricular systolic dysfunction. Circulation 2017;135:
67–81. quantified by cardiovascular magnetic resonance
2106–15.
50. Look DC, Locker DR. Time saving in measure- and short-term mortality. Circulation 2012;126:
36. Aquaro GD, Perfetti M, Camastra G, et al.
ment of NMR and EPR relaxation times. Review of 1206–16.
Cardiac MR with late gadolinium enhancement in
Scientific Instruments 1970;41:250–1.
acute myocarditis with preserved systolic func- 65. Miller CA, Naish JH, Bishop P, et al. Compre-
tion: ITAMY Study. J Am Coll Cardiol 2017;70: 51. Messroghli DR, Radjenovic A, Kozerke S, hensive validation of cardiovascular magnetic
1977–87. Higgins DM, Sivananthan MU, Ridgway JP. Modi- resonance techniques for the assessment of
fied Look-Locker inversion recovery (MOLLI) for myocardial extracellular volume. Circ Cardiovasc
37. Ganesan AN, Gunton J, Nucifora G,
high-resolution T1 mapping of the heart. Magn Imaging 2013;6:373–83.
McGavigan AD, Selvanayagam JB. Impact of late
Reson Med 2004;52:141–6.
gadolinium enhancement on mortality, sudden 66. White SK, Sado DM, Fontana M, et al. T1
death and major adverse cardiovascular events in 52. Piechnik SK, Ferreira VM, Dall’Armellina E, mapping for myocardial extracellular volume
ischemic and nonischemic cardiomyopathy: a sys- et al. Shortened Modified Look-Locker Inversion measurement by CMR: bolus only versus primed
tematic review and meta-analysis. Int J Cardiol recovery (ShMOLLI) for clinical myocardial T1- infusion technique. J Am Coll Cardiol Img 2013;6:
2018;254:230–7. mapping at 1.5 and 3 T within a 9 heartbeat 955–62.
breathhold. J Cardiovasc Magn Reson 2010;12:69.
38. Becker MAJ, Cornel JH, van de Ven PM, van 67. Treibel TA, Fontana M, Maestrini V, et al.
Rossum AC, Allaart CP, Germans T. The prognostic 53. Puntmann VO, Carr-White G, Jabbour A, et al. Automatic measurement of the myocardial
value of late gadolinium-enhanced cardiac T1-mapping and outcome in nonischemic interstitium: synthetic extracellular volume296 Bing et al. JACC: CARDIOVASCULAR IMAGING, VOL. 12, NO. 2, 2019
Imaging and Impact of Myocardial Fibrosis in Aortic Stenosis FEBRUARY 2019:283–96
quantification without hematocrit sampling. J Am updated review of related biases. Health Technol 84. Dusenbery SM, Jerosch-Herold M, Rickers C,
Coll Cardiol Img 2016;9:54–63. Assess 2010;14. iii, ix–xi, 1–193. et al. Myocardial extracellular remodeling is
associated with ventricular diastolic dysfunction in
68. Robison S, Karur GR, Wald RM, 76. Ross J Jr., Braunwald E. Aortic stenosis. Cir-
children and young adults with congenital aortic
Thavendiranathan P, Crean AM, Hanneman K. culation 1968;38:61–7.
stenosis. J Am Coll Cardiol 2014;63:1778–85.
Noninvasive hematocrit assessment for cardio-
77. Fontana M, White SK, Banypersad SM, et al.
vascular magnetic resonance extracellular volume 85. Bandula S, White SK, Flett AS, et al. Mea-
Comparison of T1 mapping techniques for ECV
quantification using a point-of-care device and surement of myocardial extracellular volume
quantification. Histological validation and repro-
synthetic derivation. J Cardiovasc Magn Reson fraction by using equilibrium contrast-enhanced
ducibility of ShMOLLI versus multibreath-hold T1
2018;20:19. CT: validation against histologic findings. Radi-
quantification equilibrium contrast CMR.
ology 2013;269:396–403.
69. Messroghli DR, Moon JC, Ferreira VM, et al. J Cardiovasc Magn Reson 2012;14:88.
Clinical recommendations for cardiovascular 86. Hong YJ, Kim TK, Hong D, et al. Myocardial
78. Flett AS, Sado DM, Quarta G, et al. Diffuse
magnetic resonance mapping of T1, T2, T2* and characterization using dual-energy CT in
myocardial fibrosis in severe aortic stenosis: an
extracellular volume: A consensus statement by doxorubicin-induced DCM: comparison with CMR
equilibrium contrast cardiovascular magnetic
the Society for Cardiovascular Magnetic Reso- T1-mapping and histology in a rabbit model. J Am
resonance study. Eur Heart J Cardiovasc Imaging
nance (SCMR) endorsed by the European Associ- Coll Cardiol Img 2016;9:836–45.
2012;13:819–26.
ation for Cardiovascular Imaging (EACVI). 87. Treibel TA, Fontana M, Steeden JA, et al.
J Cardiovasc Magn Reson 2017;19:75. 79. Debl K, Djavidani B, Buchner S, et al. Delayed
Automatic quantification of the myocardial extra-
hyperenhancement in magnetic resonance imag-
70. Nagata Y, Takeuchi M, Wu VC, et al. Prognostic cellular volume by cardiac computed tomography:
ing of left ventricular hypertrophy caused by
value of LV deformation parameters using 2D and synthetic ECV by CCT. J Cardiovasc Comput
aortic stenosis and hypertrophic cardiomyopathy:
3D speckle-tracking echocardiography in asymp- Tomogr 2017;11:221–6.
visualisation of focal fibrosis. Heart 2006;92:
tomatic patients with severe aortic stenosis and 88. Nacif MS, Kawel N, Lee JJ, et al. Interstitial
1447–51.
preserved LV ejection fraction. J Am Coll Cardiol myocardial fibrosis assessed as extracellular vol-
Img 2015;8:235–45. 80. Rudolph A, Abdel-Aty H, Bohl S, et al.
ume fraction with low-radiation-dose cardiac CT.
Noninvasive detection of fibrosis applying
71. Hwang JW, Kim SM, Park SJ, et al. Assessment Radiology 2012;264:876–83.
contrast-enhanced cardiac magnetic resonance in
of reverse remodeling predicted by myocardial 89. Nacif MS, Liu Y, Yao J, et al. 3D left ventricular
different forms of left ventricular hypertrophy
deformation on tissue tracking in patients with extracellular volume fraction by low-radiation dose
relation to remodeling. J Am Coll Cardiol 2009;53:
severe aortic stenosis: a cardiovascular magnetic cardiac CT: assessment of interstitial myocardial
284–91.
resonance imaging study. J Cardiovasc Magn fibrosis. J Cardiovasc Comput Tomogr 2013;7:51–7.
Reson 2017;19:80. 81. Rajesh GN, Thottian JJ, Subramaniam G,
Desabandhu V, Sajeev CG, Krishnan MN. Preva- 90. Treibel TA, Bandula S, Fontana M, et al.
72. Chin CW, Messika-Zeitoun D, Shah AS, et al. Extracellular volume quantification by dynamic
lence and prognostic significance of left ventric-
A clinical risk score of myocardial fibrosis predicts equilibrium cardiac computed tomography in car-
ular myocardial late gadolinium enhancement in
adverse outcomes in aortic stenosis. Eur Heart J diac amyloidosis. J Cardiovasc Comput Tomogr
severe aortic stenosis. Indian Heart Journal 2017;
2016;37:713–23. 2015;9:585–92.
69:742–50.
73. Spuentrup E, Ruhl KM, Botnar RM, et al. Mo- 91. Lee HJ, Im DJ, Youn JC, et al. Myocardial
82. de Meester de Ravenstein C, Bouzin C,
lecular magnetic resonance imaging of myocardial extracellular volume fraction with dual-energy
Lazam S, et al. Histological validation of mea-
perfusion with EP-3600, a collagen-specific equilibrium contrast-enhanced cardiac CT in non-
surement of diffuse interstitial myocardial fibrosis
contrast agent: initial feasibility study in a swine ischemic cardiomyopathy: a prospective compari-
by myocardial extravascular volume fraction from
model. Circulation 2009;119:1768–75. son with cardiac MR Imaging. Radiology 2016;
Modified Look-Locker imaging (MOLLI) T1 map-
74. Wildgruber M, Bielicki I, Aichler M, et al. ping at 3 T. J Cardiovasc Magn Reson 2015;17:48. 280:49–57.
Assessment of myocardial infarction and post-
83. Child N, Suna G, Dabir D, et al. Comparison
infarction scar remodeling with an elastin-specific
of MOLLI, shMOLLLI, and SASHA in discrimina-
magnetic resonance agent. Circ Cardiovasc Imag-
tion between health and disease and relationship KEY WORDS aortic stenosis, cardiac
ing 2014;7:321–9.
with histologically derived collagen volume magnetic resonance, late gadolinium
75. Song F, Parekh S, Hooper L, et al. Dissemina- fraction. Eur Heart J Cardiovasc Imaging 2018; enhancement, myocardial fibrosis,
tion and publication of research findings: an 19:768–76. T 1 mappingYou can also read