Longitudinal Study of Postconcussion Syndrome: Not Everyone Recovers - Allied ...
←
→
Page content transcription
If your browser does not render page correctly, please read the page content below
JOURNAL OF NEUROTRAUMA 34:1511–1523 (April 15, 2017)
ª Mary Ann Liebert, Inc.                                                                             Original Articles
DOI: 10.1089/neu.2016.4677

              Longitudinal Study of Postconcussion Syndrome:
                           Not Everyone Recovers

                 Carmen Hiploylee,1,2 Paul A. Dufort,2 Hannah S. Davis,1,2 Richard A. Wennberg,2,3
                Maria Carmela Tartaglia,2,3 David Mikulis,2,4 Lili-Naz Hazrati,2,5 and Charles H. Tator1,2

Abstract
We examined recovery from postconcussion syndrome (PCS) in a series of 285 patients diagnosed with concussion based
on international sport concussion criteria who received a questionnaire regarding recovery. Of 141 respondents, those with
postconcussion symptoms lasting less than 3 months, a positive computed tomography (CT) and/or magnetic resonance
imaging (MRI), litigants, and known Test of Memory Malingering (TOMM)-positive cases were excluded, leaving 110
eligible respondents. We found that only 27% of our population eventually recovered and 67% of those who recovered did
so within the first year. Notably, no eligible respondent recovered from PCS lasting 3 years or longer. Those who did not
recover (n = 80) were more likely to be non-compliant with a do-not-return-to-play recommendation ( p = 0.006) but did
not differ from the recovered group (n = 30) in other demographic variables, including age and sex ( p ‡ 0.05). Clustergram
analysis revealed that symptoms tended to appear in a predictable order, such that symptoms later in the order were more
likely to be present if those earlier in the order were already present. Cox proportional hazards model analysis showed that
the more symptoms reported, the longer the time to recovery ( p = 7.4 · 10-6), with each additional symptom reducing the
recovery rate by approximately 20%. This is the first longitudinal PCS study to focus on PCS defined specifically as a
minimum of 3 months of symptoms, negative CT and/or MRI, negative TOMM test, and no litigation. PCS may be
permanent if recovery has not occurred by 3 years. Symptoms appear in a predictable order, and each additional PCS
symptom reduces recovery rate by 20%. More long-term follow-up studies are needed to examine recovery from PCS.

Keywords: definitions, eligibility, and exclusions; number of symptoms; postconcussion syndrome; recovery

Introduction                                                            terize persisting PCS. We used the following criterion for the
                                                                        clinical diagnosis of PCS: the persistence of any symptom 3 months
P    ostconcussion syndrome (PCS) reportedly affects 5–43%
     of concussed individuals who would otherwise fully recover
within the first 3 months.1,2 This wide range of recovery from PCS
                                                                        after concussion. The medical charts of 285 consecutive patients
                                                                        with the possible diagnosis of PCS were reviewed. Questionnaires
                                                                        were then sent to these patients to collect specific information about
indicates the need for further analysis. PCS encompasses a con-
                                                                        recovery from PCS. The aims were to determine differences be-
stellation of symptoms that commonly include headache, depres-
                                                                        tween those who recovered from PCS and those who did not, and to
sion, difficulty concentrating, and fatigue.3 Little is known
                                                                        identify potential factors that affect recovery time.
regarding the exact cause of PCS, but risk factors often cited in the
literature include pre-morbid psychiatric illness,4 learning dis-
                                                                        Methods
ability,5 migraine headaches,6 being female,1,4 and age.7–9 Multiple
concussions have been implicated in the development of chronic          Participants and procedures
traumatic encephalopathy (CTE), a progressive tauopathy,10 but it
                                                                           The same patient cohort reported by Tator and colleagues11 was
is unknown if PCS is a predictor of CTE. At present, PCS is a           used for this longitudinal study. It consists of 285 patients with the
clinical diagnosis without a diagnostic biomarker and there is no       diagnosis of PCS seen by C.H.T. (a neurosurgeon with a special
evidence-based treatment. PCS sufferers often feel frustrated and       interest in concussion and PCS) from January 1997 to June 2013 at
helpless due to the difficulty in diagnosis and the absence of proven   the Toronto Western Hospital (TWH), a specialty hospital located
treatment. The purpose of the present study was to better charac-       in Toronto with a major focus on neurological disorders. Clinical

  1
   Division of Neurosurgery, 3Division of Neurology, 4Division of Neuroradiology, University of Toronto and Toronto Western Hospital, Toronto,
Ontario, Canada.
  2
   Canadian Concussion Center, Toronto Western Hospital, Toronto, Ontario, Canada.
  5
   Department of Laboratory Medicine and Pathobiology, University of Toronto, Toronto, Ontario, Canada.

                                                                    1511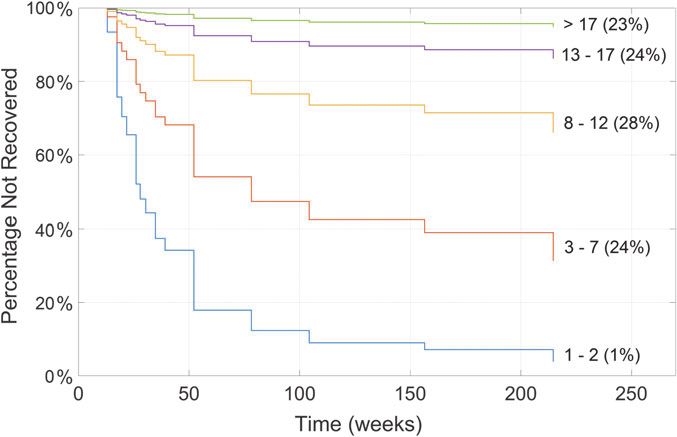
1512                                                                                                                   HIPLOYLEE ET AL.

and demographic data were collected retrospectively from medical         treatments tried and their perceived efficacy, including occupa-
charts and were recently reported.11 This cohort was mailed a            tional therapy, medication, chiropractic manipulation, psycho-
questionnaire and an informed consent form to be completed and           therapy, physiotherapy, and vestibular repositioning exercises; 4)
returned via mail or by phone. Some longitudinal data collected          comorbidities including migraines, attention deficit disorder
from the retrospective study11 were combined with the follow-up          (ADD)/attention deficit hyperactivity disorder (ADHD), learning
data collected from the present study. Patient age was recorded as       disability, mononucleosis, depression, anxiety, and suicide at-
the age at the time of the concussion that led to the clinic ap-         tempts before and after the concussion; 5) compliance with a do-
pointment. This study was approved by the University Health              not-return-to-play recommendation from C.H.T.; 6) impact of the
Network (UHN) Research Ethics Board. UHN comprises four                  concussion on their life (a 5-point Likert scale from ‘‘Not at all’’ to
major teaching and research hospitals, including TWH and the             ‘‘An extreme amount’’); and 7) limitations on previous or current
Canadian Concussion Center.                                              type or amount of schooling or work tolerated. If respondents found
                                                                         checkbox responses insufficient, they were asked to expand their
Inclusion and exclusion criteria                                         answers in the ‘‘other’’ section.
   All participants diagnosed with PCS had at least one symptom
(e.g., headache, irritability, difficulty concentrating) for more than   Statistical analysis
3 months in combination with a negative brain computed tomogra-
phy (CT) or magnetic resonance imaging (MRI) scan. Specifically,            All data are presented as mean – standard deviation. Symptoms
patients with hemorrhage or contusion or other focal imaging ab-         on the questionnaire were categorized into somatic, affective, and
normalities were excluded. Patients involved in litigation for their     cognitive symptoms. The symptom list included in the question-
injuries were excluded (Fig. 1). The criteria for concussion were        naire was based on the list used previously11 and included 35
based on the 2012 Zurich guidelines, a consensus statement of the 4th    persisting symptoms (as shown in Fig. 2). Results of analyses were
International Conference on Concussion in Sport.12 It is recognized      considered significant at p £ 0.05 and a statistical trend present
that there are many definitions of PCS in the literature, as discussed   when 0.05 < p £ 0.1. Analyses were performed using SPSS v. 17.0
in the article by Davis and colleagues.11 The requirement that the       (Chicago, IL), MATLAB Statistics, and Machine Learning Tool-
PCS symptom or symptoms last at least 3 months was selected to           box Release 2014b, The MathWorks, Inc. (Natick, MA).
capture a population with definite persistence of PCS.                      t-Tests were run on continuous variables and chi-squares on
                                                                         categorical variables to compare those who recovered from their
Measures included in the questionnaire (Appendix A)                      index concussion (the concussion that led to the clinical appoint-
                                                                         ment with C.H.T.) with those who did not. When more than 20% of
  Data collected by the questionnaire (Appendix A) included: 1)          the cells in the chi-square had an expected frequency less than 5, the
persisting symptoms; 2) time to recovery or duration of PCS; 3)          likelihood ratio was used. Due to the exploratory nature of the

FIG. 1. Flow chart for case selection. The criteria used for case selection of the cohort beginning with 285 cases, of which 120 were
ultimately selected.
POSTCONCUSSION SYNDROME 1513
FIG. 2. Persisting symptoms. The percentage of the not recovered group (NOT-REC; n = 80) suffering from continuing somatic,
affective, and cognitive symptoms. Note that in those with persisting postconcussion syndrome, the persisting symptoms were quite
evenly dispersed among somatic, affective and cognitive symptoms.
present study, sets of statistical hypothesis tests performed in a mographics, pattern of symptoms, and comorbidities. Four separate
group were subjected to a reduced threshold for statistical signifi- Cox models were analyzed: 1) age and gender; 2) total somatic,
cance p in order to control the false discovery rate to a specified affective, cognitive, and overall number of symptoms; 3) all
value q. By subjecting tests to a threshold reduced according to this symptoms as individual predictors; and 4) comorbidities and
procedure, the method promises that no more than a fraction q of treatments together and individually.
results identified as significant will actually be insignificant (will be
false positives).13 For each group of tests to which this procedure
was applied, two adjusted significance thresholds were employed. Results
The first was calculated with q = 0.05, and p values below this Participants
threshold were considered significant. The second was computed
with q = 0.10, and p values below this threshold were considered to Figure 1 shows the reduction of the initial 285 patients to a
be trending toward significance. The reader should note here that q cohort of 110 patients. Twenty-eight patients could not be con-
is not the threshold, but rather the false discovery rate (FDR) used tacted because of unavailable current addresses. Thus, 257 patients
to compute the reduced threshold. were sent questionnaires by mail and 141 responded, yielding a
Variables for multi-variate analyses fell into three categories: 1) response rate of 54.86%, which is considered average and ex-
demographic; 2) symptoms reported at the index concussion, clinic pected.24 Based on medical chart reviews and information collected
appointment, and questionnaire; and 3) comorbidities and treat-
from the questionnaires, 31 respondents were excluded for the
ments. Vivid dreaming was excluded as a symptom because it was
not reported at the time of the index concussion. The remaining following reasons: positive CT or MRI scans (e.g., hemorrhages,
symptoms were further subdivided into 20 somatic, eight affective, contusions); recovery within 3 months; involvement in litigation;
and six cognitive symptoms. One analysis explored associations or failure on the Test of Memory Malingering (TOMM), which is a
among the variables, while a second examined associations be- reliable test for screening malingerers.25 Eighty-one percent of the
tween the variables and the time to recovery. 110 cases had a CT and/or MRI scan. After exclusions, there were
A principal component analysis14 was performed with symp- 110 PCS patients, 30 in the recovered group (designated REC) and
toms to identify their major patterns of covariation. Permutation 80 in the not recovered group (designated NOT-REC).
testing was employed to assess the number of significant compo-
nents. A clustergram analysis,15–19 was performed to visualize
potential patterns of clustering between patients and symptoms. It Demographics
consists of a heat map depicting both symptoms and patients to- There was no significant difference between REC and NOT-
gether, and two hierarchical agglomerative clustering analyses
REC with respect to sex, age, cause of injury (sports-related vs.
producing dendrograms for symptoms and patients separately. The
consensus across three different cluster evaluation methods20–22 non-sports-related), or presence or absence of one or more subse-
was used to establish the number of significant clusters in each quent concussions after the index concussion ( p ‡ 0.558, FDR
dendrogram. q = 0.05; see Table 1 for a list of FDR-corrected chi-square test
A Cox proportional hazards model23 was used to evaluate the results). There also was no significant difference between REC and
association between time to recover from PCS and patients’ de- NOT-REC with respect to total number of prior concussions1514 HIPLOYLEE ET AL.
Table 1. Differences between Recovered However, the REC group showed a trend toward finding vestibular
and Not Recovered Groups (Chi-Square Tests repositioning exercises effective, whereas the NOT-REC group
with False Discovery Rate Adjustment) showed a trend toward finding medication effective (n = 47;
p = 0.029 and p = 0.024, FDR q = 0.1).
Test p value Respondents also listed a number of other treatments tried and
the results. The following ratios indicate the number who found
Felt limited in school/work at the timePOSTCONCUSSION SYNDROME 1515
FIG. 3. Time required to recover (n = 27) and duration of persisting postconcussion syndrome (PCS; n = 77): Note that no patient
recovered after 3 years.
following varimax rotation revealed no identifiable clustering and Patient clustering
yielded no further insight into the covariance structure among the
The consensus among the three cluster evaluation methods
symptoms.
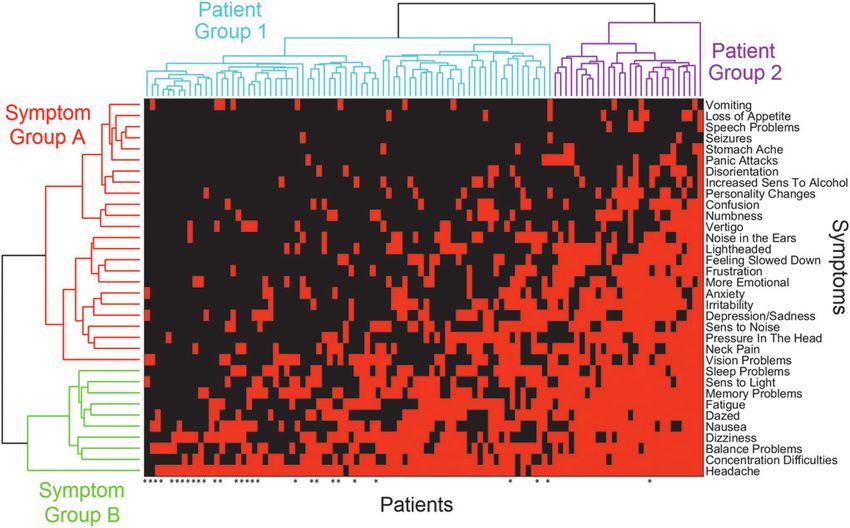
identified two distinct clusters: patient Groups 1 and 2 in Figure 4.
The number of symptoms was strongly associated with patient
Heat map group ( p = 5.8 · 10-15), and in fact, all symptoms showed a sig-
The heat map (Fig. 4) revealed no patient/symptom clusters of nificant positive association with membership in Patient Group 2
the type often seen in genomic heat maps,16 but rather showed a except for headaches (reported by almost all patients), seizures
continuous gradation of patients with progressively more (reported once in one group and twice in the other), and vomiting
symptoms from left to right, and a similar gradation of symptoms (which, as noted earlier, does not appear to fit into the ordering
reported with progressively greater frequency from top to bot- displayed by the other symptoms). Patient Group 2 also was sig-
tom. The heat map algorithm orders patients and symptoms so nificantly associated with patients who reported a distinct behav-
that adjacent items are similar; two patients are similar to the ioral phenotype: the experience of depression, anxiety, and learning
extent they share the same symptoms, while two symptoms are disorders following their concussion; trying medication, psycho-
similar to the extent patients tend to have both symptoms or therapy, and vestibular repositioning as treatments; and finding
neither. medication and psychotherapy as effective treatments. There was
The ordering of symptoms reveals that a symptom occurring no significant association between patient group with age or gender.
higher in the order (toward the vomiting end) is 2.2 times more
likely to occur if a symptom occurring lower in the order (toward Symptom clustering
the headaches end) is also present than if the latter symptom is The cluster evaluation methods identified two distinct clusters
absent. This is significantly higher ( p = 0.0001, permutation test) among symptoms: symptom Groups A and B (Fig. 4). The symp-
than would be expected from uncorrelated symptoms with the same tom grouping was strongly associated with the number of patients
frequencies, where the expected ratio is 1.27 – 0.02. This means reporting each symptom ( p = 6.2 · 10-6). However, the symptom
that two patients with the same number of symptoms tend to exhibit grouping was not significantly associated with the symptom cate-
the same symptoms to a greater extent than can be expected on the gorization into somatic, affective, and cognitive symptoms. Based
basis of symptom frequencies alone. Similarly, as one traverses a on Figure 4, the primary difference between the two symptom
group of patients with progressively more symptoms, the symp- groups is that Group B appears to contain symptoms that are re-
toms tend to appear in a predictable order. This is consistent with ported significantly more often than those in Group A. It also ap-
the positive correlation among nearly all symptoms found in the pears that if patients are going to report 10 or fewer symptoms, they
principal components analysis. are far more likely to be from symptom Group B than from
Vomiting does not appear to obey the same symptom-ordering symptom Group A.
property discussed above, in that the appearance of symptoms
lower in the order do not make it more likely. As further evidence, it
Other associations
was the only symptom that showed a negative weighting (albeit of
small magnitude) in the one significant principal component ex- A large-scale test for associations between symptoms on the one
plaining the most variance among the symptoms. hand and comorbidities and treatments on the other yielded only 331516 HIPLOYLEE ET AL.
FIG. 4. Clustergram of patients vs. symptoms. A heat map is shown in the central area, with each column representing a patient, and
each row, a symptom. A red square in a particular row and column indicates the symptom for that row was present in the patient for that
column; a black square represents the absence of the symptom. Dendrograms from agglomerative clustering analyses of both patients
and symptoms appear at the top and left, respectively, where they have each been divided into two constituent groups. The 29 patients
who had recovered are denoted by asterisks along the bottom edge. Symptoms in Group B were reported by significantly more patients
than symptoms in Group A. Patients in Group 2 reported significantly more symptoms than patients in Group 1, and also were
significantly more likely to have experienced post-injury depression and anxiety, to have tried medication and psychotherapy for
treatment, and to have found these treatments effective. Color image is available online at www.liebertpub.com/neu
significant associations following FDR correction out of a total of (q > 0.5 for all pairs); therefore, including them together in a single
34 · 36 = 1224 tests. Most of these followed obviously from their model did not yield a stronger association with time to recovery.
definitions. For example, patients who reported anxiety as a Following FDR correction, no individual symptom considered
symptom also reported experiencing anxiety following their con- alone was significantly associated with time to recovery. Similarly,
cussion as a comorbidity, trying medication and psychotherapy to none of the comorbidities and treatments was statistically signifi-
treat their anxiety, and finding this treatment effective. A similar set cant following FDR correction, although taking medication to treat
of associations was exhibited for depression. A few significant depression came closest. Figure 5 illustrates the most robust of
exceptions to these expected patterns included significant positive these results, showing the recovery curves for individuals reporting
associations between reporting symptoms of slurred speech and 1–2, 3–7, 8–12, 13–17, and more than 17 total symptoms. The
other speech problems, a greater number of prior concussions, and proportion of the 104 patients best represented by each curve is
with the taking of anxiety and depression medications. shown in parentheses. The regression coefficient for the total
number of reported symptoms in the Cox model was b =
Associations with time to recovery -0.206 – 0.046, representing a reduction of roughly 20% in the
recovery rate for each additional symptom. These results suggest
A further six respondents were excluded from this particular that the number of symptoms reported by a patient may be the best
analysis due to the absence of one or more variables, leaving 29 predictor of the time to recovery, and that the nature of the symp-
who had recovered by the time they completed their questionnaire toms making up this number are less important. However, the
and 75 who were classified as censored for the purpose of this Cox earlier finding that symptoms tend to appear in a predictable order
analysis. Neither age nor gender were significantly associated with may render this redundant, since patients reporting the same
time to recovery. In contrast, the number of reported symptoms was number of symptoms also tend to report the same symptoms.
highly associated with time to recovery ( p = 7.4 · 10-6). The
number of symptoms reported in each of the somatic, affective, and
Litigants
cognitive sub-groups were also highly significant with p < 10-4 for
all three, but none reached the level of significance of the total None of those who recovered from PCS were involved in
number of symptoms. These three regressors are highly correlated litigation. The nine litigants excluded from analyses because ofPOSTCONCUSSION SYNDROME 1517
FIG. 5. Recovery curves for patients reporting different numbers of symptoms from a Cox proportional hazards analysis. The number
of symptoms associated with each curve is shown to the right of the figure at the end of each curve, with the percentage of patients in
this range shown in parentheses. Color image is available online at www.liebertpub.com/neu
ongoing litigation would have been in the NON-REC group. These groups did not significantly differ in total number of con-
Concern about including litigants in PCS research studies has been cussions sustained, number of cognitive symptoms, cause of injury,
expressed since litigation has been reported to prolong recovery and duration of PCS ( p ‡ 0.09 for all tests). However, litigants were
and indicate an over-reporting of symptoms.26,27 Thus, litigants more likely to be older, female, and self-report a greater number of
were compared with non-litigants within the NOT-REC group. somatic, affective, and overall symptoms ( p £ 0.03 for all tests;
Table 3).
Table 2. Demographics and Features of REC
vs. NOT-REC Patients with PCS
Discussion
Included (N = 110) This is the first longitudinal follow-up study of patients with PCS
NOT-REC based on a diagnosis of concussion strictly in conformity with the
REC (n = 30) (n = 80) international sport concussion criteria, and which specifically
Age at time of index 22.93 – 13.1 27.7 – 15.12 Table 3. Litigants vs. Non-Litigants
concussion (11–60) (10–71)
Sex 15 F (50%); 35 F (43.75%); Non-Litigants in
15 M (50%) 45 M (56.25%) Litigants (n = 9) NOT-REC (n = 80)
Total number of 2.57 – 2.59 2.86 – 3.26
concussionsa Age at time 42.44 – 17.13 27.7 – 15.12
Number of persisting symptoms of index (14–61) (10–71)
Somatic N/A 5.33 – 4.22 concussion*
Affective 2.74 – 2.61 Sex* 7 F (77.78%); 35 F (43.75%);
Cognitive 2.24 – 1.72 2M (22.22%) 45 M (56.25%)
TOTAL 10.31 – 7.47 Total number of 2.78 – 2.72 2.86 – 3.26
Number of symptoms experienced concussionsa
during last clinic appointment Symptoms
Somatic 4.5 – 2.6 4.79 – 2.17 Somatic* 8.56 – 5.1 5.34 – 4.21
Affective 1.1 – 1.54 1.44 – 1.41 Affective* 5.33 – 2.12 2.74 – 2.61
Cognitive 1.27 – 1.23 1.65 – 1.28 Cognitive 2.78 – 1.48 2.24 – 1.72
TOTAL 6.87 – 4.3 7.88 – 3.8 TOTAL* 16.67 – 7.45 10.31 – 7.48
Cause Cause
Sports 17 (56.67%) 50 (62.5%) Sports 3 (33.33%) 50 (62.5%)
Other 13 (43.33%) 30 (37.5%) Other 6 (66.67%) 30 (37.5%)
Subsequent concussion 5 (16.67%) 23 (28.75%) Duration 55.78 – 36.05 53.49 – 48.2
Followed do not return to 19 of 19 40 of 51 of ongoing
play recommendation?* (100%) (78.43%) PCS (months)
a a
Including index concussion Including index concussion
* denotes p £ 0.05 * denotes p £ 0.05
Data are presented as mean – standard deviation. Data are presented as mean – standard deviation
REC, recovered; NOT-REC, not recovered; F, female; M, male; NOT-REC, not recovered; F, female; M, male; PCS, postconcussion
N/A = not applicable. syndrome.1518 HIPLOYLEE ET AL.
excluded patients with contusions and hemorrhages identified by An important finding in our study was that no patient recovered
imaging, known TOMM-positive cases, and litigants. More se- who had PCS lasting 3 years or longer. Only 27% of our population
vere brain injuries often represent a significant proportion of eventually recovered and 67% of those who recovered did so within
patients in reports of PCS and can provide misleading in- the first year. The finding that PCS may be permanent if it lasts
formation about concussion because of inclusion of symptoms longer than 3 years suggests that it may be critical to treat PCS
of focal brain injury.11 Also, this is the first longitudinal study appropriately in the early stages. To our knowledge, this is the first
of PCS to analyze symptom patterns using heat maps, and to study to identify a definite duration of PCS beyond which recovery
predict time to recovery using a Cox model with symptoms as has not occurred in a large population of PCS patients.
predictors. The symptoms experienced by PCS sufferers in this study span a
There is incomplete knowledge of the demographic features, wide range. The most common symptoms were headaches, diffi-
etiology, and recovery course of patients with PCS. Interestingly, culty concentrating, and fatigue. However, symptom profiles for
we found no major demographic differences, such as age or sex, each individual may change over time and unfortunately, we were
between recovered and non-recovered groups. In contrast, one not able to perform the follow-up data collection at specified time-
systematic review of PCS found that being older and female were points after the index concussion. The most commonly reported
significant contributors to persisting PCS.28 In the present study, symptoms in our study differ somewhat from other studies,36,37 but
only among litigants were female sex and older age significantly it is difficult to compare studies because the duration of PCS dif-
related to persisting PCS. fered among studies. The average follow-up with our questionnaire
We performed two exploratory multivariate analyses of demo- since the last clinic appointment was 4.4 years. This is one of the
graphics, symptomology, comorbidities, and treatments in patients longest follow-up studies to date in PCS, and we intend to continue
with persisting PCS. The first examined the associations among the follow-up of this patient population.
symptoms using principal component analysis, and between All respondents were seen by a single physician who specializes
symptoms and patients based on clustergram analysis. These ana- in concussion with persisting symptoms, and so a specified subset
lyses revealed that 33 of the 34 symptoms were positively weighted of PCS sufferers comprised this cohort. However, the data is con-
in the one significant principal component, with vomiting the only sistent in terms of the definitions of concussion and PCS and the
exception, highlighting a general tendency for all symptoms to be methods of collection. It is possible that respondents reported more
positively correlated with each other. The clustergram analysis also symptoms on the questionnaire than if they had been asked to report
showed a correlational structure and an ordering among the directly to the physician.38 Iverson and colleagues found that the
symptoms, with symptoms later in the ordering being twice as same group of PCS patients tended to self-report more symptoms
likely to appear if symptoms earlier in the ordering are present. This on a questionnaire than they reported directly to a physician, al-
leads to a tendency for patients with the same number of symptoms though participants in that study were receiving compensation from
to have the same symptoms, and for symptoms to appear in a a workers’ compensation system when tested.38 Importantly, our
predictable order as their numbers increase. The pathophysiology study likely had a response bias as unrecovered PCS sufferers may
of these symptom relationships is unknown, such as whether there have been more willing to participate in the follow-up question-
is a structural basis. naire, whereas recovered PCS patients may have been less likely to
There is likely much more to be elucidated about these depen- take the time to respond.
dencies among symptoms, a possibility that has the potential to More studies with long-term follow-up utilizing the specific
yield stronger prognostic models capable of better predicting definitions of concussion and PCS of the present study are needed,
negative outcomes in PCS. Multivariate regression models may be especially with respect to exclusion of focal injuries, such as
inadequate for this task,29 but more sophisticated probabilistic contusions and hemorrhages. Such studies are required to predict
graphical models30 or causal inference methods29,31 might provide recovery in persisting PCS and to inform potential treatment regi-
greater insight. mens.
The second analysis examined the association of demograph-
ics, symptoms, comorbidity, and treatment variables with pa-
Acknowledgments
tients’ time to recovery. We do not refer to this as a prognostic
model, since the independent variables were assessed at varying The authors thank Dr. Adrian Crawley for his helpful comments
times ranging from the initial injury to the time of recovery, on the statistical analyses and manuscript. This study was funded by
which differs from prior studies.32 However, prognostic models of grants from the Ontario Brain Institute and the Toronto General and
concussion outcome are important for risk stratification of pa- Western Hospital Foundation, including grants from SmartCentres
tients at the early stages of injury; therefore, it is important to Limited and the Marion and Gerald Soloway Concussion Chair
examine how our findings may stimulate the creation of such Fund.
models. Consistent with the literature, we found that none of the
individual variables examined showed a significant association
Author Disclosure Statement
with time to recovery.32–34
We found a strong association between the total number of No competing financial interests exist.
symptoms reported and the time to recovery. Future studies may
capitalize on this finding by querying the presence of the full set of
References
symptoms during the first month post-injury, and fitting a Cox
model to the outcomes recorded a month or more later.32 The use of 1. Bazarian, J.J., Wong, T., Harris, M., Leahey, N., Mookerjee, S., and
machine learning approaches may mitigate the need for large Dombovy, M. (1999). Epidemiology and predictors of post-concussive
syndrome after minor head injury in an emergency population. Brain
numbers of patients to match the large number of predictors, such Inj. 13, 173–189.
as the recently described adaptive lasso version of the Cox re- 2. Iverson, G.L. (2005). Outcome from mild traumatic brain injury. Curr.
gression model.35 Opin. Psychiatry 18, 301–317.POSTCONCUSSION SYNDROME 1519
3. Makdissi, M., Cantu, R.C., Johnston, K.M., McCrory, P., and Meeu- 20. Davies, D.L. and Bouldin, D.W. (1979). A cluster separation measure.
wisse, W.H. (2013). The difficult concussion patient: what is the best I.E.E.E. Trans Pattern Anal. Mach. Intell. 1, 224–227.
approach to investigation and management of persistent (>10 days) 21. Kaufman, L. and Rouseeuw, P.J. (1990). Finding Groups in Data:
postconcussive symptoms? Br. J. Sports Med. 47, 308–313. An Introduction to Cluster Analysis. John Wiley & Sons, Inc.: Ho-
4. Carroll, L.J., Cassidy, J.D., Holm, L., Kraus, J., and Coronado, V.G.; boken, NJ.
WHO Collaborating Centre Task Force on Mild Traumatic Brain 22. Rouseeuw, P.J. (1987). Silhouettes: a graphical aid to the interpreta-
Injury. (2004). Methodological issues and research recommenda- tion and validation of cluster. J. Comput. Appl. Math. 20, 53–65.
tions for mild traumatic brain injury: the WHO Collaborating 23. Cox, D.R. and Oakes, D. (1984). Analysis of Survival Data. Chapman
Centre Task Force on Mild Traumatic Brain Injury. J. Rehabil. Med. & Hall: New York.
113–125. 24. Baruch, Y. (1999). Response rate in academic studies—a comparative
5. Zemek, R.L., Farion, K.J., Sampson, M., and McGahern, C. (2013). analysis. Hum. Relations 52, 421–438.
Prognosticators of persistent symptoms following pediatric concus- 25. Tombaugh, T.N. and Tombaugh, P.W. (1996). Test of Memory Mal-
sion: a systematic review. JAMA Pediatr. 167, 259–265. ingering: TOMM. Multi-Health Systems: North Tonawanda, NY.
6. Jotwani, V. and Harmon, K.G. (2010). Postconcussion syndrome in 26. Smith-Seemiller, L., Fow, N.R., Kant, R., and Franzen, M.D. (2003).
athletes. Curr. Sports Med. Rep. 9, 21–26. Presence of postconcussion syndrome symptoms in patients with
7. Field, M., Collins, M.W., Lovell, M.R., and Maroon, J. (2003). Does chronic pain vs mild traumatic brain injury. Brain Inj. 17, 199–206.
age play a role in recovery from sports-related concussion? A com- 27. Paniak, C., Toller-lobe, G., Melnyk, A., and Nagy, J. (2000). Pre-
parison of high school and collegiate athletes. J. Pediatr. 142, 546– diction of vocational status three to four months after treated mild
553. traumatic brain injury. J. Musculoskelet. Pain 8, 193–200.
8. Wall, P.L. (2012). Posttraumatic stress disorder and traumatic brain 28. King, N. (2014). Permanent post concussion symptoms after mild
injury in current military populations: a critical analysis. J. Am. head injury: a systematic review of age and gender factors. NeuroR-
Psychiatr. Nurs. Assoc. 18, 278–298. ehabilitation 34, 741–748.
9. Tator, C.H. (2013). Concussions and their consequences: current di- 29. Spirtes, P., Glymour, C., and Scheines, R. (2001). Causation, Pre-
agnosis, management and prevention. CMAJ 185, 975–979. diction, and Search, 2nd ed. The MIT Press: Cambridge, MA.
10. Hazrati, L.N., Tartaglia, M.C., Diamandis, P., Davis, K.D., Green, 30. Koller, D. and Friedman, N. (2009). Probabilistic Graphical Models:
R.E., Wennberg, R., Wong, J.C., Ezerins, L., and Tator, C.H. (2013). Principles and Techniques. The MIT Press: Cambridge, MA.
Absence of chronic traumatic encephalopathy in retired football 31. Pearl, J. (2009). Causality: Models, Reasoning, and Inference, 2nd ed.
players with multiple concussions and neurological symptomatology. Cambridge University Press: Cambridge, MA.
Front. Hum. Neurosci. 7, 222. 32. Silverberg, N.D., Gardner, A.J., Brubacher, J.R., Panenka, W.J., Li,
11. Tator, C.H., Davis, H.S., Dufort, P.A., Tartaglia, M.C., Davis, K.D., J.J., and Iverson, G.L. (2015). Systematic review of multivariable
Ebraheem, A., and Hiploylee, C. (2016). Postconcussion syndrome: prognostic models for mild traumatic brain injury. J. Neurotrauma 32,
demographics and predictors in 221 patients. J. Neurosurg. 125:1206– 517–526.
1216. 33. Lingsma, H.F., Yue, J.K., Maas, A.I., Steyerberg, E.W., and Manley,
12. McCrory, P., Meeuwisse, W.H., Aubry, M., Cantu, B., Dvorak, J., G.T.; TRACK-TBI Investigators. (2015). Outcome prediction after
Echemendia, R.J., Engebretsen, L., Johnston, K., Kutcher, J.S., Raf- mild and complicated mild traumatic brain injury: external validation
tery, M., Sills, A., Benson, B.W., Davis, G.A., Ellenbogen, R.G., of existing models and identification of new predictors using the
Guskiewicz, K., Herring, S.A., Iverson, G.L., Jordan, B.D., Kissick, J., TRACK-TBI pilot study. J. Neurotrauma 32, 83–94.
McCrea, M., McIntosh, A.S., Maddocks, D., Makdissi, M., Purcell, L., 34. Waljas, M., Iverson, G.L., Lange, R.T., Hakulinen, U., Dastidar, P.,
Putukian, M., Schneider, K., Tator, C.H., and Turner, M. (2013). Huhtala, H., Liimatainen, S., Hartikainen, K., and Ohman, J. (2015). A
Consensus statement on concussion in sport: the 4th International prospective biopsychosocial study of the persistent postconcussion
Conference on Concussion in Sport held in Zurich, November 2012. symptoms following mild traumatic brain injury. J. Neurotrauma 32,
Br. J. sports Med. 47, 250–258. 534–547.
13. Benjamini, Y. and Hochberg, Y. (1995). Controlling the false dis- 35. Zhang, H.H. and Lu, W. (2007). Adaptive Lasso for Cox’s propor-
covery rate: a practical and powerful approach to multiple testing. tional hazards model. Biometrika 94, 691–703.
J. R. Stat. Soc. Series B Methodol. 289–300. 36. King, N.S., Crawford, S., Wenden, F.J., Moss, N.E., and Wade, D.T.
14. Jolliffe, I.T. (2002). Principal Component Analysis, 2nd ed. Springer: (1995). The Rivermead Post Concussion Symptoms Questionnaire: a
Berlin. measure of symptoms commonly experienced after head injury and its
15. Bar-Joseph, Z., Gifford, D.K., and Jaakkola, T.S. (2001). Fast optimal reliability. J. Neurol. 242, 587–592.
leaf ordering for hierarchical clustering. Bioinformatics 17 Suppl 1, 37. Wade, D.T., King, N.S., Wenden, F.J., Crawford, S., and Caldwell,
S22–S29. F.E. (1998). Routine follow up after head injury: a second randomised
16. Eisen, M.B., Spellman, P.T., Brown, P.O., and Botstein, D. (1998). controlled trial. J. Neurol. Neurosurg. Psychiatry 65, 177–183.
Cluster analysis and display of genome-wide expression patterns. 38. Iverson, G.L., Brooks, B.L., Ashton, V.L., and Lange, R.T. (2010).
Proc. Natl. Acad. Sci. U.S.A. 95, 14863–14868. Interview versus questionnaire symptom reporting in people with the
17. DeRisi, J.L., Iyer, V.R., and Brown, P.O. (1997). Exploring the met- postconcussion syndrome. J. Head Trauma Rehabil. 25, 23–30.
abolic and genetic control of gene expression on a genomic scale.
Science 278, 680–686. Address correspondence to:
18. Golub, T.R., Slonim, D.K., Tamayo, P., Huard, C., Gaasenbeek, M., Charles H. Tator MD, CM, PhD
Mesirov, J.P., Coller, H., Loh, M.L., Downing, J.R., Caligiuri, M.A., Toronto Western Hospital
Bloomfield, C.D., and Lander, E.S. (1999). Molecular classification of 399 Bathurst Street, Room 4W-422
cancer: class discovery and class prediction by gene expression
monitoring. Science 286, 531–537. Toronto, Ontario, Canada M5T 2S8
19. Caliński, T. and Harabasz, J. (1974). A dendrite method for cluster
analysis. Commun. Stat. 3, 1–27. E-mail: charles.tator@uhn.ca
(Appendices follow/)1520 HIPLOYLEE ET AL.
Appendix A
Postconcussion Questionnaire
Unless otherwise indicated, the following questions pertain to the last concussion that I, Dr. Charles Tator, assessed you for.
1) Do you still have persistent symptoms from the last concussion that I assessed you for on ______________? , yes , no
a) If you recovered completely, how long after the concussion did you recover 100%?
_____ weeks
_____ months
_____ years
b) If you are still symptomatic, which of the following symptoms are still present (check all that apply)?
, Anxiety , Increased sensitivity to alcohol , Panic attacks
,Imbalance , Irritability , Personality changes
, Blurred vision , Insomnia , Pressure in the head
, Difficulty concentrating , Lightheaded , Sadness
, Confusion , Loss of appetite , Seizures
, Dazed , Difficulty remembering recent events , Sensitivity to light
, Depression , Difficulty remembering remote events , Sensitivity to noise
, Disorientation , Feeling ‘‘in a fog’’ , Sleeping too little
, Dizziness , Nausea , Sleeping too much
, ‘‘Don’t feel right’’ , Neck pain , Slurred speech
, Double vision , Numbness , Stomach ache
, Fatigue , Noise in the ears
, Feeling slowed down , Vertigo (spinning or turning sensation)
, Frustration , Vision changes
, Headache , Vivid dreams
, More emotional , Vomiting
, Other: _____________________
2) How long after your concussion did you (only answer the questions that apply to you):
a) Return to work part-time?
_____ weeks
_____ months
_____ years
_____ not yet returned
b) Return to work full-time?
_____ weeks
_____ months
_____ years
_____ not yet returned
c) Return to school part-time?
_____ weeks
_____ months
_____ years
_____ not yet returned
d) Return to school full-time?
_____ weeks
_____ months
_____ years
_____ not yet returned
e) Return to play your sport?
_____ weeks
_____ months
_____ years
_____ not yet returned
3a) What kind of treatments did you try for your concussion? Check all those that you tried.
, Chiropractic manipulation , Psychotherapy , Physiotherapy
, Vestibular repositioning exercises (eg. Epley maneuver) , Medication
, Occupational therapy , Other: ___________________ , Did not try any
b) In your opinion, which treatment(s) was/were effective for your concussion?
, Chiropractic manipulation , Psychotherapy , PhysiotherapyPOSTCONCUSSION SYNDROME 1521
, Vestibular repositioning exercises (e.g., Epley maneuver) , Medication
, Occupational therapy , Other: ___________________ , None
4) For athletes: If I recommended to you not to return to play, did you follow this advice? , yes , no
5) Have you ever had any of the following?
, Migraines
, Before your concussion , After your concussion
, Attention Deficit Disorder (ADD)
, Before your concussion , After your concussion
, Attention Deficit Hyperactivity Disorder (ADHD)
, Before your concussion , After your concussion
, Learning disability
, Before your concussion , After your concussion
, Mononucleosis
, Before your concussion , After your concussion
, Depression
, Before your concussion , After your concussion
Treatment:
, Medication prescribed , Psychotherapy
, Anxiety
, Before your concussion , After your concussion
Treatment:
, Medication prescribed , Psychotherapy
, Other psychiatric disorder / if yes, please specify:
, Before your concussion , After your concussion
6a) Have you ever thought about killing yourself? , yes , no
, Before your concussion , After your concussion
b) Have you ever attempted to kill yourself? , yes , no
, Before your concussion , After your concussion
7) Do you have a family history of any of the following and if so, please indicate the relationship to you of the affected person:
, Migraines / relationship:
, ADD/ADHD / relationship:
, Learning disabilities / relationship:
, Concussions / relationship:
, Depression / relationship:
, Anxiety / relationship:
, Chiari malformation / relationship:
, Arachnoid cysts / relationship:
, Other psychiatric disorder / relationship and specific disorder:
8a) To what extent do you feel your concussion has impacted your life?
, Not at all , A little , A moderate amount , Very much , An extreme amount
b) Do you feel you were limited in the kind or amount of work you can do because of your concussion? , yes , no
c) Do you feel you are still limited in the kind or amount of work you can do because of your concussion? , yes , no
d) Do you feel you were limited in the kind or amount of schooling you can do because of your concussion? , yes , no
e) Do you feel you are still limited in the kind or amount of schooling you can do because of your concussion? , yes , no
9) Have you had any subsequent concussions since your last visit to me?
, yes , no1522 HIPLOYLEE ET AL.
Appendix B
Appendix C
FIG. C1. The proportion of variance explained by each principal component in a Principal component analysis of symptom occur-
rence. Following application of a permutation test, only the first component, explaining 23.9% of the total variance, was statistically
significant at p < 0.0001.POSTCONCUSSION SYNDROME 1523 FIG. C2. Symptom loadings on the one significant principal component. All symptoms had positive loadings in this component except for vomiting, which had a small negative weight of -0.02.
You can also read