Regional Patterns of Gene Expression in Human and Chimpanzee Brains
←
→
Page content transcription
If your browser does not render page correctly, please read the page content below
Article

Regional Patterns of Gene Expression in Human
and Chimpanzee Brains
Philipp Khaitovich,1,7 Bjoern Muetzel,1 Xinwei She,2 Michael Lachmann,1
Ines Hellmann,1 Janko Dietzsch,3 Stephan Steigele,3 Hong-Hai Do,4 Gunter Weiss,1,5
Wolfgang Enard,1 Florian Heissig,1 Thomas Arendt,6 Kay Nieselt-Struwe,3
Evan E. Eichler,2 and Svante Pääbo1
1
 Max-Planck-Institute for Evolutionary Anthropology, D-04103 Leipzig, Germany; 2Department of Genetics, Center for
Computational Genomics, Case Western Reserve University School of Medicine and University Hospitals of Cleveland, Cleveland,
Ohio 44106, USA; 3Center for Bioinformatics Tübingen, University of Tübingen, Sand 14, D-72076 Tuebingen, Germany;
4
 Interdisciplinary Center for Bioinformatics, University of Leipzig, D-04103 Leipzig, Germany; 5WE Informatik, University of
Düsseldorf, Universitätsstrasse 1, D-40225 Düsseldorf, Germany; 6Paul Flechsig Institute for Brain Research, University of Leipzig,
Jahnallee 59, D-04109 Leipzig, Germany

       We have analyzed gene expression in various brain regions of humans and chimpanzees. Within both human and
       chimpanzee individuals, the transcriptomes of the cerebral cortex are very similar to each other and differ more
       between individuals than among regions within an individual. In contrast, the transcriptomes of the cerebral cortex,
       the caudate nucleus, and the cerebellum differ substantially from each other. Between humans and chimpanzees, 10%
       of genes differ in their expression in at least one region of the brain. The majority of these expression differences are
       shared among all brain regions. Whereas genes encoding proteins involved in signal transduction and cell
       differentiation differ significantly between brain regions within individuals, no such pattern is seen between the
       species. However, a subset of genes that show expression differences between humans and chimpanzees are
       distributed nonrandomly across the genome. Furthermore, genes that show an elevated expression level in humans
       are statistically significantly enriched in regions that are recently duplicated in humans.

       [Supplemental material is available online at www.genome.org.]

One of the challenges in the wake of the completion of the hu-               amount of changes on the evolutionary lineage to humans rela-
man genome sequence is to better understand the genetic and                  tive to the amount on the lineage to chimpanzees was higher in
evolutionary background of phenotypic traits that set humans                 the brain than in the liver (Enard et al. 2002). Subsequent re-
apart from our closest evolutionary relatives, the chimpanzees.              analyses of these data have confirmed this as well as pointed out
Such phenotypic traits include aspects of anatomy, locomotion,               that there is an apparent increase in gene expression of many
technology, and communication (Olson and Varki 2003). The                    genes in the human lineage (Gu and Gu 2003). Further reanalyses
draft sequence of the chimpanzee genome will allow most                      of the data have suggested that the acceleration and up-
nucleotide differences between the two species to be listed. How-            regulation of genes in the human lineage are unlikely to be
ever, to interpret these differences in terms of function, an im-            caused by biases resulting from DNA sequence differences be-
portant step is to know how gene expression has changed be-                  tween the species (Hsieh et al. 2003). An independent study us-
tween humans and chimpanzees. Because several important phe-                 ing various samples of the cerebral cortex recently arrived at simi-
notypic differences that distinguish humans and apes are                     lar results (Caceres et al. 2003).
associated with cerebral activity, it is of particular interest to in-             To gain a better understanding of the evolution of the brain
vestigate the gene expression patterns in brains of humans and               transcriptome in humans and chimpanzees, it is necessary to
chimpanzees.                                                                 analyze gene expression in different regions of the brain in mul-
      A first study of the transcriptomes of humans and chimpan-             tiple individuals to gauge to what extent brain regions differ in
zees (Enard et al. 2002) found that although the transcriptomes              gene expression within individuals, between individuals and be-
of the left prefrontal area of the brain as well as the liver vary           tween species. So far, this has only been done in inbred strains of
substantially among individuals within the species, species-                 mice, wherein one study found that the cortex, cerebellum, and
specific changes in expression pattern can be identified. Interest-          the midbrain differ relatively little, whereas the cerebellum was
ingly, although the total amount of gene expression differences              the most unique region of those tested (Sandberg et al. 2000).
is larger in liver than in the prefrontal area of the brain, the             Here, we describe the analysis of gene expression patterns in
                                                                             several regions within the human brain as well as in homologous
                                                                             regions of the brains of chimpanzees. We put the differences
7
                                                                             found within individuals in relation to those seen between
 Corresponding author.
E-MAIL khaitovich@eva.mpg.de; FAX 49-341-3550-555.                           individuals and between the species as well as to genomic
Article and publication date are at http://www.genome.org/cgi/doi/10.1101/   features such as segmental duplications and chromosomal
gr.2538704.                                                                  rearrangements.

1462      Genome Research                                14:1462–1473 ©2004 by Cold Spring Harbor Laboratory Press ISSN 1088-9051/04; www.genome.org
             www.genome.org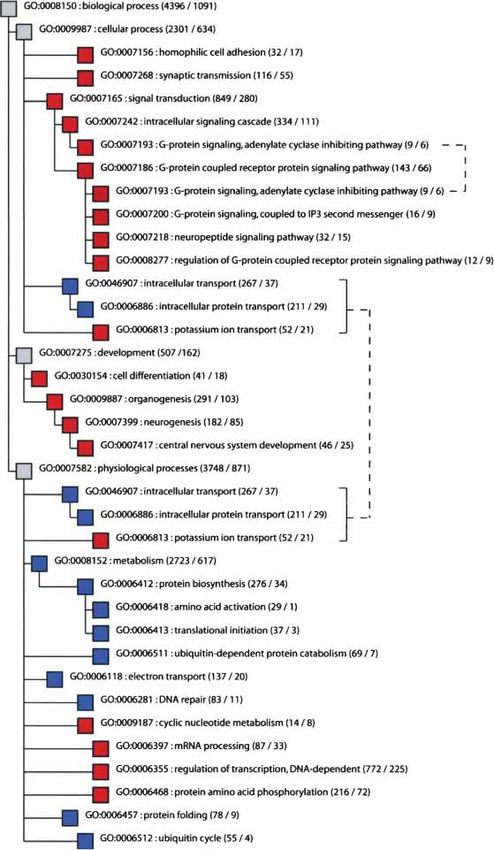
Gene Expression in Primate Brain
RESULTS molog in the right hemisphere in humans. Because the number
of differences seen between independent experimental replicates
Patterns of Gene Expression Within Human of the same region of the brain in the same individual is one to
and Chimpanzee Brains two (data not shown), this means that we cannot reliably detect
Four regions of the cerebral cortex (dorsolateral prefrontal cortex, any differences among the transcriptomes of these regions. In
anterior cingulate cortex, primary visual cortex, Broca’s area), the contrast, ∼500–600 genes differ in expression level between the
central part of the cerebellum (Vermis cerebelli), and the caudate caudate nucleus and the regions of the cerebral cortex in both
nucleus were dissected in three adult male humans and three species, whereas ∼1400 genes differ between the cerebellum and
adult male chimpanzees (Fig. 1). In addition, the premotor cortex the other brain regions in humans and ∼1200 in chimpanzees.
and the area homologous to Broca’s area in the right hemisphere
were isolated from three humans. Region-Specific Expression Differences
Total RNA from each sample was isolated, labeled, and hy- Next, we determined if genes with expression patterns specific to
bridized to Affymetrix oligonucleotide arrays containing probes a brain region in one species also display such specificity in the
to ∼10,000 human genes. All reliably measured expression differ- other species. In Figure 3A, it can be seen that 473 genes show no
ences within the species were summarized for each pairwise com- difference in expression level among the four cerebral cortex re-
parison and visualized in a multidimensional scaling plot for gions but differ in their expression from both the caudate
humans (Fig. 2A) and chimpanzees (Fig. 2C). Although the dif- nucleus and the cerebellum within all three humans and/or all
ferences among the individuals are substantial, the caudate three chimpanzees. Of these genes, 22 genes (4.6%) show a dif-
nucleus, the cerebellum, and the cerebral cortex regions are ference in either humans or chimpanzees but not in the other
clearly differentiated in one dimension of the plot. In contrast, species. For the caudate nucleus, 255 genes differ in one or both
all regions of the cerebral cortex group together according to the of the species, and three of these (1.2%) differ in only one species.
individual from which they derive rather than according to the For the cerebellum, the corresponding numbers of genes are 749
respective regions. This effect is particularly pronounced in hu- and 19 (2.5%), respectively. Thus, it appears that relatively more
mans, but also apparent in chimpanzees when the caudate genes show species-specific expression patterns in the cerebral
nucleus and cerebellum are excluded from the analysis (Fig. cortex than in the caudate nucleus or the cerebellum (p = 0.017
2B,D). When the expression differences within the brain are and 0.05, respectively, Fisher’s exact test).
compared in the two species, the distance between the cerebel- To investigate if this is the case, we used the full set of five
lum and each of the other five brain regions studied is found to Affymetrix arrays that together allow the expression levels of
be slightly but significantly greater in humans than in chimpan- ∼40,000 transcripts to be determined to study Broca’s area, the
zees (p = 0.015 for Broca’s area, p = 0.009 for prefrontal cortex, cingulate cortex, the caudate nucleus, and the cerebellum in hu-
p = 0.034 for primary visual cortex, p = 0.025 for anterior cingu- mans and chimpanzees. Figure 3B shows that 29 and 25 genes are
late cortex, and p = 0.018 for caudate nucleus, Student’s t-tests), specific to Broca’s area and the cingulate cortex, respectively, in
but no significant differences are seen for any other pairs of re- either humans or chimpanzees or in both species. Of these, five
gions (p > 0.05). and seven, or 17% and 28%, respectively, show specificity in only
Another way to gauge the difference in gene expression one of the two species. For the caudate nucleus and cerebellum,
within the brain is to determine the number of genes that differ 794 and 2962 genes are specific to the respective regions in one
significantly in expression between brain regions in all three in- or the other species, and nine and 72 genes, or 1.1% and 2.4%, in
dividuals within a species (Table 1). In the cerebral cortex, the one species and not the other, respectively. Thus, the cerebral
biggest difference in gene expression is between the primary vi- cortex differs from the other two regions of the brain in that a
sual cortex and the anterior cingulate cortex in both humans and larger proportion of genes show region-specific expression pat-
chimpanzees, where 193 and 227 genes differ in expression in terns that differ between the two species.
humans and chimpanzees, respectively. Many fewer differences
are found among the other regions of the cortex. For example, Functional Differences Among Brain Regions
only one gene out of the 4998 genes with detectable expression We used the categories defined by the Gene Ontology (GO) Con-
differs in expression between Broca’s area and the left prefrontal sortium (Ashburner et al. 2000) to investigate whether genes dif-
cortex in all three humans analyzed and none in chimpanzees. ferentially expressed among brain regions are over- or underrep-
Similarly, only four genes differ between Broca’s area and its ho- resented in particular functional groups. First, we investigated
the 3817 genes that were differentially ex-
pressed among two cerebral cortex regions,
the caudate nucleus and cerebellum, in all
three individuals of one or both species (Fig.
3B). GO provides three functional taxono-
mies of genes: “cellular component,” “bio-
logical process,” and “molecular function.”
To determine if the distribution of differen-
tially expressed genes across the functional
groups within each taxonomy differs sig-
nificantly from the distribution of detected
genes, the sum of the 2 distances between
the two distributions was calculated and
compared with the sums calculated
Figure 1 Location of areas sampled from the human cerebral cortex. The size of the marked areas for 10,000 sets of genes randomly selected
corresponds approximately to the size of the dissected tissue sample. The sample from the right
from all genes with detectable expres-
hemisphere (not shown) was taken from the location that mirrors the location of Broca’s area. The
human brain pictures are reprinted with permission from the Digital Anatomist Project, Depart- sion. According to this criterion, all three
ment of Biological Structure, University of Washington © 1998 (http://www9.biostr.washington. taxonomies were significantly changed
edu/da.html). (p < 0.0001).
Genome Research 1463
www.genome.org
Khaitovich et al.

Figure 2 Multidimensional scaling plots of gene expression differences identified within species. The colors refer to individuals. (A) Expression
differences in humans. (B) Expression differences within the human cerebral cortex. (A) Broca’s area; (B) homolog of Broca’s area in the right
hemisphere; (C) prefrontal cortex; (D) premotor cortex; (E) primary visual cortex; (F) anterior cingulate cortex. (C) Expression differences in chimpan-
zees. (D) Expression differences within the chimpanzee cerebral cortex. Labels as in (B).

     Single functional groups that contain significantly more, or             lation, whereas out of eight conserved groups of genes, six are
significantly fewer, differentially expressed genes than expected             involved in protein synthesis and turn-over. The taxonomy “cel-
from a hypergeometric distribution were identified within each                lular component” contains seven groups that are significantly
GO taxonomy (Supplemental Table 1). In the taxonomy “bio-                     changed among brain regions, four of which are associated with
logical process” (Fig. 4), 18 groups of genes contain a significant           vesicles and membranes, whereas the 13 groups of genes that are
excess of expression differences between brain regions, and 12 of             significantly conserved encode intracellular gene products. Thus,
these are associated with neuronal function, differentiation, and             among brain regions, genes whose products are involved in sig-
development in a broad sense: Eight groups are involved in syn-               nal transduction and neurogenesis are significantly more
aptic transmission and signal transduction, and four are involved             changed with respect to their expression than other groups of
in cell differentiation, neurogenesis, and development, whereas               genes. In contrast, genes involved in protein synthesis and turn-
one group each contains genes involved in protein phosphory-                  over are significantly conserved when different regions of the
lation, ion transport, and cyclic nucleotide metabolism, respec-              brain are compared.
tively. In contrast, of the 11 groups of genes that are significantly              We used the same approach to determine whether particular
conserved in their expression, eight are involved in protein me-              functional groups of genes are over- or underrepresented among
tabolism and transport in a broad sense. Similarly, in the tax-               389 genes that were differentially expressed between any two
onomy “molecular function,” of 22 groups with an excess of                    cerebral cortex regions in all three humans and/or all three chim-
differentially expressed genes, 19 are involved in signal transduc-           panzees. Although much fewer genes are considered, the distri-
tion, ion transport, and regulation of phosphorylation or sulfory-            bution of differentially expressed genes across the functional

 Table 1. Number of Gene Expression Differences Between the Brain Regions

                                                 Humans                                                              Chimpanzees

 Region          B          BR          PFC        PMC         PVC         ACC         CN           B         PFC         PVC        ACC         CN

 BR               4
 PFC              1           5                                                                         0
 PMC             23           3          38
 PVC             21          77          37          23                                            130         114
 ACC             40          42          29         158         193                                  5          17        227
 CN             473         598         493         560         485        594                     601         557        710         548
 CB            1327        1423        1414        1332        1017       1453        1601        1181        1205        892        1224       1320

 (B) Broca’s area; (BR) the homologous area to Broca’s area in the right hemisphere; (PFC) prefrontal cortex; (PMC) premotor cortex; (PVC) primary
 visual cortex; (ACC) anterior cingulate cortex; (CN) caudate nucleus; (CB) cerebellum.

1464      Genome Research
            www.genome.org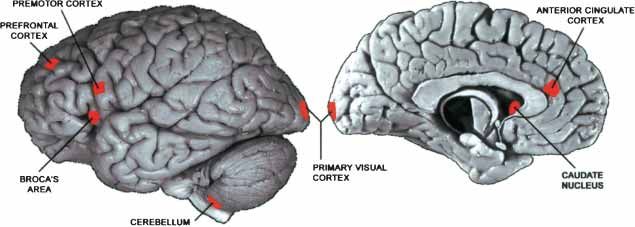
Gene Expression in Primate Brain
this may influence the results by using 262
chimpanzee transcripts for which the com-
plete target sequences used for the hybrid-
izations are known. The results (see Meth-
ods) indicate that ∼22% of the genes that
show differential expression between hu-
mans and chimpanzees may do so because
of nucleotide sequence differences between
the species. A similar proportion of expres-
sion differences was suggested to be due to
the differences in nucleotide sequence in
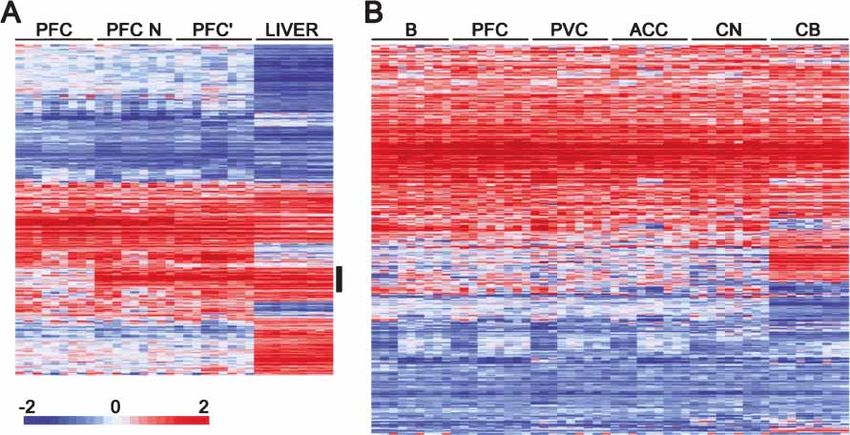
Figure 3 Number of genes exhibiting expression patterns specific to brain regions in humans and
chimpanzees. (A) Genes with region-specific expression among the cerebral cortex (CX), the other studies of gene expression in humans
caudate nucleus (CN), and cerebellum (CB). Genes with expression specific for the cerebral cortex and chimpanzees using oligonucleotide-
were defined as not showing any significant difference among the four cerebral cortex regions but based microarrays (Caceres et al. 2003; Kara-
significant differences to both the caudate nucleus and the cerebellum in at least one of these four man et al. 2003).
regions. The numbers of genes with correlation coefficients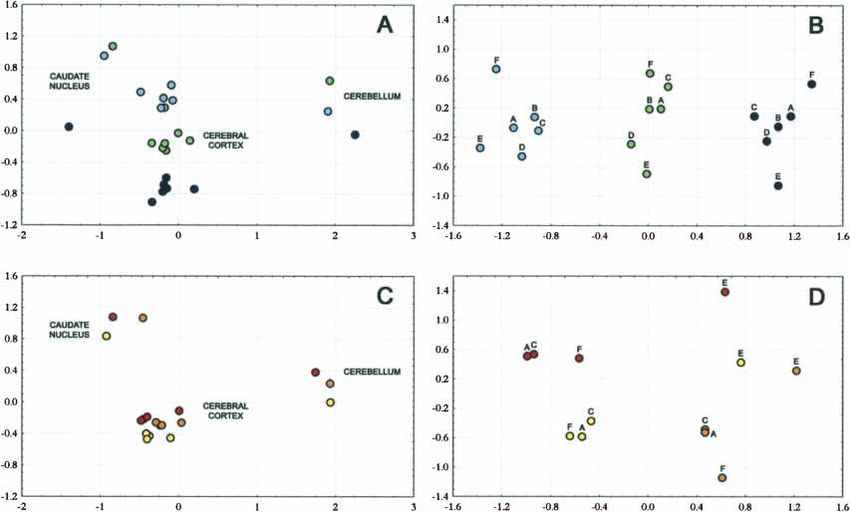
Khaitovich et al.
can be used to verify Affymetrix data (Lee et
al. 2003). Out of 175 genes classified as dif-
ferentially expressed between humans and
chimpanzees in prefrontal cortex using Af-
fymetrix arrays, 54 were present on the
cDNA arrays. Out of these, 40 (74%)
changed significantly between humans and
chimpanzees (Student’s t-test, p < 0.05). The
proportion of verified genes thus agrees well
with other studies using the same approach
(Caceres et al. 2003; Lee et al. 2003).
Functional Differences Between
Humans and Chimpanzees
We tested whether the 2014 genes that are
differentially expressed between humans
and chimpanzees are differently distributed
among functional GO groups than the
18,522 genes with detectable expression in
at least one species. None of the three GO
taxonomies “biological process” (p = 0.12),
“cellular component” (p = 0.68), and “mo-
lecular function” (p = 0.18) showed any sig-
nificant difference between the two distri-
butions.
Genomic Localization and
Segmental Duplications
To determine the genomic localization of
genes that differ in expression between hu-
mans and chimpanzees, we mapped all
genes present on the full set of arrays to the
human genome. The ratio of differentially
expressed to detected genes varied among
the chromosomes, ranging from 9.4% on
Chromosome 19 to 17.3% on Chromosome
9 (Table 3). Using a sliding window of 21
genes with detected expression, we deter-
mined the distribution of genes differen-
tially expressed between humans and chim-
panzees along the chromosomes (Fig. 6). To
assess if the observed distribution deviates
from what may be expected by chance, we
compared it with 1,500,000 permutations
of the assignments of expression differences
among the detected genes (data not
shown). The observed distribution differs
significantly from the simulated one with
Figure 4 Groups of genes that show significant excess or significant lack of gene expression an excess of windows having both more
differences among brain regions in the GO taxonomy “biological process.” Red indicates significant
and less differentially expressed genes than
excess of differentially expressed genes, and blue indicates significant lack of expression differences.
Numbers of detected and differentially expressed genes in a group are shown in parentheses. expected (Table 4). We repeated using sliding
Brackets to the right indicate cases in which the same functional group occurs multiple times in the windows containing 11, 31, and 41 genes; the
tree. distributions of differentially expressed genes
were similarly found to differ from what is
expected by chance (data not shown). Thus,
sulted in a set of 3838 genes that could be reliably detected in genes that differ in their expression between humans and chim-
either one or both species in at least one of the six brain regions panzees are nonrandomly distributed over the genome.
with eight or more oligonucleotide probes. In this case, 406 genes We furthermore analyzed whether expression differences
(10.6%) were differentially expressed between the species, and between humans and chimpanzees are associated with genomic
79% showed the same expression pattern difference in all six regions enriched for segmental duplications, that is, the 5% of
brain regions analyzed (data not shown). In addition, we com- the human genome that occurs as two or more copies with >90%
pared the data collected using Affymetrix arrays with data col- similarity to each other (Bailey et al. 2001, 2002). Table 5 shows
lected by spotted cDNA arrays for six human and five chimpan- that segmental duplications are significantly overrepresented
zee prefrontal cortex samples (P. Khaitovich, unpubl.). Because among genes differentially expressed between humans and
cDNA arrays have different sources of experimental error, they chimpanzees (p < 0.05, Fisher exact test). When the segmental
1466 Genome Research
www.genome.orgGene Expression in Primate Brain
Figure 5 Gene expression differences between humans and chimpanzees. (A) Hierarchical clustering of expression differences between humans and
chimpanzees in the prefrontal cortex in the current data set with (PFC) and without (PFC N) masking of the sequence differences between the species
and previously published prefrontal cortex (PFC⬘) and liver data (Enard et al. 2002). All genes differentially expressed in at least one tissue and detected
in the other one are shown. The vertical black bar indicates the cluster of expression differences that disappears after the masking procedure. (B)
Hierarchical clustering of genes classified as differentially expressed between humans and chimpanzees in at least one out of six studied brain regions.
Each row represents a gene and each column represents a pairwise comparison between one human and one chimpanzee in a given tissue. The
magnitude of expression differences is shown as the base two logarithm of the ratio of the gene expression level in humans to the one in chimpanzees.
Higher expression in humans is shown in red and higher expression in chimpanzees in blue, with color intensity being proportional to the magnitude
of the expression difference as indicated by the color bar at the bottom of the figure. (B) Broca’s area; (PFC) prefrontal cortex; (PVC) primary visual cortex;
(ACC) anterior cingulate cortex; (CN) caudate nucleus; and (CB) cerebellum.
duplications are divided into those with 90%–95%, 95%–98%, DISCUSSION
and 98%–100% sequence similarity, the overrepresentation is
significant in all cases but increases with increasing sequence Region-Specific Gene Expression
similarity. The most extreme overrepresentation of differentially Gene expression as measured from tissue samples reflects cellular
expressed genes is observed among the duplications that are RNA levels as well as cellular composition of the tissues. Because
>98% identical, in which nearly 25% of all duplications that discrete regions within the brain have different motoric, sensory,
harbor genes show significant differences in gene expression. and cognitive functions, it is of interest to explore to what extent
When genes were further subdivided according to whether they differences in gene expression can be detected between function-
are more highly expressed in chimpanzee or in humans, the ally different brain regions. The results show that the cerebellum
overrepresentation of duplicated genes is significant only for the differs the most from the other regions. Similar observations
genes that are more highly expressed in humans and not for have been previously reported in inbred strains of mouse (Sand-
those that are more highly expressed in chimpanzees (Table 5). berg et al. 2000). The caudate nucleus also differs to a substantial
degree from other brain regions analyzed,
whereas various regions of the cerebral cortex
differ little from each other. Notably, the cer-
Table 2. Gene Expression Differences Between Humans and Chimpanzees
ebellum is the only part of the brain that shows
a greater distance to the other regions in hu-
U95A array U95A-E arrays mans than in chimpanzees.
Within the cerebral cortex, we find the
Region Detected Changed % Detected Changed % biggest difference in gene expression between
the anterior cingulated cortex and the primary
B 4726 143 3 13716 685 5
PFC 4943 175 3.5
visual and primary motor cortex areas (Table
PVC 4820 148 3.1 1). Interestingly, there are much fewer differ-
ACC 5001 157 3.1 14081 636 4.5 ences between the two primary areas, despite
CN 4828 157 3.3 13693 735 5.4 substantial differences in function and cytoar-
CB 4915 268 5.5 15233 1186 7.8 chitecture (Kandel et al. 2000). We are unable
Combined 5839 528 9 18516 1945 10.5 to identify any significant expression differ-
ences between Broca’s area located in the left
(B) Broca’s area; (PFC) prefrontal cortex; (PVC) primary visual cortex; (ACC) anterior cin-
frontal lobe, which is associated with speech
gulate cortex; (CN) caudate nucleus; (CB) cerebellum.
production, and the corresponding area in the
Genome Research 1467
www.genome.orgKhaitovich et al.
Differences Between Individuals
Table 3. Distribution of Expression Differences Among
Human Chromosomes When gene expression differences of the cerebral cortex are ana-
lyzed between individuals (Fig. 2B,D), it becomes clear that the
Number of genes transcriptomes of the different cortex regions are more similar
within individuals than between individuals. This may have sev-
Chromosome Detected Changed % changed
eral causes. One possibility is that it reflects individual differ-
Chr. 19 715 67 9.4
ences in how the cerebral cortex is formed during fetal life. This
Chr. 21 146 14 9.6 process involves large numbers of migrations of cells and forma-
Chr. X 464 46 9.9 tion of connections between them that cannot be genetically
Chr. 20 343 38 11.1 predetermined but has to involve stochastic or epigenetic events
Chr. 11 758 87 11.5 that will differ from individual to individual. However, it is also
Chr. 14 471 55 11.7 possible that it reflects responses of different individuals to en-
Chr. 10 577 70 12.1
Chr. 12 760 92 12.1 vironmental or physiological differences throughout life or im-
Chr. 17 712 87 12.2 mediately before death. Only the systematic study of a larger
Chr. 18 242 30 12.4 number of individuals will be able to resolve the basis for the
Chr. Y 8 1 12.5 interindividual differentiation of the cerebral cortex.
Chr. 1 1348 177 13.1 It is noteworthy that regions of the cerebral cortex differ
Chr. 3 870 114 13.1
approximately twofold more among the humans than among
Chr. 16 567 76 13.4
Chr. 4 585 79 13.5 the chimpanzees. Because this is not true for the caudate nucleus
Chr. 8 560 76 13.6 and the cerebellum, this is unlikely to be caused by undetected
Chr. 2 1023 141 13.8 differences in RNA quality or to post mortem conditions affect-
Chr. 6 712 99 13.9 ing the brain as a whole. It is not likely to be caused by differ-
Chr. 7 678 95 14 ences in the amount of DNA sequence variation within the spe-
Chr. 22 295 43 14.6
Chr. 5 747 112 15
cies because chimpanzees carry on average more DNA sequence
Chr. 15 479 73 15.2 differences between individuals than humans (Kaessmann et al.
Chr. 13 293 47 16 1999). A possible explanation is that the cerebral cortex may be
Chr. 9 560 97 17.3 more influenced by environmental and physiological conditions
than the other brain regions and that the humans differ more
Shading indicates chromosomes containing rearrangements between than the chimpanzees in living conditions. This is compatible
humans and chimpanzees. with the fact that genes highly variable among humans are in-
volved in cell–cell signaling and cell adhesion (data not shown).
Alternatively, there might be more individual differences in how
the cerebral cortex is formed in humans than in chimpanzees,
because in humans the myelinization of parts of the cortex is
right hemisphere, nor between Broca’s area and the left prefron- finalized only in the late teens, whereas it is finished earlier in
tal cortex. In fact, the transcriptomes of the prefrontal cortex, chimpanzees. Interestingly, when the between-individual varia-
Broca’s area, the anterior cingulate cortex, and the primary visual tion of expression levels is compared in humans and in chim-
cortex differ less within individuals than each of these regions panzees, the same genes tend to vary between individuals in both
differ between the three individuals (Fig. 2B). Thus, we conclude species (data not shown). Further studies may clarify whether
that no major change in expression pattern occurred in Broca’s this reflects responses to environmental stimuli or simply a lack
area resulting from the acquisition of language in humans. How- of regulatory constraints.
ever, it should be noted that the tissue samples analyzed repre-
sent a complex mixture of different cell types and that we are
therefore not able to detect expression differences confined to a Evolution of Brain Transcriptomes
small proportion of cells. This problem is particularly pro- The overwhelming majority of gene expression differences be-
nounced for cerebral cortex samples because of their more het- tween humans and chimpanzees are found in all regions studied.
erogeneous cellular composition compared with caudate nucleus Thus, the overall gene expression patterns are very similar within
or cerebellum. It is therefore possible that gene expression the human and the chimpanzee brain. The only exceptions are
changes in certain cells may have been involved in language the larger differentiation of the cerebellum relative to other parts
acquisition. Detailed studies of gene expression in isolated cells of the brain both within human individuals and between the
may eventually reveal this. species, and the larger differentiation of the cerebral cortex be-
It may seem surprising that some cerebral cortex regions tween individuals in humans. This general picture agrees with
show little or no difference in terms of gene expression although the notion that when human-specific cognitive abilities arose,
they differ considerably in function (Kandel et al. 2000). In this they recruited pre-existing brain structures that already carried
regard, it is of interest that the main groups of genes that differ the appropriate cytoarchitecture as well as underlying molecular
between cerebellum, caudate nucleus, and the cerebral cortex as functions for the novel functions.
well as between regions of the cortex are involved in signal trans- Two previous studies have compared gene expression pro-
duction. Accordingly, changes of gene expression programs in- files in brains of humans and chimpanzees (Enard et al. 2002;
volved in signal transduction could also be involved when dif- Caceres et al. 2003). One study used samples from the prefrontal
ferent regions of the cerebral cortex acquire the functions of cortex, whereas the other used different cortical regions in dif-
other regions, sometimes even during adult life, as a consequence ferent individuals. The data of both studies suggest that more
of brain damage (Finger and Stein 1982), blindness (Sadato et al. genes are up-regulated than down-regulated in humans relative
1996), or redirection of sensory inputs (von Melchner et al. to chimpanzees than vice versa (Caceres et al. 2003; Gu and Gu
2000). It will be extremely interesting to elucidate if such changes 2003). The same phenomenon is seen here: Out of 2014 genes
in function result in changes in gene expression similar to the differentially expressed between the species, 1270 genes are more
ones identified here. highly expressed in humans than in chimpanzees, whereas 744
1468 Genome Research
www.genome.orgGene Expression in Primate Brain
Figure 6 Distribution of gene expression differences between human and chimpanzee brains across the human genome. The profile over each
chromosome shows the proportion of the differentially expressed genes in sliding windows containing 21 detected genes. Red horizontal lines indicate
5% significance cutoff. Red vertical bars indicate cytological bands to which the breakpoints of chromosomal rearrangements between humans and
chimpanzees have been mapped (Yunis and Prakash 1982).
are more highly expressed in chimpanzees (p Ⰶ 0.001). The most noted that when the analysis is confined to the 406 differentially
trivial explanation for this would be that the array oligonucleo- expressed genes for which the chimpanzee DNA sequence is
tides are designed according to human gene sequences and that known, 207 are more highly expressed in humans and 199 in
thus they fit less well to chimpanzee genes. This would lead to a chimpanzees. Thus, although the up-regulation of genes on the
systematic bias in which human genes would seem to be more human lineage may be real, further work is needed to verify it.
highly expressed than chimpanzee genes. Because oligonucleo- This might be done using cDNA arrays that are less sensitive to
tides that show inconsistent hybridization patterns are removed DNA sequence changes or, alternatively, with arrays designed
here, this is unlikely to be the explanation. This said, it should be based on chimpanzee genes.
Another observation from previous studies is that propor-
tionally more genes have changed in the human lineage than in
the chimpanzee lineage and that this acceleration in transcrip-
Table 4. Distribution of Gene Expression Differences Between
Humans and Chimpanzees Across the Human Genome tome change is specific to the brain (Enard et al. 2002; Caceres et
al. 2003). Because samples from different regions of orangutans
Number of windows are not available and the rhesus macaque carries too many se-
Changed quence differences to be reliably analyzed to the human oligo-
genes Observed Simulated mean p-value
nucleotide arrays (M. Lachmann, unpubl.), we are not able to
analyze this effect for these samples. Future work using arrays
0/21 1024 705Khaitovich et al.
Table 5. Association Between Segmental Duplications and Gene Expression Differences
Expressed genes Differently expressed genes Higher in humans Higher in chimpanzees
a b
Duplications Detected % Detected % p-value Detected % p-value Detected % p-value
90%–95% 663 3.6 7.4 3.7 0.049 51 4.1 0.043 23 3.1 0.064
95%–98% 448 2.4 59 3.0 0.024 37 3.0 0.039 22 2.9 0.063
98%–100% 483 2.6 120 6.0Gene Expression in Primate Brain
Multidimensional Scaling encompass the target sequences for all 16 oligonucleotides used
to measure the expression of transcripts on the Affymetrix arrays.
The sum of the absolute values of the “signal log ratios” for all
Whenever a substitutional or indel difference between humans
genes was calculated for all possible pairwise comparisons among
and chimpanzees was observed in a target sequence, that oligo-
all human and all chimpanzee tissue samples. In each compari-
nucleotide was deleted from the analysis. In total, 940 out of
son, if a given gene was not reliably detected on both arrays
4192 oligonucleotides were deleted such that each gene was de-
(detection p-value ⱖ0.06) or did not show a significant change in
tected by an average 12.4 oligonucleotides (range: 0 to 16). The
expression (change p-value 0.003–0.997), the “signal log ratio”
number of interspecies expression differences found with the 262
was set to zero. The sum was normalized to the number of genes
genes was 21. When we deleted 940 randomly chosen oligo-
reliably detected on at least one of the arrays in each pairwise
nucleotides having the same distribution among the genes as the
comparison. The stress values for the plots shown in Figure 2 are
deleted oligonucleotides with sequence differences, 27 expres-
0.071, 0.063, 0.045, and 0.102, respectively.
sion differences were seen. Thus, ∼22% of the genes classified as
differentially expressed between humans and chimpanzees are
Differences Between the Brain Regions caused by nucleotide sequence differences between the species.
Genes differentially expressed between brain regions were deter-
mined using comparisons within each individual according to
the following criteria: (1) The gene had to be reliably detected in Eliminating Influence of Sequence Differences Between
one of the regions in all three individuals from a species (detec-
tion p-value ⱕ0.05). (2) The gene had to show a significant
Humans and Chimpanzees
change in expression in the same direction in all three compari- We used two approaches to eliminate oligonucleotide probes on
sons (change p-value [two-tailed] ⱕ0.05 or ⱖ0.95). (3) The “signal the Affymetrix arrays that may not hybridize equally well to hu-
log ratio” in all three comparisons had to be ⱖ0.5 or ⱕⳮ0.5. man and chimpanzee transcripts. In the first approach, we used
These criteria were set up using three sets of duplicate experi- available chimpanzee sequence information to exclude all oligo-
ments, each consisting of two independently prepared and hy- nucleotide probes that do not match perfectly between humans
bridized probes of the same brain region for three individuals. and chimpanzees. To do this, we downloaded all publicly avail-
The first set of duplicates was Broca’s regions from the three able chimpanzee sequences from GenBank (02/03). Using BLAT
human samples used in this project. The other two sets consisted (Kent 2002), we matched chimpanzee sequences with Affymetrix
of replicates for the prefrontal cortex region for three humans target sequences containing the 16 oligonucleotide probes
and three chimpanzees, respectively, previously analyzed (Enard (NetAFFX; http://www.affymetrix.com/analysis/download_
et al. 2002). For these data sets, we found two, one, and two center.affx), requiring at least 95% sequence identity. Target se-
false-positive genes, respectively (out of ∼12,600 tested), that sat- quences with more than 20 BLAT matches to the chimpanzee
isfied the above criteria. sequence were excluded, and for the remaining ones the best
match was accepted. We then identified all oligonucleotide
Differences Between the Species probes within target sequences that matched the chimpanzee
sequence perfectly. These probes were used for the analysis while
Gene expression levels were compared in each brain region sepa- the rest were masked.
rately in all nine possible pairwise comparisons among the three In the second approach, we identified and masked the oli-
individuals of each species. The criteria used were the same as for gonucleotide probes that differ in their binding characteristics
the comparisons between the brain regions within individuals between humans and chimpanzees as described in Lachmann et
except that the “signal log ratio” had to be ⱖ0.2 or ⱕⳮ0.2 in all al. (M. Lachmann, I. Hellmann, H. Boris, P. Khaitovich, in prep.).
nine comparisons. These criteria were set up to ensure a number Briefly, we first estimated the relative binding efficiency for each
of false positives similar to the ones seen within species as de- probe in the probe set by comparing the signal intensity of this
scribed above. Thus, with these criteria, we find one, zero, and probe to the intensities of all other probes within a probe set.
one false positives, respectively, in the three sets of duplicates. Then we compared the calculated binding efficiencies of the
Note that although the minimal “signal log ratio” difference of probes between all human and all chimpanzee samples using a
0.2 corresponds to a “fold change” of only ∼1.15, the average t-test. If the binding efficiency of a probe differed significantly
“fold change” is higher than the minimal threshold because this between human and chimpanzee samples (p < 0.001), the probe
cutoff was used for all nine comparisons. In addition, we used was masked. Note that this algorithm does not allow the identi-
more stringent selection criterion where “signal log ratio” had to fication of genes with deletions or duplications that span the
be ⱖ0.5 or ⱕⳮ0.5 in all nine comparisons. The use of more probe selection region in chimpanzees.
stringent criteria did not affect the results (data not shown).
Estimating the Effect of Intraspecific Variation Functional Annotation
in Gene Expression To functionally annotate the probe sets on the Affymetrix HG
To evaluate to what extent three human and three chimpanzee U95 arrays, we integrated information from four public data-
individuals are enough to gauge interspecies gene expression dif- bases: Affymetrix NetAffx (http://www.affymetrix.com; Novem-
ferences, we randomized the expression measurements for all ber 2003 release), UniGene (http://www.ncbi.nlm.nih.gov/
genes with respect to the individual (irrespective of species affili- UniGene/; Build 163), LocusLink (ftp://ftp.ncbi.nih.gov/refseq/
ation) in which it occurred for each of the six brain regions. For LocusLink; release from 11/2003, Built LL3_031115), and
54 such data sets, we found on average 14 genes (range: 0 to 92) GeneOntology (GO; http://www.godatabase.org/dev/database/
that differed significantly between the two groups of three indi- archive; November 2003 release). Relevant information from
viduals in all nine possible comparisons. Because on average 302 these databases was downloaded and stored locally in a relational
differences (range: 275 to 378) are found in the nonrandomized MySQL database. First, the Affymetrix probe sets were linked to
data, ∼5% of the observed differences between the species are the corresponding UniGene clusters using GenBank accession
expected to be caused by the variation among individuals within numbers provided by NetAffx. When a single UniGene cluster
the two species. was represented by multiple probe sets, the cluster was classified
as detected if at least one probe set was detected and classified as
Estimating the Effect of Interspecific DNA differentially expressed if at least one probe set was differentially
expressed. Second, the UniGene clusters were assigned to genes
Sequence Differences and their GO annotations from each of the three GO taxonomies
To test to what extent nucleotide sequence differences between (“molecular function,” “biological process,” and “cellular com-
humans and chimpanzees may influence the results, we ex- ponent”) using LocusLink. Note that a gene belongs to its as-
tracted all 262 genes from the available chimpanzee data that signed GO group as well as all higher groups in the taxonomy.
Genome Research 1471
www.genome.orgKhaitovich et al.
To assess if the overall distribution of differentially ex- Segmental Duplications and Gene Expression Differences
pressed genes across the groups in a GO taxonomy differs sig- Segmental duplication content was assessed based on analyses of
nificantly from the distribution of all detected genes, we com- the human genome reference sequence. Two complementary de-
pared it with 10,000 random sets in which the same number tection strategies were used. A BLAST-based detection scheme
of differentially expressed genes was randomly drawn from was used to identify all pairwise similarities representing dupli-
the annotated detected genes. For each of the 10,000 random cated regions (ⱖ1 kb and ⱖ90% identity) within the finished
sets as well as for the observed data, a 2 distance (dt) was cal-
human genome sequence (Bailey et al. 2001). Highly identical
culated for each group in the GO taxonomy according to the
duplications were then confirmed by a second detection strategy
formula:
that assays for excess random-read coverage across the genome
共xt − nqt兲2 (Bailey et al. 2002). Each oligonucleotide used in the microarray
dt = expression studies was individually mapped and the duplication
nqt and unique sequence content determined. A gene was considered
where xt is the number of differentially expressed genes in the duplicated if at least one oligonucleotide mapped to duplicated
group t, nt is the number of detected genes in group t, and q is the sequence in this analysis. A total of 18,340 genes could be un-
ratio of all differentially expressed genes to all detected genes. ambiguously mapped to build 34, of which 1999 (10.9%) were
The overall distance was calculated as the sum of the 2 distances scored as duplicated.
in a given GO taxonomy. p-values were calculated as the propor-
tion of random sets with a distance greater than or equal to the ACKNOWLEDGMENTS
observed distances. We thank A. Sajantila for help in collection of the human brain
We used the hypergeometric distribution to test if indi- samples; R. Bontrop, W. Collignon, W. Scheffrahn, and G. An-
vidual functional groups contain a significantly higher or lower zenberger for help in collection of the chimpanzee brain samples;
number of differentially expressed genes than expected from the K. Bauer for help in sample dissection; S. Ptak for help with sta-
number of detected genes. We calculated the number of signifi- tistical analysis; and M. Przeworski and M. Hofreiter for critical
cant groups in the observed data and in 10,000 random sets of reading of the manuscript and many helpful discussions. We are
detected genes at the 1% significance level. We did not correct for indebted to the Bundesministerium für Bildung und Forschung
multiple tests, because the global tests already suggested a sig- and the Max Planck Society for financial support.
nificant deviation and we were interested in identifying the The publication costs of this article were defrayed in part by
groups responsible for this. The percentage of false positives was payment of page charges. This article must therefore be hereby
estimated from the ratio of the number of significant groups in marked “advertisement” in accordance with 18 USC section 1734
the observed data to the average number of the significant groups solely to indicate this fact.
in 10,000 random sets. In comparisons between the brain re-
gions, we expect 11%, 45% (at 5% significance level), and 7%
false positives for the groups with significant excess and 9%, 2%, REFERENCES
and 8% false positives for the groups with significant lack of Ashburner, M., Ball, C.A., Blake, J.A., Botstein, D., Butler, H., Cherry,
expression differences in the taxonomies “biological process,” J.M., Davis, A.P., Dolinski, K., Dwight, S.S., Eppig, J.T., et al. 2000.
“cellular component,” and “molecular function,” respectively. In Gene ontology: Tool for the unification of biology. The Gene
comparisons between the cerebral cortex regions, we expect 13%, Ontology Consortium. Nat. Genet. 25: 25–29.
12%, and 15% false positives for the groups with significant ex- Bailey, J.A., Yavor, A.M., Massa, H.F., Trask, B.J., and Eichler, E.E. 2001.
Segmental duplications: Organization and impact within the current
cess and 4%, 2%, and 5% false positives for the groups with
human genome project assembly. Genome Res. 11: 1005–1017.
significant lack of expression differences in the respective tax- Bailey, J.A., Gu, Z., Clark, R.A., Reinert, K., Samonte, R.V., Schwartz, S.,
onomies. Adams, M.D., Myers, E.W., Li, P.W., and Eichler, E.E. 2002. Recent
To find out if groups on higher levels of the GO taxonomies segmental duplications in the human genome. Science
are significant solely because they contain significant subgroups, 297: 1003–1007.
we removed all significant subgroups from each significant group Caceres, M., Lachuer, J., Zapala, M.A., Redmond, J.C., Kudo, L.,
and tested the remaining genes against the distribution of the Geschwind, D.H., Lockhart, D.J., Preuss, T.M., and Barlow, C. 2003.
detected genes using the hypergeometric distribution. If the Elevated gene expression levels distinguish human from non-human
primate brains. Proc. Natl. Acad. Sci. 100: 13030–13035.
group lost its significance, it was removed from further analysis.
Enard, W., Khaitovich, P., Klose, J., Zollner, S., Heissig, F., Giavalisco, P.,
If it remained significant, the next higher group in the taxonomy Nieselt-Struwe, K., Muchmore, E., Varki, A., Ravid, R., et al. 2002.
was tested using the same procedure. Intra- and interspecific variation in primate gene expression
patterns. Science 296: 340–343.
Finger, S. and Stein, D.G. 1982. Brain damage and recovery: Research and
Genomic Localization clinical perspectives. Academic Press, New York.
Gu, J. and Gu, X. 2003. Induced gene expression in human brain after
We mapped the 61,648 probe sets on the Affymetrix HGU95 the split from chimpanzee. Trends Genet. 19: 63–65.
GeneChips to the human genome (NCBI assembly, July 2003, Hellmann, I., Zollner, S., Enard, W., Ebersberger, I., Nickel, B., and
Build 34) using BLAT (Kent 2002). Multiple probe sets that map Paabo, S. 2003. Selection on human genes as revealed by
to the same UniGene cluster or transcript were removed, leaving comparisons to chimpanzee cDNA. Genome Res. 13: 831–837.
only one entry per transcript. When multiple probe sets were Hsieh, W.P., Chu, T.M., Wolfinger, R.D., and Gibson, G. 2003.
mapped to the same transcript and at least one of them was Mixed-model reanalysis of primate data suggests tissue and species
classified as differentially expressed, the transcript was classified biases in oligonucleotide-based gene expression profiles. Genetics
165: 747–757.
as differentially expressed.
Kaessmann, H., Wiebe, V., and Pääbo, S. 1999. Extensive nuclear DNA
We used overlapping sliding windows containing 21 de- sequence diversity among chimpanzees. Science 286: 1159–1162.
tected transcripts to calculate the proportion of differentially Kandel, E.R., Schwartz, J.H., and Jessell, T.M. 2000. Principles of neural
expressed transcripts per window along the genome. The Y- science. McGraw-Hill Health Professions Division, New York.
chromosome was excluded from this analysis because very Karaman, M.W., Houck, M.L., Chemnick, L.G., Nagpal, S.,
few transcripts were detected there. We simulated the random Chawannakul, D., Sudano, D., Pike, B.L., Ho, V.V., Ryder, O.A., and
distribution by 1,500,000 permutations of the original data set Hacia, J.G. 2003. Comparative analysis of gene-expression patterns
with respect to the assignment of expression differences to de- in human and African great ape cultured fibroblasts. Genome Res.
13: 1619–1630.
tected genes. The p-values were calculated as the proportion of
Kent, W.J. 2002. BLAT—The BLAST-like alignment tool. Genome Res.
random sets that contained a number of windows with a certain 12: 656–664.
ratio of differentially expressed transcripts equal to or greater Lee, J.K., Bussey, K.J., Gwadry, F.G., Reinhold, W., Riddick, G., Pelletier,
than the number of windows with that ratio in the observed S.L., Nishizuka, S., Szakacs, G., Annereau, J.P., Shankavaram, U., et
data. al. 2003. Comparing cDNA and oligonucleotide array data:
1472 Genome Research
www.genome.orgGene Expression in Primate Brain
Concordance of gene expression across platforms for the NCI-60 Kapatos, G., Grossman, L.I., and Goodman, M. 2004. Sister grouping
cancer cells. Genome Biol. 4: R82. of chimpanzees and humans as revealed by genome-wide
Lu, J., Li, W.H., and Wu, C.I. 2003. Comment on “Chromosomal phylogenetic analysis of brain gene expression profiles. Proc. Natl.
speciation and molecular divergence-accelerated evolution in Acad. Sci. 101: 2957–2962.
rearranged chromosomes.” Science 302: 988; author reply 988. von Melchner, L., Pallas, S.L., and Sur, M. 2000. Visual behaviour
Navarro, A. and Barton, N.H. 2003a. Accumulating postzygotic isolation mediated by retinal projections directed to the auditory pathway.
genes in parapatry: A new twist on chromosomal speciation. Evol. Nature 404: 871–876.
Int. J. Org. Evol. 57: 447–459. Yunis, J.J. and Prakash, O. 1982. The origin of man: A chromosomal
———. 2003b. Chromosomal speciation and molecular pictorial legacy. Science 215: 1525–1530.
divergence—Accelerated evolution in rearranged chromosomes.
Science 300: 321–324.
Olson, M.V. and Varki, A. 2003. Sequencing the chimpanzee genome:
Insights into human evolution and disease. Nat. Rev. Genet. WEB SITE REFERENCES
4: 20–28. ftp://ftp.ncbi.nih.gov/refseq/LocusLink; LocusLink.
Sadato, N., Pascual-Leone, A., Grafman, J., Ibanez, V., Deiber, M.P., http://www.affymetrix.com/analysis/download_center.affx; NetAFFX.
Dold, G., and Hallett, M. 1996. Activation of the primary visual http://www.ebi.ac.uk/arrayexpress/; ArrayExpress.
cortex by Braille reading in blind subjects. Nature 380: 526–528. http://www.eva.mpg.de/∼khaitovi/supplement2.html; Authors’ Web site.
Samonte, R.V. and Eichler, E.E. 2002. Segmental duplications and the http://www.godatabase.org/dev/database/archive; GeneOntology.
evolution of the primate genome. Nat. Rev. Genet. 3: 65–72. http://www.ncbi.nlm.nih.gov/UniGene/; UniGene.
Sandberg, R., Yasuda, R., Pankratz, D.G., Carter, T.A., Del Rio, J.A., http://www9.biostr.washington.edu/da.html; Digital Anatomist Project.
Wodicka, L., Mayford, M., Lockhart, D.J., and Barlow, C. 2000.
Regional and strain-specific gene expression mapping in the adult
mouse brain. Proc. Natl. Acad. Sci. 97: 11038–11043.
Uddin, M., Wildman, D.E., Liu, G., Xu, W., Johnson, R.M., Hof, P.R., Received March 3, 2004; accepted in revised form June 8, 2004.
Genome Research 1473
www.genome.orgYou can also read