Correlation of active contact location with weight gain after subthalamic nucleus deep brain stimulation: a case series
←
→
Page content transcription
If your browser does not render page correctly, please read the page content below
Eguchi et al. BMC Neurology     (2021) 21:351
https://doi.org/10.1186/s12883-021-02383-6

 RESEARCH                                                                                                                                            Open Access

Correlation of active contact location with
weight gain after subthalamic nucleus
deep brain stimulation: a case series
Katsuki Eguchi1*, Shinichi Shirai1, Masaaki Matsushima1, Takahiro Kano1, Kazuyoshi Yamazaki2, Shuji Hamauchi2,
Toru Sasamori3, Toshitaka Seki2, Kenji Hirata4, Mayumi Kitagawa5, Mika Otsuki6, Tohru Shiga7, Kiyohiro Houkin2,
Hidenao Sasaki1 and Ichiro Yabe1

  Abstract
  Background: Weight gain (WG) is a frequently reported side effect of subthalamic deep brain stimulation; however,
  the underlying mechanisms remain unclear. The active contact locations influence the clinical outcomes of
  subthalamic deep brain stimulation, but it is unclear whether WG is directly associated with the active contact
  locations. We aimed to determine whether WG is associated with the subthalamic deep brain stimulation active
  contact locations.
  Methods: We enrolled 14 patients with Parkinson’s disease who underwent bilateral subthalamic deep brain
  stimulation between 2013 and 2019. Bodyweight and body mass index were measured before and one year
  following the surgery. The Lead-DBS Matlab toolbox was used to determine the active contact locations based on
  magnetic resonance imaging and computed tomography. We also created sweet spot maps for WG using voxel-
  wise statistics, based on volume of tissue activation and the WG of each patient. Fluorodeoxyglucose-positron
  emission tomography data were also acquired before and one year following surgery, and statistical parametric
  mapping was used to evaluate changes in brain metabolism. We examined which brain regions’ metabolism
  fluctuation significantly correlated with increased body mass index scores and positron emission tomography data.
  Results: One year after surgery, the body mass index increase was 2.03 kg/m2. The sweet spots for WG were
  bilateral, mainly located dorsally outside of the subthalamic nucleus (STN). Furthermore, WG was correlated with
  increased metabolism in the left limbic and associative regions, including the middle temporal gyrus, inferior frontal
  gyrus, and orbital gyrus.
  Conclusions: Although the mechanisms underlying WG following subthalamic deep brain stimulation are possibly
  multifactorial, our findings suggest that dorsal stimulation outside of STN may lead to WG. The metabolic changes
  in limbic and associative cortical regions after STN-DBS may also be one of the mechanisms underlying WG. Further
  studies are warranted to confirm whether dorsal stimulation outside of STN changes the activities of these cortical
  regions.
  Keywords: Deep brain stimulation, Parkinson’s disease, Subthalamic nucleus, Weight gain

* Correspondence: k198762@gmail.com
1
 Department of Neurology, Faculty of Medicine, Graduate School of
Medicine, Hokkaido University, Kita 15, Nishi 7, Kita-ku, 060-8638 Sapporo,
Japan
Full list of author information is available at the end of the article

                                         © The Author(s). 2021 Open Access This article is licensed under a Creative Commons Attribution 4.0 International License,
                                         which permits use, sharing, adaptation, distribution and reproduction in any medium or format, as long as you give
                                         appropriate credit to the original author(s) and the source, provide a link to the Creative Commons licence, and indicate if
                                         changes were made. The images or other third party material in this article are included in the article's Creative Commons
                                         licence, unless indicated otherwise in a credit line to the material. If material is not included in the article's Creative Commons
                                         licence and your intended use is not permitted by statutory regulation or exceeds the permitted use, you will need to obtain
                                         permission directly from the copyright holder. To view a copy of this licence, visit http://creativecommons.org/licenses/by/4.0/.
                                         The Creative Commons Public Domain Dedication waiver (http://creativecommons.org/publicdomain/zero/1.0/) applies to the
                                         data made available in this article, unless otherwise stated in a credit line to the data.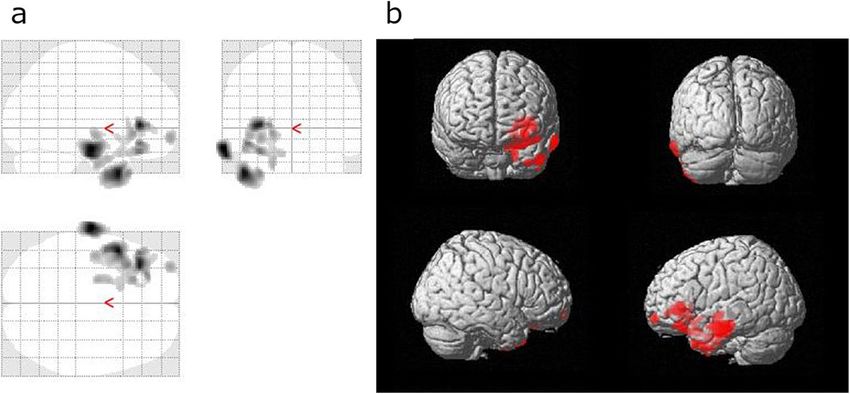
Eguchi et al. BMC Neurology   (2021) 21:351                                                                 Page 2 of 10

Background                                                    excluded one patient who withdrew from participating
Subthalamic nucleus deep brain stimulation (STN-DBS)          and another who required electrode removal due to an
is an established and effective treatment strategy for ad-    infection. Thus, this study analyzed data from 14 pa-
vanced Parkinson’s disease (PD) [1]. However, STN-DBS         tients, including 12 women. The median age at DBS sur-
is associated with several adverse effects, of which,         gery was 62.5 (55.5–68) years, and the median disease
weight gain (WG) is one of the most common, although          duration at DBS surgery was 14.3 (12–20.5) years. The
the underlying mechanisms have not been fully eluci-          eligibility for DBS surgery was determined based on the
dated. Previous reports have suggested that WG is asso-       guidelines of the International Parkinson and Movement
ciated with lowered resting energy needs [2, 3], fewer        Disorders Society [26]. All patients received bilaterally
motor complications (especially dyskinesia) [4–6],            implanted quadripolar (from contact number ‘0’ for the
changes in eating behaviors [7, 8], and hormonal factors      most ventral contact to ‘3’ for the most dorsal one) DBS
[9, 10]. However, these factors do not completely explain     electrodes (3387; Medtronic, Minneapolis, MN, USA).
WG, which suggests that WG following STN-DBS is a                This study was conducted following the 1964 Declar-
multifactorial process [11].                                  ation of Helsinki and its later amendments and was ap-
   The locations of electrodes affect the clinical outcomes   proved by the ethics panel of the institutional review
and adverse effects of STN-DBS [12, 13]. Based on ani-        board of Hokkaido University Hospital. All patients pro-
mal studies [14, 15] and studies examining the human          vided written informed consent before their inclusion in
brain using diffusion tensor imaging [16–18], the STN is      the study.
divided into three functional subregions: the sensori-
motor, associative, and limbic regions. Previous studies      Clinical assessment
have suggested that superior motor improvement is             Clinical assessments were conducted at the preoperative
achieved by stimulating the sensorimotor area, which is       baseline and one year following surgery. Bodyweight and
located in the dorsolateral part of the STN and is linked     height were measured and used to calculate the body
to the primary motor and supplementary motor cortices         mass index (BMI, kg/m2). Motor symptoms were
[17, 19–21]. Nevertheless, an increased risk of neuro-        assessed using the Unified Parkinson’s Disease Rating
psychiatric side effects may be associated with stimula-      Scale (UPDRS) part III in the MedOff state at baseline
tion of the limbic area, which is present in the              and in the MedOff and DBS-on state at one year follow-
anteromedial part of the STN [17, 22]. However, few           ing surgery. Dyskinesia was also evaluated using items
studies have evaluated whether WG is directly correlated      32 and 33 of the UPDRS part IV. Neuropsychological
with the stimulation location during STN-DBS. There-          evaluations were based on the Mini Mental State Exam-
fore, this study prospectively evaluated patients who         ination (MMSE), Frontal Assessment Battery (FAB), Ap-
underwent STN-DBS for PD and aimed to determine               athy Scale [27], and Patient Health Questionnaire-9 [28].
whether WG was correlated with the positions of the ac-       The levodopa-equivalent daily dose (LEDD) [29] was cal-
tive contacts and distribution of volume of tissue activa-    culated at both baseline and one year following DBS sur-
tion (VTA).                                                   gery. Brain metabolism was evaluated using FDG-PET at
   In addition, several previous studies using                baseline and one year following surgery. The DBS stimu-
fluorodeoxyglucose-positron       emission      tomography    lation parameters were recorded at one year following
(FDG-PET) have shown a correlation between behavioral         surgery and included the stimulation voltage, pulse
or cognitive changes and metabolic changes in specific        width, frequency, and active contact location.
brain regions following STN-DBS [23, 24]. We hypothe-
sized that regions in which metabolic changes are seen,       Assessing the active contact positions
could help identify the regions in the STN correlated         The active contact positions were evaluated using Lead-
with WG after STN-DBS. Therefore, we also evaluated           DBS, which is a validated Matlab toolbox [30, 31] that
whether WG was associated with altered glucose metab-         was implemented using Matlab 2019b (MathWorks, Na-
olism in specific brain regions.                              tick, MA, USA). Preoperative results were obtained via
                                                              T2-weighted magnetic resonance imaging (MRI, slice
Methods                                                       thickness: 1 mm; echo time: 222 ms; repetition time:
Patients                                                      2,000 ms), and postoperative results were obtained via
This prospective study recruited patients with PD, who        computed tomography (CT). The preoperative MRI and
underwent bilateral STN-DBS surgery, at Hokkaido Uni-         postoperative CT images were co-registered using ad-
versity Hospital between 2013 and 2019. PD diagnoses          vanced normalization tools [32] and then nonlinearly
were based on the UK Parkinson’s Disease Society Brain        normalized into Montreal Neurological Institute (MNI)
Bank criteria [25]. We recruited 16 patients with PD          standard space (MNI_ICBM_2009b_NLIN_Asym). The
who underwent bilateral STN-DBS surgery; we then              DBS electrodes were automatically reconstructed using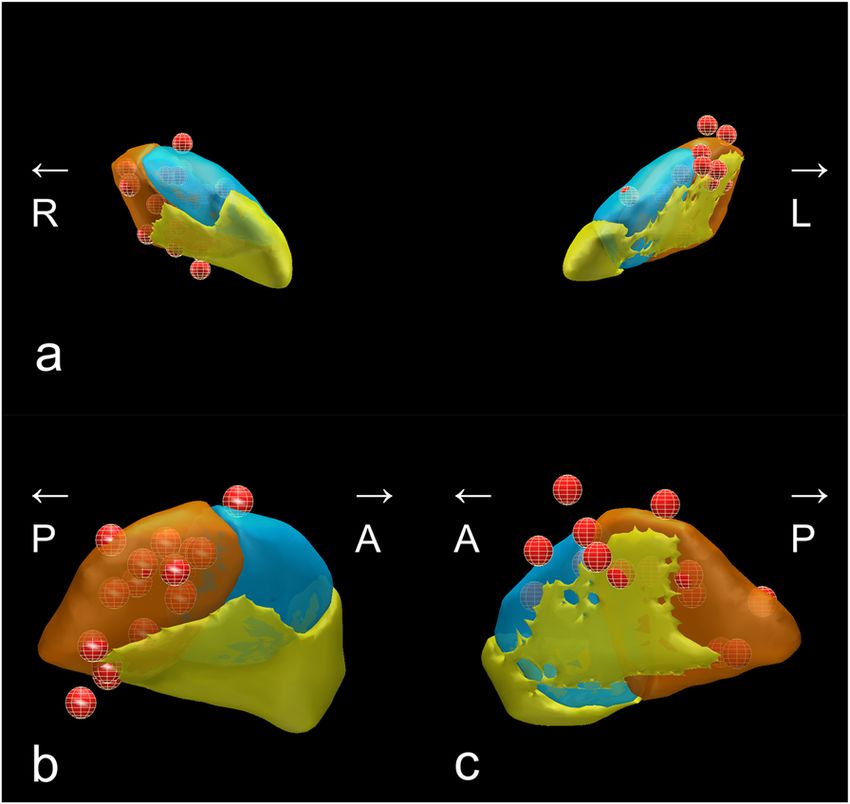
Eguchi et al. BMC Neurology   (2021) 21:351                                                                   Page 3 of 10

the TRAC/CORE algorithm [31] and manually refined            60 min following FDG administration for 10-min emis-
to evaluate their coordinates in MNI space. If more than     sion scanning. Images were reconstructed using ordered
one contact was used for the stimulation, the mean co-       subset expectation–maximization. The PET images were
ordinates of all active contacts were recorded. The pos-     preprocessed using statistical parametric mapping
itional relationships between the active contacts and the    (SPM12; Wellcome Department of Cognitive Neurology,
STN were assessed using the DISTAL atlas [33], which         London, UK) on Matlab 2019b. The PET images were
is a composite atlas based on histology, structural con-     initially subjected to affine and nonlinear spatial
nectivity, and manual segmentations of a multimodal          normalization into the MNI brain space, although we
brain template normalized in MNI space.                      used an FDG-PET-specific template that was described
                                                             by Della Rosa et al. [36] instead of the default H2O-SPM
Calculation of volume of tissue activation                   template [15]. The normalized images were then
VTA calculations were performed using a finite element       smoothed using an 8-mm isotropic Gaussian filter to
method approach [34], implemented in Lead-DBS based          compensate for individual anatomical variability. Finally,
on the stimulation settings of each patient. The spread      we created a percent signal change map (PSC map)
of the electric field was estimated for homogenous tissue    using the following formula:
with a conductivity of 0.14 S/m. The threshold of VTA
was at the electric field isolevel of 0.2 V/mm.
                                                                 PSC ¼ V1y  Vb          100=Vb
Creation of sweet spot map for WG
In this study, we assessed the sweet spot for WG after         where, V1y and Vb represent voxel values at one year
DBS using Lead-Group [35]. Each voxel of each patient’s      following surgery and baseline, respectively.
VTA was assigned an increase in BMI. Subsequently, all
VTAs were pooled across patients and the mean in-            Statistical analysis
crease in BMI was obtained for each voxel. To identify       Scores are reported as the median ± interquartile range
voxels with a significantly higher increase in BMI than      (IQR), and nonparametric analyses were used based on
the average increase of BMI of all VTAs that did not         the small sample size. Preoperative and postoperative
stimulate that particular voxel, a two-sample t-test was     values for BMI, UPDRS part III and IV scores, neuro-
performed. This test yielded a t-statistic for every voxel   psychological data, and LEDD values were compared
that was then displayed as 3D statistical maps, which we     using the Wilcoxon signed-rank test, and p < 0.001 was
referred to as sweet spot maps. Significant voxels (un-      considered as statistically significant using Bonferroni
corrected, p < 0.05) were visualized on sweet spot maps      correction. Stimulation voltage and active contact coor-
for WG. Only those voxels that were at least covered by      dinates for the left and right sides were compared using
n = 3 VTAs were considered in this analysis.                 Wilcoxon’s rank-sum test. A multivariate regression ana-
                                                             lysis was performed with WG as the dependent variable
FDG-PET acquisition and preprocessing                        and contacts’ coordinates that showed a correlation with
PET data were obtained using either a GEMINI TF64            WG, age, body weight before surgery, sex, stimulation
(Philips, Amsterdam, Netherlands) PET-CT scanner or a        voltage, frequency, pulse width, dyskinesia reduction
Biograph 64 (Siemens, Munich, Germany) TruePoint             (scores of UPDRS part IV items 32 + 33), and LEDD re-
PET-CT scanner for different patients. Time-of-flight        duction as independent variables to adjust for any pos-
technology was used with GEMINI TF64 but not with            sible confounders (p < 0.05 was considered as statistically
Biograph 64. The manufacturer of the DBS system warns        significant). Statistical analyses were carried out using
that stimulation intensity may increase during CT and        JMP Pro software (version 14; SAS Inc., Cary, North
recommends turning off stimulation during the scan. In       Carolina, USA).
our institution, turning off DBS stimulation is required        The PET data were analyzed using SPM12 (Wellcome
during scanning with a PET-CT scanner to avoid an in-        Department of Cognitive Neurology, London, UK). To
crease in stimulation intensity and incurring any side ef-   identify which brain regions’ metabolism change corre-
fects. Therefore, in this study, a PET was performed in      lated significantly with increased BMI scores, a general
the MedOn at baseline and in the MedOn and DBS-off           linear model was tested at each voxel with the BMI
state post-operation. DBS stimulation was turned off         score as a covariate using a PSC map. LEDD was in-
30–60 min before PET. Patients were instructed to fast       cluded in the SPM analysis as a covariate. A voxel-level
overnight before PET [18]. F-FDG (4.5 MBq/kg) was ad-        threshold of P < 0.05 (family-wise error corrected for
ministered intravenously, and serum glucose was mea-         multiple comparisons) was used to assess the SPM t
sured to exclude the patients showing fasting                values. If statistical significance was not reached, we per-
hyperglycemia (> 150 mg/dL). The images were acquired        formed the same analysis with a voxel-level threshold of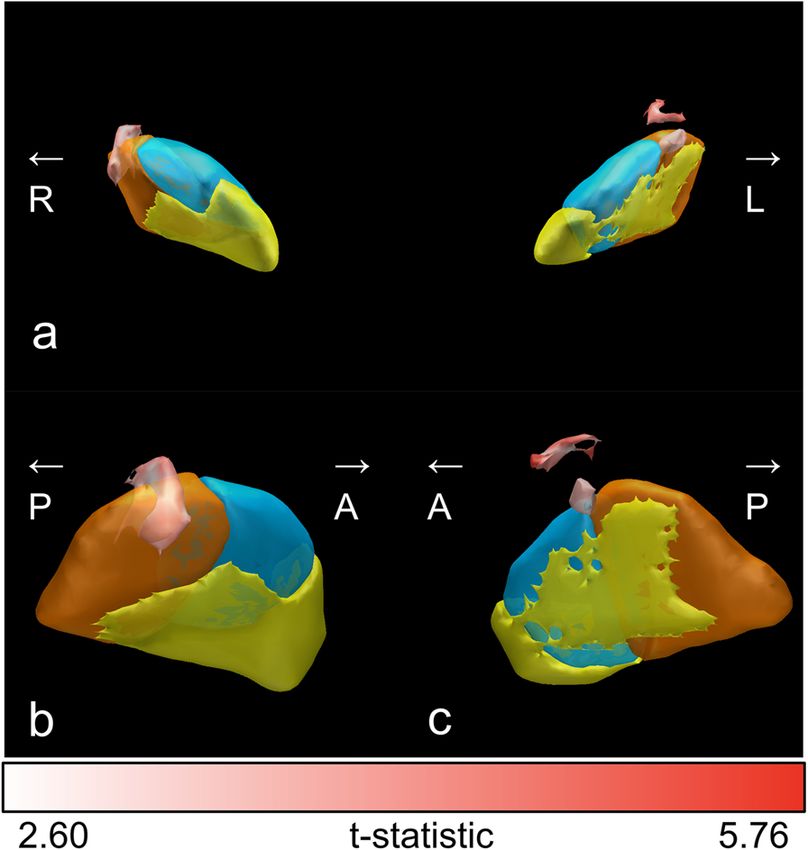
Eguchi et al. BMC Neurology         (2021) 21:351                                                                                             Page 4 of 10

P < 0.005 (uncorrected for multiple comparisons), con-                          Sweet spot map for WG
sidering the small sample size and the study’s explora-                         Figure 2 shows the sweet spot map for the WG results
tory nature. Only clusters containing > 100 voxels were                         of voxel-wise statistical analysis using VTA. The sweet
reported.                                                                       spots for WG were mainly located dorsally and outside
                                                                                of the STN, bilaterally.
Results
Clinical outcomes                                                               Correlations with increased BMI
Table 1 shows the clinical values at preoperative baseline                      We could not obtain a statistically significant model on
and one year following DBS surgery. A significant motor                         multivariate regression analysis (P = 0.11).
improvement was observed one year post-surgery, based
on the decreased UPDRS part III scores in the MedOff                            PET image analysis
state. A non-significant trend toward decreased values                          We analyzed PET data from 13 patients since one pa-
for items 32 and 33 of the UPDRS part IV was also ob-                           tient’s PET data were missing. A GEMINI TF64 PET-
served. Bodyweight and BMI values increased signifi-                            CT scanner was used for 12 patients, while a Biograph
cantly following STN-DBS. The neuropsychological                                64 TruePoint PET-CT scanner was used for the
assessments revealed a small but statistically significant                      remaining patient. None of the voxels were significant at
increase in the FAB score but no significant changes in                         a voxel-level threshold of P < 0.05 (family-wise error cor-
the other scales. There was a non-significant trend of de-                      rected for multiple comparisons). However, at a thresh-
crease in LEDD after DBS surgery.                                               old of P < 0.005 (uncorrected for multiple comparisons),
                                                                                we identified several clusters with positive correlations
                                                                                between WG and increased metabolism in the left hemi-
Stimulation parameters and active contact positions                             sphere (Table 3; Figs. 3 and 4). The correlations were
Each patient’s stimulation parameters at one year follow-                       observed in the left middle temporal gyrus, inferior
ing DBS surgery are shown in Table 2. The stimulation                           frontal gyrus, lateral orbital gyrus, anterior orbital gyrus,
intensities were similar between the right and left sides.                      and planum polare. We did not observe any negative
Figure 1 shows the electrode locations for the STN of all                       correlations between WG and brain metabolism in these
patients, as defined using the DISTAL atlas and MNI                             various areas.
space. The median coordinates of the right-side active
contacts were 12.5 (11.7–13.5) mm on the X-axis, -14.5                          Discussion
(-13.5 to -14.9) mm on the Y-axis, and − 6.4 (-5.6 to                           This study showed a mean BMI increase of 2 kg/m2 at 1
-7.6) mm on the Z-axis. The mean left-side coordinates                          year following DBS surgery; this concurs with previous
were − 13.6 (-11.5 to -14.2) mm on the X-axis, -13.6                            findings [37]. Furthermore, the mean active contact co-
(-11.8 to -15.6) mm on the Y-axis, and − 6.0 (-5.1 to                           ordinates in our study were similar to the preferred co-
-6.8) mm on the Z-axis. The X-, Y-, and Z-axis coordi-                          ordinates for motor improvement in previous studies
nates were not significantly different between the right                        [38]. The sweet spot for WG was located in the dorsal
and left sides, although the left-side Y-axis coordinates                       part of the STN and dorsally outside the STN on
had a larger IQR than the right-side Y-axis coordinates.                        both sides. We could not detect a significant

Table 1 Clinical values at baseline and 1-year follow-up
                                                         Baseline                                    1-year Follow-up                               p-value
Bodyweight                                               55.8 (49.7–63.6)                            60.7 (53.1–69.6)                               < 0.001
BMI                                                      23.1 (20.1–25.7)                            24.5 (22.0–29.1)                               < 0.001
UPDRS part III (MedOn)                                   14 (10–18)                                  8 (4.5–19.3)                                     0.13
UPDRS part III (MedOff)                                  40 (33.8–44.3)                              16 (11.8–23)                                   < 0.001
UPDRS part IV (items 32 + 33)                            1.5 (0–4)                                   1 (0–2.25)                                       0.12
MMSE                                                     29 (27.8–30)                                29 (28–30)                                       0.3
FAB                                                      14.5 (14.5–17.5)                            15.5 (13.8–17.3)                                 0.023
Apathy scale                                             13.5 (7.5–16)                               14 (4.8–16.3)                                    0.47
PHQ-9                                                    5 (4–8)                                     4 (0–7.8)                                        0.43
LEDD                                                     689 (363–748.5)                             418.5 (297.3–656.3)                              0.085
Scores are reported as the median (interquartile range)
BMI body mass index; FAB Frontal Assessment Battery; LEDD levodopa-equivalent daily dose; MedOff a condition without intaking medication; MedOn a condition
requiring intaking medication. MMSE Mini Mental State Examination; PHQ-9 Patient Health Questionnaire-9; UPDRS Unified Parkinson’s Disease Rating Scale
Eguchi et al. BMC Neurology (2021) 21:351 Page 5 of 10
Table 2 BMI change from baseline and stimulation parameters at one year following surgery
Disease duration at DBS surgery (year) Change of BMI Active contacts Frequency Stimulation Pulse width
from baseline (Hz) Intensity (V) (µs)
Subject No. Right Left Right Left Right Left Right Left
1 8 2.3 C(+)1(-)2(-) C(+)2(-) 130 130 1.5 2.2 60 60
2 18 3.8 C(+)1(-) C(+)2(-) 130 130 1.2 1.2 60 60
3 23 3.2 C(+)1(-)2(-) C(+)2(-) 130 130 2.6 1.8 60 60
4 8 1.0 C(+)3(-) C(+)3(-) 130 130 1 1 60 60
5 9 -0.2 C(+)1(-) C(+)1(-) 130 130 1 2 60 60
6 13 -0.2 C(+)2(-) 0(+)1(-) 130 130 2.8 3.2 60 150
7 13 4.6 C(+)2(-) C(+)2(-) 60 60 2.2 3.7 60 90
8 14 1.3 1(+)2(-) C(+)2(-) 130 130 3.4 3.2 150 90
9 13 2.8 C(+)2(-) C(+)3(-) 130 130 3 3 60 60
10 15 3.7 C(+)2(-) C(+)2(-) 130 130 2.8 2.8 90 90
11 6 0.7 C(+)2(-) C(+)2(-) 130 130 1.4 1.4 90 90
12 11 2.4 C(+)2(-) C(+)2(-) 130 130 2.1 1.7 60 60
13 8 2.3 C(+)1(-) C(+)2(-) 130 130 1.8 3 60 60
14 8 0.7 C(+)2(-) C(+)1(-) 130 130 1.9 2 60 60
correlation between WG and dyskinesia reduction;
previous findings using multivariate regression ana-
lysis remain conflicting [4–6, 38].
In this study, sweet spots for WG were located in
both, the dorsal part of the STN and dorsal to the STN
on both sides. These findings agree with those of a
Fig. 1 Meshed red points represent positions of active contacts. (a) Fig. 2 The sweet spot map for weight gain based on the results of
Anterior view of the bilateral lead locations for all 14 patients as well the voxel-wise statistical analysis. (a), (b), and (c) show the anterior
as the subthalamic nucleus (STN), as defined using the DISTAL atlas view of the bilateral section of the STN, lateral view of right STN,
in Montreal Neurological Institute space [33]. The functional and lateral view of left STN, respectively. The functional subregions
subregions of the STN are highlighted (sensorimotor STN in copper, of the STN are highlighted (sensorimotor STN in copper, associative
associative STN in blue, and limbic STN in yellow). The lateral views STN in blue, and limbic STN in yellow). The color bar shows t-
are shown for the right STN (b) and the left STN (c). This figure was statistic of the sweet spot map. This figure was created using Lead
created using Lead Group [35]. R, right; L, left; A, anterior; P, posterior Group [35]. R, right; L, left; A, anterior; P, posteriorEguchi et al. BMC Neurology (2021) 21:351 Page 6 of 10
Table 3 Correlations between weight gain and increased brain metabolism at various locations
Coordinates
Region X Y Z Peak T value No. of Voxels
Left middle temporal gyrus −68 −16 −20 6.8 575
Left triangular part of the inferior frontal gyrus −34 32 2 6.26 401
Left lateral orbital gyrus −44 32 −16 4.83 734
Left anterior orbital gyrus −32 62 −10 4.11 103
Left planum polare −42 -12 −8 4 107
The uncorrected thresholds were significant (P < 0.005) at the voxel level. Only clusters with > 100 voxels are reported
previous report, which indicated that active contacts lo- correlated with increased metabolism in the limbic and
cated in the zona incerta (dorsal to the STN) were corre- associative regions, including the orbitofrontal cortex,
lated with increased appetite after STN-DBS [39]. The lateral and medial parts of the temporal lobe, anterior
zona incerta contains neurons expressing melanin- cingulate cortex, and retrosplenial cortex [38]. Other
concentrating hormone, which is involved in the regula- PET and functional MRI studies have also suggested that
tion of feeding [40]. Thus, our finding of the location of a broad network of limbic and paralimbic structures me-
the sweet spot for WG may be explained by the stimula- diate the desire for food [50–57]. This network is
tion of the zona incerta and neurons that express thought to integrate sensory information with the cogni-
melanin-concentrating hormone. tive desire for food, and induces behaviors that aim to
We observed correlations between WG and increased obtain food [58, 59]. Regions with increased brain me-
metabolism in several brain regions that belonged to the tabolism in our study were also associated with the pro-
limbic and associative areas. This finding may explain cessing of desire for food; changes of the activities in the
another mechanism underlying WG following STN- limbic and associative areas may modify food-related be-
DBS. The STN plays an important role in reward pro- havior, ultimately causing WG. However, our sweet spot
cessing [41], and several studies have indicated that the map for WG in this study did not contain the limbic
STN is involved in controlling appetite and eating be- STN, which has strong structural connectivity with the
haviors. For instance, a study on non-human primates il- limbic brain region. The hyperdirect pathways, connect-
lustrated that STN activity increased during food reward ing the cortex and the STN, pass from the motor and as-
anticipation and delivery [42]. In humans, stroke or tu- sociative cortex through the dorsal area of STN;
mors affecting the STN causes hyperphagia and in- however, those from the limbic cortex pass through the
creases appetite [43, 44], and abnormal eating behaviors anterior area of STN [33]. The results of the sweet spot
have been reported following STN-DBS [7, 45–49]. analysis were inconsistent with the FDG-PET results.
These findings from previous studies suggest that behav- However, a previous study on non-human primates,
ioral changes after STN-DBS may cause WG. A previous using anterograde tracers, revealed overlapping projec-
FDG-PET study showed that WG after STN-DBS was tions from M1 to the dorsolateral STN and from the
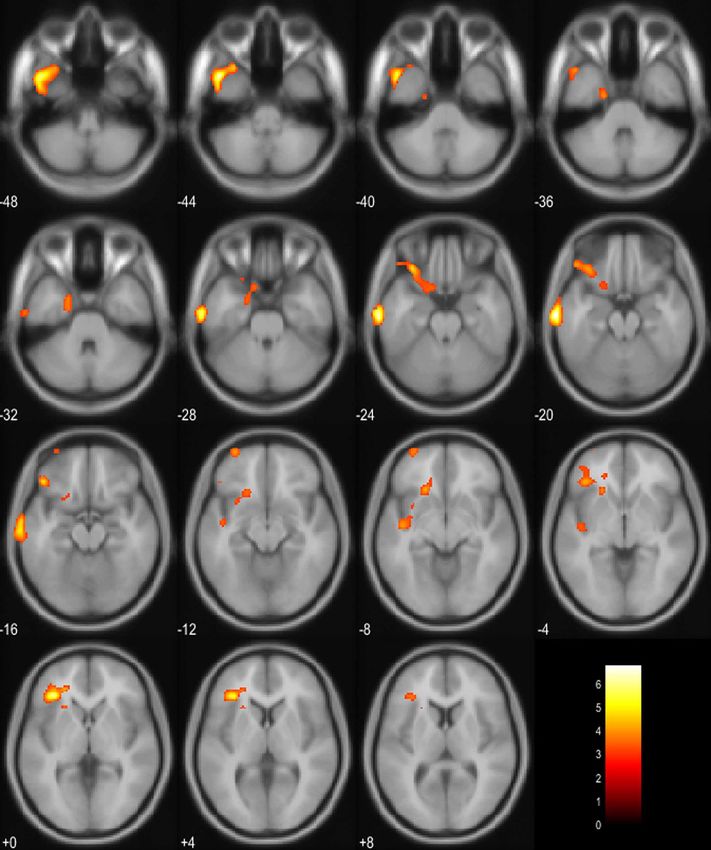
Fig. 3 Positive correlations between weight gain and brain metabolism detected using fluorodeoxyglucose-positron emission tomography were
based on three orthogonal views (a) and a three-dimensional brain surface projection (b)Eguchi et al. BMC Neurology (2021) 21:351 Page 7 of 10 Fig. 4 Projection of voxels that show positive correlations between weight gain and increased brain metabolism on axial template brain slices. The yellow marked regions indicate areas with significantly positive correlation between weight gain and brain metabolism prefrontal cortical areas to the anterior, ventral, and subregions within the STN, and their gradual transition medial half of the STN [15]. Another study using diffu- into each other [18]. These findings suggest that neurons sion tensor imaging found overlaps between the in each STN subregion receive multiple inputs and
Eguchi et al. BMC Neurology   (2021) 21:351                                                                                    Page 8 of 10

integrate information from different cortical regions.          patients are required to confirm the correlation between
Stimulation to hyperdirect pathways passing the dorsal          active contact location and WG.
area of the STN may influence the integration of infor-
mation from different cortical regions, and alter the ac-       Conclusions
tivities of limbic cortex. A larger prospective study with      Although the mechanisms underlying WG following
correction for multiple comparisons is warranted to con-        subthalamic deep brain stimulation are possibly multi-
firm this hypothesis.                                           factorial, our findings suggest that stimulation to the
   We observed that WG was correlated with increased            dorsal outside of the STN may lead to WG. Additionally,
brain metabolism only on the left side. Several studies         the metabolic changes in limbic and associative cortical
have also indicated that unilateral STN-DBS causes WG           regions following STN-DBS also correlated with WG.
[60, 61], although the laterality of this relationship re-      Stimulation to hyperdirect pathways passing through the
mains unclear. Further studies are warranted to deter-          dorsal area of the STN may influence the integration of
mine whether right-side STN-DBS may influence                   information from different cortical regions and change
metabolism in limbic and associative regions, and subse-        the functions of the limbic and associative cortex. Fur-
quently cause WG.                                               ther investigations are warranted to confirm this hypoth-
   In this study, LEDD did not decrease significantly fol-      esis by accurately assessing eating behaviors and food
lowing STN-DBS. This may be linked to the fact that             intake.
some patients were tremor dominant or experienced se-
vere side effects with dopaminergic therapy. These pa-          Abbreviations
tients were treated with a relatively low dose of               BMI: Body mass index; CT: Computed tomography; FAB: Frontal Assessment
                                                                Battery; LEDD: Levodopa-equivalent daily dose; MMSE: Mini Mental State
dopaminergic medication and did not need a reduction            Examination; MNI: Montreal Neurological Institute; MRI: Magnetic resonance
in dopaminergic medication following DBS surgery. In-           imaging; PD: Parkinson’s disease; PHQ-9: Patient Health Questionnaire-9;
deed, the median LEDD value in this study was lower             PSC: Percent signal change; UPDRS: Unified Parkinson’s Disease Rating Scale;
                                                                VTA: Volume of tissue activation; WG: Weight gain
than that reported in previous studies. In addition, an
aggressive reduction in dopaminergic medication follow-         Acknowledgements
ing DBS may incur behavioral side effects, such as ap-          We thank Ms. Megumi Takeuchi for performing the neuropsychological
athy and depression [62]. We reduced the medication             examinations.
dose carefully to prevent these behavioral side effects;
                                                                Authors’ contributions
this may be another reason why LEDD did not show any            Examination and treatment of Parkinson disease: K. Eguchi, S. Shirai, M.
significant reduction following DBS surgery. Although a         Matsushima, T. Kano, K. Yamazaki, S. Hamauchi, T. Sasamori, T. Seki, and Yabe
previous study reported significant correlation between         I. PET data acquisition and analysis: K. Hiraka and T.
                                                                Shiga. Neuropsychological assessment: M. Otsuki. Drafting of the manuscript:
WG and LEDD reduction [63], we could not find any               K. Eguchi. Critical revision of the manuscript for important intellectual
correlation after multivariate regression analysis in this      content: I. Yabe. Supervision: M. Kitagawa, K. Houkin, and H. Sasaki. All
study. This may be attributed to the relatively small           authors read and approved the final manuscript.
magnitude of LEDD reduction. However, future studies
                                                                Funding
with larger sample sizes are needed to evaluate the effect      This work was supported in part by a Grant-in-Aid for the Research Commit-
of LEDD reduction on WG after STN-DBS.                          tee of CNS Degenerative Diseases under Research on Measures for Intract-
   This study has several limitations. First, we did not as-    able Diseases from the Ministry of Health, Welfare, and Labor, Japan [grant
                                                                number 20FC1049]. The funder had no role in the study design, data collec-
sess eating habits or daily food intake. Thus, future stud-     tion, data analysis, data interpretation, or writing of the manuscript.
ies must confirm whether WG is caused by stimulation
of the limbic area, which induces changes in eating be-         Availability of data and materials
haviors, using preoperative and postoperative data on           The dataset(s) used and/or analyzed during the current study are available
                                                                from the corresponding author on reasonable request.
eating behaviors and food intake. Second, we did not as-
sess hormonal factors or swallowing function, which
                                                                Declarations
could have confounded our analyses. Third, we obtained
PET data only in an “off DBS” state after the surgery,          Ethics approval and consent to participate
owing to safety reasons. Therefore, it is difficult to attri-   This study was conducted following the 1964 Declaration of Helsinki and its
                                                                later amendments and was approved by the institutional review board of
bute the changes in brain metabolism after DBS to the           Hokkaido University Hospital. All patients provided written informed consent
plasticity of the neural circuit or the washout process of      prior to their inclusion in the study.
therapeutic DBS. Fourth, we were not able to obtain a
statistically significant model on multivariate regression      Consent for publication
                                                                Not applicable.
analysis. This may be related to a relatively smaller num-
ber of patients compared to the number of independent           Competing interests
variables. Further studies with a larger number of              The authors declare that they have no competing interests.
Eguchi et al. BMC Neurology (2021) 21:351 Page 9 of 10
Author details 16. Lambert C, Zrinzo L, Nagy Z, Lutti A, Hariz M, Foltynie T, et al. Confirmation
1
Department of Neurology, Faculty of Medicine, Graduate School of of functional zones within the human subthalamic nucleus: patterns of
Medicine, Hokkaido University, Kita 15, Nishi 7, Kita-ku, 060-8638 Sapporo, connectivity and sub-parcellation using diffusion weighted imaging.
Japan. 2Department of Neurosurgery, Faculty of Medicine, Graduate School Neuroimage. 2012;60:83–94.
of Medicine, Hokkaido University, Kita 15, Nishi 7, Kita-ku, 060-8638 Sapporo, 17. Accolla EA, Dukart J, Helms G, Weiskopf N, Kherif F, Lutti A, et al. Brain tissue
Japan. 3Department of Neurosurgery, Sapporo Azabu Neurosurgical Hospital, properties differentiate between motor and limbic basal ganglia circuits.
Kita 22, Higashi 1, Higashi-ku, 065-0022 Sapporo, Japan. 4Department of Hum Brain Mapp. 2014;35:5083–92.
Diagnostic Imaging, Faculty of Medicine, Graduate School of Medicine, 18. Plantinga BR, Temel Y, Duchin Y, Uludağ K, Patriat R, Roebroeck A, et al.
Hokkaido University, Kita 15, Nishi 7, Kita-ku, 060-8638 Sapporo, Japan. Individualized parcellation of the subthalamic nucleus in patients with
5
Sapporo Teishinkai Hospital, Kita 33, Higashi 1, Higashi-ku, 065-0033 Parkinson’s disease with 7T MRI. Neuroimage. 2018;168:403–11.
Sapporo, Japan. 6Faculty of Health Sciences, Graduate School of Health 19. Eisenstein SA, Koller JM, Black KD, Campbell MC, Lugar HM, Ushe M, et al.
Sciences, Hokkaido University, Kita 15, Nishi 7, Kita-ku, 060-8638 Sapporo, Functional anatomy of subthalamic nucleus stimulation in Parkinson
Japan. 7Department of Nuclear Medicine, Faculty of Medicine, Graduate disease: STN DBS Location and PD. Ann Neurol. 2014;76:279–95.
School of Medicine, Hokkaido University, Kita 15, Nishi 7, Kita-ku, 060-8638 20. Akram H, Sotiropoulos SN, Jbabdi S, Georgiev D, Mahlknecht P, Hyam J,
Sapporo, Japan. et al. Subthalamic deep brain stimulation sweet spots and hyperdirect
cortical connectivity in Parkinson’s disease. Neuroimage. 2017;158:332–45.
Received: 2 April 2021 Accepted: 1 September 2021 21. Gourisankar A, Eisenstein SA, Trapp NT, Koller JM, Campbell MC, Ushe M,
et al. Mapping movement, mood, motivation and mentation in the
subthalamic nucleus. R Soc Open Sci. 2018;5:171177.
22. Castrioto A, Lhommée E, Moro E, Krack P. Mood and behavioural effects of
References
subthalamic stimulation in Parkinson’s disease. Lancet Neurol. 2014;13:287–305.
1. Krack P, Batir A, Van Blercom N, Chabardes S, Fraix V, Ardouin C, et al. Five-
23. Le Jeune F, Drapier D, Bourguignon A, Péron J, Mesbah H, Drapier S, et al.
year follow-up of bilateral stimulation of the subthalamic nucleus in
Subthalamic nucleus stimulation in Parkinson disease induces apathy: a PET
advanced Parkinson’s disease. N Engl J Med. 2003;349:1925–34.
study. Neurology. 2009;73:1746–51.
2. Montaurier C, Morio B, Bannier S, Derost P, Arnaud P, Brandolini-Bunlon M,
24. Le Jeune F, Péron J, Biseul I, Fournier S, Sauleau P, Drapier S, et al.
et al. Mechanisms of body weight gain in patients with Parkinson’s disease
Subthalamic nucleus stimulation affects orbitofrontal cortex in facial
after subthalamic stimulation. Brain. 2007;130:1808–18.
emotion recognition: a PET study. Brain. 2008;131:1599–608.
3. Jorgensen HU, Werdelin L, Lokkegaard A, Westerterp KR, Simonsen L. Free-
25. Hughes AJ, Daniel SE, Kilford L, Lees AJ. Accuracy of clinical diagnosis of
living energy expenditure reduced after deep brain stimulation surgery for
Parkinson’s disease: Decreased energy expenditure after STN-DBS surgery. idiopathic Parkinson’s disease: a clinico-pathological study of 100 cases. J
Clin Physiol Funct Imaging. 2012;32:214–20. Neurol Neurosurg Psychiatry. 1992;55:181–4.
4. Gironell A, Pascual-Sedano B, Otermin P, Kulisevsky J. Weight gain after 26. Lang AE, Houeto J-L, Krack P, Kubu C, Lyons KE, Moro E, et al. Deep brain
functional surgery for Parkinsons disease. Neurologia. 2002;17:310–6. stimulation: preoperative issues. Mov Disord. 2006;21:S171-96.
5. Barichella M, Marczewska AM, Mariani C, Landi A, Vairo A, Pezzoli G. Body 27. Starkstein SE, Fedoroff JP, Price TR, Leiguarda R, Robinson RG. Apathy
weight gain rate in patients with Parkinson’s disease and deep brain following cerebrovascular lesions. Stroke. 1993;24:1625–30.
stimulation. Mov Disord. 2003;18:1337–40. 28. Kroenke K, Spitzer RL, Williams JB. The PHQ-9: validity of a brief depression
6. Balestrino R, Baroncini D, Fichera M, Donofrio CA, Franzin A, Mortini P, et al. severity measure. J Gen Intern Med. 2001;16:606–13.
Weight gain after subthalamic nucleus deep brain stimulation in Parkinson’s 29. Tomlinson CL, Stowe R, Patel S, Rick C, Gray R, Clarke CE. Systematic review
disease is influenced by dyskinesias’ reduction and electrodes’ position. of levodopa dose equivalency reporting in Parkinson’s disease. Mov Disord.
Neurol Sci. 2017;38:2123–9. 2010;25:2649–53.
7. Zahodne LB, Susatia F, Bowers D, Ong TL, Jacobson CE 4th, Okun MS, et al. 30. Horn A, Kühn AA. Lead-DBS: A toolbox for deep brain stimulation electrode
Binge eating in Parkinson’s disease: prevalence, correlates and the localizations and visualizations. Neuroimage. 2015;107:127–35.
contribution of deep brain stimulation. J Neuropsychiatry Clin Neurosci. 31. Horn A, Li N, Dembek TA, Kappel A, Boulay C, Ewert S, et al. Lead-DBS v2:
2011;23:56–62. Towards a comprehensive pipeline for deep brain stimulation imaging.
8. Amami P, Dekker I, Piacentini S, Ferré F, Romito LM, Franzini A, et al. Neuroimage. 2019;184:293–316.
Impulse control behaviours in patients with Parkinson’s disease after 32. Avants BB, Epstein CL, Grossman M, Gee JC. Symmetric diffeomorphic
subthalamic deep brain stimulation: de novo cases and 3-year follow-up. J image registration with cross-correlation: evaluating automated labeling of
Neurol Neurosurg Psychiatry. 2015;86:562–4. elderly and neurodegenerative brain. Med Image Anal. 2008;12:26–41.
9. Guimarães J, Moura E, Vieira-Coelho MA, Garrett C. Weight variation before 33. Ewert S, Plettig P, Li N, Chakravarty MM, Collins DL, Herrington TM, et al.
and after surgery in Parkinson’s disease: a noradrenergic modulation? Mov Toward defining deep brain stimulation targets in MNI space: a subcortical
Disord. 2012;27:1078–82. atlas based on multimodal MRI, histology and structural connectivity.
10. Seifried C, Boehncke S, Heinzmann J, Baudrexel S, Weise L, Gasser T, et al. Neuroimage. 2018;170:271–82.
Diurnal variation of hypothalamic function and chronic subthalamic nucleus 34. Horn A, Reich M, Vorwerk J, Li N, Wenzel G, Fang Q, et al. Connectivity predicts
stimulation in Parkinson’s disease. Neuroendocrinology. 2013;97:283–90. deep brain stimulation outcome in Parkinson disease. Ann Neurol. 2017;82 1:67–78.
11. Rieu I, Derost P, Ulla M, Marques A, Debilly B, De Chazeron I, et al. Body 35. Treu S, Strange B, Oxenford S, Neumann WJ, Kühn A, Li N, et al. Deep brain
weight gain and deep brain stimulation. J Neurol Sci. 2011;310:267–70. stimulation: imaging on a group level. Neuroimage. 2020;219:117018.
12. Tripoliti E, Zrinzo L, Martinez-Torres I, Tisch S, Frost E, Borrell E, et al. Effects 36. Della Rosa PA, and the EADC-PET Consortium, Cerami C, Gallivanone F,
of contact location and voltage amplitude on speech and movement in Prestia A, Caroli A, et al. A standardized [18F]-FDG-PET template for spatial
bilateral subthalamic nucleus deep brain stimulation. Mov Disord. 2008;23: normalization in statistical parametric mapping of dementia.
2377–83. Neuroinformatics. 2014;12:575–93.
13. Bot M, Schuurman PR, Odekerken VJJ, Verhagen R, Contarino FM, De Bie 37. Bannier S, Montaurier C, Derost PP, Ulla M, Lemaire J-J, Boirie Y, et al. Overweight
RMA, et al. Deep brain stimulation for Parkinson’s disease: defining the after deep brain stimulation of the subthalamic nucleus in Parkinson disease: long
optimal location within the subthalamic nucleus. J Neurol Neurosurg term follow-up. J Neurol Neurosurg Psychiatry. 2009;80:484–8.
Psychiatry. 2018;89:493–8. 38. Sauleau P, Le Jeune F, Drapier S, Houvenaghel J-F, Dondaine T, Haegelen C,
14. Karachi C, Yelnik J, Tandé D, Tremblay L, Hirsch EC, François C. The et al. Weight gain following subthalamic nucleus deep brain stimulation: a
pallidosubthalamic projection: an anatomical substrate for nonmotor PET study. Mov Disord. 2014;29:1781–7.
functions of the subthalamic nucleus in primates. Mov Disord. 2005;20: 39. de Chazeron I, Pereira B, Chereau-Boudet I, Durif F, Lemaire JJ, Brousse G,
172–80. et al. Impact of localisation of deep brain stimulation electrodes on motor
15. Haynes WIA, Haber SN. The organization of prefrontal-subthalamic inputs in and neurobehavioural outcomes in Parkinson’s disease. J Neurol Neurosurg
primates provides an anatomical substrate for both functional specificity Psychiatry. 2016;87:758–66.
and integration: implications for Basal Ganglia models and deep brain 40. Adamantidis A, de Lecea L. Sleep and metabolism: shared circuits, new
stimulation. J Neurosci. 2013;33:4804–14. connections. Trends Endocrinol Metab. 2008;19:362–70.Eguchi et al. BMC Neurology (2021) 21:351 Page 10 of 10
41. Rossi PJ, Gunduz A, Okun MS. The subthalamic nucleus, limbic function, and
impulse control. Neuropsychol Rev. 2015;25:398–410.
42. Espinosa-Parrilla J-F, Baunez C, Apicella P. Modulation of neuronal activity by reward
identity in the monkey subthalamic nucleus. Eur J Neurosci. 2015;42:1705–17.
43. Barutca S, Turgut M, Meydan N, Ozsunar Y. Subthalamic nucleus tumor
causing hyperphagia–case report. Neurol Med Chir (Tokyo). 2003;43:457–60.
44. Etemadifar M, Abtahi SH, Abtahi SM, Mirdamadi M, Sajjadi S, Golabbakhsh A,
et al. Hemiballismus, hyperphagia, and behavioral changes following
subthalamic infarct. Case Rep Med. 2012;2012:768580.
45. Aiello M, Eleopra R, Rumiati RI. Body weight and food intake in Parkinson’s disease.
A review of the association to non-motor symptoms. Appetite. 2015;84:204–11.
46. Ardouin C, Voon V, Worbe Y, Abouazar N, Czernecki V, Hosseini H, et al.
Pathological gambling in Parkinson’s disease improves on chronic
subthalamic nucleus stimulation. Mov Disord. 2006;21:1941–6.
47. Kistner A, Lhommée E, Krack P. Mechanisms of body weight fluctuations in
Parkinson’s disease. Front Neurol. 2014;5:84.
48. Lim SY, O’Sullivan SS, Kotschet K, Gallagher DA, Lacey C, Lawrence AD, et al.
Dopamine dysregulation syndrome, impulse control disorders and punding
after deep brain stimulation surgery for Parkinson’s disease. J Clin Neurosci.
2009;16:1148–52.
49. Witjas T, Baunez C, Henry JM, Delfini M, Regis J, Cherif AA, et al. Addiction in
Parkinson’s disease: impact of subthalamic nucleus deep brain stimulation.
Mov Disord. 2005;20:1052–5.
50. Rothemund Y, Preuschhof C, Bohner G, Bauknecht H-C, Klingebiel R, Flor H,
et al. Differential activation of the dorsal striatum by high-calorie visual food
stimuli in obese individuals. Neuroimage. 2007;37:410–21.
51. Führer D, Zysset S, Stumvoll M. Brain activity in hunger and satiety: an exploratory
visually stimulated FMRI study. Obesity (Silver Spring). 2008;16:945–50.
52. Killgore WDS, Young AD, Femia LA, Bogorodzki P, Rogowska J, Yurgelun-
Todd DA. Cortical and limbic activation during viewing of high- versus low-
calorie foods. Neuroimage. 2003;19:1381–94.
53. Siep N, Roefs A, Roebroeck A, Havermans R, Bonte ML, Jansen A. Hunger is
the best spice: an fMRI study of the effects of attention, hunger and calorie
content on food reward processing in the amygdala and orbitofrontal
cortex. Behav Brain Res. 2009;198:149–58.
54. Goldstone AP, Prechtl de Hernandez CG, Beaver JD, Muhammed K, Croese
C, Bell G, et al. Fasting biases brain reward systems towards high-calorie
foods. Eur J Neurosci. 2009;30:1625–35.
55. Wallner-Liebmann S, Koschutnig K, Reishofer G, Sorantin E, Blaschitz B,
Kruschitz R, et al. Insulin and hippocampus activation in response to images
of high-calorie food in normal weight and obese adolescents. Obesity
(Silver Spring). 2010;18:1552–7.
56. Wang G-J, Volkow ND, Telang F, Jayne M, Ma J, Rao M, et al. Exposure to
appetitive food stimuli markedly activates the human brain. Neuroimage.
2004;21:1790–7.
57. Carnell S, Gibson C, Benson L, Ochner CN, Geliebter A. Neuroimaging and
obesity: current knowledge and future directions. Obes Rev. 2012;13:43–56.
58. Tataranni PA, DelParigi A. Functional neuroimaging: a new generation of
human brain studies in obesity research. Obes Rev. 2003;4:229–38.
59. Abizaid A, Horvath TL. Brain circuits regulating energy homeostasis. Regul
Pept. 2008;149:3–10.
60. Walker HC, Lyerly M, Cutter G, Hagood J, Stover NP, Guthrie SL, et al.
Weight changes associated with unilateral STN DBS and advanced PD.
Parkinsonism Relat Disord. 2009;15:709–11.
61. Lee EM, Kurundkar A, Cutter GR, Huang H, Guthrie BL, Watts RL, et al.
Comparison of weight changes following unilateral and staged bilateral STN
DBS for advanced PD. Brain Behav. 2011;1:12–8.
62. Rossi M, Bruno V, Arena J, Cammarota Á, Merello M. Challenges in PD
patient management after DBS: a pragmatic review. Mov Disord Clin Pract.
2018;53:246–54.
63. Aiello M, Eleopra R, Foroni F, Rinaldo S, Rumiati RI. Weight gain after STN-
DBS: The role of reward sensitivity and impulsivity. Cortex. 2017;92:150–61.
Publisher’s Note
Springer Nature remains neutral with regard to jurisdictional claims in
published maps and institutional affiliations.You can also read