Runs of homozygosity provide a genome landscape picture of inbreeding and genetic history of European autochthonous and commercial pig breeds
←
→
Page content transcription
If your browser does not render page correctly, please read the page content below
FULL PAPER
                                                                                                                      doi: 10.1111/age.13045

Runs of homozygosity provide a genome landscape picture of
inbreeding and genetic history of European autochthonous and
commercial pig breeds
G. Schiavo* , S. Bovo* , M. Muñoz†, A. Ribani* , E. Alves†, J. P. Araújo‡, R. Bozzi§,
M. Čandek-Potokar¶, R. Charneca**, A. I. Fernandez†, M. Gallo††, F. Garcı́a†, D. Karolyi‡‡, G. Kušec§§,
J. M. Martins**, M.-J. Mercat¶¶, Y. Núñez†, R. Quintanilla***, Č. Radovi憆†, V. Razmaite‡‡‡,
J. Riquet§§§, R. Savi涶¶, G. Usai****, V. J. Utzeri* , C. Zimmer††††, C. Ovilo† and L. Fontanesi*
*Department of Agricultural and Food Sciences, Division of Animal Sciences, University of Bologna, Viale Giuseppe Fanin 46, Bologna 40127,
Italy. †Departamento Mejora Genética Animal, INIA, Crta. de la Coruña, km. 7,5, Madrid 28040, Spain. ‡Centro de Investigação de Montanha
(CIMO), Instituto Politécnico de Viana do Castelo, Escola Superior Agrária, Refóios do Lima, Ponte de Lima 4990-706, Portugal. §DAGRI -
Animal Science Division, Università di Firenze, Via delle Cascine 5, Firenze 50144, Italy. ¶Kmetijski Inštitut Slovenije, Hacquetova 17, Ljubljana
SI-1000, Slovenia. **Instituto de Ciências Agrárias e Ambientais Mediterrânicas, Universidade de Évora, Polo da Mitra, Apartado 94, Évora
7006-554, Portugal. ††Associazione Nazionale Allevatori Suini, Via Nizza 53, Rome 00198, Italy. ‡‡Department of Animal Science, Faculty of
Agriculture, University of Zagreb, Svetošimunska c. 25, Zagreb 10000, Croatia. §§Faculty of Agrobiotechnical Sciences, University of Osijek,
Vladimira Preloga 1, Osijek 31000, Croatia. ¶¶IFIP Institut du porc, La Motte au Vicomte, BP 35104, Le Rheu Cedex 35651, France.
***Programa de Genética y Mejora Animal, IRTA, Torre Marimon, Caldes de Montbui, Barcelona 08140, Spain. †††Department of Pig Breeding
and Genetics, Institute for Animal Husbandry, Belgrade-Zemun 11080, Serbia. ‡‡‡Animal Science Institute, Lithuanian University of Health
Sciences, Baisogala 82317, Lithuania. §§§GenPhySE, Université de Toulouse, INRA, Chemin de Borde-Rouge 24, Auzeville Tolosane, Castanet
Tolosan 31326, France. ¶¶¶Faculty of Agriculture, University of Belgrade, Nemanjina 6, Belgrade-Zemun 11080, Serbia. ****Agris Sardegna,
Loc. Bonassai, Sassari 07100, Italy. ††††Bäuerliche Erzeugergemeinschaft Schwäbisch Hall, Haller Str. 20, Wolpertshausen 74549, Germany.

Summary                                ROHs are long stretches of DNA homozygous at each polymorphic position. The proportion of
                                       genome covered by ROHs and their length are indicators of the level and origin of inbreeding.
                                       Frequent common ROHs within the same population define ROH islands and indicate hotspots of
                                       selection. In this work, we investigated ROHs in a total of 1131 pigs from 20 European local pig
                                       breeds and in three cosmopolitan breeds, genotyped with the GGP Porcine HD Genomic Profiler.
                                       PLINK software was used to identify ROHs. Size classes and genomic inbreeding parameters were
                                       evaluated. ROH islands were defined by evaluating different thresholds of homozygous SNP
                                       frequency. A functional overview of breed-specific ROH islands was obtained via over-
                                       representation analyses of GO biological processes. Mora Romagnola and Turopolje breeds had
                                       the largest proportions of genome covered with ROH (~1003 and ~955 Mb respectively),
                                       whereas Nero Siciliano and Sarda breeds had the lowest proportions (~207 and 247 Mb
                                       respectively). The highest proportion of long ROH (>16 Mb) was in Apulo-Calabrese, Mora
                                       Romagnola and Casertana. The largest number of ROH islands was identified in the Italian
                                       Landrace (n = 32), Cinta Senese (n = 26) and Lithuanian White Old Type (n = 22) breeds. Several
                                       ROH islands were in regions encompassing genes known to affect morphological traits.
                                       Comparative ROH structure analysis among breeds indicated the similar genetic structure of
                                       local breeds across Europe. This study contributed to understanding of the genetic history of the
                                       investigated pig breeds and provided information to manage these pig genetic resources.

                                       Keywords autozygosity, population genomics, selection signature, single nucleotide
                                       polymorphism, Sus scrofa

Address for correspondence
                                                                            Introduction
L. Fontanesi, Department of Agricultural and Food Sciences, Division of
                                                                            Conservation programs of animal genetic resources, mainly
Animal Sciences, University of Bologna, Viale Giuseppe Fanin 46,
Bologna 40127, Italy. E-mail: luca.fontanesi@unibo.it                       constituted by numerous autochthonous breeds in all
                                                                            species, are usually challenged by their small effective
Accepted for publication 15 January 2021

© 2021 Stichting International Foundation for Animal Genetics, 52, 155–170                                                                             155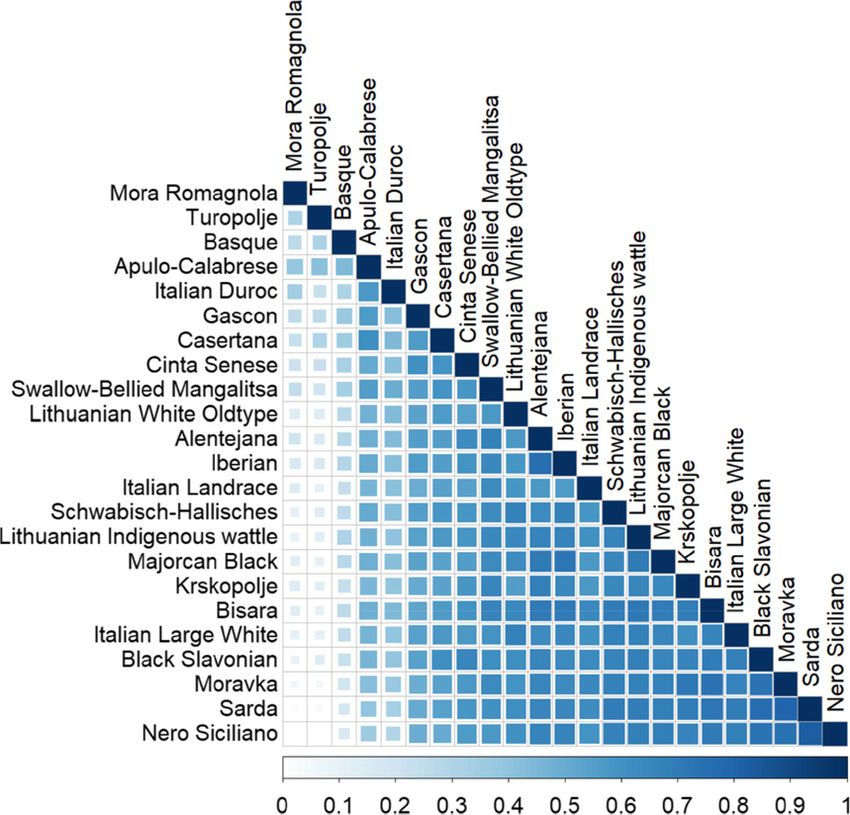
156   Schiavo et al.

      population size which, in turn, tends to increase inbreeding         et al. 2017; Bertolini et al. 2018; Grilz-Seger et al. 2018;
      and reduce genetic variability (Charlesworth & Willis                Mastrangelo et al. 2018; Peripolli et al. 2018), including
      2009). Inbreeding depression is considered the result of             the pig (Zhang et al. 2018; Gorssen et al. 2020; Schiavo
      the increased level of autozygosity. Pedigree information is         et al. 2020a).
      traditionally used to calculate the inbreeding coefficient              A lot of different pig breeds have been developed
      (FPED), defined as the probability that in a diploid individual,     through the combined action of artificial directional
      the maternal and paternal derived alleles at a randomly              selection and natural pressures that have contributed to
      selected locus are identical by descent (Wright 1922). This          shaping a large reservoir of genetic diversity within the
      definition is equivalent to considering FPED as the proportion       Sus scrofa species (Porter 1993). A large fraction of these
      of autozygosity of an individual’s genome. Then, the level of        genetic resources is, however, constituted by autochtho-
      inbreeding of a population is expressed by averaging all FPED        nous breeds of small population size, usually well adapted
      individual values. The reliability of FPED calculated in             to their local agro-climatic and environmental conditions
      autochthonous breeds is in general lower than what it is             but less productive, compared with cosmopolitan breeds or
      possible to obtain for animals in commercial selection               lines. Conservation programs for these breeds, some of
      nuclei. This is mainly due to incomplete registration and            which are considered unexplored genetic resources, have
      incorrect recording of all mating events derived by the              different levels of managing actions that range from
      extensive production systems in which local breeds are               advanced herd book structures with specific breeding and
      usually raised (Gomez-Raya et al. 2008; Kios et al. 2012). In        selection plans to preliminary voluntary farmer-based herd
      addition, it is clear that some assumptions used to calculate        books or primitive conservation programs (Čandek-Potokar
      this pedigree-based coefficient are not correct and they are         & Nieto 2019). We recently analyzed major and candidate
      used as approximations in the methods of calculations: (i)           gene markers in 20 autochthonous European pig breeds
      all founder animals of the base population are expected to           from several different countries and obtained preliminary
      be unrelated, but this condition cannot be evaluated and it          population structure results (Muñoz et al. 2018) that were
      is usually not respected; (ii) recombinant events occurring          refined using SNP array information (Muñoz et al. 2019)
      during meiosis mix equally the individual’s paternal and             and whole genome resequencing data (Bovo et al. 2020a,
      maternal haploid genome copies, but this condition mimics            b). Genome-wide data indicated that the average persis-
      only average events and not what actually happens in each            tence and strength of LD between markers and SNP-based
      specific meiosis; and (iii) there are no selection biases on any     effective population size varied among breeds depending on
      parts of the genome, but this assumption is not respected            the genetic structures and history of these breeds that had
      considering that directional artificial selection and natural        experienced different genetic events (e.g. admixture, bot-
      selection play important roles in shaping the genome of              tlenecks and genetic drift). Selection signatures were also
      many domestic animal breeds (Leutenegger et al. 2003;                obtained using FST statistics by analyzing SNP chip
      Wang 2016; Knief et al. 2017).                                       genotyping and sequencing data (Muñoz et al. 2019; Bovo
         Genome-wide analyses, usually based on SNP arrays,                et al. 2020a). Genomic inbreeding analyses in these breeds
      can be used to estimate the level of autozygosity of an              could be used as additional information to refine their
      animal genome by directly interrogating the genotype                 conservation programs, by controlling the level of autozy-
      status at thousands of polymorphic sites (Kristensen et al.          gosity, and identify appropriate strategies to control
      2010). The proportion of the genome covered by ROHs of               inbreeding level and infer other population structures or
      a certain minimal length has been considered one of the              features, such as breed-specific or subpopulation homozy-
      most precise estimations of the level of autozygosity,               gosity hotspots.
      providing a measure of genomic inbreeding (FROH; Peripolli              In this study, we analyzed the same 20 European
      et al. 2017). ROHs are defined as continuous chromosome              autochthonous pig breeds from nine different countries
      stretches in which all loci have a homozygous genotype               (Croatia, France, Germany, Italy, Lithuania, Portugal,
      (Gibson et al. 2006). Some ROH characteristics in a                  Serbia, Slovenia and Spain) and three other cosmopolitan-
      population (the average length of ROHs, the average                  derived breeds to obtain genomic inbreeding information
      proportion of the genome covered by ROHs and the                     from whole genotyping datasets using ROHs and other
      patterns of ROH distribution across the chromosomes) are             genomic approaches, which were based on the variance of
      considered indicators of the origin and genetic history of a         additive genetic values, on the correlation between uniting
      population (Ceballos et al. 2018). The high frequency of             gametes and on SNP homozygosity. We also estimated the
      ROHs in some chromosome regions identifies selection                 effective population size (Ne) of these breeds and compared
      signatures derived from a reduced haplotype variability              this information with the ROH patterns. We then evaluated
      around loci under natural or artificial selection (i.e. ROH          the distribution of ROH in the genome of these breeds and
      island or ROH hotspots). By applying different strategies            identified putative selection hotspot regions that might be
      and methods, ROH islands have been used to detect                    originated by the different selection histories and structures
      signatures of selection in several livestock species (Purfield       of these pig genetic resources.

                                                                     © 2021 Stichting International Foundation for Animal Genetics, 52, 155–170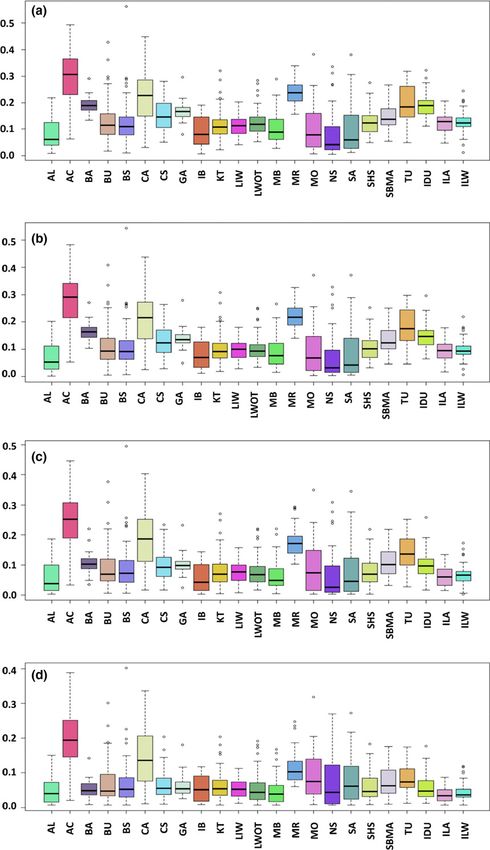
Runs of homozygosity in pigs       157

                                                                        Multidimentional-plot analysis of pig breeds and
Materials and methods
                                                                        effective population size
Animals                                                                 The first three dimensions for a MDS plot were obtained
                                                                        using PLINK software version 1.9 and plotted with the R
Pigs included in this study were from 20 autochthonous
                                                                        package ‘Scatterplot3d’ (Ligges & Mächler 2003) to graph-
breeds distributed in nine European countries (Alentejana
                                                                        ically visualize the genetic distances between the 23 pig
and Bı́sara from Portugal; Iberian and Majorcan Black
                                                                        breeds. Effective population size (Ne) at recent and remote
from Spain; Basque and Gascon from France; Apulo-
                                                                        generations was computed using SNP data with the
Calabrese, Casertana, Cinta Senese, Mora Romagnola,
                                                                        software SNEP (Barbato et al. 2015). SNEP allows estimation
Nero Siciliano and Sarda from Italy; Krškopolje from
                                                                        of the historic effective population size by considering the
Slovenia; Black Slavonian and Turopolje from Croatia;
                                                                        linkage level (in terms of r2) in bins of different widths and
Moravka and Swallow-bellied Mangalitsa from Serbia;
                                                                        the recombination rate; the computation is based on the
Schwäbisch–Hällisches Schwein from Germany; Lithua-
                                                                        basic formula:
nian Indigenous Wattle and Lithuanian White Old Type

from Lithuania) and three commercial breeds (Italian                                        E r2 ¼ ð1  4N e cÞ1
Large White, Italian Landrace and Italian Duroc). Ana-
lyzed pigs were selected by avoiding highly related animals             where the r2 estimate E(r2) depends on the distance
(no full- or half-sibs). All animals had standard breed                 between SNPs in windows and c is the recombination rate,
characteristics and were registered to their respective herd            kept at 1 × 10⁻⁸ as default. SNEP software computes the Ne in
books. Table S1 provides detailed descriptions of the                   past and recent generations by correcting the equation in-
investigated breeds and selected animals (Čandek-Potokar               cluding the number of samples and the phasing informa-
& Nieto 2019). Pictures of animals from the autochtho-                  tion. Default parameters were used, except for the
nous breeds are reported in Muñoz et al. (2018, 2019) and              maximum distance in bp between SNPs to be analyzed,
Bovo et al. (2020a).                                                    which was set to 10 Mb, and the binwidth for the
                                                                        calculation of LD that was set to 100 kb.

Genotyping and quality control
                                                                        Identification of ROHs
All pigs (39–55 for each breed; Table S2) were geno-
typed with the GeneSeek® GGP PORCINE HD GENOMIC PROFILER                ROHs were identified using PLINK software version 1.9
version 1 (Illumina Inc), which includes 68 516 SNPs                    (Chang et al. 2015). No pruning was performed based on LD
evenly distributed with a median of 25 kb gap spacing. The              to avoid biases that could be derived by this practice (Marras
average genotyping call rate was 0.94. SNPs were mapped                 et al. 2015; Meyermans et al. 2020), but a minimum length
on the SSCROFA11.1 genome version, following the proce-                 of 1 Mb was set to detect ROHs. This threshold may exclude
dure already described by Fontanesi et al. (2012, 2014).                short and common ROHs determined by markers in LD, as
Only autosomal SNPs located in unique positions were                    previously demonstrated (e.g. Ferenčaković et al. 2013;
considered. Genotyping data were then filtered using PLINK              Marras et al. 2015). The following parameters, already used
software version 1.9 (Chang et al. 2015). A call rate of 0.90           by Schiavo et al. (2020b), were considered to call ROHs: (i)
and HWE P of 0.001 were set as thresholds to keep SNPs.                 the minimum number of consecutive homozygous SNPs
Although filtering for MAF is necessary as best practice in             included in the ROH was 15; (ii) the minimum length that
most SNP chip analyses, this approach excludes the SNPs                 constituted the ROH was 1 Mb; (iii) the number of
that are homozygous for the whole breed; therefore it could             heterozygous SNPs that were allowed in the ROH was 0;
cause an underestimation of the coverage in ROHs (Mey-                  (iv) the minimum density of SNPs in a genome window was
ermans et al. 2020). For this reason, we analyzed ROHs                  1 SNP every 100 kb; and (v) the maximum gap between
without applying any MAF pruning. For comparison with                   consecutive SNPs was 1000 kb. ROHs were placed into five
other studies that applied a MAF threshold and to evaluate              size classes (Kirin et al. 2010; Ferenčaković et al. 2013;
the impact of MAF on the calculated ROH parameters, we                  Schiavo et al. 2020b): 1–2, 2–4, 4–8, 8–16 and greater
also used a MAF threshold of 0.01 (indicated as a method                than 16 Mb, identified as ROH1–2 Mb, ROH2–4 Mb,
based on MAF > 0.01) and the results are included in the                ROH4–8 Mb, ROH8–16 Mb and ROH greater than 16 Mb
Supporting Information. All analyses in the text were                   respectively. The total number of ROHs (nROHs) was then
derived without MAF pruning (indicated as a method based                obtained for each individual and for each length class. The
on MAF ≥ 0.00), if not stated otherwise. Animals were                   average length of ROHs (LROH, in Mb) and the sum of all
discarded if their call rate was less than 0.90. Table S2               ROH segments by animals (SROH, in Mb) were calculated.
reports the number of SNPs and animals considered for                   These parameters were also calculated for each breed by
further analyses after filtering.                                       averaging individual data.

© 2021 Stichting International Foundation for Animal Genetics, 52, 155–170
158 Schiavo et al.
Genomic inbreeding measures the level of inbreeding is high, the identification of islands
owing to the signature of selection based on a fixed
The FROH was calculated for each pig as the proportion of
percentage of animals having ROHs at each position of
the autosomal genome covered by ROHs. FROH was calcu-
the genome might increase the number of false-positive
lated using all of he detected ROHs with length greater than
ROH islands that indicate the presence of signature of
1 Mb (FROH1) and also considering higher thresholds of
selection. This method could increase the risk of type II
length, namely greater than 4 Mb, greater than 8 Mb and
errors when the level of inbreeding in the population is low.
greater than 16 Mb to obtain respectively, FROH4, FROH8
Another method, frequently applied for this aim (Szmatoła
and FROH16 inbreeding coefficients. Averaged FROH values
et al. 2016; Purfield et al. 2017; Bertolini et al. 2018;
were calculated for each breed. In addition, chromosome
Mastrangelo et al. 2018; Zhang et al. 2018), defines a
(SSC) FROH (FROHSSC) values were also estimated for each
percentile threshold (99th percentile) based on the top 1%
breed: FROHSSC = LROHSSC/LSSC (Silió et al. 2013), in which
of SNPs observed in an ROH in each breed (hereinafter
LROHSSC is the total length of an individual’s ROH in each
called the percentile-based threshold). Adjacent SNPs over
SSC and LSSC is the length of each chromosome covered by
this threshold are then merged into genomic regions
the involved SNPs.
corresponding to ROH hotspots. This method always
Other genomic inbreeding coefficients were calculated: (i)
identifies ROH islands as the threshold is defined on a
the variance-standardized relationship minus 1 (Fhat1); (ii)
percentile within the breed dataset and does not consider
the excess of homozygosity-based inbreeding estimate (Fhat2);
the structure of the population or its level of inbreeding.
(iii) the estimate based on correlation between uniting
Considering the problems that these two methods could
gametes (Fhat3); (iv) the values of the diagonal elements of
have, we developed a third method where the identification
the genomic relationship matrix, GRM (FGRM; VanRaden
of the threshold was chosen considering the average SROH
et al. 2008); and (v) the difference between the observed and
level of the breed, which approximates the genomic
expected numbers of homozygous genotypes (FHOM). The
inbreeding level of a population (hereinafter called SROH-
Fhat1, Fhat2, Fhat3 and FGRM GRM coefficients were calculated
based threshold). This method consisted of predicting the
using PLINK1.9 with the ported functions of GCTA software
threshold after fitting a simple linear model in which the
version 1.92 (Yang et al. 2011). Among the latter methods,
percentile threshold was a function of the average SROH. The
FGRM and Fhat1 are influenced by the frequency of alleles in
basic model was:
the population and Fhat3 takes into consideration the
correlation between uniting gametes, which could come y i ¼ β 0 þ β 1 si þ ɛ i ,
from the same ancestor in case of inbreeding. Fhat2 and FHOM
where yi is the threshold value (minimum number of
are influenced by the excess of homozygosity, but do not
animals positive for an ROH) obtained using the percentile-
consider the position of SNPs along the genome. FHOM was
based threshold for the ith breed, si is the SROH value for the
computed with PLINK software version 1.9 (Chang et al. 2015).
ith breed, β0 is the intercept term whereas β1 is the
Pearson correlation coefficients (r) between all evaluated
corresponding regression coefficients and ei is the error
inbreeding coefficients were calculated.
term. Based on this model, the values of SROH were used for
the prediction of the new threshold value (minimum
number of animals positive for a ROH).
Identification of ROH islands and annotation of genome
ROH islands were then considered in the text and
regions
annotated based on the results derived by this latter
First, the proportion of SNPs residing within an ROH was method. The results obtained with the other two methods
calculated for a given breed by counting the number of were used for a comparative analysis. ROH co-occurrence
times an SNP appeared in an ROH within the given breed between different breeds was investigated by comparing the
divided by the total number of genotyped pigs of that breed. average homozygosity level in each breed at each island
Then, to call ROH islands a threshold of frequency should be region. For this evaluation, each ROH island identified in at
defined. A few methods have been proposed for this purpose, least one breed was considered.
each with pros and cons (Purfield et al. 2017; Grilz-Seger Similarity among breeds was investigated by computing a
et al. 2018; Gorssen et al. 2020). However, there is no first matrix A (n breeds × m ROH islands regions identified
general agreement on their use in different contexts and across all of the analyzed breeds) whose generic entry a is
populations. In this study, we used three methods to identify the average breed-specific frequency value of a given ROH
ROH islands that differed on the threshold that was applied. island computed as follows: a ¼ ∑i AFi =n, where AFi is the
One method already reported in other studies (Grilz-Seger allele frequency of the ith SNP belonging to the ROH island
et al. 2018, 2019a,b) uses an empirical threshold defined as and including n SNPs. This matrix was used to compute a
the percentage of animals (usually 50%) within a popula- similarity matrix D (n × n), whose generic entry d is the
tion that are positive for an ROH at each tested SNP Euclidean distance between pairs of breeds with values
(hereinafter called 50% of animals-based threshold). When scaled in the range 0–1. A final dissimilarity matrix (1 − D)
© 2021 Stichting International Foundation for Animal Genetics, 52, 155–170Runs of homozygosity in pigs 159
was obtained and used to produce a heatmap in R (package animal in the 23 breeds. Minimum and maximum values
corrplot; Wei & Simko 2017) showing similarity among for these three parameters are reported in Table S5. As
breeds. expected, the parameters calculated without any MAF
Genes annotated in the SSCROFA11.1 pig genome version pruning were always higher than the parameters calculated
that mapped in the identified ROH islands were retrieved using MAF greater than 0.01. The breeds that the highest
using the ENSEMBL BIOMART tool (http://www.ensembl.org/ mean nROH were Basque, Italian Duroc and Turopolje (n =
biomart/martview/) and from the NCBI SSCROFA11.1 GFF 107, n = 104 and n = 80 respectively) and the breeds with
file. Functional enrichment analysis was carried out with the lowest mean nROHs were Nero Siciliano (n = 24) Sarda
ENRICHR (Chen et al. 2013) via Fisher’s exact test. Analyses (n = 27) and Moravka (n = 30). The mean LROH in all
were carried on the Biological Process branch of the GO autochthonous breeds was larger than that of all three
(Ashburner et al. 2000), by interrogating a total of 5103 commercial breeds. Three Italian local breeds (Mora
functional terms that were covering 14 433 human genes. Romagnola, Apulo-Calabrese and Casertana) had the
Breed-specific analyses were run using as the input set the largest values of LROH (14.38, 14.21 and 12.63 Mb
list of genes included in the ROH islands. We considered as respectively). Among the autochthonous breeds, the lowest
statistically over-represented terms those having: (i) at least LROH was observed in Alentejana (6.49 Mb), Iberian
two input genes from two or more different ROH islands; (6.50 Mb) and Majorcan Black (6.58 Mb). The maximum
and (ii) an adjusted P lower than 0.10. ROH length was observed in the largest chromosomes and
reached 24.34 Mb in Mora Romagnola (SSC1), 23.36 Mb
in Nero Siciliano (SSC1), 22.64 Mb in Moravka (SSC1) and
Results
21.55 Mb in Apulo-Calabrese (SSC13). Mora Romagnola
and Turopolje breeds had the largest mean SROH (totals of
Genomic relationships among breeds and effective
~1003 and ~955 Mb respectively), whereas Nero Siciliano
population size
and Sarda breeds had the lowest mean values for this
Genomic information on the analyzed breeds based on SNP parameter (~207 and ~247 Mb respectively). The maxi-
data was graphically presented in a tri-dimensional MDS mum SROH value was observed in one Mora Romagnola and
plot (Fig. S1). This plot showed that distinct groups of one Black Slavonian pig that had about half of their genome
individuals were usually from the same breed. Several covered by ROHs (Table S5).
breeds were well separated from other groups. These distinct Figure 1 shows the correlation plots between the SROH
groups included breeds from several countries: Gascon and and the nROH values over the individual pigs in the 23
Basque from France; Italian Large White, Italian Duroc and breeds. Basque and Gascon showed homogeneous plots,
Mora Romagnola from Italy; Iberian from Spain; and indicating that most pigs of these two breeds had similar
Turopolje from Croatia. Most of the other breeds formed a within-individual ROH parameters (nROH, LROH and SROH).
continuous large cluster showing a general geographical In contrast, heterogeneous distribution was observed in the
distribution gradient as already reported in PCAs that Apulo-Calabrese, Bı́sara, Casertana and Turopolje breeds
included the same autochthonous breeds (Muñoz et al. (Fig. 1).
2019). Figure 2 reports the proportion of ROH of the five
Effective population size (Ne) estimated with the software different length classes in each breed. Table S6 lists the
SNEP for the 23 breeds is reported in Table S3. Five corresponding values. The highest proportion of long ROH
generations ago, the breeds with the lowest Ne values were (>16 Mb) was in Apulo-Calabrese, Mora Romagnola and
Turopolje, Mora Romagnola, Apulo-Calabrese and Caser- Casertana (about 25, 23 and 23% respectively). Apulo-
tana (Ne = 15, 16, 22 and 22 respectively). The auto- Calabrese, Casertana, Mora Romagnola and Turopolje had
chthonous breeds with the largest Ne were Iberian, Nero the lowest proportion of short–medium ROH (ROH1–8). All
Siciliano, Alentejana, Majorcan Black, Sarda and Bı́sara three commercial breeds, Alentejana, Gascon, Iberian,
(Ne = 69, 68, 61, 58, 57 and 55 respectively). The Majorcan Black, Nero Siciliano, Lithuanian Indigenous
commercial breeds had a higher Ne than all other remain- Wattle, Lithuanian White Old Type and Schwäbisch–Hällis-
ing autochthonous breeds. In Italian Duroc, Italian Lan- ches had more than 50% of short ROHs (ROH1–2 and
drace and Italian Large White the values of Ne five ROH2–4).
generation ago were 53, 59 and 61 respectively.
Genomic inbreeding parameters based on ROHs
ROHs in the investigated breeds
Table 2 reports the mean and standard deviation of
Table 1 (MAF ≥ 0.00) and Table S4 (MAF > 0.01) show genomic inbreeding parameters calculated using ROHs
the average size and average number of ROHs (considering from different size classes in the 23 breeds. Mora Romag-
all ROHs >1 Mb) per pig (average LROH and average nROH nola, Turopolje, Apulo-Calabrese and Casertana were the
respectively) and the average sum of ROH (SROH) values per autochthonous breeds with the highest FROH values,
© 2021 Stichting International Foundation for Animal Genetics, 52, 155–170160 Schiavo et al.
Table 1 ROH parameters calculated in the 23 pig breeds obtained without any pruning for MAF, i.e. MAF ≥ 0.00. Parameters calculated using
MAF > 0.01 are reported in Table S4.
Breed Acronym nROH (SD)1 LROH (SD)2 SROH (SD)3
Alentejana AL 50.90 (10.67) 6.49 (2.48) 339.97 (167.31)
Apulo-Calabrese AC 56.74 (11.67) 14.21 (3.60) 813.75 (266.55)
Basque BA 106.62 (9.36) 7.21 (1.13) 764.56 (105.38)
Bı´sara BI 43.88 (12.93) 7.59 (2.67) 352.18 (211.11)
Black Slavonian BS 36.61 (14.72) 8.75 (3.29) 336.98 (230.97)
Casertana CA 45.34 (11.20) 12.63 (4.04) 595.06 (268.90)
CintaSenese CS 55.62 (15.47) 7.75 (2.28) 424.32 (144.99)
Gascon GA 75.08 (8.52) 6.97 (1.06) 522.14 (89.18)
Iberian IB 51.38 (11.97) 6.50 (2.25) 341.52 (148.95)
Krškopolje KR 34.96 (7.36) 8.62 (2.72) 306.47 (138.31)
Lithuanian Indigenous Wattle LIW 42.69 (7.07) 7.69 (1.74) 330.44 (98.97)
Lithuanian White Old Type LWOT 56.27 (10.16) 6.59 (1.82) 373.55 (133.34)
Majorcan Black MB 48.50 (10.47) 6.58 (1.95) 327.89 (147.08)
Mora Romagnola MR 70.35 (7.37) 14.38 (2.48) 1003.13 (139.75)
Moravka MO 30.14 (12.34) 8.48 (4.36) 289.36 (220.73)
Nero Siciliano NS 24.15 (10.00) 7.30 (4.91) 207.33 (208.19)
Sarda SA 27.46 (10.26) 7.77 (4.70) 246.77 (221.24)
Schwäbisch–Hällisches SHS 49.14 (6.63) 7.28 (2.13) 360.16 (123.64)
Swallow-bellied Mangalitsa SBMA 49.96 (8.11) 9.75 (2.04) 483.27 (115.50)
Turopolje TU 79.76 (15.31) 11.91 (1.78) 955.04 (242.37)
Italian Duroc IDU 104.00 (10.49) 6.33 (1.03) 655.35 (106.75)
Italian Landrace ILA 65.56 (8.86) 5.27 (1.08) 347.80 (92.75)
Italian Large White ILW 62.46 (12.90) 5.52 (1.00) 349.22 (107.11)
1
nROH: the average total number of ROH and the standard deviation (SD) calculated for each breed.
2
LROH: the average length of ROH (in Mb) considering all length classes and the standard deviation (SD) calculated for each breed.
3
SROH: the average sum of all ROH segments (in Mb) by animals considering all length classes and the standard deviation (SD) calculated for each
breed.
considering all ROH classes. For example, among these Mean FROH1, FROH4, FROH8 and FROH16 breed values were
breeds the FROH1 ranged from 0.409 (Mora Romagnola) to negatively correlated with the estimated breed Ne values
0.243 (Casertana). Among the commercial breeds, Italian five generation ago, defined as reported above (r = −0.685,
Duroc had the highest FROH values. The lowest FROH1 levels −0.722, −0.737 and −0.716 respectively; P < 0.0001).
were observed in Nero Siciliano (0.085), Sarda (0.101) and
Moravka (0.118).
Other genomic inbreeding parameters and their
When considering only medium–long ROH to calculate
correlations with FROH
other ROH-based inbreeding parameters (i.e. FROH4, FROH8
and FROH16), the values decreased in all breeds, as expected. Other parameters that have been proposed as estimators of
Among those with high FROH1, this drop was more evident the level of genomic inbreeding were calculated in the 23
in the breeds that had a high percentage of short ROHs than breeds (Table S8). The average Fhat1 value was positive in
in breeds that had many long ROHs. For example, the only two breeds (Mora Romagnola and Sarda) and ranged
Italian Duroc FROH16 value was about 2.5 times lower than from −0.320 (Mora Romagnola) to 0.010 (Sarda), with
the FROH1 value, whereas in Mora Romagnola, Turopolje, large within-breed variability (the largest standard devia-
Apulo-Calabrese and Casertana the FROH16 values tion was in Turopolje) and among-breed variability. These
decreased only 1.4–1.6 times compared with their respec- considerations could be also applied for the FGRM parameter,
tive FROH1 values. The distribution of the FROH values in the which is equivalent to Fhat1 (even if scaled in a different
analyzed breeds is shown in the boxplots of Fig. 3. way). Negative Fhat1 values correspond to lower related-
The genome-wide FROH information was also dissected by ness, thus the results indicate that the individuals of the
considering the average proportion of all ROHs covering the Mora Romagnola and Sarda breeds are more related to each
different autosomes (FROHSSC). Among all breeds, Mora other in comparison with individuals of the other breeds.
Romagnola and Turopolje had the highest FROHSSC values The average Fhat2 and Fhat3 parameters had both of the
for 10 (SSC1, SSC4, SSC8, SSC9, SSC10, SSC13, SSC14, extreme values for the same breeds (Lithuanian Indigenous
SSC15, SSC16 and SSC17) and five (SSC2, SSC3, SSC5, SSC6 Wattle with the lowest values and Apulo-Calabrese with the
and SSC11) chromosomes respectively. Apulo-Calabrese had highest values) with similar within- and among-breed
the highest FROHSSC values for SSC7 and SSC18 whereas variability (Table S8). The average FHOM values were
Basque had the highest FROHSSC value for SSC12 (Fig. S2). negative in 11 out of 23 breeds and ranged from −0.070
© 2021 Stichting International Foundation for Animal Genetics, 52, 155–170Runs of homozygosity in pigs 161 Figure 1 Correlation plots between nROH (y-axis) and SROH (x-axis) for the 23 pig breeds including all animals. Acronyms of the breeds and are defined in Table 1 and Table S1. Pearson correlation coefficient is reported beside the acronym of each breed. © 2021 Stichting International Foundation for Animal Genetics, 52, 155–170
162 Schiavo et al.
0% 20% 40% 60% 80% 100%
Alentejana Figure 2 Proportion of ROHs of dif-
ferent class sizes in the 23 pig breeds.
Apulo-Calabrese ROH classes were defined according
Basque to their size: 1–2, 2–4, 4–8, 8–16 and
Bisara >16 Mb, identified as ROH1–2,
ROH2–4, ROH4–8, ROH8–16 and
Black Slavonian
ROH > 16 respectively.
Casertana
CintaSenese
Gascon
Iberian
Krskopolje
Lithuanian Nave
Lithuanian White oldtype
Majorcan Black
Mora Romagnola
Moravka
Nero Siciliano
Sarda
Schwäbisch-Hällisches
Swallow-Bellied Mangalitsa
Turopolje
Italian Duroc
Italian Landrace
Italian Large white
1-2Mbp 2-4Mbp 4-8Mbp 8-16Mbp >16Mbp
in Lithuanian Indigenous Wattle to 0.124 in Apulo- extreme numbers of ROH islands. Figure 5 reports the
Calabrese. Turopolje had the largest standard deviation for pairwise similarities between breeds when overlapping ROH
this parameter (0.24). Distribution plots of the Fhat1, Fhat2, islands across breeds were considered. Some common
Fhat3 and FHOM, parameters in the analyzed breeds are features across breeds were evident.
reported in Figs S3 & S4. The largest number of ROH islands was identified in the
Correlations between all FROH parameters and all other Italian Landrace (n = 34), Cinta Senese (n = 26) and
genomic inbreeding measures for each breed are reported in Lithuanian White Old Type (n = 22) breeds. The largest
Table S9. The FHOM always had high and consistent covered fraction of the genome was observed in the Italian
correlations with the ROH-based measures over all breeds. Duroc (92.85 Mb), Turopolje (80.82 Mb, with the largest
For example, correlations with FROH1 and FROH4 ranged averaged size of ROH islands) and Italian Landrace
from 0.819 and 0.814 for the Nero Siciliano breed to 0.987 (75.03 Mb). No ROH islands were observed in Apulo-
and 0.982 for the Bı́sara breed. Correlations between Fhat2, Calabrese and Sarda breeds.
FROH1 and FROH4 had some lower values even if they were Table S10 compares the results obtained using the SROH-
again high and consistent across breeds (they ranged from based threshold method with the results obtained using the
0.447 or 0.450 in Swallow-bellied Mangalitsa to 0.909 and other two methods considered in this study (the 50% of
0.906 in Casertana). The Fhat1 and Fhat3 showed inconsis- animals-based threshold and the percentile-based threshold
tent correlations compared with those of the other mea- methods, see Materials and methods). The Manhattan plots
sures, also including negative values (Table S9). All of these for all breeds and including the thresholds derived by the
other genomic inbreeding measures had low negative three methods are reported in Fig. S5. Breeds with the
correlations with Ne (from −0.11 to −0.18). highest level of genomic inbreeding estimated using FROH
measures, like Mora Romagnola, Turopolje and Basque
(Table 2), showed the highest number of ROH islands and
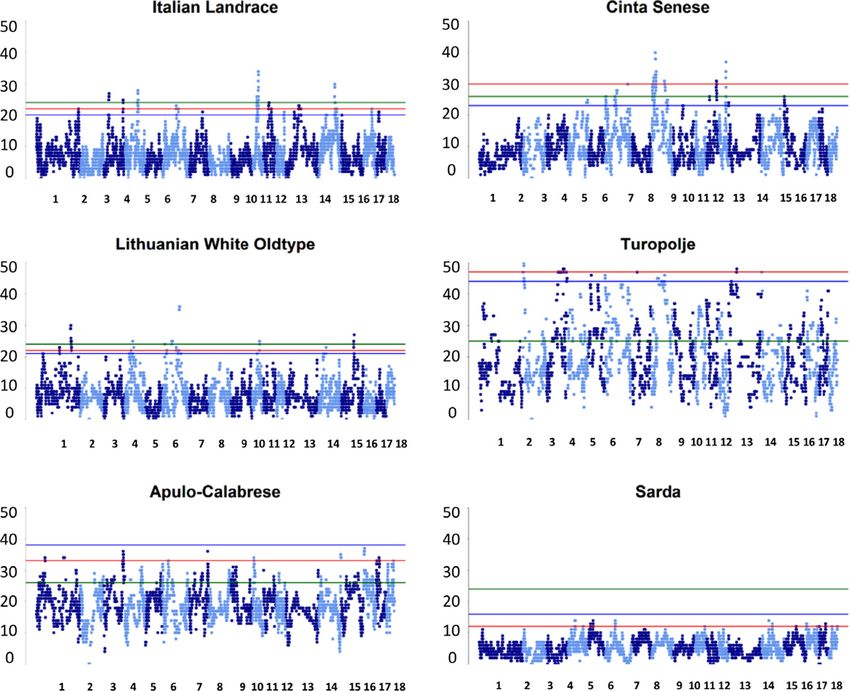
ROH islands
the largest fraction of genome covered by ROH islands with
Table 3 summarizes the number of ROH islands and the the 50% of animals-based threshold method (n = 91 with
fraction of the genome covered by ROH islands identified 756 Mb in Mora Romagnola, n = 129 with 747 Mb in
using the SROH-based threshold in the 23 pig breeds. Turopolje and n = 93 in Basque with 312.9 Mb). Using the
Figure 4 includes the Manhattan plots of a few breeds with percentile-based threshold method, the number of ROH
© 2021 Stichting International Foundation for Animal Genetics, 52, 155–170Runs of homozygosity in pigs 163
Table 2 Mean FROH values calculated in the 23 pig breeds using all ROH >1 (FROH1), >4 (FROH4), >8 (FROH8) and >16 (FROH16) Mb. Standard
deviation is in parentheses.
Breed FROH1 FROH4 FROH8 FROH16
Alentejana 0.139 (0.072) 0.110 (0.071) 0.084 (0.062) 0.059 (0.061)
Apulo-Calabrese 0.332 (0.111) 0.314 (0.110) 0.281 (0.102) 0.229 (0.101)
Basque 0.312 (0.042) 0.261 (0.052) 0.194 (0.053) 0.120 (0.042)
Bı´sara 0.144 (0.093) 0.122 (0.082) 0.098 (0.081) 0.071 (0.062)
Black Slavonian 0.138 (0.091) 0.121 (0.091) 0.101 (0.092) 0.072 (0.071)
Casertana 0.243 (0.112) 0.226 (0.110) 0.202 (0.110) 0.162 (0.100)
Cinta Senese 0.173 (0.064) 0.147 (0.063) 0.111 (0.052) 0.075 (0.050)
Gascon 0.213 (0.042) 0.175 (0.042) 0.132 (0.041) 0.087 (0.031)
Iberian 0.139 (0.063) 0.111 (0.061) 0.082 (0.060) 0.056 (0.050)
Krškopolje 0.125 (0.061) 0.109 (0.060) 0.089 (0.063) 0.065 (0.052)
Lithuanian Indigenous Wattle 0.135 (0.042) 0.114 (0.040) 0.089 (0.044) 0.060 (0.032)
Lithuanian White Old Type 0.152 (0.052) 0.122 (0.050) 0.093 (0.051) 0.063 (0.050)
Majorcan Black 0.134 (0.061) 0.108 (0.060) 0.081 (0.051) 0.055 (0.052)
Mora Romagnola 0.409 (0.062) 0.386 (0.062) 0.345 (0.060) 0.286 (0.061)
Moravka 0.118 (0.092) 0.103 (0.091) 0.087 (0.080) 0.068 (0.071)
Nero Siciliano 0.085 (0.084) 0.073 (0.082) 0.059 (0.081) 0.043 (0.072)
Sarda 0.101 (0.092) 0.088 (0.094) 0.073 (0.092) 0.053 (0.070)
Schwäbisch–Hällisches 0.147 (0.051) 0.120 (0.052) 0.093 (0.052) 0.065 (0.051)
Swallow-bellied Mangalitsa 0.197 (0.052) 0.175 (0.050) 0.146 (0.050) 0.107 (0.042)
Turopolje 0.390 (0.101) 0.362 (0.101) 0.311 (0.093) 0.238 (0.081)
Italian Duroc 0.267 (0.043) 0.211 (0.041) 0.157 (0.041) 0.104 (0.042)
Italian Landrace 0.142 (0.042) 0.104 (0.040) 0.069 (0.031) 0.041 (0.031)
Italian Large White 0.143 (0.041) 0.106 (0.042) 0.075 (0.040) 0.046 (0.030)
islands and the total length of the genome fractions covered et al. 2020a). Cinta Senese and Italian Duroc had an ROH
by these regions were similar in all breeds and ranged from island including other genes that have been shown to affect
n = 7 (Mora Romagnola) to n = 20 (Italian Landrace) and body size (caspase 10, CASP10; and non-SMC condensin I
from 19.83 Mb (Casertana) to 44.51 Mb (Turopolje). These complex subunit G, NCAPG; Rubin et al. 2012).
methods could capture different information from the A functional overview of breed-specific ROH islands
analyzed populations. It seems, however, that these two identified using the SROH-based threshold method was
latter methods are, to some extent, biased by the genetic obtained via over-representation analyses of GO biological
structure of the analyzed populations and by the method- processes (Table S12). A few terms characterizing ROH
ologies that are applied. islands were detected in two breeds (Krškopolje and
The complete list of ROH islands identified in the Swallow-bellied Mangalitsa) only. Terms were general and
investigated breeds, using the SROH based-threshold method, included pattern recognition receptor signaling pathway,
including the genes annotated in these regions, is reported toll-like receptor signaling pathway, zymogen activation,
in Table S11. Several breeds had ROH islands encompassing cellular response to radiation and negative regulation of cell
genes that are well known to affect exterior traits, which differentiation.
might contribute to differentiate these pig breeds. For
example, Gascon and Turopolje had an ROH island on
Discussion
SSC6 that includes the melanocortin 1 receptor (MC1R) gene
and Krškopolje and Turopolje had another ROH island on The demographic history of a population can be inferred
SSC8 which includes the v-kit Hardy-Zuckerman 4 feline using information from the average distribution, coverage,
sarcoma viral oncogene homolog (KIT) gene. These two genes size and patterns of ROH that can be identified in the
are well known to affect coat colour and colour patterns individuals belonging to the population using high-density
(Fontanesi & Russo 2013). Two genes that are known to SNP data (Ceballos et al. 2018). In this study, we detected
affect vertebral number (nuclear receptor subfamily 6 group A ROHs in the genome of pigs from 20 autochthonous and
member 1, NR6A1 on SSC1; and vertnin, VRTN on SSC7; three commercial breeds and compared the obtained ROH
Mikawa et al. 2007, 2011) were in two ROH islands genome landscapes patterns. These breeds represent popu-
observed in Italian Landrace and in Schwäbisch–Hällisches lations derived from several countries and originating in
breeds respectively. Moravka and Schwäbisch–Hällisches different production systems that largely contributed to
breeds had an ROH island on SSC5 including the methionine shape their genetic structures.
sulfoxide reductase B3 (MSRB3) gene whose variants have This study could allow reconstruction, to some extent, of
been associated with ear size in pigs (Chen et al. 2018; Bovo the genetic events and history that contributed to defining
© 2021 Stichting International Foundation for Animal Genetics, 52, 155–170164 Schiavo et al.
Figure 3 Boxplots of the FROH distri-
bution in the 23 breeds: (a) FROH1; (b)
FROH4; (c) FROH8; (d) FROH16. Acro-
nyms of the breeds are explained in
Table 1 and Table S1.
the current genetic pools of the investigated breeds. ROH- owing to recent pedigree inbreeding loops, accompanied by
based fingerprints are left in the analyzed breeds and can be a small Ne. The large SROH standard deviation indicates a
used to divide the 23 breeds into a few macro-groups that low uniformity of the animals, which means that there
could have independently experienced similar genetic tra- might be different substructures or heterogeneities in the
jectories, as explained below. population or that an original bottleneck or founder effect
The ROH complement of recently inbred populations is could have increased the range of ROH size. Recent
defined by a large number of ROHs with large size and a inbreeding features accompanied by a constituting bottle-
large fraction of the genome covered by ROHs (high SROH), neck series of events can be clearly evidenced in a few
© 2021 Stichting International Foundation for Animal Genetics, 52, 155–170Runs of homozygosity in pigs 165
Table 3 The number of ROH islands and information on the genome covered by ROH islands identified in the 23 pig breeds with the method that
used the SROH based-threshold.
Number of Genome covered Average length
Breed Frequency1 ROH islands (Mb)2 (Mb)3
Alentejana 19/48 (40%) 12 35.88 2.99 (2.25)
Apulo-Calabrese 38/53 (72%) 0 – –
Basque 36/39 (92%) 7 16.58 2.37 (1.84)
Bı´sara 20/48 (42%) 7 13.32 1.90 (1.36)
Black Slavonian 19/49 (39%) 3 2.64 0.88 (0.44)
Casertana 29/53 (55%) 7 10.23 1.46 (1.52)
Cinta Senese 23/53 (43%) 26 69.37 2.67 (2.42)
Gascon 27/48 (56%) 12 27.99 2.33 (2.00)
Iberian 19/48 (40%) 15 36.74 2.45 (1.49)
Krškopolje 18/52 (35%) 15 34.89 2.33 (2.14)
Lithuanian Indigenous Wattle 19/48 (40%) 15 41.81 2.79 (2.00)
Lithuanian White Old Type 21/48 (44%) 22 44.84 2.04 (2.19)
Majorcan Black 19/48 (40%) 12 27.23 2.27 (1.87)
Mora Romagnola 46/48 (96%) 4 12.34 3.09 (3.41)
Moravka 17/49 (35%) 9 19.11 2.12 (2.65)
Nero Siciliano 14/48 (29%) 4 7.41 1.85 (1.83)
Sarda 16/48 (33%) 0 – –
Schwäbisch–Hällisches 20/49 (41%) 17 36.40 2.14 (1.76)
Swallow-bellied Mangalitsa 25/50 (50%) 8 23.41 2.93 (1.89)
Turopolje 44/50 (88%) 17 80.82 4.75 (3.50)
Italian Duroc 32/48 (67%) 19 92.85 4.89 (6.48)
Italian Landrace 20/48 (42%) 32 75.03 2.34 (2.48)
Italian Large White 20/48 (42%) 12 46.51 3.88 (2.57)
The three blocs indicate the two different thresholds that can be used to define an island. For each block, there is information about the number of
animals that is used as threshold to define an island, the number of islands identified, the total length of genome that is covered by islands and the
average length of islands.
1
Frequency of the SNPs in an ROH, which identifies the threshold to declare an ROH island. The frequency has been calculated by dividing the
number of animals needed to reach the defined level by the number of animals retained after genotyping (see Table S2).
2
Sum of the length of the chromosome regions in the genome covered by ROH islands in Mb.
3
Average length of the ROH islands (standard deviation) in Mb.
Italian local breeds, i.e. Apulo-Calabrese, Casertana, Mora considered populations. A similar genetic history seems
Romagnola and Turopolje. The high level of inbreeding evident in the Italian Duroc breed (which, however, had a
could have masked regions that harbor selection signatures larger Ne; Table S3), reflecting deeper parental relatedness
as most of these breeds showed a low number of ROH and consistent with an original strong bottleneck that
islands (from 0 to 7, considering the SROH-based method; occurred at the beginning of the 1990’ when the heavy pig
Table 3), apart from Turopolje, which seems to maintain a selection programme was defined and differentiated the
quite high level of ROH-specific regions (n = 17; Table 3). Italian Duroc breed from other Duroc lines (Bosi & Russo
These breeds need to be carefully managed to reduce or 2004).
control the high level of inbreeding. Programs in this Breeds that experienced recent admixtures had, in
direction are currently under way in the Italian breeds general, a low nROH and as a proportion, had a higher
(ANAS 2020). frequency of short–medium ROHs than long ROHs, with
Other breeds have a quite high SROH levels but with short high Ne. This group included the two breeds that had
ROHs, indicating the occurrence of a past bottleneck and nROH less than 30, SROH less than 300.00 Mb and Ne
then a quite good isolation of the genetic pool. This is a case greater than 55, i.e. Nero Siciliano and Sarda, for which
that can be observed in the two French breeds, Basque and the ROH-derived landscape was in agreement with the large
Gascon, and in the Italian breed Cinta Senese. Differences in variability observed in candidate gene markers and SNP
the three breeds are evident in the number of ROH islands chip data (Muñoz et al. 2018, 2019). Other breeds (i.e.
that might indicate a low–medium level of specific signa- Alentejana, Black Slavonian, Krskopolje, Lithuanian Indige-
tures of selection in the French breeds (7 in the Basque that nous Wattle and Moravka) had similar ROH patterns to
also had the largest nROH among the three – and 12 in the those described for these two Italian breeds even if not so
Gascon) and a high level of characterizing signatures in the extreme (nROH < 40, SROH < 350.00 Mb). They are a
Cinta Senese (26 ROH islands) probably due to different heterogeneous group of populations that might have
levels of selection pressures and adaptation of the three experienced some moderate introgression over the period
© 2021 Stichting International Foundation for Animal Genetics, 52, 155–170166 Schiavo et al.
Figure 4 Manhattan plots showing ROH islands in a few analyzed pig breeds with extreme patterns. The blue line indicates the SROH-based
threshold, the red line indicates the frequency corresponding to the top 1% most frequent SNP in the population and the green line indicates the
50% of individuals within the population. The y-axes indicate the number of animals carrying that SNP in an ROH.
of their constitution or these events might have occurred in genome included in ROH islands than the Iberian breed.
the past and at present they maintain a moderate level of This fact could also be due to the high level of genetic
variability. The low–medium number of ROH islands (from diversity observed within the Iberian breed, sometimes
3 for Moravka to 15 for Krskopolje) indicates a low–medium higher than in some other European pig breeds (Fabuel
level of differentiation in terms of specific ROH features. et al. 2004). This is consistent with the structure of these
Another group of intermediate breeds (with some features three populations, with the two Italian breeds being
partially overlapping with those of the previous group) with derived by a small selection of nuclei specifically address-
medium nROH and, in general, with a medium level of ing a selection program for heavy pigs. The presence of
inbreeding (nROH > 40 and SROH > 300) includes Bı́sara, common features among breeds raised in different coun-
Lithuanian White Old Type, Majorcan Black, Schwäbisch–- tries suggests that a few ROH islands might capture some
Hällisches and Swallow-bellied Mangalitsa. adaptive features that are shared across populations and
Three other breeds, i.e. Iberian, Italian Landrace and production systems.
Italian Large White, had characteristic ROH-derived fea- The general picture depicted by the ROH profiles was able
tures of commercial breeds or large populations, as expected to summarize the main elements that characterize the
from their large population size (consistent with the large population structure of the analyzed breeds. For a few of
Ne). The two Italian breeds had some indicators of more them, the potential burden derived by the ROH should be
specific differentiations and signatures of selection with a evaluated with attention. An increased homozygosity for
higher number of nROH, lower Ne and larger fraction of the (partially) recessive detrimental mutations maintained at
© 2021 Stichting International Foundation for Animal Genetics, 52, 155–170Runs of homozygosity in pigs 167
Figure 5 Similarity plot between patterns of
homozygosity between pairs of breeds. Color
intensity and size of the squares are proportional to
the similarity values.
low frequency in populations by mutation–selection balance morphological or adaptative features that characterize the
has been suggested to be one of the main causes of uniqueness of these genetic resources. Some of the ROH
inbreeding depression (Charlesworth & Willis 2009). islands contained genes responsible for domestication
Genomic inbreeding measures can help to manage all of signatures related to exterior traits and morphological
these pig populations. In this study, we also calculated adaptation (i.e. coat colour genes, MC1R and KIT, Fontanesi
several other genomic inbreeding parameters (FHOM, Fhat1, & Russo 2013; vertebral number, NR6A1 and VRTN,
Fhat2, Fhat3 and FGRM) that have already been proposed to Mikawa et al. 2007, 2011; parts of the body and body size,
capture the inbreeding level from genomic information CASP10, MSRB3 and NCAPG, Rubin et al. 2012; Chen et al.
(VanRaden et al. 2011; Yang et al. 2011) with the main aim 2018), indicating that fixation or increased frequency for
being to evaluate their relationships with FROH. The some haplotypes containing breed-specific alleles or features
correlation between FROH and the other genomic inbreeding differentiating the domestic pool from wild boars could be
parameters in the analyzed breeds was in general low captured by ROHs.
expect for FHOM. Long ROH can be due to a general high ROHs can complement other methods that have
homozygosity level in the population. FROH-based measures been applied to extract signatures of selection in these
seem to be more appropriate than all other calculated pig breeds (Muñoz et al. 2018, 2019; Bovo et al. 2020a,b)
parameters and are highly correlated with Ne, indicating and can provide additional information that is useful
that they better reflect the population structure and then to design conservation plans and mating strategies to
the effective inbreeding level of the animals, as we already maintain the diversity of these pig genetic resources.
reported comparing these measures with pedigree-based
inbreeding estimations (Schiavo et al. 2020b). For all 20
Acknowledgements
autochthonous breeds, the results confirmed the general
low Ne for most breeds as already reported by Muñoz et al. This work has been funded by University of Bologna RFO
(2019), who applied a similar estimation method. 2016-2019 programs and by the European Union’s Horizon
The method used to identify ROH islands considers the 2020 research and innovation programme (TREASURE
level of inbreeding of the breeds to reduce the biases derived project – grant agreement no. 634476). The content of this
by the large fraction of the genome covered by ROH in work reflects only the authors’ view and the European
highly inbred populations and to increase the probability of Union Agency is not responsible for any use that may be
capturing the signatures of selection able to explain made of the information it contains.
© 2021 Stichting International Foundation for Animal Genetics, 52, 155–170168 Schiavo et al.
Conflict of interest Chen E.Y., Tan C.M., Kou Y., Duan Q., Wang Z., Meirelles G.V.,
Clark N.R. & Ma’ayan A. (2013) Enrichr: interactive and
The authors declare they do not have any competing collaborative HTML5 gene list enrichment analysis tool. BMC
interests. Bioinformatics 14, 1–14.
Fabuel E., Barragán C., Silió L., Rodrı́guez M.C. & Toro M.A. (2004)
Analysis of genetic diversity and conservation priorities in Iberian
Data availability pigs based on microsatellite markers. Heredity 93, 104–13.
Genotyping data of the autochthonous breeds can be shared Ferenčaković M., Sölkner J. & Curik I. (2013) Estimating autozy-
after the signature of an agreement on their use with the gosity from high-throughput information: effects of SNP density
and genotyping errors. Genetics Selection Evolution 45, 42.
TREASURE Consortium. Genotyping data of the commercial
Fontanesi L., Galimberti G., Calò D.G. et al. (2012) Identification
breeds can be shared after the signature of an agreement on
and association analysis of several hundred single nucleotide
their use with the University of Bologna. Please address all
polymorphisms within candidate genes for back fat thickness in
requests to luca.fontanesi@unibo.it. Italian large white pigs using a selective genotyping approach.
Journal of Animal Science 90, 2450–64.
Fontanesi L. & Russo V. (2013) Molecular genetics of coat colour in
References
pigs. Acta Agriculturae Slovenica Suppl. 4, 15–20.
ANAS (2020) Registro Anagrafico. Retrieved on 6th October 2020, Fontanesi L., Schiavo G., Galimberti G., Calò D.G. & Russo V.
from http://www.anas.it/ (2014) A genomewide association study for average daily gain in
Ashburner M., Ball C.A., Blake J.A. et al. (2000) Gene ontology: tool Italian large white pigs. Journal of Animal Science 92, 1385–94.
for the unification of biology. Nature Genetics 25, 25–9. Gibson J., Morton N.E. & Collins A. (2006) Extended tracts of
Barbato M., Orozco-terWengel P., Tapio M. & Bruford M.W. (2015) homozygosity in outbred human populations. Human Molecular
SNeP: a tool to estimate trends in recent effective population size Genetics 15, 789–95.
trajectories using genome-wide SNP data. Frontiers in Genetics 6, Gomez-Raya L., Priest K., Rauw W.M. et al. (2008) The value of
109. DNA paternity identification in beef cattle: examples from
Bertolini F., Cardoso T.F., Marras G., Nicolazzi E.L., Rothschild M.F. Nevada’s free-range ranches. Journal of Animal Science 86,
& Amills M. (2018) Genome-wide patterns of homozygosity 17–24.
provide clues about the population history and adaptation of Gorssen W., Meyermans R., Buys N. & Janssens S. (2020) SNP
goats. Genetics Selection Evolution 50, 59. genotypes reveal breed substructure, selection signatures and
Bosi P. & Russo V. (2004) The production of the heavy pig for high highly inbred regions in Piétrain pigs. Animal Genetics 51,
quality processed products. Italian Journal of Animal Science 3, 32–42.
309–21. Grilz-Seger G., Druml T., Neuditschko M., Dobretsberger M.,
Bovo S., Ribani A., Muñoz M. et al. (2020a) Whole-genome Horna M. & Brem G. (2019) High-resolution population
sequencing of European autochthonous and commercial pig structure and runs of homozygosity reveal the genetic archi-
breeds allows the detection of signatures of selection for tecture of complex traits in the Lipizzan horse. BMC Genomics
adaptation of genetic resources to different breeding and 20, 174.
production systems. Genetics Selection Evolution 52, 33. Grilz-Seger G., Druml T., Neuditschko M., Mesarič M., Cotman M. &
Bovo S., Ribani A., Muñoz M. et al. (2020b) Genome-wide detection Brem G. (2019) Analysis of ROH patterns in the Noriker horse
of copy number variants in European autochthonous and breed reveals signatures of selection for coat color and body size.
commercial pig breeds by whole-genome sequencing of DNA Animal Genetics 50, 334–46.
pools identified breed-characterising copy number states. Animal Grilz-Seger G., Mesarič M., Cotman M., Neuditschko M., Druml T. &
Genetics 51, 541–56. Brem G. (2018) Runs of homozygosity and population history of
Čandek-Potokar M. & Nieto L.R.M. (2019) European Local Pig Breeds three horse breeds with small population size. Journal of Equine
– Diversity and Performance. A study of project TREASURE. Veterinary Science 71, 27–34.
IntechOpen. https://www.intechopen.com/books/european-loca Kios D., van Marle-Köster E. & Visser C. (2012) Application of DNA
l-pig-breeds-diversity-and-performance-a-study-of-project-trea markers in parentage verification of Boran cattle in Kenya.
sure Tropical Animals and Health Prodution 44, 471–6.
Ceballos F.C., Joshi P.K., Clark D.W., Ramsay M. & Wilson J.F. Kirin M., McQuillan R., Franklin C.S., Campbell H., Mckeigue
(2018) Runs of homozygosity: windows into population history P.M. & Wilson J.F. (2010) Genomic runs of homozygosity
and trait architecture. Nature Review Genetics 19, 220–34. record population history and consanguinity. PLoS One 5,
Chang C.C., Chow C.C., Tellier L.C.A.M., Vattikuti S., Purcell S.M. & e13996.
Lee J.J. (2015) Second-generation PLINK: rising to the challenge Knief U., Kempenaers B. & Forstmeier W. (2017) Meiotic recom-
of larger and richer datasets. Gigascience 4, 7. bination shapes precision of pedigree- and marker-based esti-
Charlesworth D. & Willis J.H. (2009) The genetics of inbreeding mates of inbreeding. Heredity 118, 239–48.
depression. Nature Review Genetics 10, 793–6. Kristensen T.N., Pedersen K.S., Vermeulen C.J. & Loeschcke V.
Chen C., Liu C., Xiong X., Fang S., Yang H., Zhang Z., Ren J., Guo Y. (2010) Research on inbreeding in the “omic” era. Trends in
& Huang L. (2018) Copy number variation in the MSRB3 gene Ecology and Evolution 25, 44–52.
enlarges porcine ear size through a mechanism involving miR- Leutenegger A.L., Prum B., Génin E., Verny C., Lemainque A.,
584-5p. Genetics Selection Evolution 50, 72. Clerget-Darpoux F. & Thompson E.A. (2003) Estimation of the
© 2021 Stichting International Foundation for Animal Genetics, 52, 155–170You can also read