Transcript isoform sequencing reveals widespread promoter-proximal transcriptional termination in Arabidopsis - Nature
←
→
Page content transcription
If your browser does not render page correctly, please read the page content below
ARTICLE
                  https://doi.org/10.1038/s41467-020-16390-7                OPEN

                  Transcript isoform sequencing reveals widespread
                  promoter-proximal transcriptional termination in
                  Arabidopsis
                  Quentin Angelo Thomas 1, Ryan Ard 1, Jinghan Liu                                1,   Bingnan Li2, Jingwen Wang             2,

                  Vicent Pelechano 2 & Sebastian Marquardt 1 ✉
1234567890():,;

                  RNA polymerase II (RNAPII) transcription converts the DNA sequence of a single gene into
                  multiple transcript isoforms that may carry alternative functions. Gene isoforms result from
                  variable transcription start sites (TSSs) at the beginning and polyadenylation sites (PASs) at
                  the end of transcripts. How alternative TSSs relate to variable PASs is poorly understood.
                  Here, we identify both ends of RNA molecules in Arabidopsis thaliana by transcription isoform
                  sequencing (TIF-seq) and report four transcript isoforms per expressed gene. While intra-
                  genic initiation represents a large source of regulated isoform diversity, we observe that ~14%
                  of expressed genes generate relatively unstable short promoter-proximal RNAs (sppRNAs)
                  from nascent transcript cleavage and polyadenylation shortly after initiation. The location of
                  sppRNAs correlates with the position of promoter-proximal RNAPII stalling, indicating that
                  large pools of promoter-stalled RNAPII may engage in transcriptional termination. We pro-
                  pose that promoter-proximal RNAPII stalling-linked to premature transcriptional termination
                  may represent a checkpoint that governs plant gene expression.

                  1 Copenhagen Plant Science Centre, Department of Plant and Environmental Sciences, University of Copenhagen, Frederiksberg, Denmark. 2 SciLifeLab,

                  Department of Microbiology, Tumor and Cell Biology, Karolinska Institutet, Solna, Sweden. ✉email: sebastian.marquardt@plen.ku.dk

                  NATURE COMMUNICATIONS | (2020)11:2589 | https://doi.org/10.1038/s41467-020-16390-7 | www.nature.com/naturecommunications                             1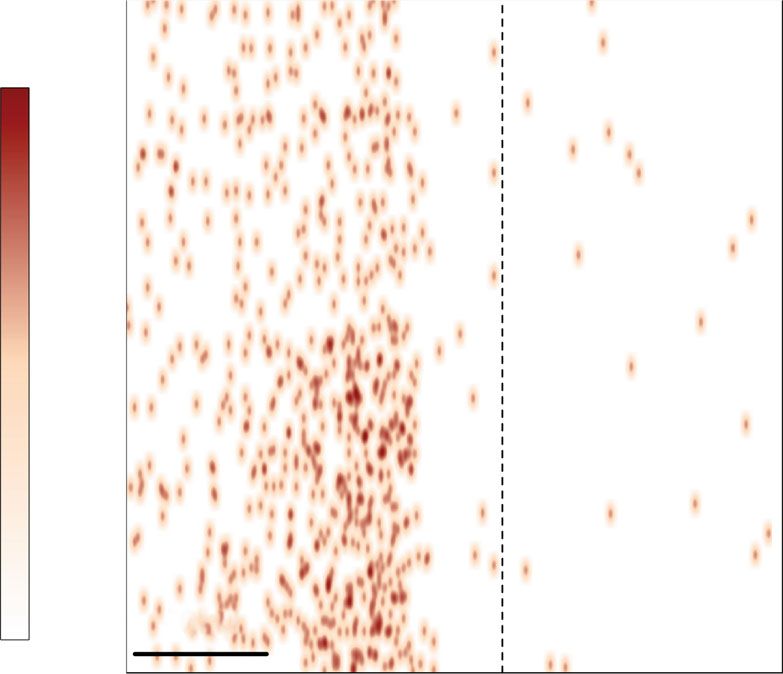
ARTICLE                                                                 NATURE COMMUNICATIONS | https://doi.org/10.1038/s41467-020-16390-7

O
         rganisms respond to changing environments by regulat-               active RNAPII accumulates21. In metazoans, DRB sensitivity-
         ing the transcriptional activity of RNA polymerase II               inducing factor (DSIF) and negative elongation factor (NELF)
         (RNAPII) to adjust gene expression1. However, RNAPII                stabilise RNAPII pausing22. RNAPII transcription elongation
transcription generates distinct mRNA and non-coding RNA                     factors such as positive transcription elongation factor b (p-TEFb)
isoforms derived from a single gene2. As alternative gene isoforms           and polymerase associate factor I (PAF-I) trigger disassociation of
may have opposing functions3, the identification of transcript                NELF and DSIF and promote transcriptional elongation23,24. The
isoform diversity can be key to resolve molecular mechanisms                 stability of paused RNAPII complexes in metazoans varies greatly
underpinning causative genetic variation. The selection of tran-             between genes25–27, supporting the idea that RNAPII turnover
scription start sites (TSSs) represents a key source of transcript           affects the accumulation of RNAPII complexes near TSSs28.
heterogeneity. The majority of TSSs map to gene promoter                     RNAPII turnover at PASs as part of transcriptional termination
regions, where DNA sequence elements recruit RNAPII to initiate              coincides with peaks of RNAPII density11. As there is known
transcription in nucleosome-depleted regions (NDRs). The pre-                RNAPII accumulation at PASs at the ends of genes, it is possible
cise positions of TSSs may form a focused pattern with one                   that the accumulation of RNAPII at the pausing sites is a result of
predominant TSS position, or a dispersed pattern, where TSSs can             the same process, but coupled to promoter-proximal poly-
be detected within a broader sequence window that is char-                   adenylation. Indeed, short transcripts at genes with unstable
acteristic of housekeeping genes4. A dispersed pattern of initiation         promoter–promoter proximal RNAPII pausing are reported in
maintains steady levels of transcription, yet results in RNA                 Drosophila29 that rely on transcriptional termination by the
molecules that differ in their 5′ sequences, which may affect                Integrator complex30,31, that also functions in 3′-end processing
transcript stability5 or alternative translation6. Additional tran-          of relatively short snRNA32. The prevalence of promoter-
script isoforms result from transcription on the antisense strand            proximal transcriptional termination in additional organisms
of genes to yield long non-coding RNA (antisense lncRNA)7.                   and potential roles of this phenomenon in gene expression
Antisense lncRNA transcription may regulate expression of the                remain an active research area.
corresponding mRNA transcript8. Transcriptional initiation                      Regulation of gene expression underpins key adjustments of
within genes (intragenic initiation) may result in mRNA isoforms             sessile organisms (e.g. plants) to changing environments. In
encoding protein variants lacking N-terminal protein domains9.               plants, a variable pattern of TSSs at gene promoters also con-
Chromatin-based mechanisms counter-acting intragenic TSSs                    tributes to heterogeneity of gene expression33. Although antisense
during RNAPII elongation could affect the diversity of proteins              lncRNA represent common gene isoforms, other gene isoforms
derived from a gene10. However, it remains an open question                  such as divergent lncRNA are less frequent compared to
whether intragenic TSSs usually connect to the canonical gene 3′-            metazoans34. Chromatin-based repression of intragenic RNAPII
end, or if short transcript isoforms are generated that may not be           initiation relies on histone chaperone activity of the FACT
translated.                                                                  complex. However, repression of intragenic TSSs during RNAPII
   Alternative transcriptional termination shapes isoform                    elongation in plants is associated with histone 3 lysine 4 mono-
expression through differential selection of the 3′-end of                   methylation (H3K4me1) rather than histone 3 lysine 36 tri-
transcripts11,12. Transcriptional termination at intragenic poly-            methylation (H3K36me3), highlighting intriguing diversity in the
adenylation sites (PASs) results in mRNA isoforms lacking C-                 use of chromatin-based signalling between organisms35. Plants
terminal protein domains and represents a mechanism regulating               and metazoans form equivalent CPSF/CstF protein complexes to
a wide range of biological processes12. In addition, the process of          mediate polyadenylation of mRNA36,37 and integrator to mediate
transcriptional termination is tightly connected to RNA surveil-             snRNA termination38. Similar to metazoans, nuclear exosome
lance pathways that determine RNA stability and nuclear                      variants perform transcript surveillance39,40. An expansion of the
export13. The nuclear exosome represents a 3′-to-5′ exonuclease              RRM-domain RNA-binding gene family in plants specifies
that associates with RNAPII to degrade nascent RNAs7. Tran-                  alternative polyadenylation sites41 and regulates key aspects of
scriptome analyses in nuclear exosome mutants thus reveal RNA                plant development42. Interestingly, plant genomes lack NELF
molecules that are transcribed yet rapidly targeted for RNA                  homologs yet display an accumulation of RNAPII near gene
degradation (i.e. cryptic transcripts), for example widespread               promoters43. A strong correlation between the position of the +1
divergent lncRNA transcription from gene promoter NDRs in the                nucleosome indicates a nucleosome-defined mechanism for
opposite direction respective to the mRNA7. Transcription in                 promoter-proximal stalling in plants34. The functional sig-
each direction of gene promoter NDRs is also selectively con-                nificance of promoter-proximal stalling for gene isoform
trolled at the level of initiation by chromatin-based                        expression in plants is unclear.
mechanisms14,15 and sequence-specific transcription factors16.                   Eukaryotic primary transcripts may extend up to a couple of
Binding sites for the spliceosomal small nuclear RNA (snRNA)                 megabases and provide extensive opportunities for co-
U1 selectively promote elongation of mRNA transcription over                 transcriptional regulation of gene isoform diversity. Commonly
divergent lncRNA transcription17. The suppression of premature               used transcriptomics methods based on short-read sequencing
transcriptional termination (i.e. telescripting) by U1 is distinct           detect either the TSS or the PAS of a given transcript. The con-
from the splicing function of U1 (ref. 18). pre-mRNA splicing                nections between alternative TSSs to variable PASs that are key
represents an additional mechanism to amplify gene isoform                   for gene isoform diversity thus remain poorly understood.
diversity through alternative combinations of exons19. In sum-               Transcript Isoform sequencing (TIF-seq) brings TSS/PAS pairs of
mary, alternative pre-mRNA processing activities during tran-                individual transcript molecules into close proximity during next-
scriptional elongation contribute to the transcript isoforms                 generation sequencing library construction to enable the identi-
generated from a single gene.                                                fication of both RNA ends44. TIF-seq resolves transcript hetero-
   RNAPII density profiles across genes typically show two peaks:             geneity in budding yeast, representing a small eukaryotic genome
a first peak near the TSSs, and a second peak near PASs. The peak             with low average transcript length45.
at PASs reflects a reduction of RNAPII movement that aids                        Here, we define TSS/PAS pairs for individual transcripts in the
nascent transcript cleavage and polyadenylation by eukaryotic                model plant Arabidopsis thaliana using an improved TIF-seq
cleavage and polyadenylation specificity factors (CPSF) and                   protocol suitable for larger genomes. TIF-seq data suggest on
cleavage stimulation factors (CstF)11,20. Peaks near TSSs repre-             average over four isoforms corresponding to variable TSS/PAS
sent RNAPII promoter-proximal pausing, where transcriptionally               pairs per expressed gene across different environmental

2                NATURE COMMUNICATIONS | (2020)11:2589 | https://doi.org/10.1038/s41467-020-16390-7 | www.nature.com/naturecommunications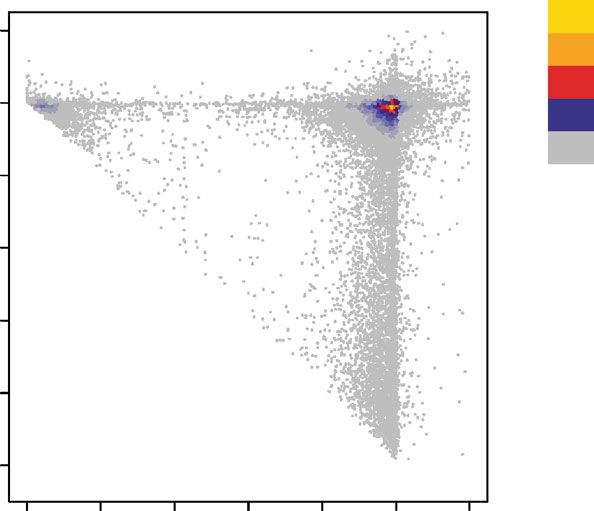
NATURE COMMUNICATIONS | https://doi.org/10.1038/s41467-020-16390-7                                                                 ARTICLE

conditions. TIF-seq in Arabidopsis nuclear exosome mutants                      Mapping cryptic transcript isoforms reveal sppRNAs. Tran-
reveals the cryptic transcriptome, in particular short promoter-                scriptome analyses in nuclear exosome mutants facilitate the
proximal RNAs (sppRNAs) from nascent transcript cleavage and                    detection of many cryptic RNA species7. Arabidopsis mutants
polyadenylation shortly after initiation. The location of sppRNAs               lacking the RNA helicase HUA ENHANCER 2 (HEN2) display
coincides with promoter-proximal RNAPII stalling. These data                    defective exosome activity40. We performed TIF-seq in the hen2-2
connect promoter-proximal RNAPII stalling and transcriptional                   mutant to map cryptic transcript isoforms in Arabidopsis. Bio-
termination in plants, with important implications for the reg-                 logical repeats of hen2-2 TIF-seq libraries correlated well (r =
ulation of gene expression in biotechnology.                                    0.99, Supplementary Fig. 5a), yet we could not detect an increase
                                                                                in transcript isoforms per gene compared to wild type (Supple-
                                                                                mentary Fig. 5b). TIF-seq data of hen2-2 mutants revealed an
Results
                                                                                increased proportion of intergenic transcripts and antisense iso-
Mapping transcript isoform heterogeneity in Arabidopsis. We
                                                                                forms39 (Fig. 3a, b). Interestingly, we discovered a high propor-
mapped corresponding TSS/PAS pairs for individual RNA
                                                                                tion of internal termination, representing prematurely terminated
molecules genome-wide in Arabidopsis thaliana seedlings using
                                                                                transcripts (Fig. 3b). In particular, TIF-seq data in hen2-2
an improved TIF-seq protocol45 (Methods; Supplementary Figs. 1
                                                                                mutants resolved a population of transcripts with 3′-ends in
and 2). We compared transcript boundaries detected by TIF-seq
                                                                                close proximity to promoter TSSs (Fig. 3c). Size distribution plots
to boundaries determined by methods identifying TSSs35 and
                                                                                of transcript isoforms show that short (
ARTICLE NATURE COMMUNICATIONS | https://doi.org/10.1038/s41467-020-16390-7
a b 5′UTR 3′UTR c
ORF
GTL1 - AT1G33240 0.5 kb Density
TIF-PASs
TIF cluster categories
50 Overlap whole ORF Max
Internal initiation
TSS
Internal Min
160
TIF-TSSs
Internal termination
TSS
PAS
PAS TSS PAS
TSS PAS
d e
42%
TIF-Seq clusters categories
wild type 20%
Overlapping whole ORFs 12%
TIF cluster variability
Overlap whole ORF (80%) 7%
Internal initiation (15%)
5%
Internal termination (3%)
Internal (1%) 5%
Intergenic (NATURE COMMUNICATIONS | https://doi.org/10.1038/s41467-020-16390-7 ARTICLE
a b
TIF cluster categories in TIF cluster categories in
spt16-1 ssrp1-2
Overlap whole ORF (82%) Overlap whole ORF (83%)
Internal initiation (13%) Internal initiation (13%)
Internal termination (2%) Internal termination (2%)
Internal (1%) Internal (1%)
Intergenic (ARTICLE NATURE COMMUNICATIONS | https://doi.org/10.1038/s41467-020-16390-7
a TIF cluster categories b
in hen2–2
2
Log2 fold-change
Overlap whole ORF (75%)
hen2-2/wild type
Internal initiation (14%)
Internal termination (6%) 1
Internal (3%)
Intergenic (1%)
Antisense (NATURE COMMUNICATIONS | https://doi.org/10.1038/s41467-020-16390-7 ARTICLE Fig. 3 TIF-seq in hen2-2 reveals promoter-proximal termination. a Pie chart of TIF-cluster categories proportions in hen2-2 mutants. b Log2 fold-change of TIF-cluster categories in hen2-2 compared to wild type. Colour code as indicated in a. c Scatterplot of TIF-cluster TSS/PAS pairs in hen2-2. Red arrow indicates TSS/PAS pairs within initiation regions. The colour scale represents 2D position enrichment density of clusters from low (grey) to high (yellow). d TIF-cluster sizes in wild type (n = 41,190) and hen2-2 (n = 48,225). Black arrow indicates enrichment of short TUs in hen2-2. e Distribution of short TIF- clusters sizes (
ARTICLE                                                                                      NATURE COMMUNICATIONS | https://doi.org/10.1038/s41467-020-16390-7

                a      TIF cluster categories in
                                                                                                   b   TIF cluster categories in
                            wild type 4 °C                                                                   hen2-2 4 °C

                                                             Overlap whole ORF (82%)                                                          Overlap whole ORF (71%)

                                                             Internal initiation (14%)                                                        Internal initiation (15%)

                                                             Internal termination (2%)                                                        Internal termination (7%)

                                                             Internal (1%)                                                                    Internal (4%)

                                                             Intergenic (
NATURE COMMUNICATIONS | https://doi.org/10.1038/s41467-020-16390-7 ARTICLE
a b c
pNET-seq 1 kb p < 0.001
Promoter pNET-seq signal
120
0.08 + Strand 36
90
0.06 60
pNET-seq signal
0.06
pNET-seq signal
30
0
0.04
0.04
– Strand 36
sppRNA sppRNA
genes MPK20 (AT2G42880) genes
0.02 0.02 Control
genes
TIF clusters in hen2-2
0.00 0.00
−200 −100 sppRNA 100 200 −200 −100 TSS 100 200
PAS
d GAGAR e
Density p < 2.22e−16
Max
Control genes
0.000004
Average GAGAR motif density
downstream of TSS
0.000003
0.000002
sppRNA genes
0.000001
0.000000
Min
Control sppRNA
70 bp genes genes
–200 –100 TSS 75
f RGCCCAW g
Density p < 2.22e−16
Control genes
Max
0.000006
Average RGCCCAW motif density
upstream of TSS
0.000004
sppRNA genes
0.000002
0.000000
Min 70 bp
Control sppRNA
genes genes
–200 –100 TSS 75
factors may balance bursts of productive full-length isoform transcript isoforms per expressed gene on average, insensitive to
production with promoter-proximal termination events to temperature variations, defective chromatin assembly and defec-
control plant gene expression. tive nuclear RNA degradation. A strength of TIF-seq is the ability
to capture transcript isoform diversity arising through hetero-
geneous transcript ends. We note that TIF-seq would miss iso-
Discussion form diversity that arises in the middle of transcripts, for example
Our improved TIF-seq protocol for genomes larger than budding through alternative pre-mRNA splicing19. Moreover, transcripts
yeast45 revealed transcript isoform diversity of four genotypes at carrying epitranscriptome variations such as alternative 5′-cap
ambient temperature and two genotypes during cold treatment, structures57 may be incompatible with our sequencing library
totalling 12 TIF-seq libraries. Remarkably, we identified four strategy. The combination of TIF-seq complemented by long read
NATURE COMMUNICATIONS | (2020)11:2589 | https://doi.org/10.1038/s41467-020-16390-7 | www.nature.com/naturecommunications 9ARTICLE NATURE COMMUNICATIONS | https://doi.org/10.1038/s41467-020-16390-7
Fig. 5 RNAPII stalling coincides with regulated termination near Arabidopsis promoters. a Wild-type pNET-seq (8WG16)43 coverage averaged around
sppRNA PAS genomic positions for sppRNAs genes (n = 1155). b Genome browser screenshot of wild-type pNET-seq reads at the MPK20 gene. TIF-cluster
diagram indicates annotates mRNA and sppRNA transcript isoforms. Red arrow indicates sppRNAs TIF-cluster. c Wild-type pNET-seq (8WG16)43
coverage averaged around sppRNA PAS genomic positions for sppRNAs genes (n = 1155) and a control set of genes displaying equal distribution of
nascent gene body transcription (n = 1153). Inset violin plot depicts significantly increased average pNET-seq signal within first 150 nt from TSS for genes
with sppRNAs (Wilcoxon test: p < 2.2e−16) compared to the control genes. Shading in a and c represents the calculated confidence interval on the mean of
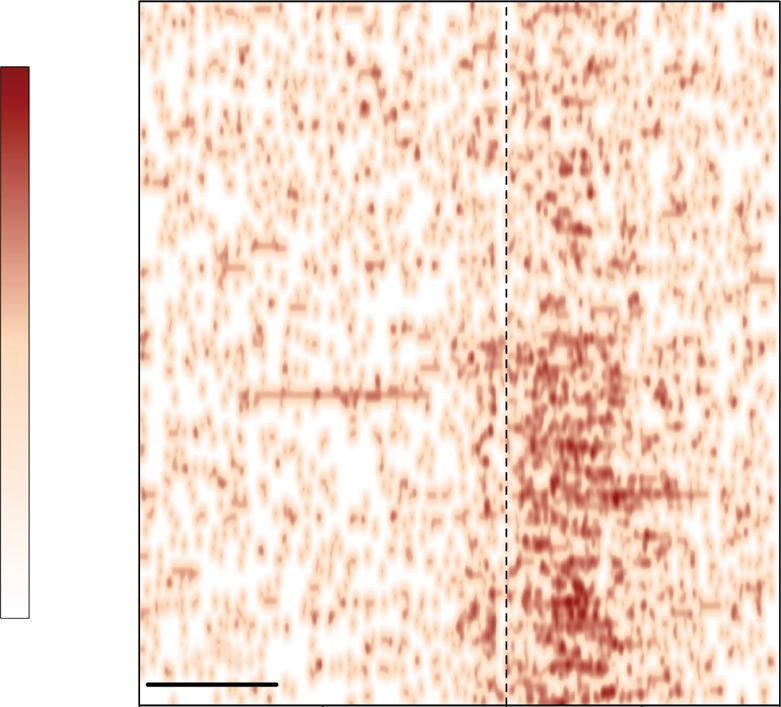
95%. d Heatmap of cis-element GAGA-box (GAGAR) in genomic regions 200 bp upstream and 150 bp downstream of the TSS of control genes with equal
pNET-seq nascent transcription distribution to sppRNA genes (n = 1155). e Violin plot of the average GAGAR density downstream of the TSS (two-sided
Wilcoxon test: p < 2.2e−16). f Heatmap of cis-element TCP-binding motif (RGCCCAW) in genomic regions 200 bp upstream and 150 bp downstream of
the TSS of control genes with equal pNET-seq nascent transcription distribution to sppRNA genes (n = 1155). The colour scale in d and f represents motif
frequency from low (white) to high (red). g Violin plot of the average GAGAR density upstream of the TSS (two-sided Wilcoxon test: p < 2.2e−16). The
inset box in c and boxes in e and g bounds the iQR divided by the median, and whiskers extend to a maximum of 1.5× iQR beyond the box.
a 200 b
* 12
Wild type
Wild type
100 cstf64–2
dsp1–1
* PAT-seq
dsp4–1 12
Relative sppRNA expression
cdkc2–2
vip5 cstf77
15
***
to wild type
10 Wild type pNET-seq
*
***
MK1 - AT4G29810
***
5
***
* * TIF-seq
hen2–2
0
GRF10 HSC70 MPK20 RPL18e STV1
AT1G22300 AT5G02500 AT2G42880 AT1G70600 AT3G53020
c p < 0.001 d 50 p < 0.001 e
50
Promoter-proximal Premature termination
40 stalling
40
Exosome
NS. AA
A
AA
30 NS.
TPM at PAS
TPM at PAS
30
RNAPII
20 TSS 100 nts RNAP
20 II
10 10
EFs supress cleavage
0 0
RNAPII
AP
A
RNAPII
P
RNAPII
cstf77 cstf77 Wild-type Wild-type cpsf100 cpsf100 Wild-type Wild-type
control sppRNA control sppRNA control sppRNA control sppRNA
genes genes genes genes genes genes genes genes
Fig. 6 RNAPII elongation and termination shape transcript isoforms. a RT-qPCR analyses of sppRNA for five genes with sppRNAs in wild type, cdkc2-2,
vip5, dsp1-1,dsp4-1 and cstf64-2. Data are presented as mean values ± SEM from three independent experiments. Black circles indicate individual data points
(n = 3). Single asterisk denotes p < 0.05, two asterisks denote p < 0.01, whereas three asterisks denote p < 0.001 between mutant and wild type by two-
sided Student’s t-test. b Genome browser screenshot of the MK1 gene. Visualisation of PAT-seq data for wild type (red) and cstf77 (orange), pNET-seq
data (black) and hen2-2 TIF-seq data. Black arrow represents the increase of PAT-Seq signal in cstf77. c Distribution of TPM at mRNA PAS for sppRNA
genes (n = 1173) and its specific control set of genes (n = 1170) (Methods) in wild type and cstf77 mutant. d Distribution of TPM at mRNA PAS for sppRNA
genes (n = 1161) and its specific control set of genes (n = 1129) (Method) in wild type and cpsf100 mutant. In c and d, p < 0.001 denote the p-value
calculated by two-sided Wilcoxon test between mRNA PAS usage for sppRNA genes compared to a set of control genes displaying equal distribution of
nascent gene body transcription in the mutants, NS denotes no statistically significant difference. In c and d, the box bounds the iQR divided by the median,
and whiskers extend to a maximum of 1.5× iQR beyond the box. e Schematic representation of promoter-proximal RNAPII stalling ~100 nt downstream of
TSSs coinciding with nascent transcript cleavage, polyadenylation, and exosome-mediated degradation of sppRNAs. Elongation factors (EF) suppress
promoter-proximal termination. Source data of a are provided in the Source Data file.
10 NATURE COMMUNICATIONS | (2020)11:2589 | https://doi.org/10.1038/s41467-020-16390-7 | www.nature.com/naturecommunicationsNATURE COMMUNICATIONS | https://doi.org/10.1038/s41467-020-16390-7 ARTICLE
RNA sequencing methods appears suitable to gain powerful complex terminates transcription at unstable promoter-proximal
insight into transcript isoform diversity58. The synergies offered pausing sites in metazoans30. Interestingly, our cis-element ana-
by TIF-seq and long read sequencing would enhance tran- lyses identified the GAGA motif at sppRNA genes in plants. This
scriptome annotations in non-model species beyond RNA-seq, motif affects metazoan RNAPII promoter-proximal pausing;
that currently represents the starting point for investigation, for albeit at a position further upstream48. In conclusion, our data
example in many plant species59. identifies promoter-proximal termination of RNAPII transcrip-
Our data inform the debate of what we should consider a tion in plants that bears some tantalising parallels to a perhaps
gene2. The largest fraction of transcript variants detected by TIF- equivalent process in metazoans.
seq contained the full ORF, yet displayed variable 5′-UTR or 3′- sppRNA detection supports transcriptional termination as the
UTR lengths. In metazoans, 3′-UTRs regulate protein function by outcome of RNAPII stalling near the +1 nucleosome at many
several mechanisms60. The differences in 3′-UTRs we detected by plant promoters. We tested for gene regulation by selective
TIF-seq could thus reflect a largely unexplored layer of regulation. sppRNA formation at the expense of mRNA formation upon cold
Likewise, variability in 5′-UTRs can affect RNA structure, which perception. Although these analyses were consistent with gene
may regulate gene activity through effects on translation6. We regulation at some selected loci, sppRNA formation largely cor-
note that expression strategies for heterologous expression in related positively with RNAPII transcription and full-length gene
biotechnology often lack endogenous UTR variations, potentially isoform formation. Consistently, targeted deletion of sppRNA
limiting beneficial properties for expression61. Our transcriptome sequences in the 5′-UTR reduced reporter gene activity. On the
annotation by TIF-seq provides the platform for future studies other hand, our analyses of sppRNA/mRNA ratios in mutants
characterising the functional significance of variations in UTRs defective in 3′-end formation pathways argue that sppRNA for-
that distinguish plant transcript isoforms. mation may limit full-length mRNA expression. Promoter-
We detected intragenic transcription initiation as second lar- proximal RNAPII transcriptional termination resulting in
gest source of isoform diversity. This type of isoform variation sppRNA and associated RNAPII turnover may positively con-
would encode a protein lacking N-terminal domains that often tribute to plant gene expression, perhaps by maintaining NDRs
determine intracellular localisation3. TIF-seq clarified that tran- near TSSs to facilitate new rounds of transcription initiation. On
scripts initiating within gene bodies usually extend to the pre- the other hand, sppRNA formation reduces mRNA formation by
dicted gene PAS. However, the contributions of intragenic limiting progression of a fraction of initiated RNAPII complexes.
initiation to plant proteome diversity remain unresolved, and Although this reflects negative regulation of full-length mRNA
these transcript isoforms may be targets for cellular RNA isoforms, perhaps RNAPII complexes that fail quality control
degradation pathways62. checkpoints trigger sppRNA formation to promote the quality of
TSS-seq data previously suggested that the Arabidopsis FACT full-length mRNA expression. Elucidating the potential roles of
complex represses intragenic TSSs35. TIF-seq data showed that sppRNA in gene regulation will remain a topic for future studies.
FACT-repressed intragenic TSSs often extend to the canonical Our data are consistent with the idea that sppRNA result from
PASs. Repression of intragenic initiation of RNAPII transcription stalled RNAPII complexes failing to enter productive elongation,
by FACT thus results in transcript isoforms that potentially perhaps representing a checkpoint for plant RNAPII transcrip-
encode proteins lacking N-terminal domains. These data support tion during early transcriptional elongation. In summary, our
chromatin-based regulation of the transcript isoform diversity analyses of isoform diversity in plants inform on the debate about
derived from a single gene. FACT represses intragenic TSSs also peaks of RNAPII occupancy shortly after TSSs, suggesting they
in yeast and metazoans63,64, supporting the idea that our results often represent RNAPII complexes engaged in premature tran-
may help to understand gene isoform regulation by FACT in scriptional termination.
additional organisms. FACT mutants affect plant growth and
development65,66, perhaps reflecting that regulation of intragenic Methods
initiation by FACT assists cellular decisions needed to execute Plant growth. All A. thaliana lines used in this study are listed in Supplementary
plant developmental programmes. Table 2. Sterilised Arabidopsis seeds were grown on plates containing 1/2 Mura-
TIF-seq data revealed alternative 3′-end formation sites close to shige and Skoog (MS) medium containing 1% sucrose and supplemented with 1%
Microagar. Seeds were stratified in the dark at 4 °C for 48 h. Plates were then
TSSs that identified sppRNA. We note that most sppRNA transferred to climate chambers with a long day photoperiod (16 h light/8 h dark
represent cryptic transcripts, since sppRNA accumulate in cycle) at 22 °C/18 °C and grown for 2 weeks. Light intensity during control growth
nuclear exosome mutants (i.e. hen2-2). However, for some genes conditions was ~100 μE m−2 s−1. The Columbia accession Col-0 was used as wild-
we detected sppRNA in TIF-seq libraries generated from wild type background for all experiments. For cold treatment, seedlings were grown in
control conditions for two weeks and subsequently transferred to a cold room
type. sppRNAs co-localise with promoter-proximal stalled (4 °C) with light for 3 h before harvesting.
RNAPII complexes. The function of stalled RNAPII complexes is
unclear; they may prevent new acts of initiation67 and limit full- TIF-seq library construction. Discrete TU boundaries in A. thaliana were mapped
length isoform production by regulated pause-release mechan- by an optimised version of TIF-seq44. The TIF-seq approach was modified in order
isms25. In mammals, RNAPII pauses shortly after the TSSs, and to better detect corresponding TSS/PAS pairs in organism more complex than that
then stalls again further downstream near the position of the +1 of budding yeast Saccharomyces cerevisiae. Most notably, the make-up and
nucleosome68. Notably, the extent to which RNAPII accumula- orientation of sequencing adapters was improved to effectively double the return of
map-able reads. The detailed protocol will be published elsewhere70. Here we
tion near metazoan TSSs represents transient transcriptional describe its application to A. thaliana. Briefly, total Arabidopsis RNA was isolated
pausing or dynamic RNAPII turnover, perhaps through tran- using the RNeasy Plant Mini Kit (Qiagen) and treated with Turbo DNase (Ther-
scriptional termination, is actively debated69. moFisher Scientific) according to manufacturers’ instructions. DNase-treated RNA
Nucleosome-defined RNAPII stalling is dominant in Arabi- was recovered by acid–phenol extraction and ethanol precipitation. RNA integrity
was assessed using the 2100 Bioanalyzer RNA 6000 Nano assay (Agilent). 10
dopsis34, consistent with the conspicuous absence of metazoan micrograms of DNase-treated total RNA was treated with CIP (NEB) according to
pausing factors in plant genomes. The sppRNA biogenesis manufacturer’s instructions in order to remove all non-capped RNA species in the
mechanism thus likely differs from RNA species detected near sample. RNA was recovered by acid–phenol extraction and ethanol precipitation.
initiation regions that may depend on metazoan-specific pausing Next, 5′ caps were removed using Cap-Clip (CellScript). RNA was quickly
recovered by acid–phenol extraction and ethanol precipitation. The single-stranded
factors12,29. sppRNA carry poly-(A) tails, our data thus support a rP5_RND adapter (see Supplementary Data 2 for oligonucleotide sequence) was
biogenesis mechanism involving CstF/CPSF complexes. However, ligated to the 5′-end of previously capped species using T4 RNA ligase 1 (NEB).
the Integrator complex assists sppRNA formation. The Integrator RNA was recovered by AMPure purification using Agencourt RNAClean XP beads
NATURE COMMUNICATIONS | (2020)11:2589 | https://doi.org/10.1038/s41467-020-16390-7 | www.nature.com/naturecommunications 11ARTICLE NATURE COMMUNICATIONS | https://doi.org/10.1038/s41467-020-16390-7 (Beckman Coulter) following manufacturer’s instructions. Before proceeding, RNA pH 7.2, 1% BSA, 1 mM EDTA, 7% SDS) for 1 h at 68 °C. Next, membranes were integrity was assessed using the 2100 Bioanalyzer RNA 6000 Nano assay (Agilent) probed overnight at 68 °C with single-stranded DNA probes generated by PCR- following manufacturer’s instructions. In order to generate full-length cDNAs up based amplification and incorporation of radioactive α-32P-dTTP (PerkinElmer). to and >10 kb long, SuperScript IV (Invitrogen) and an oligo(dT)-containing Membranes were washed twice in pre-warmed buffer containing 2× SSC and 0.1% barcoded adapter (see Supplementary Data 2 for TIF2-RTX oligonucleotide SDS for 10 min (68 °C) before exposure to Storage Phosphor Screens (Kodak). A sequences) was used with the following PCR steps: 10 min at 42 °C, 30 min at 50 °C, Typhoon phosphor-imager (GE Healthcare Life Sciences) was used for analysis. 30 min at 55 °C and 10 min at 80 °C. cDNA samples were treated with RNase H, For loading controls, membranes were stripped three times with a near boiling provided with SuperScript IV First-Strand Synthesis System (Invitrogen), and buffer containing 0.1% SDS before prehybridization in Church Buffer as above and recovered using AMPure XP beads (Beckman Coulter). Second-strand synthesis of northern blotting against the mRNA of a reference gene lacking detectable full-length cDNA was amplified with Terra PCR Direct Polymerase Mix (Takara) sppRNAs (UBI). For northern analysis in Fig. 3j, 10 μg of total RNA and 1/1000 the BioNotI-P5-PET oligo (see Supplementary Data 2 for oligonucleotide dilution of Decade™ Markers System ladder according to manufacturer instructions sequence) and the following PCR steps: 2 min at 98 °C, 10 cycles (20 s at 98 °C, 15 s was separated by polyacrylamide gel electrophoresis (PAGE) with 6% urea, 0.5× at 60 °C, 5 min at 68°C + 10 s/cycle), 5 min at 72 °C. Barcoded full-length double- TBE. The gel was blotted on an Amersham Hybond-NX nylon membrane (GE stranded cDNA libraries were recovered using AMPure XP beads (Beckman Healthcare Life Sciences) and crosslinked by UV irradiation. The membrane was Coulter) and assessed for quality using the 2100 Bioanalyzer High Sensitivity DNA probed as described above. For loading control, the reference snRNA U6 was end kit (Agilent). cDNA libraries were quantified with the Qubit dsDNA HS Assay Kit labelled with α-32P-ATP and hybridised at 42 °C. See Supplementary Data 2 for (ThermoFisher Scientific) according to manufacturer’s instructions. Equal quan- oligonucleotide sequences used to prepare radioactive DNA probe templates. Both tities of cDNA libraries (up to 600 ng total) were pooled and digested with NotI experiments’ northern blotting raw images can be found in the Source Data file. (NEB) for 30 min at 37 °C. The enzyme was inactivated at 65 °C. Digested cDNA was recovered using AMPure XP beads (Beckman Coulter). Digested linear cDNA pools were diluted to
NATURE COMMUNICATIONS | https://doi.org/10.1038/s41467-020-16390-7                                                                                            ARTICLE

available through the TxDb.Athaliana.BioMart.plantsmart28 R package (cf script           Reporting summary. Further information on research design is available in
“histscatter_all.R”). In the case of Fig. 4e, the same calculation was performed in      the Nature Research Reporting Summary linked to this article.
hen2-2 but only on clusters with widths
ARTICLE                                                                           NATURE COMMUNICATIONS | https://doi.org/10.1038/s41467-020-16390-7

22. Yamaguchi, Y., Shibata, H. & Handa, H. Transcription elongation factors             52. Cubas, P., Lauter, N., Doebley, J. & Coen, E. The TCP domain: a motif found
    DSIF and NELF: promoter-proximal pausing and beyond. Biochim. Biophys                   in proteins regulating plant growth and development. Plant J. 18, 215–222
    Acta 1829, 98–104 (2013).                                                               (1999).
23. Marshall, N. F. & Price, D. H. Purification of P-TEFb, a transcription factor        53. Wang, Z. W., Wu, Z., Raitskin, O., Sun, Q. & Dean, C. Antisense-mediated
    required for the transition into productive elongation. J. Biol. Chem. 270,             FLC transcriptional repression requires the P-TEFb transcription elongation
    12335–12338 (1995).                                                                     factor. Proc. Natl Acad. Sci. USA 111, 7468–7473 (2014).
24. Vos, S. M. et al. Structure of activated transcription complex Pol II-DSIF-PAF-     54. Oh, S., Zhang, H., Ludwig, P. & van Nocker, S. A mechanism related to the
    SPT6. Nature 560, 607–612 (2018).                                                       yeast transcriptional regulator Paf1c is required for expression of the
25. Henriques, T. et al. Stable pausing by RNA polymerase II provides an                    Arabidopsis FLC/MAF MADS box gene family. Plant Cell 16, 2940–2953
    opportunity to target and integrate regulatory signals. Mol. Cell 52, 517–528           (2004).
    (2013).                                                                             55. Zeng, W. et al. Modulation of auxin signaling and development by
26. Krebs, A. R. et al. Genome-wide single-molecule footprinting reveals high               polyadenylation machinery. Plant Physiol. 179, 686–699 (2019).
    RNA polymerase II turnover at paused promoters. Mol. Cell 67, 411–422.e414          56. Lin, J., Xu, R., Wu, X., Shen, Y. & Li, Q. Q. Role of cleavage and
    (2017).                                                                                 polyadenylation specificity factor 100: anchoring poly(A) sites and modulating
27. Adelman, K. & Lis, J. T. Promoter-proximal pausing of RNA polymerase II:                transcription termination. Plant J. 91, 829–839 (2017).
    emerging roles in metazoans. Nat. Rev. Genet. 13, 720–731 (2012).                   57. Wang, Y. et al. NAD+-capped RNAs are widespread in the Arabidopsis
28. Erickson, B., Sheridan, R. M., Cortazar, M. & Bentley, D. L. Dynamic turnover           transcriptome and can probably be translated. Proc. Natl Acad. Sci. USA 116,
    of paused Pol II complexes at human promoters. Genes Dev. 32, 1215–1225                 12094–12102 (2019).
    (2018).                                                                             58. Parker, M. T. et al. Nanopore direct RNA sequencing maps the complexity of
29. Nechaev, S. et al. Global analysis of short RNAs reveals widespread promoter-           Arabidopsis mRNA processing and m6A modification. eLife 9, e49658 (2020).
    proximal stalling and arrest of Pol II in Drosophila. Science 327, 335–338          59. Leebens-Mack, J. H. et al. One thousand plant transcriptomes and the
    (2010).                                                                                 phylogenomics of green plants. Nature 574, 679–685 (2019).
30. Tatomer, D. C. et al. The Integrator complex cleaves nascent mRNAs to               60. Mayr, C. Regulation by 3′-untranslated regions. Annu Rev. Genet. 51, 171–194
    attenuate transcription. Genes Dev. 33, 1525–1538 (2019).                               (2017).
31. Elrod, N. D. et al. The integrator complex attenuates promoter-proximal             61. Erb, T. J., Jones, P. R. & Bar-Even, A. Synthetic metabolism: metabolic
    transcription at protein-coding genes. Mol. Cell 76, 738–752.e737 (2019).               engineering meets enzyme design. Curr. Opin. Chem. Biol. 37, 56–62
32. Baillat, D. & Wagner, E. J. Integrator: surprisingly diverse functions in gene          (2017).
    expression. Trends Biochem. Sci. 40, 257–264 (2015).                                62. Raxwal, V. K. & Riha, K. Nonsense mediated RNA decay and evolutionary
33. Morton, T. et al. Paired-end analysis of transcription start sites in Arabidopsis       capacitance. Biochim. Biophys. Acta 1859, 1538–1543 (2016).
    reveals plant-specific promoter signatures. Plant Cell 26, 2746–2760 (2014).         63. Kaplan, C. D., Laprade, L. & Winston, F. Transcription elongation factors
34. Kindgren, P., Ivanov, M. & Marquardt, S. Native elongation transcript                   repress transcription initiation from cryptic sites. Science 301, 1096–1099
    sequencing reveals temperature dependent dynamics of nascent RNAPII                     (2003).
    transcription in Arabidopsis. Nucleic Acids Res. 48, 2332–2347 (2019).              64. Carvalho, S. et al. Histone methyltransferase SETD2 coordinates FACT
35. Nielsen, M. et al. Transcription-driven chromatin repression of Intragenic              recruitment with nucleosome dynamics during transcription. Nucleic Acids
    transcription start sites. PLoS Genet. 15, e1007969 (2019).                             Res. 41, 2881–2893 (2013).
36. Herr, A. J., Molnar, A., Jones, A. & Baulcombe, D. C. Defective RNA                 65. Lolas, I. B. et al. The transcript elongation factor FACT affects Arabidopsis
    processing enhances RNA silencing and influences flowering of Arabidopsis.                vegetative and reproductive development and genetically interacts with
    Proc. Natl Acad. Sci. USA 103, 14994–15001 (2006).                                      HUB1/2. Plant J. 61, 686–697 (2010).
37. Manzano, D. et al. Altered interactions within FY/AtCPSF complexes required         66. Ikeda, Y. et al. HMG domain containing SSRP1 is required for dna
    for Arabidopsis FCA-mediated chromatin silencing. Proc. Natl Acad. Sci. USA             demethylation and genomic imprinting in Arabidopsis. Dev. Cell 21, 589–596
    106, 8772–8777 (2009).                                                                  (2011).
38. Liu, Y. et al. snRNA 3′ end processing by a CPSF73-containing complex               67. Shao, W. & Zeitlinger, J. Paused RNA polymerase II inhibits new
    essential for development in Arabidopsis. PLoS Biol. 14, e1002571 (2016).               transcriptional initiation. Nat. Genet. 49, 1045–1051 (2017).
39. Chekanova, J. A. et al. Genome-wide high-resolution mapping of exosome              68. Chiu, A. C. et al. Transcriptional pause sites delineate stable nucleosome-
    substrates reveals hidden features in the Arabidopsis transcriptome. Cell 131,          associated premature polyadenylation suppressed by U1 snRNP. Mol. Cell 69,
    1340–1353 (2007).                                                                       648–663 e647 (2018).
40. Lange, H. et al. The RNA helicases AtMTR4 and HEN2 target specific subsets           69. Price, D. H. Transient pausing by RNA polymerase II. Proc. Natl Acad. Sci.
    of nuclear transcripts for degradation by the nuclear exosome in Arabidopsis            USA 115, 4810–4812 (2018).
    thaliana. PLoS Genet. 10, e1004564 (2014).                                          70. Wang, J. et al. Improved transcriptome annotation and read-through
41. Lorkovic, Z. J. & Barta, A. Genome analysis: RNA recognition motif (RRM)                transcript identification with TIF-Seq2. Preprint at bioRxiv https://www.
    and K homology (KH) domain RNA-binding proteins from the flowering                       biorxiv.org/content/10.1101/859488v1 (2019).
    plant Arabidopsis thaliana. Nucleic Acids Res. 30, 623–635 (2002).                  71. Pelechano, V., Wei, W. & Steinmetz, L. M. Genome-wide quantification of 5’-
42. Liu, F., Marquardt, S., Lister, C., Swiezewski, S. & Dean, C. Targeted 3′               phosphorylated mRNA degradation intermediates for analysis of ribosome
    processing of antisense transcripts triggers Arabidopsis FLC chromatin                  dynamics. Nat. Protoc. 11, 359–376 (2016).
    silencing. Science 327, 94–97 (2010).                                               72. Nakagawa, T. et al. Development of series of gateway binary vectors, pGWBs,
43. Zhu, J., Liu, M., Liu, X. & Dong, Z. RNA polymerase II activity revealed by             for realizing efficient construction of fusion genes for plant transformation. J.
    GRO-seq and pNET-seq in Arabidopsis. Nat. Plants 4, 1112–1123 (2018).                   Biosci. Bioeng. 104, 34–41 (2007).
44. Pelechano, V., Wei, W., Jakob, P. & Steinmetz, L. M. Genome-wide                    73. Schurch, N. J. et al. Improved annotation of 3′ untranslated regions and
    identification of transcript start and end sites by transcript isoform                   complex loci by combination of strand-specific direct RNA sequencing, RNA-
    sequencing. Nat. Protoc. 9, 1740–1759 (2014).                                           Seq and ESTs. PLoS ONE 9, e94270 (2014).
45. Pelechano, V., Wei, W. & Steinmetz, L. M. Extensive transcriptional
    heterogeneity revealed by isoform profiling. Nature 497, 127–131 (2013).
46. Sherstnev, A. et al. Direct sequencing of Arabidopsis thaliana RNA reveals
    patterns of cleavage and polyadenylation. Nat. Struct. Mol. Biol. 19, 845–852       Acknowledgements
    (2012).                                                                             We thank members of the Marquardt and Pelechano laboratories for discussions and
                                                                                        technical assistance. We thank members of the P. Brodersen lab for help with the
47. Mignone, F., Gissi, C., Liuni, S. & Pesole, G. Untranslated regions of mRNAs.
                                                                                        PAGE northern. We are grateful to T.H. Jensen, S. Buratowski and P. Brodersen for
    Genome Biol. 3, REVIEWS0004 (2002).
                                                                                        critically evaluating the manuscript. Research in the Marquardt lab is supported the
48. Kwak, H., Fuda, N. J., Core, L. J. & Lis, J. T. Precise maps of RNA polymerase
    reveal how promoters direct initiation and pausing. Science 339, 950–953            Novo Nordisk Foundation (NNF15OC0014202), and a Copenhagen Plant Science
    (2013).                                                                             Centre Young Investigator Starting Grant. This project has received funding from the
                                                                                        European Research Council and the Marie Curie Actions under the European Union’s
49. Bailey, T. L. et al. MEME SUITE: tools for motif discovery and searching.
                                                                                        Horizon 2020 research and innovation programme (StG2017-757411) (S.M.). R.A. was
    Nucleic Acids Res. 37, W202–W208 (2009).
                                                                                        supported by an European Molecular Biology Organization Long-Term Fellowship
50. Nguyen, N. T. T. et al. RSAT 2018: regulatory sequence analysis tools 20th
    anniversary. Nucleic Acids Res. 46, W209–W214 (2018).                               (ALTF 463-2016). The Pelechano lab is supported by a SciLifeLab Fellowship (Kar-
                                                                                        olinska Institutet SFO-PRIO), the Swedish Research Council (VR 2016-01842), a
51. Franco-Zorrilla, J. M. et al. DNA-binding specificities of plant transcription
                                                                                        Wallenberg Academy Fellowship (KAW 2016.0123) and the Ragnar Söderberg
    factors and their potential to define target genes. Proc. Natl Acad. Sci. USA
                                                                                        Foundation.
    111, 2367–2372 (2014).

14                   NATURE COMMUNICATIONS | (2020)11:2589 | https://doi.org/10.1038/s41467-020-16390-7 | www.nature.com/naturecommunications
NATURE COMMUNICATIONS | https://doi.org/10.1038/s41467-020-16390-7 ARTICLE
Author contributions Reprints and permission information is available at http://www.nature.com/reprints
S.M. and V.P. conceived the project with input from all authors; S.M., V.P., Q.T. and R.A.
designed experiments. Q.T, R.A. and L.J. performed the experiments. Q.T. performed Publisher’s note Springer Nature remains neutral with regard to jurisdictional claims in
computational analyses with support from J.W. and V.P. B.L., J.W. and V.P. optimised TIF- published maps and institutional affiliations.
seq. S.M. supervised the project. S.M. wrote the manuscript with input from all authors.
Open Access This article is licensed under a Creative Commons
Competing interests Attribution 4.0 International License, which permits use, sharing,
The authors declare no competing interests. adaptation, distribution and reproduction in any medium or format, as long as you give
appropriate credit to the original author(s) and the source, provide a link to the Creative
Commons license, and indicate if changes were made. The images or other third party
material in this article are included in the article’s Creative Commons license, unless
Additional information indicated otherwise in a credit line to the material. If material is not included in the
Supplementary information is available for this paper at https://doi.org/10.1038/s41467- article’s Creative Commons license and your intended use is not permitted by statutory
020-16390-7. regulation or exceeds the permitted use, you will need to obtain permission directly from
the copyright holder. To view a copy of this license, visit http://creativecommons.org/
Correspondence and requests for materials should be addressed to S.M. licenses/by/4.0/.
Peer review information Nature Communications thanks the anonymous reviewer(s) for
their contribution to the peer review of this work. Peer reviewer reports are available. © The Author(s) 2020
NATURE COMMUNICATIONS | (2020)11:2589 | https://doi.org/10.1038/s41467-020-16390-7 | www.nature.com/naturecommunications 15You can also read