Response of Reinforced Concrete Dapped-End Beams Exhibiting Bond Deterioration Subjected to Static and Cyclic Loading
←
→
Page content transcription
If your browser does not render page correctly, please read the page content below
Journal of Advanced Concrete Technology Vol. 19, 536-554, May 2021 / Copyright © 2021 Japan Concrete Institute                         536

Scientific paper

Response of Reinforced Concrete Dapped-End Beams Exhibiting Bond
Deterioration Subjected to Static and Cyclic Loading
Ajibola Ibrahim Quadri1* and Chikako Fujiyama2

Received 3 March 2021, accepted 2 May 2021                                                                           doi:10.3151/jact.19.536

Abstract
In existing bridge structures, reinforced concrete dapped-end beams/girders (RCDEB) are frequently subjected to service
loadings that exceed their design capacity, due to increasing economic and population growth. Dapped-end beams are
prone to the accumulation of water due to improper drainage and sealing of the joint, providing favorable conditions for
corrosion due to the stagnation of chloride rich water from de-icing salts used on roads. The situation can get even worse
when freezing and thawing due to extreme weather conditions is present. Due to difficulties in maintenance of the
dapped-end regions, this often leads to the deterioration of the concrete around the recess and bond deterioration, which
ultimately results in durability issues. Unfortunately, the performance of RCDEB exhibiting corrosion induced bond
deterioration is still not well understood. Hence, experimental, and numerical investigations were conducted to under-
stand better the response of RCDEB subjected to static and cyclic loading, with the presence of bond deterioration.
Furthermore, the static capacity of the beam was adopted to consider the variable amplitude cyclic loading at an increment
of 15% static capacity for every 20 cycles. The reliability of the numerical examination under the direct-path constitutive
models of concrete was extended to the moving load scenario by applying a lower load amplitude than the static capacity.
It is shown that the prominent failure mechanisms observed in both static and cyclic tests were diagonal tension and shear.
Through numerical investigations, it is also shown that from the damage level developed in the RCDEB under the moving
load at a relatively low magnitude, high stresses were found within a relatively short number of cycles, which raises a
serious cause for concern.

1. Introduction                                                               cern. A case of the collapse of the De la Concorde Bridge
                                                                              in Montreal, Canada in 2006 (Fig. 1) due to corrosion of
Reinforced concrete Dapped End Beams (RCDEBs) are                             the reinforcement at the critical portion has been identi-
employed in bridges and many other pre-cast construc-                         fied (Johnson 2007). Durability is a constant threat for
tions to reduce end depth and increase lateral stability                      the DEBs when exposed to recurrent loading from traffic
due to the notching or recessing at the ends. Besides,                        volumes (Gjørv 2011). Moreover, the spikes in economic
RCDEBs allows a reduction in the total height of con-                         activities over time also subject some of the bridges to
structions. They experience recurrent loads when used in                      overloading more than their designed capacity.
bridges, the cross-sections of RCDEBs utilized in con-                           A series of examinations have been carried out to ex-
struction is weakened at the reentrant corner close to the                    plore the shear capacity of RCDEBs. The first investi-
support because of the discontinuity region (D-region)                        gation conducted on the dapped end beam was made by
(Mattock and Chan 1979), this disturbs the flow of in-                        (Reynolds 1969) who made a proposal on the rein-
ternal stresses in the members and causes a stress con-                       forcement detailing and established measures on the
centration at the reentrant portion of the beam, which can                    equilibrium of the bending moments for appraising the
create crack development if enough stiffness is not pro-                      strength contribution of each type of reinforcement.
vided (Moreno-Martínez and Meli 2014). Furthermore,                           Hoogenboom et al. (2005) have examined the shear
investigating the anchorage zone of RCDEB in the                              strength of dapped-end beam (DEB) and recommended
bridge girder is often difficult due to the recess portions                   that the depth of nib should be more than 0.45 times the
that sit on other structural members, water or eroded                         full depth of the beam and suggested that the spacing of
materials can accumulate on this part, which accelerates                      the first stirrup from the end face of the dapped end beam
the deterioration of the beam leading to corrosion con-                       must be less than 40 mm. Mohammed et al. (2019)
                                                                              studied the performance of RC and R-ECC DEB based
                                                                              on the role of the hanger and the diagonal reinforcement,
1                                                                             although the experiment was proved to be appropriate, an
 Ph.D candidate, Department of Civil Engineering,                             increase in capacity was observed with a certain extent of
Graduate School of Urban Innovation, Yokohama                                 delay to crack initiation, the undapped zone lost its con-
National University, Japan. *Corresponding author,                            fining strength which drastically resulted in damage at
E-mail: quadri-ibrahim-rw@ynu.jp                                              the bottom. Lu et al. (2015) examined 24 RCDEBs with
2
 Associate Professor, Department of Civil Engineering,                        shear span to depth ratio greater than unity and con-
Faculty of Urban Innovation, Yokohama National                                cluded that the shear strength of DEBs increased con-
University, Japan.
A. I. Quadri and C. Fujiyama / Journal of Advanced Concrete Technology Vol. 19, 536-554, 2021                                          537

siderably with an increase in the concrete compressive                         bridge slabs was conducted by Farreras-Alcover et al.
strength, and with a smaller shear span to depth ratio of                      (2017) by adopting ambient temperature, strain moni-
the DEB, stiffness and ultimate load increased consid-                         toring, traffic, and made stress-cycles curves applicable
erably. Syed et al. (2019) conducted a parametric study                        to strain monitor. Hiratsuka et al. (2016) reported a
under dynamic loading by adopting different reinforce-                         structural behavior of RC bridge slabs subjected to dif-
ment detailing. Under the impact loading, the shear                            ferent loading histories through the path-dependent high
strength of DEBs increases as concrete compressive                             cycle fatigue loading in the laboratory; the same scenario
strength increases. Shakir and Abd (2020) considered                           was simulated using a nonlinear FE analysis approach.
shear slenderness ratio of 1 and 1.5 for a half joint beams                    Approximately the same behavior was observed. This is
strengthened with different arrangement of FRP sheets,                         useful in practice when considering the gradual damag-
the result showed that when a reduced shear span of half                       ing of the concrete structures under high cycle fatigue
joint beam is used, the stiffness and ductility is enhanced.                   loading. Fujiyama et al. (2013) presented a numerical
   There is, however, a paucity of an experimental in-                         scheme to evaluate a residual fatigue damage life of RC
vestigation on the response of the RCDEBs subjected to                         bridge decks using a pseudo-cracking approach that
fatigue loading conditions under the influence of the                          converts cracks data investigated on-site to the real-life
bond deterioration between the reinforced concrete                             scenario. Here, the past loading history of several in-
composite of RCDEBs. Moreover, several RC structures                           spected bridges subjected to real traffic loads was con-
experience cracks and defects from fatigue degradation                         sidered, the quantitative results show approximately
due to constant overloading/traffic and environmental                          good agreement with the specifications of Japanese
concern that reduces the life expectancy of the structures.                    maintenance codes. Some of these approaches are
Thus, investigation of the RC bridges subjected to fa-                         adopted for engineering cracks verification on RC bridge
tigue problems gives much concern to the engineers                             decks. Fatigue failures of reinforced concrete beams
these days (Maekawa and Wang 2020). Scholars have                              under shear and flexure have also been examined
conducted in-depth studies on the impact of fatigue on                         (Suryanto et al. 2019; El-Kashif and Maekawa 2004).
the overall mechanical performance of RC structures.                           Fatigue investigation of RCDEB is however not common
Gebreyouhannes et al. (2008) experimentally investi-                           in literature. Moreno-Martínez and Meli (2014) investi-
gated the fatigue shear response of RC beams subjected                         gated a precast pre-stressed dapped-end girder similar to
to fixed pulsating and moving loads in form of moving                          those used in an elevated viaduct in Mexico City; pre-
vehicles in traffic states using strain and time-dependent                     mature cracking was recorded in the reentrant corner of
fatigue constitutive models in multi-scale. The moving                         the beam under service loading. It is therefore essential to
load was found to cause a drastic reduction in the fatigue                     comprehend the impact of fatigue loading on RCDEB
life of RC beams due to the aggregated stress reversal                         especially the consideration of moving type load as it can
and variation in shear force to the static capacity of the                     potentially reduce the life of concrete structures in ser-
beam. Fathalla et al. (2018) presented a life assessment                       vice.
of concrete bridge deck by deriving the hazard cracks
pattern through an artificial neural network, the locations                    1.1 Research significance
and widths of concrete cracking are converted to                               From the reassessment of the existing literature, it is set
space-averaged strains in space for predicting future                          up that numerous assorted works were led on the re-
occurrence. The fatigue reliability model of orthotropic                       sponse of RCDEB under static loading conditions. The

Fig. 1 The condition of the De la Concorde Gerber Bridge girder in Canada due to corrosion prior to collapse (Johnson
2007).
A. I. Quadri and C. Fujiyama / Journal of Advanced Concrete Technology Vol. 19, 536-554, 2021                                          538

accompanying issues are yet open and should be tended                          “struts-and-tie” inclination approach for the design of
to.                                                                            shear in structures with discontinuity sections where a
1. Experimental and analytical examinations of fatigue                         non-linear strain distribution exists such as deep beam,
    behavior of RCDEB are insufficient.                                        corbel, and DEB, which results in the economy of the
2. The influence of bond deterioration of the RC com-                          amount of shear reinforcement required. The concrete
    posite, at the anchorage zone of the RCDEB, on the                         stress emanating from the nib is resisted by the tension
    load-carrying capacity and the influence of such de-                       force in the web reinforcement located near the
    terioration under static and fatigue loading conditions                    full-depth end face of the beam (Fig. 2a). In addition, the
    is not clearly understood.                                                 strength of the undapped end of the DEB is also influ-
   Considering these, in the current investigation, ex-                        enced by the inclined tension crack that is primarily
perimental and numerical examinations are conducted to                         initiated at the recessed corner and from the full depth
comprehend the behavior of RCDEB under bond dete-                              corner of the beam. Adequate reinforcement must be
rioration issue subjected to monotonic and fatigue prob-                       provided to resist the crack to forestall failure. Cook and
lem in form of cyclic loading.                                                 Mitchell (1988) developed a strut-and-tie model that was
                                                                               later adopted in the ACI building code requirements, ACI
1.2 Bond deterioration concern                                                 318-95 (ACI 1995) and the new revision, ACI 318-19
When a deformed bar is used as tensile reinforcement,                          (ACI 2019), as presented in Fig. 2b. The model shows a
the rebar lugs create the bond with the surrounding con-                       compression strut engaging an inclined crack, which
crete, the presence of cracks in concrete around the re-                       does not depict the recommendation for the present study.
inforcement are not only related to durability but also                        Another option is presented in CEB-FIP recommenda-
characterized the bond mechanism between the rein-                             tions for practical design of structural concrete (fib 1996)
forcement and the concrete. Thus, Understanding of                             as shown in Fig. 2c, which is similar to what is adopted
bond effect in RC is accordingly critical (Goto 1971).                         in the present study. However, modifications by Arya
Furthermore, the performance of cracks of concrete in                          (2009) and by Marí et al. (2015) were adopted.
facilitating the corrosion of reinforcement in RC struc-
tures remains questionable. On one hand, cracks reduce                         2. Experimental study
the life expectancy of the structures because they permit
carbonation, thus allowing chloride ions, moisture, and                        To evaluate the behavior of the DEB under the bond
oxygen ingress towards the reinforcement. On the other                         deterioration, six dapped end beams have been designed
hand, even though cracks hasten the occurrence of cor-                         and cast. 9 mm diameter deformed bars are used to resist
rosion, their actions are confined to the bar length par-                      the forces originated from the nib region at 150 mm
allel to the width of the crack. Hence, concrete quality                       spacing, while 210 mm spacing is adopted for the stirrups
and cover thickness are important parameters for pre-                          at the middle portion of the beam. 22 mm deformed bars
venting corrosion of steel in concrete. Eurocode 2 (EN-2                       are used for all the longitudinal reinforcement both at the
2005) recommends a semi-empirical approach to assess                           reentrant corner (nib) and at the full bottom depth of the
the crack width in terms of the strain difference between                      beam as presented in Fig. 3, so that the reinforcements
the concrete and the reinforcement and maximum crack                           can attain their yield strength before the ultimate failure.
spacing, among different other parameters. The long-term                       The yield strength and the ultimate strength of the 9 mm
impact of creep could have a significant drawback on the                       rebar used are 499 MPa and 614 MPa respectively, while
performance under recurrent loading and explicitly on                          that of 22 mm bar (D22) used for each beam is shown in
the size and width of cracks.                                                  Table 1. PVC hollow pipe of 140 mm long (equivalent to
                                                                               6.4D where D is the diameter of 22 mm bar inserted in
1.3 Design criteria for the dapped-end beams                                   the hollow pipe) and 27 mm inner diameter was used to
(DEBs)                                                                         create the bond deterioration between the longitudinal
The detailing of the reinforcement requirement of the                          reinforcement and the concrete. Silicon gum was infused
DEBs was done in accordance with the specification of                          inside the PVC hollow pipe, and the longitudinal rein-
Eurocode 2 (EN-2 2005), which embraces the                                     forcement was inserted into the PVC pipe as depicted in

                          (a)                                     (b)                            (c)
Fig. 2 Struts-and-tie approach for DEB: (a) for this study, (b) design recommendation in ACI 318-95, (c) FIP recommen-
dation.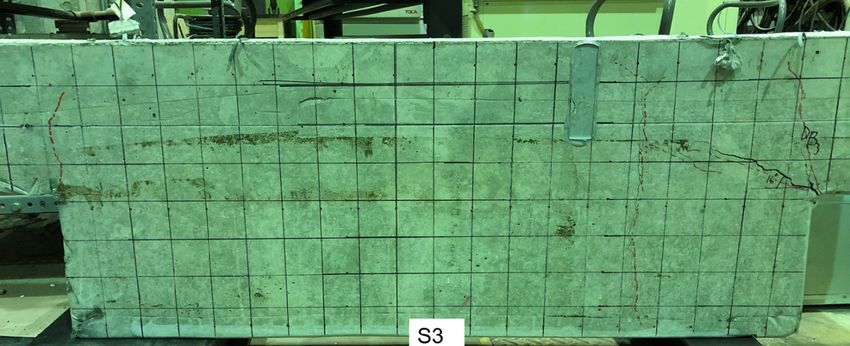
A. I. Quadri and C. Fujiyama / Journal of Advanced Concrete Technology Vol. 19, 536-554, 2021                                                 539

                                            Table 1 Material strength tests and loading type.
                    Concrete strength                      Steel (22 mm)
                                                                                                    Type of
  Specimen     Compressive        Splitting    Yield stress    Ultimate Strength                                Bond loss        Loading point
                                                                                                     Load
                  N/mm2            N/mm2         N/mm2               N/mm2
     S0            37.7              2.5           410                 491                          Static            -             a/d=1
     S1             55              2.65           401                 544                          Cyclic           S             Midpoint
     S2             55              2.65           375                 582                          Cyclic        S and R           a/d=1
     S3            41.97             2.5           375                 582                          Cyclic      S, R and F1         a/d=1
     S4            41.97             2.5           410                 491                          Cyclic    S, R, F1, and F2     Midpoint
     S5            41.97             2.5           401                 544                          Static           S             Midpoint
 S: Support, R: Re-entrant corner, F1: Flexure zone, F2: Flexure zone double

Fig. 3. The total span of the RCDEB is 1600 mm, the                            ordinary Portland cement, fine aggregate, and coarse
distance between the supports is 1200 mm, the nib di-                          aggregate with a maximum aggregate size of 20 mm
mensions are 300 mm long, 200 mm high, and 200 mm                              mixed at a ratio of 1:1.6:2.94 by weight of cement. A
wide. The undapped section has the dimension of                                water-cement ratio (w/c) of 0.43 and air-entraining wa-
1000×200×400 mm length, width, and height respec-                              ter-reducing agent ranges between 0.3 and 0.5% by
tively. 6 beams labeled (S0, S1, … S5) were examined                           weight of cement are adopted. In addition to the test
under static and fatigue problem in terms of cyclic                            beams, cylindrical sizes of 100 mm diameter and 200
loading. The appearance of the beams is shown in Fig. 3.                       mm height were cast for each beam to determine the
S0 is a control beam without the bond loss loaded                              compressive strength and split tensile strength of con-
monotonically at shear span to depth ratio (a/d=1, where                       crete. The slump and air entrainment values achieved
d is the total depth of the undapped section). The position                    during testing were 110 mm and 1.75%, respectively.
was adopted to capture the diagonal cracks from the full                       From the test material, the results of the compressive and
depth of the beam. S1 and S5 have the same bond loss at                        the split tensile strength for each beam are presented in
the nib section, while the bond loss in S3 and S4 is in-                       Table 1. The same values were incorporated in the nu-
cluded at the flexure zone. S5 was also subjected to static                    merical simulation studies. The splitting tensile strength
loading at the midpoint which equivalent to a/d>1, while                       ( f cts ) is computed using Eq. (1). The loading test was
the rest of the beams were tested under the cyclic condi-                      carried out after curing the beam for 28 days.
tions. S2 and S3 were loaded at a/d=1, and S1 and S4
were loaded cyclically at the midpoint. The arrangement                                      2P
                                                                                   f cts =                                                    (1)
of the bond loss for each beam and description is given in                                   π ld
Fig. 3 and Table 1.
   M35 grade of a concrete mix has been designed to                            where P is breaking load, l is length of cylinder, d
accomplish 28-day characteristic cylinder compressive                          is diameter of cylinder.
strength of 35 MPa. Constituents of the concrete mix are

                                   Fig. 3 Reinforced concrete dapped end and bond loss detailing.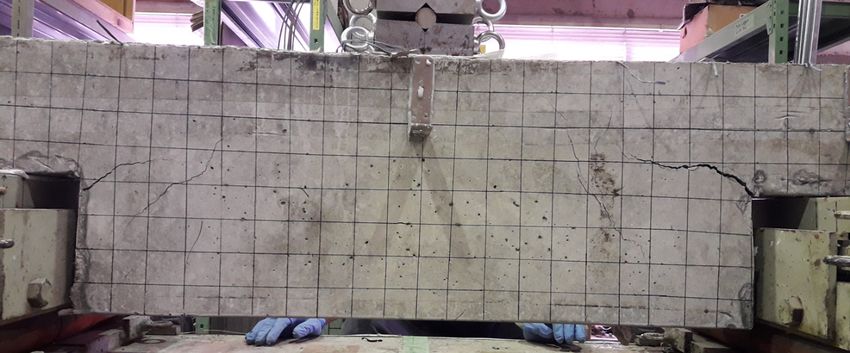
A. I. Quadri and C. Fujiyama / Journal of Advanced Concrete Technology Vol. 19, 536-554, 2021                                          540

2.1 Instrumentation                                                            and the test specimen. The cyclic amplitude loading was
The specimens were instrumented to obtain as much                              done in the form of increasing steps as shown in Fig. 5.
information as necessary, most importantly at the dapped
section where the bond loss was made. All the results                          3. Fatigue constitutive model for concrete
were recorded automatically with the aid of a data logger.
Steel strains were measured using 5 mm electrical resis-                       The constitutive model adopted in this investigation is
tance strain gauges attached to the longitudinal rein-                         briefly summarized in Fig. 6. Starting from the me-
forcement inside and outside of the PVC hollow pipe in                         chanical response of cracked reinforced concrete skele-
the nib and at the flexure zone. The strain gauges were                        ton considered based on the time-dependent nonlinear
also glued to the hanger reinforcement on the North and                        constitutive law (Maekawa et al. 2006b). The reinforced
South sides of the beam to evaluate the strain values                          concrete stress is a simple summation of the cracked
develop in the reinforcement during loading. To capture                        reinforced concrete model and the embedded rein-
the vertical displacement of the beam, three 25 mm ca-                         forcement. To develop the stress-strain relationship of
pacity linear variable differential transducers (LVDTs)                        the cracked concrete, the combination of the tension
were positioned on the beam, at the lower portion of the                       softening-stiffening model normal to cracks, compres-
loading point, and the upper side of the supports. The test                    sion-tension model along the cracks, and the shear
beams were subjected to three-point-bending in a uni-                          transfer along the cracks are imperative. In a scenario of
versal testing machine with a total capacity of 2000 kN                        moving wheel load such as the traffic conditions, the
(Fig. 4). A top steel rigid plate 200×200 mm was used to                       multi-directional fixed crack approach is considered on
transfer the load from the machine head to the beam. The                       the grounds that the reinforced concrete structure sus-
load was applied at an increment of 5 kN until failure in                      tains cracks in different directions. Maekawa et al.
the case of static loading. The static capacity here was                       (2006a) incorporated the dynamic response of the rein-
adopted for determining the fatigue cyclic loading crite-                      forced concrete structures by considering the direct in-
ria. In the case of the cyclic loading, a minimum of 15%                       tegral path-dependency of the multi-directional fixed
static capacity was adopted with an increment of 15%                           cracks. The one-dimensional stress-strain relation is built
capacity loading at every 20 cycles until failure. The                         up in 3-dimensional space average constitutive law.
minimum load amplitude was maintained at 5% static                             When there are several cracks, the active crack is con-
capacity to ensure contact between the loading device                          sidered to control the whole nonlinearity response of the
                                                                               reinforced concrete structure, which is identified to have
                                                                               the largest crack width among the cracks. Finally, the
                                                                               high fatigue constitutive model of concrete in compres-
                                                                               sion, tension, and shear transfer across the reinforced
                                                                               concrete (RC) presented by (Maekawa et al. 2006c),
                                                                               have been introduced into the time-dependent constitu-
                                                                               tive model of concrete structures. The governing equa-
                                                                               tions have been presented by (Maekawa et al. 2006c).

                                                                               3.1 Numerical study
                                                                               Experimental examination and computational simulation
                                                                               of reinforced concrete structures are frequently adopted
                                                                               to analyze the nonlinear behavior of concrete structures.
      Fig. 5 The pattern of cyclic amplitude loading.                          While the former gives accurate results, it is restricted to

                          (a) Actual                                                   (b)Schematic
                                             Fig. 4 Experimental setup and instrumentation.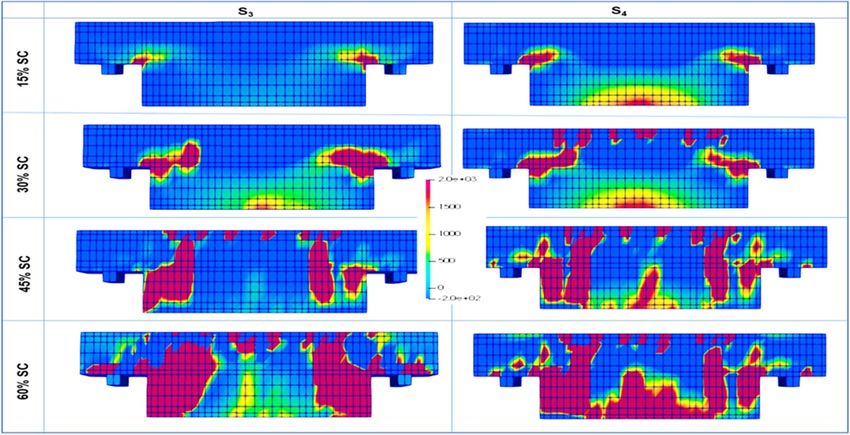
A. I. Quadri and C. Fujiyama / Journal of Advanced Concrete Technology Vol. 19, 536-554, 2021                                            541

                                              Table 2 Material strength properties (Analysis).
                                                                                                    Interface element properties
       Material property             Concrete           Steel         Plastic Material
                                                                                                           Coulomb friction
   Initial stiffness (N/mm2)          2.2×10⁴          2.1×10⁵             3.3×10³               Shear stiffness (N/mm2)         3×10⁴
                                                                                                                        2
          Poisson ratio                  0.2             0.3                  0.2               Normal stiffness (N/mm )         3×10⁴
     Unit weight (kN/m3)                 24              78.6                14.5                  Friction coefficient           0.8
   Tensile strength (N/mm2)             2.48              -                  51.7

the understanding of occurrence under limited geome-                           beam element. Furthermore, the mesh density is consid-
tries, loading, boundary conditions, and cost. The latter                      ered here to avoid the coarseness of the FEM mesh,
entails unrestricted computer modeling of reinforced                           which could result in unreliable output at the critical
concrete. The numerical analysis is thus adopted as an                         portion of the dapped end (Quadri and Fujiyama 2019).
alternative to the rigorous and dear experimental study.                       In the nonlinear simulation of the RCDEB, the typical
The numerical study aims to consider the applicability of                      model comprises 4288 elements and 7234 nodes with
the software package relative to the behavior of the                           elastic support designed as simply supported. The mod-
dapped end beam when subjected to variable loading                             eled case of beam S4 is presented in Fig. 7, with sections
under the bond deterioration as considered in the ex-                          A-A and B-B showing the discretization of the bond
perimental examination.                                                        deterioration in the beam. The elements in red color are
   The geometry, boundary conditions, loading, and                             the target element for the bond loss. Here, the properties
strength properties of the material test setup were care-                      of the PVC hollow pipe, with concrete, elastic, and steel
fully mocked up to resemble the experimental investiga-                        properties presented in Table 2, used for the experi-
tion. The analysis model was achieved by the concrete                          mental studies were input into these elements with a
model of 3-dimension (COM 3D). COM3D considers the                             bond interface applied between the elements and the
full model of the reinforcement inside the concrete ma-                        embedded reinforcing bars. For the case of beams S1 and
terial to form the RC mesh under the multi-directional                         S5, the bond loss labeled one in section A-A only was
fixed crack. The reinforcement can be modeled in dis-                          considered. Bond loss labeled 1 and 2 was considered for
crete or smeared, the authors adopted discrete modeling                        beam S2, while the bond loss labeled 1, 2, and 3 was
of the reinforcing bar. In this manner, the reinforcing bars                   considered for beam S3. S0 was considered without the
are arranged inside the elements of the RCDEB model.                           bond loss. Other strengths properties considered for the
The discrete model resembles the exact arrangement in                          simulation are the tensile and compressive strengths of
the experimental approach and offers more stability                            concrete for each beam, and yield strength of rein-
during the analysis process; the model can resist shear                        forcement conducted experimentally.
and flexure from applied load hence, behaving like a                              When examining the behavior of fatigue loading on

               Fig. 6 Constitutive relation of cracked concrete under high fatigue loading (Maekawa et al. 2006).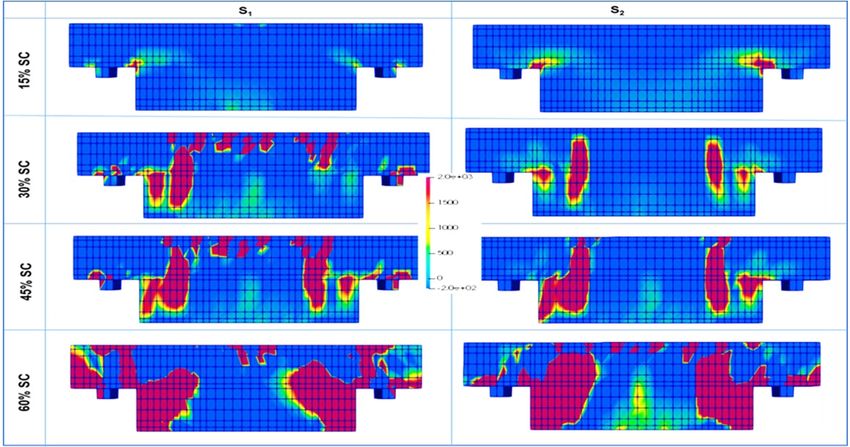
A. I. Quadri and C. Fujiyama / Journal of Advanced Concrete Technology Vol. 19, 536-554, 2021                                         542

reinforced concrete (RC) structure, it is not only essential                   interface assumed to be rigid until the tensile stress
to consider the effect of concrete and that of steel, but                      normal to the interface surpasses the initial bonding.
also the bond interaction between the two. Figure 7b                           Hence, separation causes loss of contact and the
indicates the interface element model considered in place                      Mohr-Coulomb’s circle friction is triggered. After
of the steel and concrete properties under the                                 re-contact, the transfer of stress restart. This
Mohr-Coulomb’s frictional law (Fujiyama and Maekawa                            path-dependency is the frictional contact planes in the
2011). Free normal stress is assumed after the separation                      analysis. Here, the interaction of softened crack shear
of the element. Rabbat and Russell (1985) varied the                           and gap opening is considered. In this study, a sudden
average condition of the frictional coefficient of steel in                    jump from continuum to perfect separation is assumed
concrete or grout between 0.57 and 0.7, in this study,                         for simplicity. In the finite element analysis, the plastic
frictional coefficient (μ) of 0.8 was adopted on the con-                      material properties surrounding the embedded reinforc-
tact surface of the element with an open-slip mode of the                      ing bar are modeled as a unit element with the bond

                                                                         (a)

                                                        (b)
Fig. 7 FEM and interface element models: (a) FEM model of RCDEB, (b) Interface element model (Fujiyama and
Maekawa 2011).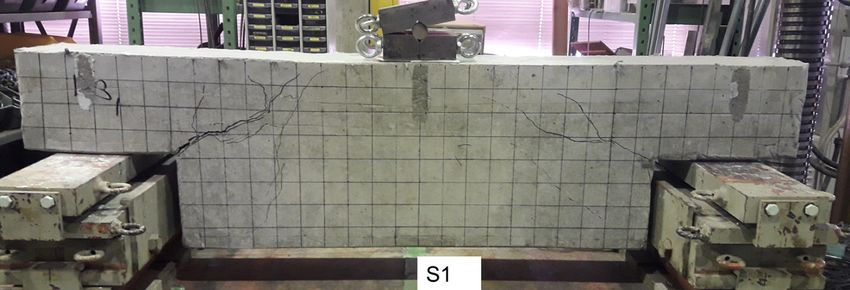
A. I. Quadri and C. Fujiyama / Journal of Advanced Concrete Technology Vol. 19, 536-554, 2021                                        543

interface of zero thickness applied between this unit                          ing magnitude to the nonlinear FE coded in the COM3
element and the surrounding concrete elements. It is                           (Schenk and Gärtner 2004). Three nodes in the transverse
assumed that the behavior of the reentrant portion and the                     direction were selected, loaded, and unloaded consecu-
tension zone under the influence of the modeled bond                           tively. The nodes include the one corresponding to the
loss when subjected to applied load will bring forth the                       shear span to depth ratio of 1 on the right and left sides
stress action. The properties of the interface element used                    and the node at the midpoint of the beam. The same time
are also presented in Table 2.                                                 step applied for the fixed pulsating loading in 0.003
                                                                               seconds was considered here. This is equivalent to 6.67
3.2 Applied loading                                                            m/sec in the real practical consideration under the mov-
Firstly, the beams are simulated under similar conditions                      ing load. In consequence, about 3853 steps of 20 itera-
as in experimental study. S0 and S5 are subjected to                           tions are required for the completion of 5 million cycles
monotonic loading at (a/d=1, where d is the full depth of                      in 45 hours. The structural degradation at the macro-
the undapped section), and at the midpoint respectively                        scopic level when the beam is examined under the ap-
on a set of nodes (left side) in the transverse direction                      plied moving load is demonstrated by tensile cracking,
(see Fig. 7). S2 and S3 are subjected to the fatigue fixed                     compressive crushing, and other forms of failure of
pulsating load at (a/d=1), while S1 and S4 are tested on                       concrete and rupture of reinforcement.
fatigue fixed pulsating load at the midpoint only on
nodes in the transverse direction. The cyclic loading                          4. Results
entails the load application of 5 million cycles with each
loading and unloading of the corresponding nodes at five                       4.1 Static loading case
time steps. Each cyclic loading step was equivalent to                         Figure 8 is presented to show the relationship between
0.003 seconds. Secondly, the authors extend the appli-                         the load and displacement comparison of the experi-
cability of the numerical analysis, by adopting the COM                        mental and numerical analysis under the applied mono-
3 system, to the moving load. Experimental investigation                       tonic loading. The experimental displacement is the net
is not considered in this study due to the availability of                     displacement from the beam’s supports and the calcu-
materials and handling. Three transverse nodes were                            lated value at the loading point, while that of the nu-
selected for the investigation. In real practical engineer-                    merical analysis is obtained from the loading point nodes.
ing, moving loads like the moving vehicles in traffic                          The crack pattern of the beam under static loading when
contribute a serious degradation to the fatigue life of                        loaded at a/d=1 and at the midpoint is shown in Fig. 9,
bridge structures when compared to the fixed pulsating                         while the numerical simulation of the strain distribution
(Matsui 1978). Approximately 2 to 3 order differences in                       of the beam in the x-x direction is presented in Fig. 10.
service life reduction have been reported experimentally                       The authors generally refer to this direction to determine
in RC bridge deck (Deng and Matsumoto 2018; Tang et                            crack strain propagation of the RC under the analysis
al. 2014). In addition, a similar reduction was reported                       approach. Figure 11 presents the experimental and nu-
when the water coupling effect was considered under                            merical analysis of the load versus the strains generated
cyclic loading conditions (Fujiyama et al. 2011). In                           from the hanger reinforcement and the longitudinal nib
conducting the numerical study under the moving load,                          reinforcement close to the dominant cracks of the beam.
the direct integral path constitutive model was consid-                        The strain was obtained automatically with strain gauges
ered to capture the behavior of the RCDEB under the                            connected to the data logger in case of the experiment,
influence of bond deterioration. The direct path is inte-                      while the space average of the strain localized RC ele-
grated by applying the acceleration factor, ξ, in increas-                     ment of the hanger rebar and the nib rebar was taken in

            Fig. 8 Comparison of load-displacement relationships between experiment and analysis (static case).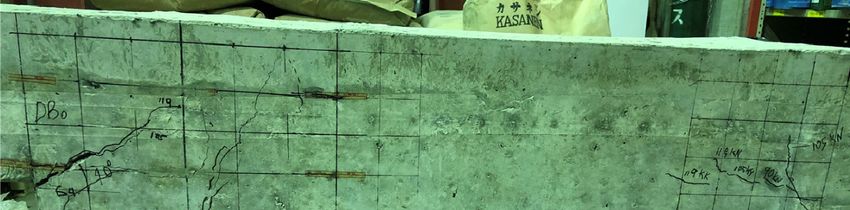
A. I. Quadri and C. Fujiyama / Journal of Advanced Concrete Technology Vol. 19, 536-554, 2021                                          544

case of the numerical analysis.                                                a/d=1 and S5 (loaded at the midpoint), under the static
   The presence of discontinuity at the ends of the DEB                        capacity condition at about 60 kN and 64 kN respectively.
that sits on the supports aggravates the high-stress con-                      Under increasing loads, the diagonal crack advanced and
centration at the re-entrant portions, which leads to the                      increased in width towards the lower part of the loading
emergence of cracks. It is apparent from Fig. 8 that the                       point bringing about stress redistribution and generating
beams exhibit an initial linear-elastic relationship, with                     more stresses from the steel. Due to aggregate interlock,
departure from linearity taking place from approximately                       the diagonal crack was halted, and another crack that led
47 kN when loaded at a/d=1 for both experiment and                             to the shear cracks developed as the monotonic load was
analysis. However, there is an observable early deviation                      further increased. Figure 9 shows the failure pattern of
from linearity when loaded at the midpoint on the ac-                          beams S0 and S5, both of which failed under diagonal
count of the bond loss, and a little difference in loss of                     tension and shear cracks at the critical sections. The first
stiffness between the experimental and analytical results.                     yield load Py (equivalent to load at yielding of hanger
   In the experiment, the first diagonal tension crack was                     bar), the ultimate load, deflection at yielding and ultimate
observed at the reentrant corner, for beams S0 (loaded at                      failure, and the ductility coefficient (the ratio between the

                                                                         (a)

                                                                 (b)
             Fig. 9 Failure pattern of the test under static loading: (a) S0 without bond loss, (b) S5 with bond loss.

                              S0 without bond loss                                            S5 with bond loss
                               Fig. 10 Strain distribution under static loading condition (x-x direction).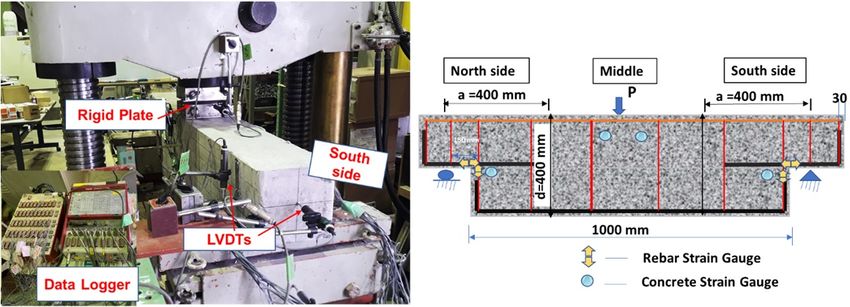
A. I. Quadri and C. Fujiyama / Journal of Advanced Concrete Technology Vol. 19, 536-554, 2021                                            545

                                 Table 3 Load and deflection values and failure mode of the test DEB.
                                                    At ultimate and failure
                          At yielding
                                                         Load Pu (kN)                                  Dc         Type of applied load
    Beam ID            Py (kN)         δy (mm)          Pul            Puf               Δu (mm)     Δu/Δδy
       S0              105.20         1.51          121.60           130.93                6.13       4.06               Static
       S1               87.27         1.19          98.28             100                  6.18       5.19               Cyclic
       S2               63.54         1.37          70.32            75.41                 7.25       5.29               Cyclic
       S3               61.85         0.79          71.17            72.02                 3.94       4.99               Cyclic
       S4               71.17         1.66          78.80            86.42                 7.28       4.39               Cyclic
       S5               95.74         2.05          105.91           108.45                8.86       4.32               Static

deflection at failure and deflection at yielding) of the test                  dominant cracks for S0 and S5 under monotonic loading
RCDEBs were examined and presented in Table 3 for all                          were appraised and presented in Fig. 11, for both ex-
the experimentally test beams. In the case of numerical                        periment and numerical analysis. The first diagonal ten-
analysis by adopting the constitutive model, tension                           sion crack which occurred at a load up to 60 kN has no
cracks are initiated from the reentrant portions in both                       significant effect on the reinforcements’ strain. However,
beams and propagated towards the underside of the                              when the applied load was increased to about 70% of the
loading point. The shear crack developed in beam S5                            first crack load, the strain drastically increased resulting
culminated in the failure of the beam at a capacity of 104                     in shear cracks at the reentrant corner of the beam. The
kN. The cracks generated at the bond loss section flow                         stress generated from the propagated diagonal tension
parallel to the plane section of the beam. Figure 10                           cracks from the reentrant corner was mainly absorbed by
shows the strain distribution of the beams in the x-x                          the intersected hanger reinforcement. The hanger rein-
direction. Close conformity is attested to between the                         forcement of both beams attained their yield strains of
experimental and analytical response of the beams S5,                          2000 μ at approximately the same capacity. Beyond this,
however in S0, the failure capacity, as well as the tension                    a constant load equivalent to the failure load of each
stiffening of the experiment, is higher than the analysis,                     beam produced a dramatic increase in the strain of the
because of the disparity in the crack propagation stage                        hanger rebar. The same strain response is observed when
under static loading conditions.                                               the space averaging of the RC strain element close to the
   There is a good correlation between the damage re-                          dominant crack is assessed since the whole nonlinearity
sponse and the failure pattern of the experimental inves-                      of the beam relies on the active cracks. The longitudinal
tigation and the numerical approach. An average maxi-                          strain gauges could have lost contact with the reinforcing
mum load of 130 kN and 125 kN was observed in the                              bar at high stress, as the reinforcement shows no at-
experiment and the numerical model at the same dis-                            tainment of yield strain in the experiment. However,
placement for beam S0. An average maximum load of                              there is an appreciable increasing strain response in the
108 kN at 6 mm displacement was observed in the ex-                            analysis over the yield strain.
periment for S5 while the numerical values gave a
maximum load of 105 kN at 5.5 mm displacement. The                             4.2 Cyclic loading case
maximum load difference, in this case, is minimal. The                         4.2.1 At midpoint (S1 and S4)
validated numerical model can embellish the experi-                            After the static capacity of the RCDEB has been estab-
mental study and can efficaciously assist in enriching the                     lished from the experimental study under the monotonic
insight into the problem domain.                                               loading, the stepwise cyclic loading and unloading con-
   The strain generated from the hanger reinforcement,                         dition was confirmed. A minimum static capacity load
and the longitudinal nib reinforcement close to the                            (SC) of 15% was applied and increased by 15% at every

                      Fig. 11 Comparison of load vs strains between experiment and analysis (static case).
A. I. Quadri and C. Fujiyama / Journal of Advanced Concrete Technology Vol. 19, 536-554, 2021 546
20 cycles until failure. Contact between the beam and the hanger reinforcement while that of the longitudinal re-
load actuator was guaranteed by loading the beam down inforcement from the nib is presented in Fig. 12c for both
to 5% SC. The three-point bending setup and the in- experiment and the analysis. The failure pattern for
strumentation adopted for the static testing of the beam beams S1 and S4 respectively, is shown in Fig. 13. Some
was also employed for the cyclic test. immature cracks close up when the beams were relieved
Figure 12 shows the relationship between the cyclic of the failure load. Figure 14 shows the strain distribu-
load and the vertical displacement for both experiment tion of the beam subjected to cyclic loading at the mid-
and numerical investigation. This is a relative displace- point in x-x direction.
ment obtained by subtracting the vertical displacement at On account of the cyclic load in the experiment, the
the supports from the measured value at the loading point stiffness of the beams degrades gradually with increasing
for the experiment. The strain development around the irrecoverable deformation and a gradual rise in strains of
dominant cracks on the account of the variable cyclic the reinforcements as shown by the cyclic load versus
loading has also been assessed and presented. Figure displacement response in Fig. 12a, cyclic load versus
12b shows the cyclic load-strain relationship from the strain of the hanger reinforcement close to the dominant
(a)
(b)
(c)
Fig. 12 Experiment and analysis comparisons: (a) cyclic load versus displacement, (b) cyclic load versus strain of the
hanger reinforcement, (c) cyclic load versus strain of the longitudinal reinforcement.A. I. Quadri and C. Fujiyama / Journal of Advanced Concrete Technology Vol. 19, 536-554, 2021 547
crack in Fig. 12b and the cyclic load versus longitudinal side of the loading point. Under the same load level, the
nib reinforcement in Fig. 12c. The damage accumulates width of the cracks in beam S1 increased but there was
with increasing amplitude of the cyclic loading when no observable crack propagation. When the cyclic load
cycled and partially unloaded to 5% SC. Changes in was increased to 75% SC at the 10th cycle, the diagonal
displacement and strains of the reinforcements are ob- tension crack in beam S1 propagated more and another
served to be slow when the applied load is between the crack was initiated at the reentrant portion on the right
range of 15% and 45% SC as the load cycle progresses. side. Flexural cracks were observed around the area of
Under the influence of the bond loss, there was no ob- the bond loss in S4 when cycled to 90% SC (corre-
servable crack throughout the applied cyclic load of 15% sponding to an applied load of 86 kN), the shear crack
and 30% SC. During the first cycle of 45% SC, hairy propagated more, and this crack extended upward which
cracks were observed on the left sides of the beams but consequently resulted in the beam failure. Shear cracks
vanished when the beams were unloaded. The stiffness of appeared at the 10th cycle in S1 and traveled towards the
the beams reduced gradually due to the high stress underside of the loading point. S1 failed at an applied
transfer between the aggregates and the reinforcement. load of 100 kN when intentionally cycled beyond 90%
Premature shear crack was observed at 60% SC in the SC. The premature cracks disappeared when the beam
full depth of beam S4 while the previously formed cracks was finally unloaded as shown in Fig. 13a. The lower
had travelled and extended in width towards the under- stiffness and capacity displayed by S4 may be due to
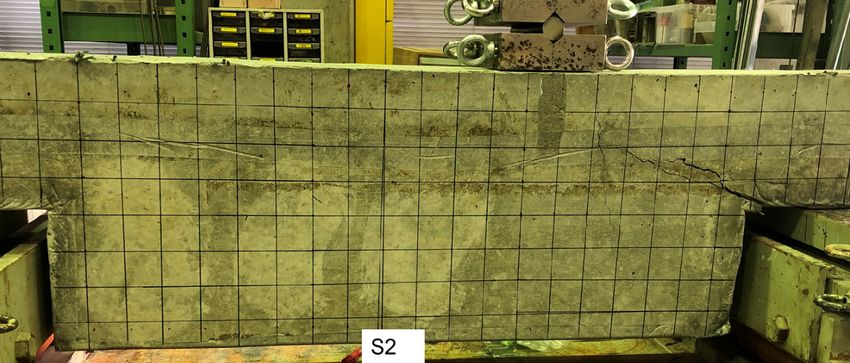
Fig. 13 Failure pattern of the test beam under cyclic loading at the midpoint 00.
(a) S1 (midpoint loading) (b) S4 (midpoint loading)
Fig. 14 Strain distribution under cyclic loading condition (x-x direction).A. I. Quadri and C. Fujiyama / Journal of Advanced Concrete Technology Vol. 19, 536-554, 2021 548
higher bond loss carried when compared with S1 loaded loading conditions.
under the same loading conditions. The total of 110 and
127 cycles were recorded for S1 and S4 respectively. 4.2.2 At a/d=1 (S2 and S3)
In the analysis, the load at failure, as well as the Figure 15 indicates the comparisons of the relationship
stiffness was relatively lower with increasing displace- of the cyclic load-displacement, and the cyclic
ment than the experiment when considered at the same load-strains between experimental investigation and the
condition because of early crack propagation stage and analysis loaded at shear span to depth ratio of 1. The
increase in slip action of the rebar. Regardless of this, the assessment here follows the same pattern as previously
hysteresis loop of the cyclic load-strain follows the same explained. The failure mode of the beams S2 and S3 is
trend as the experimental investigation. The reloading presented in Fig. 16. The crack pattern under the analysis
and unloading under the direct-path integral system in- demonstrated by the strain distribution along x-x direc-
dicate some level of exaggerations when unloaded to 5% tion is shown in Fig. 17.
SC due to localized damage at the critical section of the Energy is absorbed in the loop as the variable ampli-
beam. Almost the same crack pattern is demonstrated tude of the cyclic load is gradually increased until failure.
between the experiment and the analysis under the same In the experimental investigation, crack was initiated at
(a)
(b)
(c)
Fig. 15 Experiment and analysis comparison: (a) cyclic load versus displacement, (b) cyclic load versus strain of the
hanger reinforcement, (c) cyclic load versus strain of the longitudinal reinforcement.A. I. Quadri and C. Fujiyama / Journal of Advanced Concrete Technology Vol. 19, 536-554, 2021 549
the recess corner close to the loading point at the 10th full depth at the reentrant portion; this consequently
cycle for beam S2 and at the second cycle for beam S3 at affected the total stiffness of the beam under the influ-
an applied cyclic load of 30% SC. The crack formed ence of the bond loss. A similar failure pattern was ob-
widened when the load was increased to 45% SC in case served in S3 at the same applied load capacity that re-
of S2 which induced diagonal crack on the other side of sulted in the failure of the beam with an observable
the reentrant portion at the 8th cycle, causing an increase flexural crack at the nib section. The total of 87 and 95
in dowel shear at this corner. The hanger reinforcement at cycles were recorded for S2 and S3 respectively.
this section resisted the cyclic load and induced more It is ascertained that the crack patterns discovered
strain in the steel strain when reloaded as indicated in Fig. under the experiment are clearly simulated under the
15b. However, lesser strain is generated from the nib analytical approach although at a relatively lower ca-
longitudinal reinforcement compared to the hanger bar pacity compared with the experiment. The crack formed
(Fig. 15c). The beam displacement increased gradually traveled diagonally towards the underside of the loading
at 60% static capacity, the reentrant crack propagated point and then propagated vertically downward towards
diagonally to the loading point, which increased the the critical section of the full depth of the beam before
slipping action of the RC. When the load was further developing a diagonal crack at the flexural zone. The
increased to 75%, the crack traveled vertically downward hanger bar close to the dominant cracks bore the stress
from the compression zone to the flexural zone. A large generating high strain as presented in Fig. 15b. Direct
crack opening was formed between the recess and the shear crack was observed in the case of S3 together with
Fig. 16 Failure pattern of the test beam under cyclic loading at a/d=1.
(a) S2 (b) S3
Fig. 17 Strain distribution under cyclic loading condition (x-x direction).A. I. Quadri and C. Fujiyama / Journal of Advanced Concrete Technology Vol. 19, 536-554, 2021 550
concrete crushing at the compression zone. This authen- the beam irrespective of the loading position due to the
ticates the reliability of the analytical mechanism for the discontinuous sections where high stresses concentrate
examination of the RCDEBs under the cyclic loading and when the static load and the low cycle fatigue were
conditions. considered at relatively low capacity i.e., about 15% SC,
the development of crack at any section of the beam was
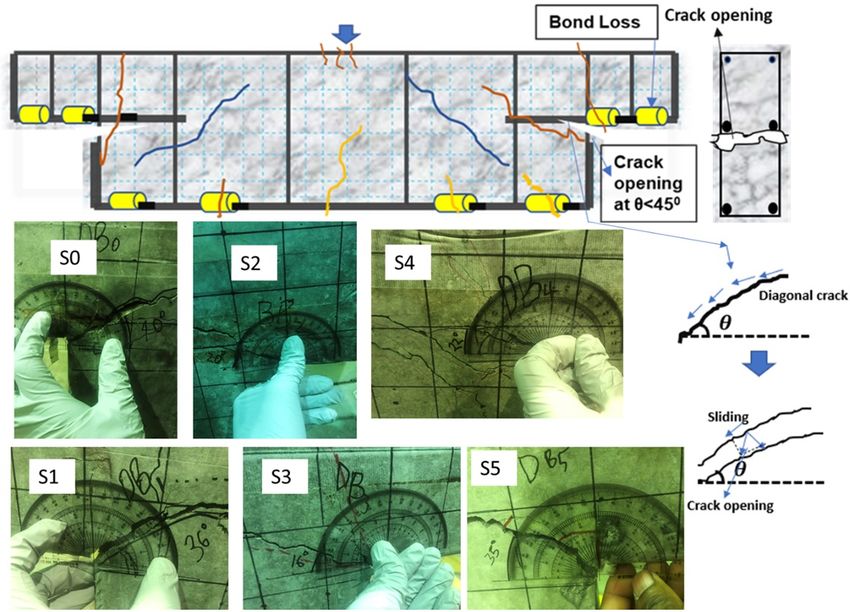
4.2.3 Crack angle inclination not prominent for the time being. Additionally, there
The crack angle inclination to the horizontal of the hardly any effect on the strains of the hanger and the
dominant crack in each beam was examined. Figure 18 longitudinal nib reinforcement in this case. In addition,
indicates the measurement of the crack angle with a when the applied percentage static capacity load was
protractor. The existence of the bond loss between the higher, the hanger reinforcement developed an appre-
concrete and the reinforcement rib under the unloading ciable amount of strain values. The beams tended to have
and reloading states facilitates the crack occurrence to more cracks that propagated to greater extents with
the propagation state of concrete. Beams S1, S2, S3, S4, yielding of stirrups close to the reentrant portion. The
and S5 with the bond loss, carry relatively small crack loading was haltered before stirrup fracturing for further
angles of 31°, 20°, 16°, 22° and 35°, respectively, com- investigation.
pared to the control beam, S0, with a crack angle of 40°. The experimental results established that the ductility,
When the beam is subjected to cyclic loading, there was the capacity to failure of the beam, the strain develop-
an opening between the nib element close to the reentrant ment, the failure mode, and the time taken to complete
corner and the remaining full depth of S2, S3 and S4, the cyclic loading differ significantly depending on the
which has bond loss at the beam as shown in Fig. 18. The loading condition. When the loading positions are com-
crack orientation is changed, the cracks generated near pared, the load magnitude that resulted in crack initiation
the reentrant portion of the RCDEB where the bond loss and propagation under the cyclic loading is different
is located is resisted by the hanger reinforcement and the although of the same initiation point and response at the
longitudinal nib reinforcement. The inclination of the initial phase at the same amount of shear reinforcement.
crack angle to the horizontal is thus reduced while the Thus, the shear capacity is affected by the shear span to
width widened. depth ratio rather than the overall depth of the beam.
Appreciable failure is recorded at a/d=1. Furthermore,
4.2.4 Discussion RCDEBs have the tendency to develop an arch action
The crack is generally initiated at the reentrant corner of that offers more resistance during the cyclic loading
Fig. 18 Inclination of the dominant cracks of experimented RCDEBs and proposed damage pattern of the RCDEB under
the bond loss.A. I. Quadri and C. Fujiyama / Journal of Advanced Concrete Technology Vol. 19, 536-554, 2021 551
beyond the diagonal tension crack, which increases the mum applied percentage static capacity (15% static ca-
shear capacity and ductility of the beam when loaded at pacity) load compared with the other beams, its fatigue
the midpoint (see Figs. 8 and 12a). life cycle reduces to over hundred thousand (100 000).
There is a tolerable level of conformity between the Fatigue life of S2 is below hundred million cycles, while
numerical investigation, under the direct path integral that of S3 reduces below one million cycles (see Fig. 20).
approach based on the time-dependency as discussed Diagonal tension crack at the recess section, shear crack
hitherto, and the experimental examination under static at the full depth of the beams, flexural crack, and com-
and cyclic loading. The proportional peak in the strains pression cracks due to sustained loading were observed
of the assessed reinforcements due to redistribution of in the beams.
stress at high applied load can be identified with the Judging from the response of the beam and the level of
diagonal tension crack emanating from the reentrant damage between the low cycle fatigue (fixed pulsating)
corner and propagating towards the loading point of the and the moving load under the bond deterioration, it is
beams, as this forms the integral damage of the beam. obvious that the moving load offered a devastating effect
Although there is a disparity between the on the RCDEB. The damage was abrupt and concen-
load-displacement of experiment and analysis of S4 (Fig. trated more at the critical portion of the beam at a shorter
12a) due to irrecoverable large plastic deformation of the time, and a relatively lower percentage of static capacity
nib corner, the failure patterns accede well with each loading than the fixed pulsating loading. The dominant
other. The possible explanation could be linked to the problem is the diagonal tension failure developed at the
high level of bond loss incorporated which developed recess portion. When a moving load case was compared
high moment under the cyclic loading. to a fixed pulsating load, Gebreyouhannes et al. (2008)
found a substantial reduction in fatigue life of around 2 to
4.2.5 Moving load results 3 orders of magnitude. A similar reduction was observed
The damage response of the beams extended to the when reversed cyclic load was considered on RC slab
moving type load under the numerical examination is due to slip accumulation around deterioration zones
presented in Fig. 19 by the strain distribution, the dis- (Gebreyouhannes et al. 2008). In this study, it was dis-
placement of the beam under the percentage static ca- covered that the reduction in fatigue life under moving
pacity loading has also been assessed as indicated in Fig. load is also affected by the degree of bond deterioration
20, the oscillation in displacement to number of cycle is of RCDEBs. At minimum applied static capacity of 15%,
as a result of the magnification of the acceleration factor, reductions of the order of 1 to 3 in fatigue life can be seen
ξ, in the direct path integral system (Maekawa et al. when increase in bond deterioration of the beam is
2006a). compared. It is therefore important to devise a strategy
The high cycle fatigue stepwise loading and unloading for preventing corrosion and damage to RCDEBs sub-
process was applied to the three selected nodes in the jected to fatigue loading, such as the moving load prob-
transverse direction. Fatigue applied load of 15%, 30%, lem. In addition, more attention should be paid to the
45%, and 60% static capacity was considered. Firstly, the reentrant corners by providing more stiffness to increase
applied fatigue load was tested at the midpoint (labeled the overall performance of the beam.
1) under the stepwise loading; it was then unloaded and
reloaded on the right (labeled 2) and then point labeled 3. 5. Conclusions
At an applied static capacity of 15%, the cracks were
initiated at the reentrant portion of the beams, but at a 1) The response of the reinforced concrete dapped end
different number of cycles. The crack propagation is beams (RCDEBs) has been investigated experimen-
dependent on the level of the bond loss incorporated in tally and numerically. A total of six beams were tested,
each beam. The response under fatigue shows that two were adopted for static loading, which serves as
cracking can occur when the induced tensile stress in the basis for determining the variable low cycle fa-
concrete reached its ultimate tensile strength around the tigue for the other four beams under the bond dete-
bond loss. The degree of damage in each beam increased rioration between the reinforcing bar and the concrete,
as the cyclic load capacity was increased, depending on in terms of percentage. This was extended to the
the amount of bond deterioration. Moving load typically moving load under the stepwise loading. The first
exhibits reentrant corner damage, with S4 exhibiting the crack always initiated at the reentrant corner with
most damage in short time followed by S3, S2, and S1. different angles of inclination due to shear slip and
At minimum percentage static capacity, it takes beam S1 dilation under an increase bond loss.
around 100 million cycles to fail, while the number of 2) The presence of the bond loss toward the recess corner
cycles decreases as the bond loss increases as presented offers more damage to the beam under the applied
in the displacement versus the number of cycles in loga- load. The presence of shear and diagonal tension
rithmic counts, Fig. 20. The same scenario was observed cracks was evident, indicating the severity of this
in all percentage load cases adopted for the moving load, section under corrosion. There is a considerable re-
except in 60% SC where the beams fail around 2 to 3 duction in ductility at yield load between S1 and S4
cycles for all beams. S4 shows more damage at a mini- subjected to cyclic loading compared with S5 sub-A. I. Quadri and C. Fujiyama / Journal of Advanced Concrete Technology Vol. 19, 536-554, 2021 552
jected to static loading at the midpoint. 41% and 19% further opening, but the hanger reinforcement (stir-
reduction in the ductility was obtained in S1 and S4 rups) close to the reentrant corners of the beams was
when compared with the ductility of S5. When the not that effective in keeping the crack at the reentrant
ductility of S2 and S3 was check and compared with corner from opening as the stresses in the hanger
S0, 9%, and 48% reduction was obtained. reached beyond the yield strength, as estimated by the
3) The nib longitudinal reinforcement and the flexural strain gauges mounted on the bars in this region.
reinforcement adopted were effective in resisting the Hence, more attention should be directed towards this
tensile stresses and keeping the flexural cracks from reentrant corner.
Fig. 19 Strain distribution under the moving loading conditions.A. I. Quadri and C. Fujiyama / Journal of Advanced Concrete Technology Vol. 19, 536-554, 2021 553
Fig. 20 Displacement versus the number of cycles.
4) The damage level of the RCDEB verified numerically dominant degradation mechanisms of RC bridge deck
under the moving load indicated a serious concern as slabs under cyclic moving loads.” International
the position of the moving load dictates when it fails. Journal of Fatigue, 112, 328-340.
The fatigue life of the beams is shortened under a El-Kashif, K. F. and Maekawa, K., (2004).
relatively lower percentage static capacity compared “Time-dependent nonlinearity of compression
to the cyclic loading scenario because of the high softening in concrete.” Journal of Advanced Concrete
stress generated in a short time. Damage could be Technology, 2(2), 233-247.
observed at 15% static capacity in moving load, Farreras-Alcover, I., Chryssanthopoulos, M. K. and
whereas no damage was observed at the same capacity Andersen, J. E., (2017). “Data-based models for
for cyclic load. fatigue reliability of orthotropic steel bridge decks
based on temperature, traffic and strain monitoring.”
References International Journal of Fatigue, 95, 104-119.
ACI, (1995). “Building code requirement for structural Fathalla, E., Tanaka, Y. and Maekawa, K., (2018).
concrete (ACI Code 318-95).” Farmington Hills, “Remaining fatigue life assessment of in-service road
Michigan, USA: American Concrete Institute. bridge decks based upon artificial neural networks.”
ACI, (2019). “Building code requirements for structural Engineering Structures, 171, 602-616.
concrete: Commentary on building code requirements fib, (1996). “Practical design of structural concrete.”
for structural concrete (ACI 318R-19).” Farmington Lausanne, Switzerland: Fédération Internationale du
Hills, Michigan, USA: American Concrete Institute. Béton.
Arya, C., (2009). “Design of structural elements: Concrete, Fujiyama, C., Kobayashi, K., Zhan, J. and Maekawa, K.,
steelwork, masonry and timber designs to British (2011). “Fatigue life simulation of RC bridge slab with
standards and Eurocodes.” 3rd ed. London and New initial defects under water.” Procedia Engineering, 14,
York: Spon Press. 1897-1905.
EN-2, (2005). “Eurocode 2: Design of concrete structures Fujiyama, C., Tang, X. J., Maekawa, K. and An, X. H.,
(European Standard EN 1992-2).” Brussels: European (2013). “Pseudo-cracking approach to fatigue life
Committee for Standardization. assessment of RC bridge decks in service.” Journal of
CEB-FIP, (1993). “CEB-FIP model code 1990: Design Advanced Concrete Technology, 11(1), 7-21.
code.” London: Thomas Telford Ltd. Fujiyama, C. and Maekawa, K., (2011). “Computational
Cook, W. D. and Mitchell D., (1988). “Studies of disturbed simulation for the damage mechanism of steel-concrete
regions near discontinuities in reinforced concrete composite slabs under high cycle fatigue loads.”
members.” ACI Structural Journal, 85(2), 206-216. Journal of Advanced Concrete Technology, 9(2),
Deng, P. and Matsumoto, T., (2018). “Determination of 193-204.A. I. Quadri and C. Fujiyama / Journal of Advanced Concrete Technology Vol. 19, 536-554, 2021 554 Gebreyouhannes, E., Chijiwa, N., Fujiyama, C. and Concrete Institute, 9(2), 627-632. (in Japanese) Maekawa, K., (2008). “Shear fatigue simulation of RC Mattock, A. H. and Chan, T. C., (1979). “Design and beams subjected to fixed pulsating and moving loads.” behavior of dapped-end beams.” PCI Journal, 24(6), Journal of Advanced Concrete Technology, 6(1), 28-45. 215-226. Mohammed, B. S., Aswin, M., Liew, M. S. and Zawawi, Gebreyouhannes, E., Kishi, T. and Maekawa, K., (2008). N. A. W. A., (2019). “Structural performance of RC “Shear fatigue response of cracked concrete interface.” and R-ECC dapped-end beams based on the role of Journal of Advanced Concrete Technology, 6(2), hanger or diagonal reinforcements combined by ECC.” 365-376. International Journal of Concrete Structures and Gjørv, O. E., (2011). “Durability of concrete structures.” Materials, 13(1), Article No. 44. Arabian Journal for Science and Engineering, 36(2), Moreno-Martínez, J. Y. and Meli, R., (2014). 151-172. “Experimental study on the structural behavior of Goto, Y. M., (1971). “Cracks formed in concrete around concrete dapped-end beams.” Engineering Structures, deformed tension bars.” ACI Journal, 68(4), 244-251. 75, 152-163. Hiratsuka, Y., Senda, M., Fujiyama, C. and Maekawa, K., Quadri, A. I. and Fujiyama, C., (2019). “Fatigue (2016). “Fatigue-based structural behavior of RC investigation of RC Gerber girder abutment: A case bridge slabs with different loading histories.” Journal study of the collapse of the De la Concorde (Quebec) of Japan Society of Civil Engineers, Ser. E2 (Materials Bridge in Canada.” In: Proc. 2nd IABSE Young Engineers and Concrete Structures), 72(4), 323-342. (in Japanese) Colloquium, Tokyo, Japan 7-8 November 2019. Johnson, P., (2007). “Report of the commission of inquiry Rabbat, B. G. and Russell, H. G., (1985). “Friction into the collapse of a portion of the de la Concorde coefficient of steel on concrete or grout.” Journal of overpass.” Montréal, Canada: The Government of Structural Engineering, 111(3), 505-515. Quebec. Reynold, G. C., (1969). “The strength of half-joints in Lu, W., Chen, T. and Lin I., (2015). “Shear strength of reinforced concrete beams.” London: Cement and reinforced concrete dapped-end beams with shear Concrete Association. span-to-depth ratios larger than unity.” Journal of Schenk, O. and Gärtner, K., (2004). “Solving unsymmetric Marine Science and Technology, 23, 431-442. sparse systems of linear equations with PARDISO.” Maekawa, K., Toongoenthong, K., Gebreyouhannes, E. Future Generation Computer Systems, 20(3), 475-487. and Kishi, T., (2006a). “Direct path-integral scheme Shakir, M. Q. and Abd, B. B., (2020). “Retrofitting of for fatigue simulation of reinforced concrete in shear.” self compacting RC half joints with internal Journal of Advanced Concrete Technology, 4(1), deficiencies by CFRP fabrics.” Jurnal Teknologi 159-177. (Sciences & Engineering), 82(6), 49-62. Maekawa, K., Soltani, M., Ishida, T. and Itoyama, Y., Suryanto, B., Staniforth, G., Kim, J., Gebreyouhannes, E., (2006b). “Time-dependent space averaged constitutive Chijiwa, N., Fujiyama, C. and Woodward, P. K., modeling of cracked reinforced concrete subjected to (2019). “Investigating the mechanism of shear fatigue shrinkage and sustained loads.” Journal of Advanced in reinforced concrete beams subjected to pulsating Concrete Technology, 4(1), 193-207. and moving loads using digital image correlation.” In: Maekawa, K., Gebreyouhannes, E., Mishima, T. and An, MATEC Web of Conferences 258: Proc. International X., (2006c). “Three-dimensional fatigue simulation of Conference on Sustainable Civil Engineering Structures RC slabs under traveling wheel-type loads.” Journal and Construction Materials, Yogyakarta, Indonesia of Advanced Concrete Technology, 4(3), 445-457. 5-7 September 2018. Les Ulis, France: EDP Sciences. Maekawa, K. and Wang, Z., (2020). “Durability mechanics Syed, Z. I., Kewalramani, M. and Hejah, E. S., (2019). for risk and lifetime assessment of structural “Structural reliability of dapped end beams with concrete.” In: Proc. 6th International Conference on different reinforcement layouts under dynamic Concrete Materials - Performance, Innovations, and loading.” IOP Conference Series: Materials Science Structural Implications, Fukuoka, Japan 27-29 August and Engineering, 575, Article No. 012003. 2020. Tokyo: Japan Concrete Institute. Tang, X. J., Fujiyama, C., Shang, F., Maekawa, K. and Marí, A., Bairán, J., Cladera, A., Oller, E. and Ribas, C., An, X. H., (2014). “Residual fatigue life assessment of (2015). “Shear-flexural strength mechanical model for damaged RC bridge slabs based on site-inspection for the design and assessment of reinforced concrete cracking: A quantitative discussion.” Advances in beams.” Structure and Infrastructure Engineering, Structural Engineering, 17(4), 481-494. 11(11), 1399-1419. Wang, Q., Guo, Z. and Hoogenboom, P. C. J., (2005). Matsui, S., (1987). “Fatigue strength of RC-slabs of “Experimental investigation on the shear capacity of highway bridges by wheel running machine and RC dapped end beams and design recommendations.” influence of water on fatigue.” Proceedings of Japan Structural Engineering and Mechanics, 21(2), 221-235.
You can also read