Sub-diffractional cavity modes of terahertz hyperbolic phonon polaritons in tin oxide - Nature
←
→
Page content transcription
If your browser does not render page correctly, please read the page content below
ARTICLE
                  https://doi.org/10.1038/s41467-021-22209-w                 OPEN

                  Sub-diffractional cavity modes of terahertz
                  hyperbolic phonon polaritons in tin oxide
                  Flávio H. Feres 1,2,9, Rafael A. Mayer1,2,9, Lukas Wehmeier 3,4, Francisco C. B. Maia 1, E. R. Viana5,
                  Angelo Malachias6, Hans A. Bechtel7, J. Michael Klopf8, Lukas M. Eng 3,4, Susanne C. Kehr3, J. C. González6,
                  Raul O. Freitas 1 ✉ & Ingrid D. Barcelos 1 ✉
1234567890():,;

                  Hyperbolic phonon polaritons have recently attracted considerable attention in nanopho-
                  tonics mostly due to their intrinsic strong electromagnetic field confinement, ultraslow
                  polariton group velocities, and long lifetimes. Here we introduce tin oxide (SnO2) nanobelts
                  as a photonic platform for the transport of surface and volume phonon polaritons in the mid-
                  to far-infrared frequency range. This report brings a comprehensive description of the
                  polaritonic properties of SnO2 as a nanometer-sized dielectric and also as an engineered
                  material in the form of a waveguide. By combining accelerator-based IR-THz sources (syn-
                  chrotron and free-electron laser) with s-SNOM, we employed nanoscale far-infrared hyper-
                  spectral-imaging to uncover a Fabry–Perot cavity mechanism in SnO2 nanobelts via direct
                  detection of phonon-polariton standing waves. Our experimental findings are accurately
                  supported by notable convergence between theory and numerical simulations. Thus, the
                  SnO2 is confirmed as a natural hyperbolic material with unique photonic properties essential
                  for future applications involving subdiffractional light traffic and detection in the far-
                  infrared range.

                  1 Brazilian Synchrotron Light Laboratory (LNLS), Brazilian Center for Research in Energy and Materials (CNPEM), Campinas, SP, Brazil. 2 Physics Department,

                  Gleb Wataghin Physics Institute, University of Campinas (Unicamp), Campinas, SP, Brazil. 3 Institute of Applied Physics, Technische Universität Dresden,
                  Dresden, Germany. 4 ct.qmat, Dresden-Würzburg Cluster of Excellence-EXC 2147, Technische Universität Dresden, Dresden, Germany. 5 Department of
                  Physics, Universidade Tecnológica Federal do Paraná (UTFPR), Curitiba, PR, Brazil. 6 Department of Physics, Universidade Federal de Minas Gerais (UFMG),
                  Belo Horizonte, MG, Brazil. 7 Advanced Light Source (ALS), Lawrence Berkeley National Laboratory, Berkeley, CA, USA. 8 Institute of Radiation Physics,
                  Helmholtz-Zentrum Dresden-Rossendorf, Dresden, Germany. 9These authors contributed equally: Flávio H. Feres, Rafael A. Mayer. ✉email: raul.freitas@lnls.
                  br; ingrid.barcelos@lnls.br

                  NATURE COMMUNICATIONS | (2021)12:1995 | https://doi.org/10.1038/s41467-021-22209-w | www.nature.com/naturecommunications                                 1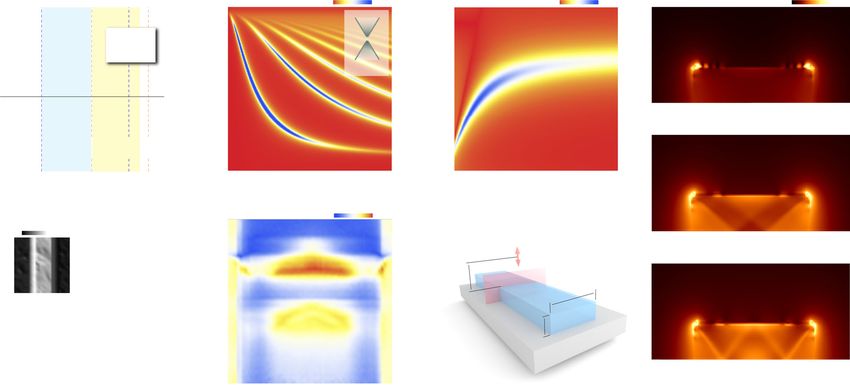
ARTICLE NATURE COMMUNICATIONS | https://doi.org/10.1038/s41467-021-22209-w
P
honon polaritons (PhPs) result from the coupling of elec- SnO2 serves as a unique platform to study the optical transport of
tromagnetic fields and crystal lattice vibrations, creating multimode PhPs. The compelling polaritonic properties of SnO2
bosonic quasi-particles analogous to photons that are stem from its crystalline structure (Fig. 1a) leading to an aniso-
$
confined at interfaces of the crystalline lattices having opposite tropic phononic resonant ε , which is in-plane isotropic
signs of permittivity1. They exist from THz to mid-IR spectral (εxx ¼ εyy ) and out-of-plane anisotropic (εzz ≠εxx ; εyy ). The
frequencies, within Reststrahlen bands (RBs), situated between inversion of signs of the real parts of the permittivity components
transversal ðωTO Þ and longitudinal ðωLO Þ optical phonon in different RBs inside the mid- and far-IR ranges configures a
frequencies2,3. In nanostructured polar dielectric materials, PhPs hyperbolic dispersion for SnO2. Moreover, polar nanometer-sized
enable confinement of light beyond the diffraction limit3,4 crystals of SnO2 ribbons or nanobelts (SnO2-NBs)21–23 have been
allowing super-resolution imaging5, thermal emission6, data reported as key elements in gas sensors24, solar cells25, lithiation
storage7 and offer several advantages, mainly related to the usual electrodes26–28, photonic devices29, flexible and transparent
higher quality factors and significant lower optical losses8 of PhPs electrodes30, water treatment catalysts31, electrochemically active
compared to plasmon polaritons9. Accordingly, PhPs are regar- layers in hydrogen peroxide production32, and photocatalysis33.
ded as an essential element in modern applications such as This is mainly due to their unique optical21,24 and electronic34,35
molecular sensing10, subdiffractional waveguiding11, nano- properties and large surface to volume ratio.
resonators12 and phonon-enhanced microscopy13, primarily in Here we present SnO2-NBs as a lithography-free nanophotonic
the IR spectral range. Particularly in anisotropic media, in which platform suitable for cavity confinement of far-IR HPhPs.
$
the permittivity tensor ε possesses both positive and negative Assisted by scattering scanning near-field optical microscopy (s-
principal components, PhPs propagate inside the material SNOM)36–38 coupled to accelerator-based sources (Fig. 1e, f), we
(volume-confined) and exhibit hyperbolic dispersion14. Conse- employed broadband IR-THz Synchrotron Infrared Nanospec-
quently, hyperbolic 2D materials emerge as robust platforms to troscopy (SINS)39–41 and IR-THz free-electron laser s-SNOM
study nanoscale light–matter interactions as well as fundamental narrowband imaging (FEL s-SNOM)42–44 to experimentally
building blocks for future nanophotonics15,16. access HPhP cavity modes in SnO2-NBs by direct nano-imaging
In the mid-infrared (IR), strongly confined hyperbolic phonon of transverse HPhP standing waves. Our experimental observa-
polaritons (HPhPs) in hBN12,17 and α-MoO318–20 have gained tions are comprehensively described and supported by numerical
much attention as they exhibit natural hyperbolicity and, hence, simulations as well as analytical modeling for the NB as a
enhanced waveguiding properties. Consequently, the search for Fabry–Perot (FP) cavity. Overall, our findings expand the possi-
quantum materials that can support HPhPs in alternative energy bilities of SnO2-NBs from an established 1D-semiconductor to a
ranges is of considerable interest. In the photonics scope, SnO2 unique multimode hyperbolic material naturally optimized for
shows negative permittivity in specific spectral ranges, from mid- the realization of subdiffractional resonators and, potentially,
to far-IR, where different types of polaritons coexist. Accordingly, waveguiding in the far-IR range.
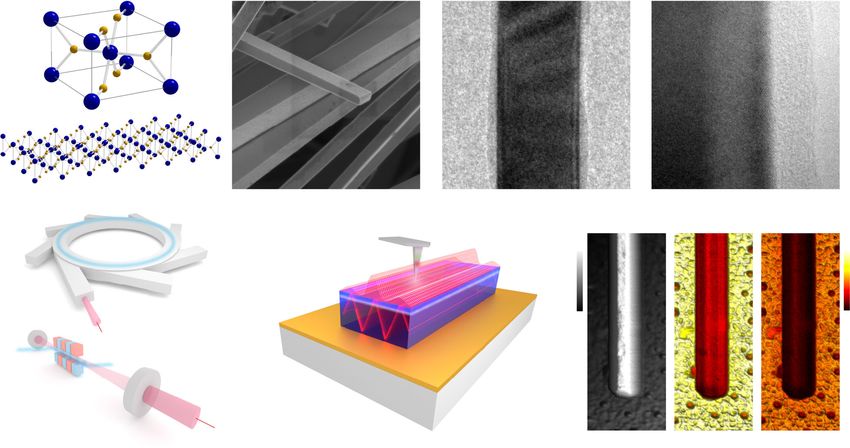
Fig. 1 Overview of SnO2-NBs morphology and spectral nano-imaging experiments. a Schematic of SnO2 unit cell for tetragonal Rutile, and crystalline
structure of the nanobelt. Blue and yellow spheres represent tin (Sn) and oxygen (O) atoms, respectively. b SEM image of SnO2-NBs. c TEM image of an
isolated nanobelt covered by a thin amorphous layer in a carbon grid. d High-magnification TEM image (red square in c) highlighting the crystalline
structure covered by a thin amorphous layer. e Accelerator-based IR-THz sources employed in the spectral nano-imaging experiments. f Experimental
schematic showing the IR-THz beam illuminating a metallic AFM tip (nano-antenna) for the s-SNOM experiment. The highly confined and vertically
polarized electric fields (Ez) at the tip apex launch surface (SPhPs) and volume (HPhPs) polaritons waves in the SnO2-NB. g Morphology (AFM
topography) and broadband reflectivity (|S2| and |S3|) nanoscale images of an isolated SnO2-NB/Au simultaneously measured by SINS. Scale bars in b, c, d,
and g represent 1 µm, 50 nm, 5 nm, and 500 nm, respectively.
2 NATURE COMMUNICATIONS | (2021)12:1995 | https://doi.org/10.1038/s41467-021-22209-w | www.nature.com/naturecommunications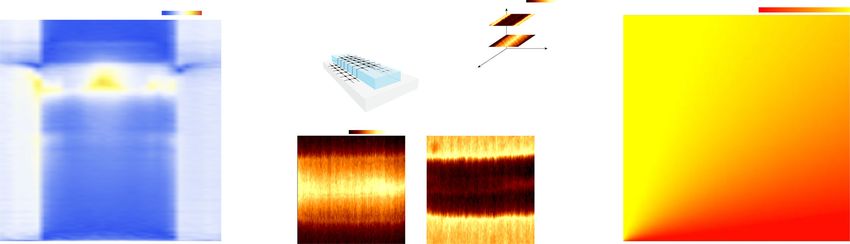
NATURE COMMUNICATIONS | https://doi.org/10.1038/s41467-021-22209-w                                                                       ARTICLE

Fig. 2 Polaritonic activity in SnO2-NBs. a Real part components of the electrical permittivity (εyy and εzz) of SnO2 showing the hyperbolic (HPhP) spectral
region (light blue-shaded Reststrahlen band type I, RB1) and surface phonon polaritons (SPhP) window (light yellow-shaded). b, c Dispersion relation for
volume (HPhPs) and surface (SPhPs) phonon polaritons in SnO2, respectively. False-color plot represents the calculated imaginary part of the complex
reflectivity Im½rp  for an air/SnO2/Au multilayered structure. Dashed lines in b represent the Im½rp  extracted from Eq. 2. M0 and M1,2,... represent the
fundamental and high order phonon mode dispersions, respectively. Inset b depicts the dispersion in isofrequency at 550 cm−1. d SINS amplitude S2(ω)
point spectrum (red solid line) of the SnO2-NB1. Inset shows 1 × 1 µm2 AFM topography of the SnO2-NB1 (t = 93 nm, w = 350 nm), and the red dot
indicates the SINS point spectrum location. FDTD-simulated spectrum (blue dashed line) obtained from |Ez| integration along the red-dashed vertical line in
f. e SINS spectral linescan along the white-dashed line in the inset d. The red solid line profile at the bottom represents the AFM height of the SnO2-NB1.
Vertical white-dashed lines delimit amorphous and crystalline SnO2 phases. Horizontal blue dark-dashed lines denote the HPhPs and SPhPs spectral
ranges. The horizontal orange dashed line indicates the cutoff frequency for this NB. f Parameters-space for the FDTD numerical simulations of the SnO2-
NB1 sample. g Simulated electric field |E| distribution inside the NB revealed by cross-sections at the frequencies 638 (outside RB1), 556, and 530 cm−1,
respectively. The |E| intensity cross-sections highlight the presence of SPhPs (outside RB1) and volume standing waves (HPhPs inside RB1).

Results and discussion                                                          Multimode PhPs in SnO2-NBs: theory and experimental
Morphology, atomic structure, and broadband nano-                               assessments. The SnO2 Rutile-type structure is known to exhibit
reflectivity of SnO2-NBs. Tetragonal Rutile SnO2 (P42/mnm,                       optical phonons in the mid- and far-IR frequency ranges45,46.
space group 136) with lattice constants a = b = 0.473 nm and c =                Thus, the knowledge of these specific phonon frequencies is key
0.318 nm in the form of NBs (Fig. 1a) were morphologically                      to define the photonic suitability of materials. The SnO2 polari-
characterized by scanning and transmission electron microscopy                                                                                $
                                                                                tonic properties are defined in terms of the phononic resonant ε
(SEM and TEM). Figure 1b shows a SEM image of a set of NBs                      components expressed in the Lorentz model
with a clear view of the smooth surface quality and average rec-
tangular shape of the NBs. Typical transverse dimensions are                                          0                2        2 1
                                                                                                                   β          β
50–500 nm wide (w) and a few hundreds of nm thick (t). Lengths                                        B          ω LO;j     ωTO;j     C
can reach up to 50 µm. Figure 1c presents a TEM image of a                                 εβ ¼ εβ;1 @1 þ ∑          2               A     ð1Þ
                                                                                                            j     β                  β
120 nm wide isolated SnO2-NB. Figure 1d displays a high-                                                        ωTO;j ω  iωΓj
                                                                                                                            2

magnification TEM image of the side edge of the NB (red square
area in Fig. 1c) with a clear contrast between crystalline and                                             $
                                                                                where β denotes the ε component, with β ¼ xx ¼ yy or zz,
amorphous phases of the nanostructure34. Complementary, SINS                    having a number j of active optical phonons. εβ;1 is the high-
broadband imaging (Fig. 1g) unveils morphology (AFM topo-                                                                                                β
graphy) and broadband local reflectivity of a SnO2-NB trans-                     frequency term permittivity, ω is the excitation frequency and Γj ,
ferred to Au substrate, a standard configuration for all samples                 the dielectric damping. Using specific values for each of those
analyzed in this work. The AFM topography corroborates the                      parameters (Supplementary Table 1) we obtain the optical
SEM and TEM morphological analysis, while the s-SNOM                            response of the SnO2 as presented in Fig. 2a. Vertical dashed lines
amplitude maps highlight broadband reflectivity indicating a                     indicate the frequencies for SnO2 transverse and longitudinal
preliminary and qualitative view of optical confinement in the                   optical phonon modes in-plane (yy) and out-of-plane (zz), whose
NB. |S2| and |S3| represent the 2nd and 3rd harmonics of the s-                 values are 605 cm−1 (TOyy), 757 cm−1 (LOyy), 465 cm−1 (TOzz),
SNOM tip demodulation, respectively, and confirm the high                        and 704 cm−1 (LOzz).
signal-to-noise ratio and background-free quality of the analysis.                 These phonon modes give rise to the RB, where the real parts
This work analyzed three NBs samples with different dimensions                  of the in-plane and out-of-plane permittivities exhibit opposite
(t, w): SnO2-NB1 (93 nm, 350 nm), SnO2-NB2 (130 nm, 200 nm),                    signs ðRe½εyy   Re½εzz  < 0Þ, indicating that the SnO2 is in the class
and SnO2-NB3 (120 nm, 700 nm).                                                  of material with a hyperbolic isofrequency surface, described by

NATURE COMMUNICATIONS | (2021)12:1995 | https://doi.org/10.1038/s41467-021-22209-w | www.nature.com/naturecommunications                                 3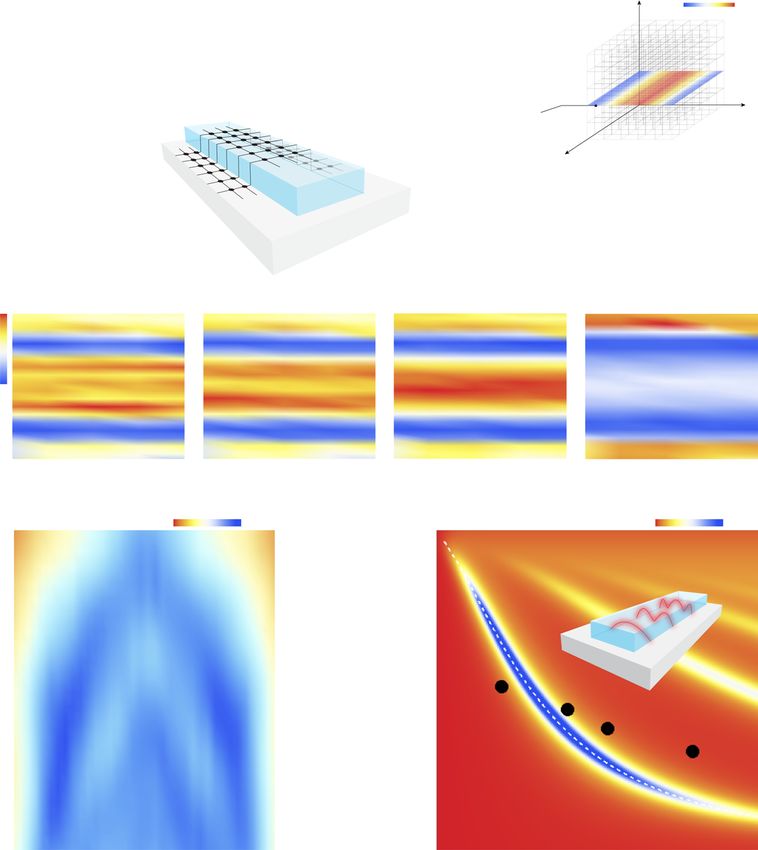
ARTICLE                                                                                          NATURE COMMUNICATIONS | https://doi.org/10.1038/s41467-021-22209-w

k2z   k2                                                                                                 We employed SINS to experimentally access the full spatial-
  þ ε y ¼ k20 . Specifically, the hyperbolic window (shaded in light
εyy   zz                                                                                              spectral response and imaging of PhPs in SnO2-NBs. Free-space
blue in Fig. 2a), defined here as RB type I (RB1) with Re½εyy  > 0,                                   broadband mid- to far-IR synchrotron radiation is strongly
and Re½εzz  < 0, is delimited in the frequency range 465–605 cm−1.                                   confined at the apex of a metallic AFM tip (see “Methods”
In this case, these modes only exist inside the crystalhvolume
                                                         qffiffiffiffii and                                   section) allowing the launching and detection of PhPs waves in
                                                                                         εyy          SnO2-NBs (Fig. 1f), enabled by the momentum match between
propagate with a well-known angle θv ðωÞ ¼ tan1 i                                       εzz   with
                                                                                                      the s-SNOM source/probe and these quasi-particles. The full
respect to the z axis. Although this is a general description for the                                 spectral response across the RB1 of the sample SnO2-NB1 is
SnO2, our approach is limited to thin films as we explore only                                         presented in Fig. 2d. The SINS point spectrum, acquired at the
ultra-confined phenomena, ky  k0 ; with ky ¼ q þ iκ being the                                         center of the NB (red dot in Fig. 2d AFM inset), unveils strong IR
complex in-plane momentum of the HPhP waves.                                                          activity in the frequency range from 420 to 700 cm−1, which are
   Figure 2b, c displays the calculated frequency–momentum                                            assigned to Sn–O antisymmetric vibrations. Within that spectral
(ω  q) PhPs dispersion relation for a 2D SnO2 flake (t = 93 nm).                                      range, the peak at 686 cm−1 is assigned to Sn–O–Sn vibrations,
The false-color maps feature the imaginary part of the Fresnel                                        and the bands in the lower frequency range (430–620 cm−1) are
reflectivity coefficient (Im[rp]) of incident p-polarized light by a                                    attributed to Sn–O stretching vibrations48,49.
multilayered system comprising the Au substrate, SnO2 hyperbolic                                         To explore the polaritonic response of the SnO2-NB1, we
medium, and air. rp is achieved through the following equation:                                       acquired a spectral linescan with 25 nm spatial resolution (Fig. 2e)
                                          ra  rs ei2kez t                                            transverse to the NB (white-dashed line in Fig. 2d inset). Each
                                  rp ¼                                                          ð2Þ   point over the line carries a normalized amplitude spectrum (|S2|
                                         1 þ ra rs ei2kez t                                           = |SSnO2|/|SAu|), as organized in the distance-frequency map
                                                                                                      displayed in Fig. 2e. An AFM profile (red line at the bottom)
              ε k ε k                       ε k ε k
where ra ¼ εyy kair þεair kez and rs ¼ εAu kez þεyy kAu represent the reflectiv-                       overlaps the |S2| spatio-spectral map allowing for a direct
               yy air    air ez               Au ez   yy Au
                                                                                                      correlation between morphology and optical response of the
ity coefficients at the interfaces air and Au substrate, respectively.                                 NB. The AFM profile confirms the dimensions 93 nm × 350 nm (t
t represents the thickness of the SnO2 slab. Those     equations
                                               qffiffiffiffiffiffiffiffiffiffiffiffiffiffiffiffiffi
                                                                ffi also                                × w) for the SnO2-NB1 sample. The linescan experiment unveils a
take into account the z axis momentum ki ¼                         εi k20  k2y , for each            complex spatial-frequency |S2| intensity pattern within the
medium i (where i = Au or air) and the                                                                crystalline phase of the SnO2-NB, delimited by vertical white-
                                     qextraordinary
                                       ffiffiffiffiffiffiffiffiffiffiffiffiffiffiffiffiffiffiffiffiffiffiffiffi momentum
                                                                   ε                                  dashed lines. The spectral response observed is consistent with
inside the anisotropic medium, kez ¼                    εyy k20  εyy k2y . εAu and εair              the calculated permittivity and dispersion relations in Fig. 2a–c.
                                                                       zz
are the Au and air permittivities, respectively.                                                      In the range above 600 cm−1, a strong and uniform near-field
  For the hyperbolic modes, considering highly confined                                                response is attributed to SPhPs, as predicted from the single
subdiffractional waves (ky  k0 ), we can rewrite the z axis and                                      branch dispersion relation in Fig. 2c. Within the RB1 range, the
                                                 qεffiffiffiffi                                               near-field intensity fringes produce an interference pattern of
extraordinary momentum as ki ¼ iky and kez ¼ i εyy ky . Thus, an                                      frequency-dependent standing waves, suggesting transverse
                                                                              zz
analytical expression can be obtained directly from the relation,                                     volume confinement of HPhP waves inside the NB. The
1 þ ra rs ei2kez t ¼ 0. Consequently, this simplified dispersion rela-                                 horizontal orange dashed line in Fig. 2e indicates the cutoff
tion, described by Eq. 3, allows for a more trivial mathematical                                      frequency for the SnO2-NB1, further discussed in this report.
handling17, where iπl represents the multiple branch solutions                                           To support the interpretation of the SINS spatio-spectral
and the signs () follows the dispersion slope.                                                       analysis, we employed finite-difference time-domain (FDTD)
                                           2 0           qffiffiffiffi 1                                      numerical simulations to estimate the mid- to far-IR near-field
                                   sffiffiffiffiffiffi                εyy
                                 1 εyy 6 B yy  ε   εair  εzz C                                       response of the SnO2-NB. Figure 2f presents the parameter space
     ky ðωÞ ¼ qðωÞ þ iκðωÞ ¼               4ln@          qffiffiffiffi A                                      for the numerical simulation, where the metallic tip was modeled
                                 2t εzz        ε þε
                                                          εyy
                                                              yy        air        εzz                as an ideal dipole source positioned 300 nm above the NB surface
                    0 qffiffiffiffi        1      3                                                     ð3Þ   (see “Methods” section). A SnO2 nanobelt with dimensions t =
                         ε
                     εAu εyy  εyy                                                                    93 nm, w = 350 nm, and infinite length was defined as the polar
                    B              C      7
                þ ln@ qffiffiffiffi        A  iπl5; l ¼ 1; 3; 5 ¼
                           zz
                         εyy
                                                                                                      crystal, analogous to the real morphology of the SnO2-
                     εAu ε þ εyy                                                                      NB1 sample. The substrate was modeled as Au in accordance
                                    zz
                                                                                                      with the experimental conditions. Figure 2d shows a simulated
In stark contrast, a major difference between HPhPs and surface                                       |Ez| spectrum (blue dashed amplitude profile) reconstructed from
phonon polaritons (SPhPs) is revealed by their dispersions (Fig.                                      the integration of the out-of-plane electric field underneath the
2b, c) and consequently their θv . Surface phonons cannot exist                                       model dipole (red-dashed line in Fig. 2f) at the center of the NB.
inside the volume, hence, θv assumes pure imaginary values by                                         By comparing experiment and numerical simulation in Fig. 2d, a
the given condition: Re½εzz  < 0 and Re½εyy  < 0. This indicates that                               qualitative match is noticed for the central frequency of the main
these modes are confined to surfaces and interfaces with a single                                      spectral features. In the line shape comparison, there is a fair
branch and do not form standing waves. Yet, in the hyperbolic                                         correspondence between experiment and modeling for the SPhPs
spectral region, multiple distinct branches of HPhPs can exist.                                       (peaks above 600 cm−1), while the HPhP range appears to be less
The fundamental branch (l = 1) is defined as M0 and is the mode                                        trivial to model since volume waves are highly sensitive to the
accessed experimentally in this work. The multiple distinct                                           morphology of the NB. The divergence between simulated and
branches Mm are defined for m ¼ 0; 1; 2; 3; ¼ and, hence, from                                         measured spectrum in Fig. 2d can be attributed to realistic
branches l ¼ 2m þ 1 (Eq. 3). Fundamental (M0) and high order                                          experimental aspects not taken into account in the simulation
(M1, M2,…) modes dispersions are displayed in Fig. 2b inside the                                      (see “Methods” section). For a better understanding of the
RB1, indicating that multimode HPhPs can propagate inside                                             volume PhPs in SnO2-NBs, Fig. 2g displays simulated electric
SnO2-NBs. Moreover, the branches slope (∂ω=∂q) inside the RB1                                         field intensity maps from cross-sections of the SnO2-NB1
have similar behavior to the RB1 of hBN slabs47. Finally, the inset                                   (probing plane in Fig. 2f) when excited by a broadband dipole
of Fig. 2b shows an isofrequency diagram for a SnO2 RB1                                               source (see “Methods” section). At 638 cm−1 (inside the SPhPs
calculated at 550 cm−1.                                                                               window) there is no evidence of the polaritonic activity below the

4                       NATURE COMMUNICATIONS | (2021)12:1995 | https://doi.org/10.1038/s41467-021-22209-w | www.nature.com/naturecommunications
NATURE COMMUNICATIONS | https://doi.org/10.1038/s41467-021-22209-w ARTICLE
Fig. 3 Experimental visualization of cavity modes in SnO2-NBs. a Schematic of the SINS experiment for broadband IR-THz (Δλ) hyperspectral imaging.
b SINS amplitude S2(ω) narrowband maps (10 cm−1 spectral width) reconstructed from a full hyperspectral image of SnO2-NB1/Au for the frequencies 520,
529, 539, and 565 cm−1. Horizontal white-dashed lines delimit crystalline and amorphous phases of the NB. Blue arrows guide the eyes highlighting the
interference fringes formed by HPhP waves inside the SnO2-NB1 crystal. Scale bar represents 200 nm. c Spectral linescan (false-color map) superposed by
SINS amplitude profiles (white circles) extracted from Fig. 2e. Red solid lines represent the FP model fitting (Eq. 5) of the experimental profiles at 510, 520,
529, and 539 cm−1. Amplitude profiles are in arbitrary units and were vertically offset for clarity. d Dispersion relation for HPhP volume fundamental mode
(M0) calculated analytically from Eq. 2 through the imaginary part of the complex reflectivity Im½rp (white-dashed line). White circles represent
frequency–momentum (ω–q) values model-extracted from the fittings in c. Inset illustrates the cavity modes (FP model) for a NB with thickness t and width w.
surface, while in the HPhP window we can clearly notice volume contrast to dielectric waveguides where the cutoff frequency is at
modes at 556 and 530 cm−1. The polaritonic response observed the lower limit of the waveguide mode dispersion, for the SnO2-
in the SINS spectral linescan (Fig. 2e) and supported by NBs the cutoff frequency is at the upper limit since the magnitude
numerical simulations (Fig. 2g) provides a clear indication of of the transversal wavevector increases with decreasing frequency,
the existence of HPhPs standing waves inside the polar crystal, as a consequence of the band type I dispersion of the SnO2 HPhP
therefore, configuring the SnO2-NB as a transverse FP cavity modes. Therefore, the HS analysis provides direct experimental
for PhPs. evidence for the presence of HPhP cavity modes inside the
We carried out SINS hyperspectral (HS) imaging (see crystalline phase of the SnO2-NBs.
Supplementary Note 2) of the SnO2-NB1 for a real-space Figure 3c shows a spectral linescan (false-color map) of the
visualization of the HPhP cavity modes. Figure 3b presents a SnO2-NB1 and respective amplitude profiles extracted at
series of frequency-selected nano-images inside the SnO2 RB1. frequencies 510, 520, 529, and 539 cm−1. In order to understand
These narrowband images were reconstructed from a full HS map the confining mechanism that regulates the wave patterns
in which each pixel of a 2D scanned image contains a full SINS observed in Fig. 3b, c, we considered a model where the tip-
spectrum, as described by the experimental diagram in Fig. 3a. launched HPhP waves (M0 mode), traveling across the y axis of
These images covered a full cross-section of the NB enabling the NB (Fig. 3a), are reflected by its side edges forming a FP cavity
visualization of interference fringes inside the crystal that are (inset Fig. 3d). The mode M0 accumulates a round-trip phase (left
strongly dependent on the excitation frequency. The images at part of the Eq. 4) that is equal to multiple integers of 2π (right
539, 529, and 520 cm−1 unveil a systematic increase in the part of the Eq. 4), thus, satisfying the FP maxima interference
number of intensity maxima inside the NB (blue arrows in Fig. condition according to the following equation50,51:
3b), while the image at 565 cm−1 displays a flat and relatively
2qM0 w þ 2φ ¼ ðn þ 1Þ2π ð4Þ
weak near-field response, since this last excitation frequency lies
well above the cutoff for this cavity (555 cm−1, from Fig. 2e). In where w is the width of the NB, φ is the phase acquired in the
NATURE COMMUNICATIONS | (2021)12:1995 | https://doi.org/10.1038/s41467-021-22209-w | www.nature.com/naturecommunications 5ARTICLE NATURE COMMUNICATIONS | https://doi.org/10.1038/s41467-021-22209-w
Fig. 4 SINS and FEL s-SNOM control measurements outside NBs cavity condition. a Experimental SINS amplitude S2(ω) spectral linescan across the
SnO2-NB2 crystal (t = 130 nm, w = 200 nm). Red line profile at the bottom illustrates the AFM topography profile of the NB. Vertical white-dashed lines
delimit amorphous and crystalline SnO2 phases. Horizontal blue dark-dashed lines denote the volume (HPhPs) and surface (SPhPs) phonon polaritons
spectral ranges. The horizontal orange dashed line indicates the cutoff frequency for this NB. b (top) Tunable THz-IR (λn) s-SNOM nano-imaging
experimental scheme and FEL s-SNOM narrowband maps (bottom) of the SnO2-NB3 (t = 117 nm, w = 700 nm) for the frequencies 561 and 587 cm−1.
Scale bar represents 300 nm. c Cavity cutoff frequency map for M0 modes as a function NBs thickness (t) and width (w). Isofrequency diagonal-dashed
lines denote M0 mode cavity cutoff for the SnO2-NB1, -NB2, and -NB3, analyzed by SINS and FEL s-SNOM in this work.
reflection at the edges, and n is the FP resonance order. Due to is observed. This absence of HPhP response can be accurately
the tip contribution, the distance between adjacent maxima of the explained regarding the cutoff frequency, indicated by the
near-field profile is λM0 =2 for n > 1. Therefore, the momentum horizontal orange dashed line at 502 cm−1, required for the
qM0 can be model-extracted by fitting the following equation to resonant HPhPs to exist in this specific FP cavity. Additionally,
the experimental amplitude profiles (Fig. 3c): Fig. 4b presents free-electron laser far-IR narrowband (FEL s-
w SNOM) nano-images of a 700 nm wide and 117 nm thick NB
I ¼ Asinð2qM0 yÞF y ; γ þ B ð5Þ (sample SnO2-NB3). The FEL s-SNOM experiment is described
2 in Fig. 4b (top), where the IR-THz tunable FEL illuminates a
This approach resembles the case of Alfaro-Mozaz et al.11, where metallic AFM tip (near-field source/probe) in a self-homodyne
a similar equation is applied to extract the momentum of detection scheme for the reconstruction of wavelength-selected
longitudinal hybridized surface modes along with a resonating FP (λn) narrowband far-IR images (see Methods). Narrowband
hBN antenna. Additionally, we multiply the sinusoidal wave by images at 561 and 587 cm−1 (Fig. 4b, bottom) uncover a severe
an effective loss factor, Fðy; γÞ ¼ cosh½γy, to take into account contrast modulation of the near-field response inside the NB,
an effective damping factor γ. The model-extracted qM0 values, which is explained by the in-between frequency cutoff predicted
for the selected frequencies, are plotted as white circles for this FP cavity (577 cm−1).
superposed to the (ω–q) dispersion relation for the HPhP M0 Figure 4c illustrates a false-color map of M0 cutoff frequencies
modes (Fig. 3d). We note a reasonable agreement between theory as a function of the FP cavity form factor. The red-yellow color
and the model-extracted qM0 . Using such values of qM0 as inputs scale spans the whole RB1 and the cavity dimensions ranges are
into the Eq. 4, we found that φ is nearly invariant with n, which defined based on the sample geometries analyzed in this work.
allows us to calculate the mean reflection phase ¼ 0:3π. Isofrequency diagonal-dashed lines, for the FP cavities experi-
Hence, by inserting in Eq. 4 and considering the lowest FP mentally approached, indicate the (w, t) parameters correspond-
order n ¼ 0, we obtain the relation qM0 w ¼ 1:3π that, taken to ing to n ¼ 0. For the nanostructures analyzed by SINS (white star
Eq. 3, enables determining the cutoff frequency map of the FP data points), the frequencies 555 cm−1 and 502 cm−1 indicate the
cavity as a function of w and t, as plotted in Fig. 4c discussed in FP cutoffs for the samples SnO2-NB1 and SnO2-NB2, respec-
detail below. tively. For the FEL s-SNOM nano-imaging experiment (white
As a further matter, the FP model provided an effective lifetime circle data point), the map displays a cutoff line at 577 cm−1 for a
estimate for the cavity modes of τ cv 0.10 ± 0.06 ps, which was FP cavity similar to the SNO2-NB3, which explains the quasi-
obtained from the effective damping factor γ, a fitting parameter negligible near-field response within this NB for an excitation
in Eq. 5 that accounts for the intrinsic damping of the M0 mode frequency above the FP cutoff (Fig. 4b, imaged at 587 cm−1).
and radiative losses that occurs upon the reflection of this mode In this work, we introduce SnO2 as a nanophotonic material
at the NB edges (see Supplementary Note 4 for more details). For suitable for multimode polaritonics in the mid- to far-IR
a comprehensive assessment of standing waves in SnO2-NBs, we frequency ranges. The results reported here place SnO2 in the
employed nanoscale spectral imaging on the analysis of additional list of natural anisotropic hyperbolic materials for extreme light
NBs with different morphologies and, therefore, supplementary confinement (e.g., hBN and MoO3) and extend the range of
cavity parameters. Figure 4a shows a SINS spectral linescan of the applications of this class of material towards the THz range. As a
SnO2-NB2 (t = 130 nm and w = 200 nm, see AFM red line further step into applications, we studied the cavity confinement
profile at the bottom) with full coverage of the PhPs frequency properties of as-grown SnO2-NBs exploring their lithography-free
ranges. In the SPhPs range, a similar intensity pattern is observed advantage. s-SNOM combined with accelerator-based synchro-
compared to a similar experiment on the SnO2-NB1 (Fig. 2e), tron and free-electron laser sources enabled far-IR nanoscale
confirming that the SPhPs are not influenced by the NBs spectral imaging of SnO2-NBs, uncovering an HPhP confinement
dimensions studied here. However, in the RB1, no HPhP activity mechanism consistent to resonant cavities. Hence, our
6 NATURE COMMUNICATIONS | (2021)12:1995 | https://doi.org/10.1038/s41467-021-22209-w | www.nature.com/naturecommunicationsNATURE COMMUNICATIONS | https://doi.org/10.1038/s41467-021-22209-w ARTICLE
experimental data is interpreted on the basis of a FP model, that spectrum acquired on a clean gold surface (100-nm-thick Au sputtered on a silicon
consistently explains the measurements. In summary, this work substrate).
provides a complete nano-optical description of SnO2 as a
dielectric and also as a resonator. For a SnO2-NB with 93 × 350 Free-electron laser scattering scanning near-field optical microscopy (FEL s-
SNOM). FEL-s-SNOM was performed at the free-electron laser FELBE at
nm2 (t × w) cross-section, we present SnO2’s permittivity and Helmholtz-Zentrum Dresden-Rossendorf (Dresden, Germany). FELBE provides
PhPs dispersion relation, covering the RB1 up to the SPhPs pulsed narrowband radiation (spectral width of ~1% of central wavenumber) at
ranges, supported by experimental confirmation by SINS point mid-to-far-IR wavenumbers from 40 to 2000 cm−1 at a repetition rate of 13
spectra and linescan analyses, respectively. Inputting HPhP MHz55. The IR radiation is focused onto the tip (Pt–Ir-coated Si cantilever) of a
volume modes (M0) into the FP model allowed the reconstruction home-built s-SNOM setup42–44 that uses a self-homodyne detection scheme, with
the latter leading to a mixed response of optical amplitude and phase56. The back-
of the dispersion relation for the cavity modes M0, which was scattered light is detected with a MCT detector. Similar to SINS, demodulation at
further attested by SINS hyperspectral analysis. From the model, higher harmonics of the tip-tapping frequency (~160 kHz for our case) is used to
we estimate a confinement factor of ∼50 and an effective lifetime differentiate the near-field signal from the far-field background. AFM tapping
of ∼0.10 ± 0.06 ps for the M0 cavity modes. Additionally, we amplitude was set as ~100 nm peak-to-peak. FEL-s-SNOM 2D |S1| amplitude scans
as shown in Fig. 4b are obtained while keeping all FELBE parameters fixed, i.e., at a
measure two extra NB samples as supplementary evidences for fixed wavenumber. The spectral response is obtained by repeating the measure-
the SnO2 cavity confinement study, including a control experi- ments after tuning the FEL to a different wavenumber.
ment using FEL s-SNOM to demonstrate the presence/absence of
M0 modes below/above the cutoff frequency. Now confirmed as a Numerical simulations. The simulation results shown in Fig. 2 were obtained by
hyperbolic medium highly feasible for THz subdiffractional finite-difference time-domain (FDTD) calculations assisted by the commercial
resonators, we foresee SnO2-NBs as an essential building block code Lumerical FDTD v8.23. We considered an infinite long rectangular cross-
section nanobelt on Au substrate with a thickness (t) and width (w) of 93 and 350
in modern photonics, opening opportunities for light manipula- nm, respectively. The Au dielectric function was taken from Palik57. Both axial and
tion in the far-IR range. transverse components of the SnO2 permittivity, εxx , εyy , and εzz , were described by
a Lorentz model (Supplementary Note 1). The metallic tip was approximated by a
dipole source located at 300 nm above the crystal surface11. In this approach, we
Methods assume that the polarizability of the dipole is weakly affected58 by the polaritons of
Sample preparation. The SnO2-NBs analyzed in this work were synthesized via SnO2. In contrast to usual dipole models for the tip, whose effective dipole moment
gold-catalyst-assisted vapor-liquid-solid (VLS) method21. A suitable amount of depends on the exciting field and the polarizability of a sphere59, the dipole
pure Sn powder (1 g, 4 N pure) was placed on top of a highly p-doped Si substrate moment of the simulated source is constant. Hence, tip–sample coupling effects are
coated with a 300-nm-thick amorphous SiO2 layer. A 5 nm Au layer was previously not considered here. The point spectrum presented in Fig. 2d was calculated by
deposited on the Si/SiO2 substrate, to serve as a catalyst. A tube furnace was heated probing the normal component of the electric field located under the dipole source
up to 800 °C in an air/argon atmosphere, and the temperature was kept constant for a height ranging from 50 nm below to 200 nm above the crystal–substrate
for 2 h. Low O2 concentration on the tube furnace atmosphere is important during interface. This allows one to probe mainly the evanescent/confined fields that
growth, in order to create shallow-level defects. After a 2 h cooling, SnO2-NBs were efficiently couples to the tip. For each vertical position, these values were nor-
found on the Si/SiO2 substrate surface in a cotton-wool-like form. Finally, the malized by the simulated normal component of the electric field without the SnO2-
SnO2-NBs were removed from the original substrate, ultrasonically dispersed in NB. The final spectrum was calculated by averaging these normalized values for all
isopropanol, and then transferred to a fresh thermally evaporated Au(100 nm)/Si probed heights. The field profiles shown in Fig. 2g were calculated by probing the
surface by drop coating. In this way, isolated NBs can be individually studied as magnitude of the electric field in the cross-sectional region of the SnO2-NB. The
illustrated in Fig. 1. The structure of the as-grown nanostructures was determined field signal was apodized below 400 fs to exclude the dipole source excitation from
by X-ray diffraction (XRD) measurements34,52. They can be ascribed to the tet- the frequency-domain data.
ragonal Rutile SnO2 structure (P42/mnm, space group 136) with lattice constants a Additionally, divergences from the simulated to the experimental spectrum in
= b = 0.473 nm, c = 0.318 nm, according to the unit cell shown in Fig. 1a. Fig. 2d can be attributed to (i) divergences from the theoretical and the
Scanning electron microscopy (SEM) images of the nanobelts were performed experimental dielectric tensor, (ii) approximation of the jSn ðωÞj s-SNOM
in a FEG Quanta 200 FEI microscope. Transmission electron microscopy (TEM) amplitude to the simulated |EZ|60, (iii) presence of SnO2 amorphous layer which is
images of an individual SnO2 nanobelt were performed in a Tecnai G2-20 not considered in the simulations, (iv) approximation of the topography of the NB
SuperTwin FEI 200 kV microscope. to an ideal rectangle with sharp edges, and (v) intrinsic experimental features that
cannot be reproduced by this numerical method, such as the shape of the tip,
modulation and demodulation of the tip-scattered signal, and tip–sample coupling
Synchrotron infrared nanospectroscopy (SINS). SINS experiments were per- effects.
formed at the Advanced Light Source (ALS)53 and at the Brazilian Synchrotron
Light Laboratory (LNLS)41,54. Both beamlines use a quite similar optical setup
comprising of an asymmetric Michelson interferometer mounted into a com- Data availability
mercial s-SNOM microscope (NeaSnom, Neaspec GmBH), which can be basically The source data that support the findings of this study are available from the
described by an AFM microscope possessing a suited optical arrangement to corresponding author upon reasonable request. All these data are directly shown in the
acquire the optical near-field. In the interferometer, the incident synchrotron IR corresponding figures without further processing.
beam is split into two components by a beamsplitter defining the two inter-
ferometer arms formed by a metallic AFM tip and an IR high-reflectivity mirror
mounted onto a translation stage. The IR beam component of the tip arm is
Code availability
Scripts for theoretical predictions and contour plot processing are available from the
focused by a parabolic mirror on the tip–sample region. In the experiment, the
AFM operates in semi-contact (tapping) mode, wherein the tip is electronically corresponding authors upon reasonable request.
driven to oscillate (tapping amplitude of ~100 nm) in its fundamental mechanical
frequency Ω (~250 kHz) in close proximity to the sample surface. The incident Received: 21 August 2020; Accepted: 18 February 2021;
light induces an optical polarization to the tip, primarily, caused by charged
separation in the metallic coating, the so-called antenna effect. The optically
polarized tip interacting with the sample creates a local effective polarization. The
back-scattered light stemming from this tip–sample interaction, is combined on the
beamsplitter with the IR reference beam from the scanning arm and detected with
a high speed IR detector. A lock-in amplifier having Ω as the reference fre- References
quency demodulates the signal and removes the far-field contributions. The 1. Low, T. et al. Polaritons in layered two-dimensional materials. Nat. Mater. 16,
resulting interference signal is Fourier-transformed to give the amplitude S ðωÞ 182–194 (2016).
iΦ ðωÞ n
and phase Φn ðωÞ spectra of the complex optical Sn ðωÞ ¼ Sn ðωÞ e n . All SINS 2. Caldwell, J. D. et al. Low-loss, infrared and terahertz nanophotonics using
spectra were measured for n = 2, i.e., S2 ðωÞ. For the mid-IR measurements in the surface phonon polaritons. Nanophotonics 4, 44–68 (2015).
LNLS, we used a mercury cadmium telluride detector (MCT, IR Associates) and a 3. Adachi, S. Optical Properties of Crystalline and Amorphous Semiconductors.
ZnSe beamsplitter in the interferometric setup. For the far-IR measurements at https://doi.org/10.1007/978-1-4615-5241-3 (1999).
ALS Beamline 2.4, a customized Ge:Cu photoconductor, which provides broad- 4. Tamagnone, M. et al. Ultra-confined mid-infrared resonant phonon
band spectral detection down to 320 cm−1, and a KRS-5 beamsplitter were polaritons in van der Waals nanostructures. Sci. Adv. 4, 4–10 (2018).
employed. The spectral resolution was set as 10 cm−1 for a Fourier processing with 5. Li, P. et al. Hyperbolic phonon-polaritons in boron nitride for near-field
a zero-filling factor of 4. All spectra in this work were normalized by a reference optical imaging and focusing. Nat. Commun. 6, 7507 (2015).
NATURE COMMUNICATIONS | (2021)12:1995 | https://doi.org/10.1038/s41467-021-22209-w | www.nature.com/naturecommunications 7ARTICLE NATURE COMMUNICATIONS | https://doi.org/10.1038/s41467-021-22209-w
6. Greffet, J.-J. Coherent emission of light by thermal sources. Nature 416, 61–64 38. Knoll, B. & Keilmann, F. Near-field probing of vibrational absorption for
(2002). chemical microscopy. Nature 399, 134–137 (1999).
7. Ocelic, N. & Hillenbrand, R. Subwavelength-scale tailoring of surface phonon 39. Hermann, P. et al. Near-field imaging and nano-Fourier-transform infrared
polaritons by focused ion-beam implantation. Nat. Mater. 3, 606–609 (2004). spectroscopy using broadband synchrotron radiation. Opt. Express 21,
8. Caldwell, J. D. et al. Atomic-scale photonic hybrids for mid-infrared and 2913–2919 (2013).
terahertz nanophotonics. Nat. Nanotechnol. 11, 9–15 (2016). 40. Bechtel, H. A., Muller, E. A., Olmon, R. L., Martin, M. C. & Raschke, M. B.
9. Luo, X., Qiu, T., Lu, W. & Ni, Z. Plasmons in graphene: recent progress and Ultrabroadband infrared nanospectroscopic imaging. Proc. Natl. Acad. Sci.
applications. Mater. Sci. Eng. R. Rep. 74, 351–376 (2013). USA 111, 7191–7196 (2014).
10. Autore, M. et al. Boron nitride nanoresonators for phonon-enhanced 41. Freitas, R. O. et al. Low-aberration beamline optics for synchrotron infrared
molecular vibrational spectroscopy at the strong coupling limit. Light Sci. nanospectroscopy. Opt. Express 26, 11238 (2018).
Appl. 7, 17172 (2018). 42. Kuschewski, F. et al. Narrow-band near-field nanoscopy in the spectral range
11. Alfaro-Mozaz, F. J. et al. Nanoimaging of resonating hyperbolic polaritons in from 1.3 to 8.5 THz. Appl. Phys. Lett. 108, 113102 (2016).
linear boron nitride antennas. Nat. Commun. 8, 15624 (2017). 43. Wehmeier, L. et al. Phonon-induced near-field resonances in multiferroic
12. Caldwell, J. D. et al. Sub-diffractional volume-confined polaritons in the BiFeO3 thin films at infrared and THz wavelengths. Appl. Phys. Lett. 116,
natural hyperbolic material hexagonal boron nitride. Nat. Commun. 5, 5221 071103 (2020).
(2014). 44. Wehmeier, L. et al. Polarization-dependent near-field phonon nanoscopy of
13. Hillenbrand, R., Taubner, T. & Keilmann, F. Phonon-enhanced light–matter oxides: SrTiO3, LiNbO3, and PbZr0.2Ti0.8O3 Phys. Rev. B 100, 47–52 (2019).
interaction at the nanometre scale. Nature 418, 159 (2002). 45. van Daal, H. J. Polar optical-mode scattering of electrons in SnO2. Solid State
14. Narimanov, E. E. & Kildishev, A. V. Naturally hyperbolic. Nat. Photon. 9, Commun. 6, 5–9 (1968).
214–216 (2015). 46. Jarzebski, Z. M. Physical properties of SnO2 materials. J. Electrochem. Soc. 123,
15. Wu, J.-S., Basov, D. N. & Fogler, M. M. Topological insulators are tunable 333C (2006).
waveguides for hyperbolic polaritons. Phys. Rev. B 92, 205430 (2015). 47. Feres, F. H. et al. Dipole modelling for a robust description of subdiffractional
16. Gilburd, L. et al. Hexagonal boron nitride self-launches hyperbolic phonon polariton waves. Nanoscale 11, 21218–21226 (2019).
polaritons. J. Phys. Chem. Lett. 8, 2158–2162 (2017). 48. Sagadevan, S. & Podder, J. Optical and electrical properties of nanocrystalline
17. Dai, S. et al. Tunable phonon polaritons in atomically thin van der Waals SnO2 thin films synthesized by chemical bath deposition method. Soft
Crystals of boron nitride. Sci 343, 1125–1129 (2014). Nanosci. Lett. 05, 55–64 (2015).
18. Zheng, Z. et al. A mid-infrared biaxial hyperbolic van der Waals crystal. Sci. 49. Ocaña, M. & Serna, C. J. Variations of the infrared powder spectra of TiO2
Adv. 5, 1–9 (2019). and SnO2 (rutile) with polarization. Spectrochim. Acta Part A Mol. Spectrosc.
19. Zheng, Z. et al. Highly confined and tunable hyperbolic phonon polaritons in 47, 765–774 (1991).
Van Der Waals semiconducting transition metal oxides. Adv. Mater. 30, 1–9 50. Dolado, I. et al. Nanoscale guiding of infrared light with hyperbolic volume and
(2018). surface polaritons in van der Waals material ribbons. Adv. Mater. 32, 1906530 (2020).
20. Ma, W. et al. In-plane anisotropic and ultra-low-loss polaritons in a natural 51. Landreman, P. E., Chalabi, H., Park, J. & Brongersma, M. L. Fabry-Perot
van der Waals crystal. Nature 562, 557–562 (2018). description for Mie resonances of rectangular dielectric nanowire optical
21. Viana, E. R., González, J. C., Ribeiro, G. M. & de Oliveira, A. G. resonators. Opt. Express 24, 29760–29772 (2016).
Photoluminescence and high-temperature persistent photoconductivity 52. Yamanaka, T., Kurashima, R. & Mimaki, J. X-ray diffraction study of bond
experiments in SnO2 nanobelts. J. Phys. Chem. C 117, 7844–7849 (2013). character of rutile-type SiO2, GeO2, SnO2. Z. fur Krist. 215, 424–428 (2000).
22. D’Arsié, L. et al. Improved recovery time and sensitivity to H2 and NH3 at 53. Khatib, O., Bechtel, H. A., Martin, M. C., Raschke, M. B. & Carr, G. L. Far
room temperature with SnOx vertical nanopillars on ITO. Sci. Rep. 8, 10028 infrared synchrotron near-field nanoimaging and nanospectroscopy. ACS
(2018). Photonics 5, 2773–2779 (2018).
23. Yuan, Y. et al. Effect of unsaturated Sn atoms on gas-sensing property in 54. Barcelos, I. D. et al. Probing polaritons in 2D materials with synchrotron
hydrogenated SnO2 nanocrystals and sensing mechanism. Sci. Rep. 7, 1–9 infrared nanospectroscopy. Adv. Opt. Mater. 8, 1–16 (2020).
(2017). 55. Klopf, J. M. et al. FELBE-upgrades and status of the IRlTHz FEL user facility
24. Viana, E. R., Ribeiro, G. M., de Oliveira, A. G. & González, J. C. Metal-to- at HZDR. In 2018 43rd International Conference on Infrared, Millimeter, and
insulator transition induced by UV illumination in a single SnO2 nanobelt. Terahertz Waves (IRMMW-THz) 1–2. https://doi.org/10.1109/IRMMW-
Nanotechnology 28, 445703 (2017). THz.2018.8510402 (2018).
25. Banik, A., Ansari, M. S. & Qureshi, M. Efficient energy harvesting in SnO2- 56. Knoll, B. & Keilmann, F. Enhanced dielectric contrast in scattering-type
based dye-sensitized solar cells utilizing nano-amassed mesoporous zinc oxide scanning near-field optical microscopy. Opt. Commun. 182, 321–328 (2000).
hollow microspheres as synergy boosters. ACS Omega 3, 14482–14493 (2018). 57. Palik, E. D. Handbook of Optical Constants of Solids, Elsevier Science (2012).
26. Yuan, Y., Amine, K., Lu, J. & Shahbazian-Yassar, R. Understanding materials 58. Nikitin, A. Y. et al. Real-space mapping of tailored sheet and edge plasmons in
challenges for rechargeable ion batteries with in situ transmission electron graphene nanoresonators. Nat. Photonics 10, 239–243 (2016).
microscopy. Nat. Commun. 8, 15806 (2017). 59. Hillenbrand, R. & Keilmann, F. Complex optical constants on a
27. Huang, J. Y. et al. In situ observation of the electrochemical lithiation of a subwavelength scale. Phys. Rev. Lett. 85, 3029–3032 (2000).
single SnO2 nanowire electrode. Science 330, 1515–1520 (2010). 60. Neuman, T. et al. Mapping the near fields of plasmonic nanoantennas by
28. Zhang, L. et al. V2O5 -C-SnO2 hybrid nanobelts as high performance anodes scattering-type scanning near-field optical microscopy. Laser Photonics Rev. 9,
for lithium-ion batteries. Sci. Rep. 6, 1–9 (2016). 637–649 (2015).
29. Law, M. et al. Nanoribbon waveguides for subwavelength photonics
integration. Science 305, 1269–1273 (2004).
30. Li, Q. et al. 3D ITO-nanowire networks as transparent electrode for all-terrain Acknowledgements
substrate. Sci. Rep. 9, 1–9 (2019). We thank the Brazilian Synchrotron Light Laboratory (LNLS), Advanced Light Source
31. Hodges, B. C., Cates, E. L. & Kim, J.-H. Challenges and prospects of advanced (ALS), and Helmholtz-Zentrum Dresden-Rossendorf (HZDR) for providing beamtime for
oxidation water treatment processes using catalytic nanomaterials. Nat. the experiments. Parts of this research were carried out at ELBE at the Helmholtz-
Nanotechnol. 13, 642–650 (2018). Zentrum Dresden-Rossendorf e. V., a member of the Helmholtz Association. I.D.B., E.R.
32. Shi, X. et al. Understanding activity trends in electrochemical water oxidation V., and J.C.G. thank Geraldo M. Ribeiro (UFMG) for preliminary studies of production
to form hydrogen peroxide. Nat. Commun. 8, 1–12 (2017). and characterization of tin oxide nanobelts and A. Gobbi (LNNano), and M.H.O. Piazetta
33. Zhu, L., Hong, M. & Ho, G. W. Hierarchical assembly of SnO2/ZnO (LNNano) for the support on samples preparation. R.O.F. and I.D.B. thank T.M. Santos
nanostructures for enhanced photocatalytic performance. Sci. Rep. 5, 1–11 (LNLS) and A. Cernescu (Neaspec) for technical assistance. I.D.B. and A.M. acknowledge
(2015). the financial support from the Brazilian Nanocarbon Institute of Science and Technology
34. Viana, E. R., González, J. C., Ribeiro, G. M. & Oliveira, A. G. 3D hopping (INCT/Nanocarbono). F.C.B.M. and F.H.F. acknowledge the CNPq project 140594/2020-
conduction in SnO2 nanobelts. Phys. Status Solidi Rapid Res. Lett. 6, 262–264 5. R.O.F. and R.A.M. acknowledge the FAPESP project 2019/08818-9. R.O.F. acknowl-
(2012). edges the support from CNPq through the research grant 311564/2018-6 and FAPESP
35. Viana, E. R., González, J. C., Ribeiro, G. M. & de Oliveira, A. G. Electrical Young Investigator grant 2019/14017-9. I.D.B. acknowledges the support from CNPq
observation of sub-band formation in SnO2 nanobelts. Nanoscale 5, through the research grant 311327/2020-6. J.C.G. acknowledges the financial support of
6439–6444 (2013). Brazilian agencies CNPq and FAPEMIG. L.W., L.M.E., and S.C.K. acknowledge funding
36. Kawata, S. & Inouye, Y. Scanning probe optical microscopy using a metallic by the BMBF under grants 05K16ODA and 05K19ODB, as well as by the Würzburg-
probe tip. Ultramicroscopy 57, 313–317 (1995). Dresden Cluster of Excellence on Complexity and Topology in Quantum Matter (ct.qmat)
37. Zenhausern, F., Martin, Y. & Wickramasinghe, H. K. Scanning interferometric and by the TU Dresden graduate academy. E.R.V. would like to acknowledge the CNPq
apertureless microscopy: optical imaging at 10 angstrom resolution. Science projects 403360/2016-1 and 311534/2017-1, the Center of Microscopy at the Universidade
269, 1083–1085 (1995). Federal de Minas Gerais (UFMG) and Universidade Tecnológica Federal do Paraná
8 NATURE COMMUNICATIONS | (2021)12:1995 | https://doi.org/10.1038/s41467-021-22209-w | www.nature.com/naturecommunicationsNATURE COMMUNICATIONS | https://doi.org/10.1038/s41467-021-22209-w ARTICLE
(CMCM-UTFPR-CT) for providing the equipment and technical support for the electron Peer review information Nature Communications thanks Francisco Javier Alfaro-
microscopy experiments. This research used resources of the Advanced Light Source, a U. Mozaz, Harry Ruda and the other, anonymous, reviewer(s) for their contribution to the
S. DOE Office of Science User Facility under contract no. DE-AC02-05CH11231. peer review of this work. Peer reviewer reports are available.
Reprints and permission information is available at http://www.nature.com/reprints
Author contributions
I.D.B. together with E.R.V. and J.C.G. initiated the research. E.R.V. and J.C.G. prepared
Publisher’s note Springer Nature remains neutral with regard to jurisdictional claims in
the samples. A.M. provided the interpretation of the crystalline structure of the
published maps and institutional affiliations.
nanoblets. I.D.B., H.A.B., F.C.B.M., and R.O.F. carried out the SINS experiments. J.M.K.,
L.M.E., L.W. , and S.C.K. prepared the instrumentation for the FEL measurements. I.D.
B., L.W., and F.C.B.M. carried out the FEL experiments. I.D.B., R.A.M., and F.H.F.
performed post-experimental data analysis. I.D.B., R.O.F., F.H.F., and R.A.M. interpreted Open Access This article is licensed under a Creative Commons
the theoretical approach of polaritonic modes. R.A.M. developed the FDTD simlulations. Attribution 4.0 International License, which permits use, sharing,
All authors took part in the interpretation of the phenomena. I.D.B., F.H.F., R.A.M., and adaptation, distribution and reproduction in any medium or format, as long as you give
R.O.F. prepared the manuscript. appropriate credit to the original author(s) and the source, provide a link to the Creative
Commons license, and indicate if changes were made. The images or other third party
material in this article are included in the article’s Creative Commons license, unless
Competing interests indicated otherwise in a credit line to the material. If material is not included in the
The authors declare no competing interests.
article’s Creative Commons license and your intended use is not permitted by statutory
regulation or exceeds the permitted use, you will need to obtain permission directly from
Additional information the copyright holder. To view a copy of this license, visit http://creativecommons.org/
Supplementary information The online version contains supplementary material licenses/by/4.0/.
available at https://doi.org/10.1038/s41467-021-22209-w.
Correspondence and requests for materials should be addressed to R.O.F. or I.D.B. © The Author(s) 2021
NATURE COMMUNICATIONS | (2021)12:1995 | https://doi.org/10.1038/s41467-021-22209-w | www.nature.com/naturecommunications 9You can also read