Calcite Precipitation at Cement-Bentonite Interface. Part 1: Effect of Carbonate Admixture in Bentonite
←
→
Page content transcription
If your browser does not render page correctly, please read the page content below
Journal of Advanced Concrete Technology Vol. 19, 433-446, May 2021 / Copyright © 2021 Japan Concrete Institute                         433

Scientific paper

Calcite Precipitation at Cement–Bentonite Interface. Part 1: Effect of
Carbonate Admixture in Bentonite
Kenichiro Nakarai1*, Masahito Shibata2, Hiroyuki Sakamoto3, Hitoshi Owada4 and
Georg Kosakowski5

Received 1 November 2020, accepted 22 April 2021                                                                     doi:10.3151/jact.19.433

Abstract
Calcium leaching from cementitious materials into bentonite is a key process for the long-term alteration of cement–clay
interfaces of engineered barrier systems. Strong chemical gradients between cement and clay drive the precipitation of
minerals such as calcium silicate hydrate (C–S–H) and calcite. To analyze the mineralogical and porosity evolution at the
cement–clay interface, composite specimens consisting of cement paste and bentonite mixed with various amounts of
sodium carbonate were subjected to immersion and chloride migrations tests and were investigated by electron probe
micro-analysis (EPMA), thermogravimetry/differential thermal analysis (TG-DTA), and X-ray diffraction (XRD) after
4–20 months of immersion. The results show that adding sodium carbonate to the bentonite enhanced the formation of
calcite in the form of a surface layer on the cement paste. This suggests pore clogging at the interface and implies the
existence of a threshold amount of carbonate addition above which pore clogging occurs. This is the first of two papers;
the accelerated evolution of the samples in the presence of an electrical field is discussed in the second paper.

1. Introduction                                                               Walker 2004). In many design concepts, clay materials
                                                                              such as bentonite are also used to seal access galleries
The safe management and disposal of waste in general                          and engineered barriers (Pusch 1992; Metcalfe and
and specifically of toxic and radioactive waste is of                         Walker 2004; Sugita et al. 2007). Furthermore, deep
critical importance for maintaining a safe and sustainable                    geological repositories are sometimes located in clay
society (Lang-Lenton León 2001). The designs of waste                         host rock (Alexander and McKinley 2007).
repositories vary depending on the type of waste and the                         Because of the large geochemical differences between
national regulations; however, the design should always                       cement and clay, the long-term evolution of clay–cement
follow international standards for safe disposal (IAEA                        interfaces is an active area of research (Gaucher and
2011).                                                                        Blanc 2006; Gaucher et al. 2009; Savage 2013; Marty et
   In the case of radioactive waste, the majority of de-                      al. 2015; Luraschi et al. 2020). The chemical gradient
signs utilize significant quantities of cement-based ma-                      can cause the dissolution of primary minerals in both
terials for constructing access galleries, storage cells,                     materials and induce the precipitation of secondary
concrete plugs, and engineered barriers as well as for                        minerals near the interface. Mineralogical changes in-
backfilling voids (Glasser and Atkins 1994; Metcalfe and                      duce changes in porosity, transport parameters, and
                                                                              mechanical properties, and can therefore compromise or
                                                                              enhance the functionality of clay and cement materials.
1
 Professor, Hiroshima University, Civil and Environ-                             Early experimental studies on clay–cement contacts
mental Engineering Program, 1-4-1 Kagamiyama,                                 utilized batch experiments to investigate the evolution of
Higashi-Hiroshima-shi, Hiroshima 739-8527, Japan.                             clay powder or compacted clay samples in alkaline so-
*Corresponding author,                                                        lutions (Gaucher and Blanc 2006). More recently, ex-
E-mail: nakarai@hiroshima-u.ac.jp                                             perimental investigations have focused on examining the
2
 Research Engineer, Taiheiyo Consultant Co. Ltd.,                             interactions between hardened cement/mortar/concrete
Electric and Nuclear Power Technology Department,                             and compacted clay, including mass transport processes
2-4-2, Ohsaku, Sakura-shi 285-0802, Japan.                                    across the cement–clay interface (Dauzeres et al. 2010;
3
 General Manager, Taiheiyo Consultant Co. Ltd.,                               Fernández et al. 2016; Yamaguchi et al. 2016; Balmer et
Electric and Nuclear Power Technology Department,                             al. 2017; Luraschi et al. 2020).
2-4-2, Ohsaku, Sakura-shi 285-0802, Japan.                                       Long-term in-situ experiments in underground re-
4
 Manager, Radioactive Waste Management Funding and                            search laboratories (URLs) on cement–clay interactions
Research Center, Research and Development of Geo-                             have also been conducted, for example in Mol (Belgium)
logical Disposal Barrier System, 6-4, Akashicho,                              (Read et al. 2001), Tournemire (France) (Tinseau et al.
Chuo-Ku, Tokyo 104-0044, Japan.                                               2006; Gaboreau et al. 2011), Bure (France) (Gaboreau et
5
 Senior Scientist, Paul Scherrer Institute, Laboratory for                    al. 2012), Grimsel (Switzerland) (Fernández et al. 2017)
Waste Management, Forschungsstrasse 111, 5232                                 and Mont Terri (Switzerland) (Jenni et al. 2014; Mäder et
Villigen PSI, Switzerland.                                                    al. 2017). These long-term experimental studies have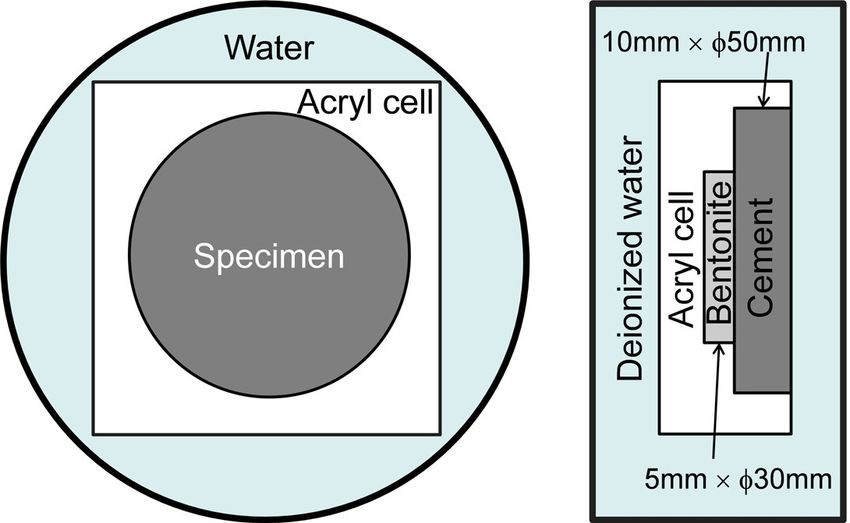
K. Nakarai, M. Shibata, H. Sakamoto, H. Owada and G. Kosakowski / Journal of Advanced Concrete Technology Vol. 19, 433-446, 2021      434

revealed the precipitation of secondary minerals such as                      in turn, result in the release of silica, which also diffuses
calcium silicate hydrate (C–S–H), magnesium silicate                          toward the interface from the clay compartment and
hydrate (M–S–H), calcite (Gaboreau et al. 2012;                               contributes to secondary C–S–H formation. In addition,
Fernández et al. 2017; Mäder et al. 2017), and gypsum                         carbonate concentrations are generally higher in clay
(Gaboreau et al. 2012) near the cement–clay interface                         pore waters with intermediate pH than in those with high
and corresponding reduction in porosity. Previous labo-                       pH; hence, calcite formation is observed in the latter.
ratory and field experiments have revealed that the                           Although the calculated mineralogical evolution quali-
typical extensions of porosity changes at cement–clay                         tatively agrees with experimental data, the calculated
interfaces were a few hundred micrometers to a few                            clogging times often depend on the discretization of the
millimeters in a few years (Jenni et al. 2014; Luraschi et                    modeling domain and the parametrization of kinetic
al. 2020). Longer experiments with interaction times                          control of mineral precipitation/dissolution (Marty et al.
greater than 10 years showed detectible porosity changes                      2009; Hayek et al. 2011, 2012). At the clogging times,
up to 1–2 cm from the interface (Gaboreau et al. 2020,                        the mineralogical alteration depth in the clay barrier from
2011). Larger changes were common in the cement                               the interface with cement significantly varies, for exam-
material. While porosity was often reduced near the                           ple, from 1 mm to 20 cm (Marty et al. 2009).
interface, porosity further away from the interface in-                          Experimental studies reported to date have shown that
creased owing to the dissolution of hydrated cement                           the precipitation of carbonates, pore structure, and pore
phases. However, unambiguous conclusions regarding                            size distribution change significantly during concrete
the mechanism of pore clogging have not yet been iden-                        carbonation (Patel et al. 1985; Ngala and Page 1997;
tified to date.                                                               Šavija and Luković 2016). The type of cement material
   It is impossible to experimentally assess the very                         has a strong impact on the consequences of carbonation;
long-term evolution of cement–clay interfaces as part of                      it is expected that, as a consequence of carbonation, the
the engineered barrier system for the lifetime of a deep                      porosity of cement paste might change. In their review,
geological repository. Computer simulations are fre-                          Šavija and Luković concluded that the porosity decreases
quently used to predict the evolution of chemical condi-                      for Portland cement paste and concrete while the porosity
tions and material properties in deep geological reposi-                      increases for blended cement paste as a result of car-
tories. Such predictions require a thorough understanding                     bonation (Šavija and Luković 2016). Similar observa-
of the chemical reactivity of materials influenced by the                     tions have been reported for carbonate precipitation in
transport of reactants (Seigneur et al. 2019). Proc-                          soils (Bronick and Lal 2005). Furthermore, the
ess-based computer models are often used to analyze                           bio-mediated calcite precipitation method accelerates the
laboratory and field experiments by testing alternative                       precipitation of calcite, and has been used to improve the
processes and scenarios. However, experiments can be                          mechanical properties of soils (Gollapudi et al. 1995; De
used to calibrate or validate the assumptions in predictive                   Muynck et al. 2010; DeJong et al. 2010; Ho et al. 2018)
computer simulations. Following the development of a                          and to repair cracks in concrete (Wu et al. 2012;
calcium-leaching model for cement-based materials                             Al-Salloum et al. 2017; Huynh et al. 2019).
(Bentz and Garboczi 1992; Buil et al. 1992; Yokozeki et                          Current state-of-the-art developments regarding the
al. 2003; Nakarai et al. 2006a), reactive transport mod-                      understanding of chemical and pore-scale processes that
eling of cement–clay interactions has been conducted in                       control the precipitation in porous media have been
numerous studies (van der Lee and De Windt 2001;                              summarized recently in two review papers (Putnis 2015;
Yokozeki et al. 2004; Nakarai et al. 2006b; Berner et al.                     Stack 2015). These reviews highlighted some key ad-
2013; Kosakowski and Watanabe 2014; Liu et al. 2014;                          vances, including the detailed study on calcite precipita-
Blanc et al. 2015; Marty et al. 2015). Nearly all nu-                         tion in small pores, which was conducted using a hy-
merical models showed strong porosity reduction and                           drogel with a diffusive transport setup (Nindiyasari et al.
even pore clogging in response to the precipitation of                        2014), where the importance of pore size on the pre-
secondary minerals, mainly C–S–H and/or calcite, near                         cipitation process was demonstrated. Currently, however,
the cement–clay interface. The main mechanism under-                          the more complex interplay between pore size, surface
lying these changes involves the creation of dissolution                      charges, solute transport, and precipitation kinetics re-
fronts on both sides of the interface due to the strong                       mains poorly understood. In addition, although funda-
contrast in pH between cement and clay pore waters. In                        mental investigations of simple systems have been con-
the pore water of cement-based materials, calcium and                         ducted using both experimental and numerical tech-
hydroxide in equilibrium with hydrated cement phases                          niques (Tartakovsky et al. 2008; Katz et al. 2011; de
are consumed near the interface by reactions with silicon                     Anna et al. 2014; Chagneau et al. 2015; Poonoosamy et
or carbonate that originates from the clay. The migration                     al. 2016; Prasianakis et al. 2017), the processes in com-
of hydroxide from the cement into the clay increases the                      plex media, which are composed of many different
pH, giving rise to the so-called pH plume, and enhances                       mineral phases with a broad range of pore sizes, are still
the dissolution of SiO2 and clay minerals. These changes,                     not well understood.
K. Nakarai, M. Shibata, H. Sakamoto, H. Owada and G. Kosakowski / Journal of Advanced Concrete Technology Vol. 19, 433-446, 2021                  435

                                                Table 1 Outline of composite specimens.
                      Cement paste                                                 Bentonite
   Specimen
                 Type of cement W/C            Type of bentonite Type of carbonate  Carbonate/ dried bentonite                      Dry density
      BL           Ordinary                                              –                      0
                                                   Na-type
      NC1           Portland      0.60                               Na2CO3                  1.0 %                                 1.6×10³ kg/m3
                                                 (Kunigel V1)
      NC4        cement (OPC)                                        Na2CO3                  4.0 %

                                 Table 2 Chemical compositions of cement and bentonite (wt%).
               SiO2 Al2O3 Fe2O3 CaO MgO SO3 Na2O K2O TiO2 P2O3 MnO                                                     Cl  ig.loss        Insol.
  Cement 21.28           5.09     3.15    65.36 1.01 2.01 0.32 0.41 0.25 0.14 0.10                                   0.006  0.84           0.10
 Bentonite 70.7          13.8     1.49     2.30     2.26 0.29 2.56 0.33 0.20 0.05 0.08
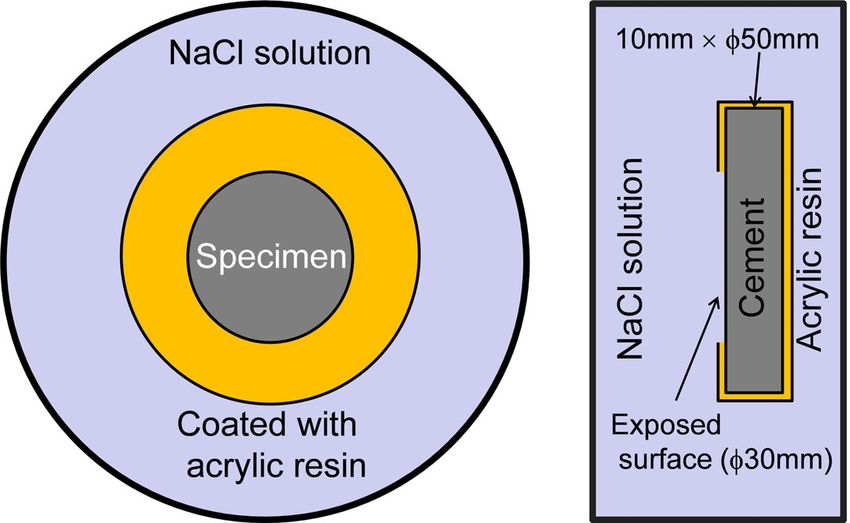
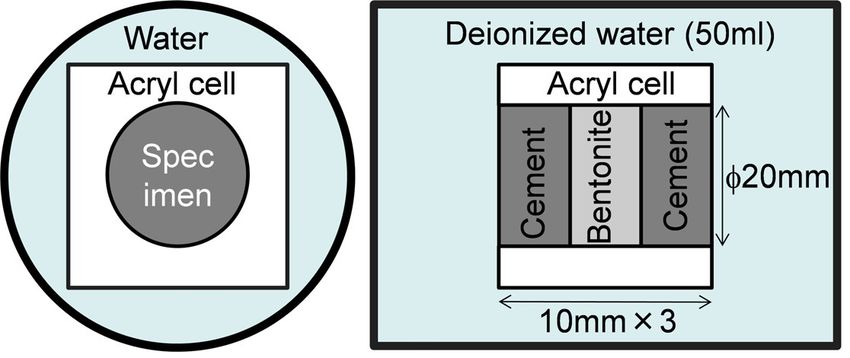
K. Nakarai, M. Shibata, H. Sakamoto, H. Owada and G. Kosakowski / Journal of Advanced Concrete Technology Vol. 19, 433-446, 2021       436

decreased the degradation resistance of the cement paste                      2.2 Immersion tests of the composite specimen
(Bentz and Garboczi 1992). Cement and water were                              Before the actual immersion, the composite specimens
mechanically mixed at 30 °C. Before casting, the cement                       were vacuum-saturated with deionized water. This
paste was allowed to rest in a bag for several hours at 30                    leaches the alkalis in the initial cement pore solution and
°C: in the first 2–3 h, the cement paste was mixed every                      transforms the cement from the initial “Stage I” state
hour, and then mixing was done every 30 minutes until                         (Berner 1992), which is characterized by high alkali
bleeding from the segregation disappeared. After casting,                     concentrations and a pH of > 13, into a “Stage II” state
cylindrical specimens (φ20 mm × 70 mm) of cement                              (Berner 1992), where the pH is buffered at ~12.5 by the
paste were cured in hot water at 50 °C for 28 days to                         existence of portlandite. During the pre-saturation pro-
ensure mature cement hydration. After curing, the                             cedure, the saturation of bentonite without cracking was
specimens were cut in 10 mm thick disks for the im-                           visually checked from homogenous color changes of the
mersion tests. The chemical composition of the cement                         specimens. Finally, the composite specimen was placed
used is shown in Table 2.                                                     in 50 mL of deionized water for the immersion tests (see
   The bentonite used in this study was Kunigel-V1, a                         Fig. 1), which gave a liquid-to-solid ratio of approxi-
Japanese sodium-type bentonite. The chemical compo-                           mately 5.3 by volume. The measured pH after 10 months
sition of Kunigel-V1, as reported in the literature (Ito et                   of immersion test was 12.70 (RWMC 2010).
al. 1993), is summarized in Table 2. In terms of miner-                          For bentonite, negatively charged species can only
alogy the bentonite included montmorillonite (47 wt%),                        enter part of the pore space; they are repelled from neg-
quartz (37.5 wt%), plagioclase (4.1 wt%), analcime (3.3                       atively charged clay surfaces and cannot enter mono- or
wt%), calcite (2.4 wt%), dolomite (2.0 wt%), and pyrite                       bi-hydrated clay interlayers (Van Loon et al. 2007). The
(0.6 wt%) (Ito et al. 1993).                                                  fraction of the so-called anion accessible porosity de-
   Three types of bentonite samples were prepared: pure                       pends on the type of bentonite, its compaction, and the
bentonite (BL) and bentonite samples mixed with 1 %                           ionic strength of the solution. For high compaction, the
and 4 % sodium carbonate (Na2CO3) (NC1 and NC4,                               fraction of anion accessible porosity might become very
respectively) relative to the dried bentonite weight. The                     small, as most water is present in the interlayers. In this
addition of carbonate in such amounts can provide suf-                        study, Kunigel-V1 was compacted to a dry density of
ficient carbonate to allow for pore clogging near the                         1.6×10³ kg/m3. For this density, the total porosity can be
interface in a short time. In the case of carbon-                             approximated to be 0.4 and the anionic porosity value to
ate–bentonite samples (NC1 and NC4), powdered                                 be 0.08 (0.2 of the total porosity) (Ishidera et al. 2008). If
chemicals were used for preparing mixtures. The mix-                          negatively charged carbonate complexes are excluded
tures were prepared such that the bentonite and sodium                        from the interlayer water of montmorillonite after
carbonate were homogeneously mixed. Then, the ben-                            re-saturation, the added sodium carbonate for the 4 %
tonite mixtures were statically compacted using a com-                        mixture exceeds its solubility limit (30.7 g/100 g water at
pressive machine. The dry density of the bentonite sam-                       25 °C) for the (anion) accessible porosity. For the sam-
ples was found to be 1.6×10³ kg/m3, which is around the                       ples with 1 % carbonate addition, the sodium carbonate
designed value for the radioactive repository (Masuda et                      is completely dissolved.
al. 1999).
   For the immersion test, composite specimens with                           2.3 Chloride migration tests of the cement paste
bentonite samples between two cement paste samples                            specimen
were prepared by Taiheiyo Consultant Co. Ltd. (Fig.                           After 4 months of immersion tests for the half-models
1(a)). First, a shaped cement paste sample was placed on                      shown in Fig. 1(b), the cement paste samples were
one side of the acrylic resin cells with an inner diameter                    carefully prepared for the chloride migration tests as
of 20 mm and length of 30 mm. Then, the compacted                             illustrated in Fig. 1(c). All surfaces, except the interface
bentonite sample was positioned on the cement paste,                          with bentonite in the former immersion tests, were
and finally, another cement paste sample was placed on                        coated with acryloyl-modified acrylic resin. This allows
the top of the cell.                                                          one-dimensional in-diffusion tests with NaCl solution
   Furthermore, chloride migration tests were conducted                       (3 % in mass) for 48 h from the surface affected by the
after the immersion tests at Hiroshima University. For                        contacted bentonite.
these tests, additional specimens were prepared (Fig.
1(c)) after immersion (Fig. 1(b)) as half models of the                       2.4 Experimental methods
above specimens (Fig. 1(a)). The half model consisted of                      After 4, 10, and 20 months of the immersion tests, test
a 5 mm-thick bentonite disc that was set on top of a 10                       cells for detailed analysis were selected (Fig. 1(a)). The
mm-thick cement paste disc (Fig. 1(b)). The full model                        specimens were dismantled and cut into smaller samples
consisted of a 10 mm-thick bentonite disc sandwiched                          using a diamond saw, as illustrated in Fig. 2(a). The
between two 10 mm-thick discs of cement paste (Fig.                           sub-samples were analyzed by electron probe mi-
1(a)). The different diameters of discs were necessary                        cro-analysis (EPMA), thermogravimetry/differential
because of size limitations associated with some ex-                          thermal analysis (TG-DTA), and X-ray diffraction
perimental equipment.                                                         (XRD). In addition, for TG-DTA and XRD measure-
K. Nakarai, M. Shibata, H. Sakamoto, H. Owada and G. Kosakowski / Journal of Advanced Concrete Technology Vol. 19, 433-446, 2021                       437

ments, powder samples of the interface surface layers                                            PRO (PANalytical, Netherlands) diffractometer. The
with 1 mm thickness for the cement paste and 2 mm                                                measurement conditions were as follows: X-ray source
thickness for the bentonite were prepared. The sample                                            Cu-Kα, tube voltage 40 kV, tube current 45 mA, scanning
thickness was chosen based on the thickness of the al-                                           range 2θ = 5° to 60°, step width 0.017°, and a meas-
teration zone measured by EPMA.                                                                  urement time for one step of 0.2 s.
   After completing the chloride migration tests, the
specific specimens were also cut into smaller samples, as                                        (3) Thermal analysis
shown in Fig. 2(b). EPMA measurements were con-                                                  Samples from the surface layer of the cement paste and
ducted on the cross section indicated in Fig. 2(b) to                                            the surface and inner layers were prepared for TG-DTA
qualitatively investigate chloride migration.                                                    using a Thermo plus evo2 TG8121 (Rigaku, Japan). The
   Each measurement was conducted using one sample                                               change in weight was measured from room temperature
from the specimens, although it was not sufficient to                                            to 1000 °C with the temperature ramped up at a rate of 10
capture the variability among samples. As significant                                            °C/min under nitrogen gas flow. The temperature ranges
inconsistency among the results (e.g. unbalanced altera-                                         for calculating the amounts of calcium hydroxide
tion between two cement–bentonite interfaces, unstable                                           (Ca(OH)2) and calcium carbonate (CaCO3) were deter-
progress of degradation with time) for each sample was                                           mined from the measured DTA curves. The determined
not observed, the experiments are well suited to capture                                         ranges were approximately 410–470 °C for Ca(OH)2 and
the basic processes responsible for porosity change at the                                       510–710 °C for CaCO3.
interface and to improve understanding on the effect of
adding carbonate to the bentonite.                                                               3. Experimental results and discussion

(1) EPMA measurement                                                                             The results of calcium elemental mapping on cross sec-
Chemical element mapping on cross sections of the                                                tions of the composite specimens after 20 months of
composite specimens was conducted using a JXA-8200                                               immersion are shown in Fig. 3. Some cracks are visible
(JEOL Ltd., Japan) electron probe microanalyzer. The                                             in both the cement paste and bentonite. These artifacts
polished plain surface was coated with carbon (25–30 nm                                          are probably caused by drying as a necessary part of the
thick) as the conductive material. The acceleration                                              sample preparation process, because there were no min-
voltage was 15 kV and the pixel size was 40 μm × 40 μm,                                          eralogical alternations observed in or around the cracks.
with a counting interval of 40 ms. A standard published                                          In the cement paste adjacent to the interfaces, a decrease
by JSCE (JSCE 2005) has been referred.                                                           in the calcium content is observed. The extension of the
                                                                                                 calcium-depleted zone is inversely correlated to the
(2) XRD analysis                                                                                 amount of premixed carbonate in the bentonite. For a
Mineral contents on the surface layer of the cement paste                                        sample with a high premixed carbonate content, the
were qualitatively analyzed by XRD using an X’Pert                                               width of the calcium-depleted surface layer is smaller.

                                                                                                                                             EPMA
                                      Cement paste

                                                                                                                              Cement paste
           Cement paste

                                                                                                           Acrylic
                          Bentonite

                                                                                                           resin

                     EPMA                                             Inner layer of bentonite            Exposed surface
        EPMA                                                      Surface layer of bentonite              in migration test
                     on whole area
        at interface                                 Surface layer of cement paste

      (a) Samples for measurement after immersion tests     (b) Samples for measurement after chloride migration tests
                                      Fig. 2 Sample treatments for measurement.

Fig. 3 Calcium element mapping (wt%) measured by EPMA on the specimens (cement paste–bentonite–cement paste)
after 20 months. (Left: BL-20M; Center: NC1-20M; Right: NC4-20M).
K. Nakarai, M. Shibata, H. Sakamoto, H. Owada and G. Kosakowski / Journal of Advanced Concrete Technology Vol. 19, 433-446, 2021 438
This observation will be discussed later in the paper present after 20 months, while for sample NC4 (4 %
considering pore clogging. carbonate admixture), both portlandite and calcite are
For a detailed quantitative analysis, longitudinal pro- present.
files for selected elements across the alteration zones at Figure 7 shows the measured XRD patterns from the
the interfaces were constructed from the EPMA meas- bentonite surface layer within the range between 26° and
urements (Fig. 4). The profiles for the initial element 31° for the initial and final specimens in this study. The
contents in the cement paste and bentonite were inter- XRD patterns for all specimens are given in the Ap-
polated from unaltered material compositions after 4 pendix. Samples BL and NC1 showed evidence of
months of interaction (dashed lines in Fig. 4). The pro- smectite dissolution after 20 months, while C–S–H
files of aluminum, magnesium, and iron show fewer seems to have precipitated. Sample NC4 shows no sig-
changes and the detailed measurements are included in nificant change that can be related to the change in min-
the Appendix. eralogy.
The results of XRD (Fig. 5 and Appendix) and
TG-DTA (Fig. 6) on the cement side show an increase in 3.1 Minerological evolution at interface of ref-
portlandite and calcite in the surface layers of cement erence sample without carbonate admixture
paste specimens as the amount of carbonate admixture is In the case of BL, high and continuous diffusion across
increased. For sample BL (no carbonate admixture), the the interface caused strong changes not only in calcium
portlandite was completely dissolved and no calcite was but also in sodium, silica, and sulfate. Calcium leaching
60 60 60
BL-4M NC1-4M NC4-4M
50 50 50
CaO content (wt%)
CaO content (wt%)
CaO content (wt%)
BL-10M NC1-10M NC4-10M
40 BL-20M 40 NC1-20M 40 NC4-20M
Initial Initial Initial
30 30 30
20 Bentonite
20 Bentonite 20 Bentonite
Cement paste Cement paste Cement paste
10 10 10
0 0 0
-2 -1 0 1 2 -2 -1 0 1 2 -2 -1 0 1 2
Distance from interface (mm) Distance from interface (mm) Distance from interface (mm)
(a) Distribution of calcium at the cement–bentonite interface.
4 4 4
BL-4M NC1-4M NC4-4M
Na2O content (wt%)
Na2O content (wt%)
Na2O content (wt%)
3 BL-10M 3 NC1-10M 3 NC4-10M
BL-20M NC1-20M NC4-20M
Initial Initial Initial
2 2 2
1 1 1
Cement paste Bentonite Cement paste Bentonite Cement paste Bentonite
0 0 0
-2 -1 0 1 2 -2 -1 0 1 2 -2 -1 0 1 2
Distance from interface (mm) Distance from interface (mm) Distance from interface (mm)
(b) Distribution of sodium at the cement–bentonite interface.
70 70 70
BL-4M NC1-4M NC4-4M
60 60 60
SiO2 content (wt%)
SiO2 content (wt%)
SiO2 content (wt%)
BL-10M NC1-10M NC4-10M
50 BL-20M 50 NC1-20M 50 NC4-20M
40 Initial 40 Initial 40 Initial
30 30 30
20 20 20
10 Cement paste 10 10
Bentonite Cement paste Bentonite Cement paste Bentonite
0 0 0
-2 -1 0 1 2 -2 -1 0 1 2 -2 -1 0 1 2
Distance from interface (mm) Distance from interface (mm) Distance from interface (mm)
(c) Distribution of silicon at the cement–bentonite interface.
4 4 4
BL-4M NC1-4M NC4-4M
SO3 content (wt%)
SO3 content (wt%)
SO3 content (wt%)
3 BL-10M 3 NC1-10M 3 NC4-10M
BL-20M NC1-20M NC4-20M
Initial Initial Initial
2 2 2
Bentonite Bentonite Bentonite
1 1 1
Cement paste Cement paste Cement paste
0 0 0
-2 -1 0 1 2 -2 -1 0 1 2 -2 -1 0 1 2
Distance from interface (mm) Distance from interface (mm) Distance from interface (mm)
(d) Distribution of sulfate at the cement–bentonite interface.
Fig. 4 Longitudinal profiles of main chemical compositions measured by EPMA.K. Nakarai, M. Shibata, H. Sakamoto, H. Owada and G. Kosakowski / Journal of Advanced Concrete Technology Vol. 19, 433-446, 2021 439
decreased the calcium content in the cement side and the decrease in sodium content, which suggests cation
increased the calcium in the bentonite side (Fig. 4(a)). exchange (Sposito et al. 1983). Furthermore, silica dis-
Calcium leaching causes portlandite to quickly disappear solution at the surface layer of bentonite was observed
at the surface of the cement paste (Figs. 5 and 6). The (Fig. 4). The dissolution of quartz and clay minerals is
degraded depth of cement paste with time, defined by the known to be accelerated at high pH (Palandri and
calcium-leached depth from the interface in Fig. 4(a), is Kharaka 2004).
plotted in Fig. 8. The calcium-leached depth was ob- The XRD measurements from the bentonite surface
tained from the area showing clear drop of calcium layer (Fig. 7) suggest that the dissolution of smectite in
concentration measured by EPMA. The depth of the bentonite is caused by the high pH front progressing into
calcium-depleted zone increased in proportion to the bentonite from the cement side. The increase in pH in
square root of time, similar to other immersion tests of bentonite is supported by the formation of C–S–H de-
cement paste in solutions (Carde et al. 1997; Haga et al. tected on the clay surface. This observation is consistent
2005; Choi and Yang 2013). Square-root dependency is with other experimental studies (Dauzeres et al. 2010;
typically found in processes that are controlled by diffu- Fernández et al. 2016) and numerical modeling (De
sive transport, for example, for reaction fronts originat- Windt et al. 2004; Kosakowski and Berner 2013).
ing from cement/clay interaction (Kosakowski and
Berner 2013; Kosakowski et al. 2014) and for the pro- 3.2 Minerological evolution at interface of sam-
gress of carbonation fronts (Papadakis et al. 1989; ples with carbonate admixture
Richardson 2002; Ta et al. 2016). (1) Changes in cement paste
In addition, in the calcium-leached area of the cement The addition of sodium carbonate to bentonite altered the
paste, sulfur content was depleted and sulfur accumu- mineral evolution of the cement samples. The extent of
lated at the leaching front (Fig. 4). This observation can calcium depletion and other changes in Figs. 4–6 and 8
be explained by the release of sulfate from ettring- was significantly smaller for samples with additional
ite/monosulfate decalcification and re-precipitation at the sodium carbonate.
leaching front because of high pH, similar to what is With the addition of 1 % sodium carbonate (NC1), the
observed during carbonation (Kobayashi et al. 1990).
In the bentonite, the calcium increase corresponded to
2 Q Q: quartz, S: smectite,
Intensity (x10000, counts)
3 C: calcite, P: plagioclase
P P P: portlandite M: microcline, CSH:C-S-H
C
Intensity (x10000, counts)
C: calcite 1.5
CSH: C-S-H
NC4
P
2 P
CSH
P C 1
CSH
C C C
NC4-20M P
NC1
C
1 NC1-20M 0.5 S CSH
M P
BL
Initial
BL-20M 20M Initial
0 0
15
30 35 40 45 50 55 20 25 26 27 28 29 30 31
2θ (degree) 2θ (degree)
Fig. 5 Changes in XRD intensities of minerals at the Fig. 7 Changes in XRD intensities of minerals at the
surface layer of cement paste specimens before and after surface layer of bentonite specimens before and after
immersion tests (dated lines show results before, and immersion tests (dated lines show results before, and
solid lines show results after the tests). solid lines show results after the tests).
25 30
BL BL
20 25
NC1
NC1
Ca(OH)2 (wt%)
CaCO3 (wt%)
20 NC4
15 NC4
15
10
10
5 5
0 0
0 5 10 15 20 0 5 10 15 20
Immersion period (months) Immersion period (months)
Fig. 6 Changes in the amounts of Ca(OH)2 and CaCO3 measured by TG-DTA at the surface layer of cement pasteK. Nakarai, M. Shibata, H. Sakamoto, H. Owada and G. Kosakowski / Journal of Advanced Concrete Technology Vol. 19, 433-446, 2021 440
decrease in the calcium concentration on the cement the case of NC1, the smectite peak also disappeared and
paste and its increase in on the bentonite were much the peaks at ~28.5° were shifted to lower angles related
smaller than those without carbonate (Fig. 4(a)). These to zeolite or feldspar. These observations indicate the
observations indicate reduced diffusive fluxes across the dissolution of smectite in bentonite and the precipitation
interface owing to partial pore clogging caused by calcite of secondary minerals associated with calcium leaching
precipitation at the interface. However, the progress of from cement paste. During sample collection after the
calcium leaching from cement paste was not stopped and immersion tests, hardened bentonite mixtures were ob-
was also proportional to the square root of time after 4 served in BL and NC1. This implied a change in the
months (Fig. 8). The XRD (Fig. 5 and Appendix) and structure of bentonite by cementation with secondary
TG-DTA (Fig. 6) results show that mineral changes at the mineral precipitation.
surface of cement paste in the cases with sodium car-
bonate added to bentonite depended on the amount of (3) Effect of amount of carbonate mixture
carbonate added. For samples NC1 (less carbonate Maximum potential amounts of calcite precipitation in
mixing), portlandite continuously dissolves with rates the surface layer of the cement paste specimen were
decreasing proportionally to the square root of time (Fig. calculated (Fig. 9). We assumed that all premixed car-
6). Calcite precipitation occurred within less than 4 bonate in bentonite was consumed to generate CaCO3 in
months and no significant changes were observed later. this 1-mm layer during immersion tests. The calcite
In samples with 4 % sodium carbonate addition (NC4), contents of the original bentonite were not considered
the degraded depth did not change after 4 months, as because calcite precipitation in the cement paste of BL
shown in Figs. 4 and 8. Relatively large changes at the and changes in the calcite peak in bentonite mixtures
interface were observed in the first measurements (4 were not observed by TG-DTA and XRD.
months). The distinctive changes were the increase in The relationship between the amount of calculated
sodium content and the decrease in sulfate content in the potential and measured CaCO3 is plotted in Fig. 9. For
surface layer of the cement paste (Fig. 4), and more than NC1 (low carbonate admixture), the measured CaCO3
half of the portlandite dissolved quickly (Figs. 5 and 6). almost agrees with the calculated potential amount. This
Large amounts of calcite were precipitated for NC4 indicates that the admixed carbonate was completely
during the first 4 months. The amount of calcium nec- used to precipitate CaCO3 in the surface layer of the
essary for calcite precipitation was close to the amount of cement paste. For the NC4 case (high carbonate admix-
calcium released by portlandite dissolution; this strongly ture), the measured amount was much smaller than the
indicated the proposed carbonation reaction. Although calculated potential amount. This and the existence of
secondary mineral precipitations such as feldspar after portlandite after 4 months implies that only part of the
ettringite/monosulfate dissolution seem possible by the carbonate was used to form calcite. In combination with
increases in sodium and silicon, XRD patterns did not the observation that the evolution of the system stopped
detect any additional minerals except calcite (Fig. 5). completely after 4 months, it can be assumed that the
calcite precipitation in case NC4 clogged the pore space
(2) Changes in bentonite and prevented the migration of remaining carbonate into
In the initial samples, there were no significant differ- the cement sample. Furthermore, the measured amount
ences visible for samples with and without an admixture of 20 % calcite can be interpreted as a threshold value
of sodium carbonate. After immersion tests for 20 necessary to clog the pore space. The amount necessary
months, mineralogical alterations were clearly observed to clog the pore space is specific for this cement, as
in BL and NC1, while NC4 did not show any significant porosity (pore size distribution) and composition in terms
changes (Fig. 7 and Appendix). In the case of BL, the of hydrated cement minerals influence the amount of
smectite peak disappeared and C–S–H was detected. In
30
Measured maximum CaCO3 (wt%)
2.5
25
BL
Degraded depth (mm)
2.0 NC1 20
1.5 NC4
15
1.0 10 BL
NC1
0.5 5
NC4
0.0 0
1 2 0 3 4 5 0 10 20 30
Square root of test periods (√months) Potential of CaCO3 generation (wt%)
Fig. 8 Depth of degradation cause by calcium leaching Fig. 9 Relationship between potential and measured
from the interface in cement paste. amounts of CaCO3.K. Nakarai, M. Shibata, H. Sakamoto, H. Owada and G. Kosakowski / Journal of Advanced Concrete Technology Vol. 19, 433-446, 2021 441
calcite needed to fill the pore space. gested a completely clogged interface for high carbonate
admixture samples. Therefore, our measurements did not
3.3 Post transport properties of cement paste provide detailed insight into how fast calcite precipita-
contacted with bentonite tion and pore clogging occurred. We suspect that the
The hypothesis of pore clogging is supported by the clogging had to occur very quickly, as alterations near the
results of chloride migration tests. The diffusive flux interface were very small.
across the interface for the different samples can be Owing to the small number of samples, the influence
demonstrated with the help of the chloride profiles of material heterogeneity on interface evolution and
shown in Fig. 10. Chloride diffusion across the interfaces clogging conditions could not be determined in this study.
(exposed surface) was clearly observed in the BL and However, the analysis shows consistency in terms of
NC1 cases. A similar extension of chloride penetration mass balance and allows the research to clearly quantify
depth for BL and NC1 indicates that transport across the the effect of carbonate addition to bentonite, such that
interface is similar, although the mineralogical evolution our results can be considered representative in terms of
of the interface is not identical. This is in line with the interface evolution and processes that drive porosity
observation of the continuous progress of calcium clogging.
leaching shown in Fig. 8. For sample NC4, considerably To determine the feasibility of premixed carbonate to
less chloride crossed the surface. The significant reduc- engineered barrier systems for surface and deep geo-
tion in mass flux can therefore support the hypothesis of logical disposal of radioactive waste, field studies are
pore clogging by rapid calcite precipitation. This also needed that investigate the properties and the long-term
agrees with the constant degraded depth after 4 months stability of such clogged interfaces under the influence of
observed in Figs. 4 and 8. The effect of heterogeneity of changes in mechanical loading, thermal pulse or chemi-
the microstructure should be discussed using long-term cal gradients. As pore structure of cementitious materials
experimental results in the future. is one of the key factors controlling pore clogging, mi-
crostructure analysis using scanning electron microscopy
4. Conclusions (SEM), atomic force microscope (AFM), X-ray and
neutron tomography, and other methods should also be
In this study, the cement–bentonite interface reaction conducted in future studies. Selective application of the
with a focus on calcite precipitation was investigated on premixed carbonate should be additionally discussed as
composite specimens of cement paste and compressed an effective method for thick bentonite barriers.
bentonite/carbonate mixtures. To accelerate the calcite
precipitation at the interface, sodium carbonate was Acknowledgements
premixed into the bentonite. Assistance with the chloride migration tests was pro-
Our experimental results revealed that premixed car- vided by Assistant Professor Yuko Ogawa and a former
bonate in bentonite indeed promotes calcite precipitation student, Mr. Kensuke Kozuka, from Hiroshima Univer-
in the surface layer of the cement paste in contact with sity.
bentonite if the initial amount of premixed carbonate is This work was supported by the Japan Society for the
sufficiently high. When the carbonate content was too Promotion of Science, JSPS KAKENHI [Grant numbers
low, alteration still progressed at a slower rate after JP20686029, JP15KK0239]. The immersion test results
calcite precipitation and the transport property of the without carbonates in RWMC reports were obtained
cement paste did not change. Conversely, a sufficiently from “Development of long-term performance assess-
high carbonate content resulted in less alteration, a stable ment method for engineered barrier of TRU radioactive
composition, and significant reduction of post chloride waste repository (FY2007, FY2009 and FY2010)” un-
migration after the early reaction. This suggests pore der a grant from the Agency for Natural Resources and
clogging at the interface, thus implying the existence of a Energy (ANRE) in the Ministry of Economy, Trade and
threshold amount of carbonate for pore clogging. Industry (METI) of Japan. The measurements of im-
The first samples taken after 4 months already sug- mersion tests with carbonates were supported by the
Exposed surface Exposed surface Exposed surface
BL-4M NC1-4M NC4-4M EPMA
Cement paste
Acrylic
resin
Exposed surface
in migration test
Fig. 10 Mapping of chloride profiles after migration tests.K. Nakarai, M. Shibata, H. Sakamoto, H. Owada and G. Kosakowski / Journal of Advanced Concrete Technology Vol. 19, 433-446, 2021 442
Nuclear Safety Research Association (NSRA) in the leaching on the pore structure, strength, and chloride
framework of “Investigation of technical issues for un- penetration resistance in concrete specimens.” Nuclear
derstanding the long-term behavior of engineered bar- Engineering and Design, 259, 126-136.
rier systems (Phase II)” performed by NSRA, Taiheiyo Cook, R. A. and Hover, K. C., (1999). “Mercury
Consultant Corp., and Hazama Ando Corp. under con- porosimetry of hardened cement pastes.” Cement and
tract with the Nuclear Waste Management Organization Concrete Research, 29(6), 933-943.
of Japan (NUMO). Dauzeres, A., Le Bescop, P., Sardini, P. and Cau Dit
Coumes, C., (2010). “Physico-chemical investigation
References of clayey/cement-based materials interaction in the
Al-Salloum, Y., Hadi, S., Abbas, H., Almusallam, T. and context of geological waste disposal: Experimental
Moslem, M. A., (2017). “Bio-induction and approach and results.” Cement and Concrete Research,
bioremediation of cementitious composites using 40(8), 1327-1340.
microbial mineral precipitation – A review.” de Anna, P., Dentz, M., Tartakovsky, A. and Le Borgne,
Construction and Building Materials, 154, 857-876. T., (2014). “The filamentary structure of mixing fronts
Alexander, W. R. and McKinley, L., (2007). “Deep and its control on reaction kinetics in porous media
geological disposal of radioactive waste.” Elsevier. flows.” Geophysical Research Letters, 41(13),
Balmer, S., Kaufhold, S. and Dohrmann, R., (2017). 4586-4593.
“Cement-bentonite-iron interactions on small scale DeJong, J. T., Mortensen, B. M., Martinez, B. C. and
tests for testing performance of bentonites as a barrier Nelson, D. C., (2010). “Bio-mediated soil improvement.”
in high-level radioactive waste repository concepts.” Ecological engineering, 36(2), 197-210.
Applied Clay Science, 135, 427-436. De Muynck, W., De Belie, N. and Verstraete, W., (2010).
Bentz, D. P. and Garboczi, E. J., (1992). “Modelling the “Microbial carbonate precipitation in construction
leaching of calcium hydroxide from cement paste: materials: A review.” Ecological engineering, 36(2),
effects on pore space percolation and diffusivity.” 118-136.
Materials and Structures, 25(9), 523-533. De Windt, L., Pellegrini, D. and van der Lee, J., (2004).
Berner, U., Kulik, D. A. and Kosakowski, G., (2013). “Coupled modeling of cement/claystone interactions
“Geochemical impact of a low-pH cement liner on the and radionuclide migration.” Journal of Contaminant
near field of a repository for spent fuel and high-level Hydrology, 68(3-4), 165-182.
radioactive waste.” Physics and Chemistry of the Fernández, R., Ruiz, I. and Cuevas, J., (2016).
Earth, 64, 46-56. “Formation of CASH phases from the interaction
Berner, U. R., (1992). “Evolution of pore water chemistry between concrete or cement and bentonite.” Clay
during degradation of cement in a radioactive waste Minerals, 51(2), 223-235.
repository environment.” Waste Management, 12(2), Fernández, R., Torres, E., Ruiz, A. I., Cuevas, J., Alonso,
201-219. M. C., García Calvo, J. L., Rodríguez, E. and Turrero,
Blanc, P., Vieillard, P., Gailhanou, H., Gaboreau, S., M. J., (2017). “Interaction processes at the
Marty, N., Claret, F., Made, B. and Giffaut, E., (2015). concrete-bentonite interface after 13 years of
“ThermoChimie database developments in the FEBEX-Plug operation. Part II: Bentonite contact.”
framework of cement/clay interactions.” Applied Physics and Chemistry of the Earth, Parts A/B/C, 99,
Geochemistry, 55, 95-107. 49-63.
Bronick, C. J. and Lal, R., (2005). “Soil structure and Gaboreau, S., Lerouge, C., Dewonck, S., Linard, Y.,
management: a review.” Geoderma, 124(1-2), 3-22. Bourbon, X., Fialips, C., Mazurier, A., Prêt, D.,
Buil, M., Revertegat, E. and Oliver, J., (1992). “A model Borschneck, D. and Montouillout, V., (2012). “In-situ
of the attack of pure water or undersaturated lime interaction of cement paste and shotcrete with
solutions on cement.” In: T. Gilliam and C. Wiles ed., claystones in a deep disposal context.” American
Stabilization and Solidification of Hazardous, Journal of Science, 312(3), 314-356.
Radioactive, and Mixed Wastes: 2nd Volume, West Gaboreau, S., Prêt, D., Tinseau, E., Claret, F., Pellegrini,
Conshocken, PA: ASTM International, 227-241. D. and Stammose, D., (2011). “15 years of in situ
Carde, C., Escadeillas, G. and François, A. H., (1997). cement-argillite interaction from Tournemire URL:
“Use of ammonium nitrate solution to simulate and Characterisation of the multi-scale spatial heterogeneities
accelerate the leaching of cement pastes due to of pore space evolution.” Applied Geochemistry,
deionized water.” Magazine of Concrete Research, 26(12), 2159-2171.
49(181), 295-301. Gaboreau, S., Rodríguez-Cañas, E., Maeder, U., Jenni,
Chagneau, A., Claret, F., Enzmann, F., Kersten, M., Heck, A., Turrero, M. J. and Cuevas, J., (2020). “Concrete
S., Made, B. and Schafer, T., (2015). “Mineral perturbation in a 13-year in situ concrete/bentonite
precipitation-induced porosity reduction and its effect interaction from FEBEX experiments. New insight of
on transport parameters in diffusion-controlled porous 2:1 Mg phyllosilicate precipitation at the interface.”
media.” Geochemical Transactions, 16. 13. Applied Geochemistry, 118, 104624.
Choi, Y. S. and Yang, E. I., (2013). “Effect of calcium Gaucher, E. C. and Blanc, P., (2006). “Cement/clayK. Nakarai, M. Shibata, H. Sakamoto, H. Owada and G. Kosakowski / Journal of Advanced Concrete Technology Vol. 19, 433-446, 2021 443 interactions - A review: Experiments, natural analogues, 574-2005).” Tokyo: Japan Society of Civil and modeling.” Waste Management, 26(7), 776-788. Engineering. Gaucher, E. C., Tournassat, C., Pearson, F. J., Blanc, P., Katz, G. E., Berkowitz, B., Guadagnini, A. and Saaltink, Crouzet, C., Lerouge, C. and Altmann, S., (2009). “A M. W., (2011). “Experimental and modeling robust model for pore-water chemistry of clayrock.” investigation of multicomponent reactive transport in Geochimica Et Cosmochimica Acta, 73(21), 6470-6487. porous media.” Journal of Contaminant Hydrology, Glasser, F. and Atkins, M., (1994). “Cements in radioactive 120-21, 27-44. waste disposal.” MRS Bulletin, 19(12), 33-38. Kobayashi, K., Shiraki, R. and Kawai, K., (1990). Gollapudi, U. K., Knutson, C. L., Bang, S. S. and Islam, “Migration and concentration of chlorides, sulfides M. R., (1995). “A new method for controlling leaching and alkali compounds in concrete caused by through permeable channels.” Chemosphere, 30(4), carbonation.” Concrete Research and Technology, 695-705. 1(2), 69-82. Haga, K., Shibata, M., Hironaga, M., Tanaka, S. and Kosakowski, G. and Berner, U., (2013). “The evolution Nagasaki, S., (2005). “Change in pore structure and of clay rock/cement interfaces in a cementitious composition of hardened cement paste during the repository for low- and intermediate level radioactive process of dissolution.” Cement and Concrete waste.” Physics and Chemistry of the Earth, 64, 65-86. Research, 35(5), 943-950. Kosakowski, G., Berner, U., Wieland, E., Glaus, M. A. Hayek, M., Kosakowski, G. and Churakov, S., (2011). and Degueldre, C., (2014). “Geochemical evolution of “Exact analytical solutions for a diffusion problem the L/ILW near-field, (Naga Technical Report NTB coupled with a precipitation - dissolution reaction and 14-11)”, Wettingen Switzerland: National Cooprative feedback of porosity change.” Water Resources for the Disposal of Radioactive Waste. Research, 47(7). Kosakowski, G. and Watanabe, N., (2014). Hayek, M., Kosakowski, G., Jakob, A. and Churakov, S. “OpenGeoSys-Gem: A numerical tool for calculating V., (2012). “A class of analytical solutions for geochemical and porosity changes in saturated and multidimensional multispecies diffusive transport partially saturated media.” Physics and Chemistry of coupled with precipitation - dissolution reactions and the Earth, 70-71, 138-149. porosity changes.” Water Resources Research, 48(3). Lang-Lenton León, J., (2001). “Radioactive waste Ho, L. S., Nakarai, K., Duc, M., Kouby, A. L., Maachi, A. management and sustainable development.” NEA and Sasaki, T., (2018). “Analysis of strength News, 18-20. development in cement-treated soils under different Liu, S., Jacques, D., Govaerts, J. and Wang, L., (2014). curing conditions through microstructural and chemical “Conceptual model analysis of interaction at a investigations.” Construction and Building Materials, concrete–Boom Clay interface.” Physics and 166, 634-646. Chemistry of the Earth, Parts A/B/C, 70, 150-159. Huynh, N. N. T., Imamoto, K.-I. and Kiyohara, C., Luraschi, P., Gimmi, T., Van Loon, L. R., Shafizadeh, A. (2019). “A study on biomineralization using Bacillus and Churakov, S. V., (2020). “Evolution of HTO and Subtilis Natto for repeatability of self-healing concrete 36Cl− diffusion through a reacting cement-clay and strength improvement.” Journal of Advanced interface (OPC paste-Na montmorillonite) over a time Concrete Technology, 17(12), 700-714. of six years.” Applied Geochemistry, 104581. IAEA, (2011). “Disposal of radioactive waste (Specific Mäder, U., Jenni, A., Lerouge, C., Gaboreau, S., Miyoshi, safety requirements).” IAEA Safety Standards Series, S., Kimura, Y., Cloet, V., Fukaya, M., Claret, F., Otake, No. SSR-5, Vienna: International Atomic Energy T., Shibata, M. and Lothenbach, B., (2017). “5-year Agency. chemico-physical evolution of concrete–claystone Ishidera, T., Miyamotoy, S. and Sato, H., (2008). “Effect interfaces, Mont Terri rock laboratory (Switzerland).” of sodium nitrate on the diffusion of Cl− and I− in Swiss Journal of Geosciences, 110, 307-327. compacted bentonite.” Journal of Nuclear Science and Masuda, S., Umeki, H, and Narito, M., (1999). Technology, 45(7), 610-616. “Technical reliability on geological disposal of HLW Ito, M., Okamoto, M., Shibata, M., Sasaki, Y., Danhara, in Japan. Second progress report on research and T., Suzuki, K. and Watanabe, T., (1993). “Bentonite development for the geological disposal of HLW in mineral composition analysis.” Power Reactor and Japan.” Nippon Genshiryoku Gakkai-Shi, 42(6), Nuclear Fuel Development Corporation. 486-506. (in Japanese) Jenni, A., Mäder, U., Lerouge, C., Gaboreau, S. and Marty, N. C. M., Bildstein, O., Blanc, P., Claret, F., Schwyn, B., (2014). “In situ interaction between Cochepin, B., Gaucher, E. C., Jacques, D., Lartigue, J. different concretes and Opalinus Clay.” Physics and E., Liu, S. H., Mayer, K. U., Meeussen, J. C. L., Chemistry of the Earth, Parts A/B/C, 70-71, 71-83. Munier, I., Pointeau, I., Su, D. Y. and Steefel, C. I., JIS R 5202, (2005). “Methods for chemical analysis of (2015). “Benchmarks for multicomponent reactive cements.” Tokyo: Japanese Standards Association. transport across a cement/clay interface.” Computational JSCE, (2005). “Test method for chemical element Geosciences, 19(3), 635-653. distribution in concrete using EPMA (draft), (JSCE-G Marty, N. C. M., Tournassat, C., Burnol, A., Giffaut, E.
K. Nakarai, M. Shibata, H. Sakamoto, H. Owada and G. Kosakowski / Journal of Advanced Concrete Technology Vol. 19, 433-446, 2021     444

  and Gaucher, E. C., (2009). “Influence of reaction                          Putnis, A., (2015). “Transient porosity resulting from
  kinetics and mesh refinement on the numerical                                  fluid-mineral interaction and its consequences.”
  modelling of concrete/clay interactions.” Journal of                           Pore-Scale Geochemical Processes, 80, 1-23.
  Hydrology, 364(1), 58-72.                                                   Read, D., Glasser, F. P., Ayora, C., Guardiola, M. T. and
Metcalfe, R. and Walker, C., (2004). “Proceedings of the                         Sneyers, A., (2001). “Mineralogical and microstructural
  International Workshop on Bentonite-Cement                                     changes accompanying the interaction of Boom Clay
  Interaction       in      Repository      Environments,                        with ordinary Portland cement.” Advances in Cement
  (NUMO-TR-04-05).”            Tokyo:   Nuclear     Waste                        Research, 13(4), 175-183.
  Management Organization of Japan (NUMO).                                    Richardson, M. G., (2002). “Fundamentals of durable
Nakarai, K., Ishida, T. and Maekawa, K., (2006a).                                reinforced concrete.” CRC Press.
  “Modeling of calcium leaching from Cement hydrates                          RWMC, (2008). “FY2007 report on development of
  coupled with micro-pore formation.” Journal of                                 long-term performance assessment method for
  Advanced Concrete Technology, 4(3), 395-407.                                   engineered barrier of TRU radioactive waste repository:
Nakarai, K., Ishida, T. and Maekawa, K., (2006b).                                evaluation of long-term behavior of engineered barrier.”
  “Multi-scale       physicochemical      modeling     of                        Tokyo: Radioactive Waste Management Funding and
  soil-cementitious material interaction.” Soils and                             Research Center (RWMC). (in Japanese)
  Foundations, 46(5), 653-663.                                                RWMC, (2010). “FY2009 Report on development of
Nakarai, K., Watanabe, M., Koibuchi, K. and                                      long-term performance assessment method for
  Kosakowski, G., (2021). “Calcite precipitation at                              engineered barrier of TRU radioactive waste repository:
  cement–bentonite interface. Part 2: Acceleration of                            evaluation of long-term behavior of engineered barrier.”
  transport by an electrical gradient.” Journal of                               Tokyo: Radioactive Waste Management Funding and
  Advanced Concrete Technology, 19(5), 447-461.                                  Research Center (RWMC). (in Japanese)
Ngala, V. T, and Page, C. L., (1997). “Effects of                             RWMC, (2011). “FY2010 Report on development of
  carbonation on pore structure and diffusional                                  long-term performance assessment method for
  properties of hydrated cement pastes.” Cement and                              engineered barrier of TRU radioactive waste repository:
  Concrete Research, 27(7), 995-1007.                                            evaluation of long-term behavior of engineered barrier.”
Nindiyasari, F., Fernández-Díaz, L., Griesshaber, E.,                            Tokyo: Radioactive Waste Management Funding and
  Astilleros, J. M., Sanchez-Pastor, N. and Schmahl, W.                          Research Center (RWMC). (in Japanese)
  W., (2014). “Influence of gelatin hydrogel porosity on                      Savage, D., (2013). “Constraints on cement-clay
  the crystallization of CaCO3.” Crystal Growth &                                interaction.” In: R. Hellmann, H. Pitsch eds.,
  Design, 14(4), 1531-1542.                                                      Proceedings of the Fourteenth International Symposium
Palandri, J. L. and Kharaka, Y. K., (2004). “A                                   on Water-Rock Interaction, Wri 14, Avignon France
  compilation of rate parameters of water-mineral                                9-14 June 2013. Elsevier Procedia, 7, 770-773.
  interaction kinetics for application to geochemical                         Šavija, B. and Luković, M., (2016). “Carbonation of
  modeling. “ U.S. Geological Survey Open File Report,                           cement paste: Understanding, challenges, and
  Menlo Park CA: National Energy Technology                                      opportunities.” Construction and Building Materials,
  Laboratory – United States Department of Energy.                               117, 285-301.
Papadakis, V. G., Vayenas, C. G. and Fardis, M. N.,                           Seigneur, N., Mayer, K. U. and Steefel, C. I., (2019).
  (1989). “A reaction-engineering approach to the                                “Reactive transport in evolving porous media.”
  problem of concrete carbonation.” Aiche Journal,                               Reviews in Mineralogy and Geochemistry, 85(1),
  35(10), 1639-1650.                                                             197-238.
Patel, R., Parrott, L., Martin, J. and Killoh, D., (1985).                    Sposito, G., Holtzclaw, K. M., Charlet, L., Jouany, C. and
  “Gradients of microstructure and diffusion properties                          Page, A. L., (1983). “Sodium-calcium and
  in cement paste caused by drying.” Cement and                                  sodium-magnesium exchange on Wyoming bentonite
  Concrete Research, 15(2), 343-356.                                             in perchlorate and chloride background ionic media.”
Poonoosamy, J., Curti, E., Kosakowski, G., Grolimund,                            Soil Science Society of America Journal, 47(1), 51-56.
  D., Van Loon, L. R. and Mader, U., (2016). “Barite                          Stack, A. G., (2015). “Precipitation in pores: A geochemical
  precipitation following celestite dissolution in a                             frontier.” Pore-Scale Geochemical Processes, 80,
  porous medium: A SEM/BSE and mu-XRD/XRF                                        165-190.
  study.” Geochimica Et Cosmochimica Acta, 182,                               Sugita, Y., Fujita, T., Takahashi, Y., Kawakami, S.,
  131-144.                                                                       Umeki, H., Yui, M., Uragami, M. and Kitayama, K.,
Prasianakis, N. I., Curti, E., Kosakowski, G., Poonoosamy,                       (2007). “The Japanese approach to developing
  J. and Churakov, S. V., (2017). “Deciphering pore-level                        clay-based repository concepts – An example of
  precipitation mechanisms.” Scientific Reports, 7(1),                           design studies for the assessment of sealing
  13765.                                                                         strategies.” Physics and Chemistry of the Earth, Parts
Pusch, R., (1992). “Use of bentonite for isolation of                            A/B/C, 32(1-7), 32-41.
  radioactive waste products.” Clay Minerals, 27(3),                          Ta, V.-L., Bonnet, S., Senga Kiesse, T. and Ventura, A.,
  353-361.                                                                       (2016). “A new meta-model to calculate carbonation
K. Nakarai, M. Shibata, H. Sakamoto, H. Owada and G. Kosakowski / Journal of Advanced Concrete Technology Vol. 19, 433-446, 2021 445
front depth within concrete structures.” Construction review: Self-healing in cementitious materials and
and Building Materials, 129, 172-181. engineered cementitious composite as a self-healing
Tartakovsky, A. M., Redden, G., Lichtner, P. C., Scheibe, material.” Construction and Building Materials, 28(1),
T. D. and Meakin, P., (2008). “Mixing-induced 571-583.
precipitation: Experimental study and multiscale Yamaguchi, T., Sawaguchi, T., Tsukada, M., Hoshino, S.
numerical analysis.” Water Resources Research, 44(6). and Tanaka, T., (2016). “Mineralogical changes and
Tinseau, E., Bartier, D., Hassouta, L., Devol-Brown, I. and associated decrease in tritiated water diffusivity after
Stammose, D., (2006). “Mineralogical characterization alteration of cement-bentonite interfaces.” Clay
of the Tournemire argillite after in situ interaction with Minerals, 51(2), 279-287.
concretes.” Waste Management, 26(7), 789-800. Yokozeki, K., Watanabe, K., Sakata, N. and Otsuki, N.,
van der Lee, J. and De Windt, L., (2001). “Present state (2003). “Prediction of changes in physical properties
and future directions of modeling of geochemistry in due to leaching of hydration products from concrete.”
hydrogeological systems.” Journal of Contaminant Journal of Advanced Concrete Technology, 1(2),
Hydrology, 47(2-4), 265-282. 161-171.
Van Loon, L. R., Glaus, M. A. and Muller, W., (2007). Yokozeki, K., Watanabe, K., Sakata, N. and Otsuki, N.,
“Anion exclusion effects in compacted bentonites: (2004). “Modeling of leaching from cementitious
Towards a better understanding of anion diffusion.” materials used in underground environment.” Applied
Applied Geochemistry, 22(11), 2536-2552. Clay Science, 26(1-4), 293-308.
Wu, M., Johannesson, B. and Geiker, M., (2012). “A
Appendix A:
Chemical composition profiles measured by EPMA are
shown in Fig. A1 in addition to main chemical compo-
sition shown in Fig. 4.
15 15 15
BL-4M NC1-4M NC4-4M
Al2O3 content (wt%)
Al2O3 content (wt%)
Al2O3 content (wt%)
BL-10M NC1-10M NC4-10M
10 BL-20M 10 NC1-20M 10 NC4-20M
Initial Initial Initial
5 5 5
Cement paste Bentonite Cement paste Bentonite Cement paste Bentonite
0 0 0
-2 -1 0 1 2 -2 -1 0 1 2 -2 -1 0 1 2
Distance from interface (mm) Distance from interface (mm) Distance from interface (mm)
(a) Distribution of sulfate at the cement–bentonite interface
4 4 4
BL-4M NC1-4M NC4-4M
MgO content (wt%)
MgO content (wt%)
MgO content (wt%)
3 BL-10M 3 NC1-10M NC4-10M
3
BL-20M NC1-20M NC4-20M
Initial Initial Initial
2 2 2
1 1 1
Cement paste Bentonite Cement paste Bentonite Cement paste Bentonite
0 0 0
-2 -1 0 1 2 -2 -1 0 1 2 -2 -1 0 1 2
Distance from interface (mm) Distance from interface (mm) Distance from interface (mm)
(b) Distribution of magnesium at the cement–bentonite interface
4 4 4
BL-4M NC1-4M NC4-4M
Fe2O3 content (wt%)
Fe2O3 content (wt%)
Fe2O3 content (wt%)
3 BL-10M 3 NC1-10M 3 NC4-10M
BL-20M NC1-20M NC4-20M
Initial Initial Initial
2 2 2
1 1 1
Cement paste Bentonite Cement paste Bentonite Cement paste Bentonite
0 0 0
-2 -1 0 1 2 -2 -1 0 1 2 -2 -1 0 1 2
Distance from interface (mm) Distance from interface (mm) Distance from interface (mm)
(c) Distribution of iron at the cement–bentonite interface
Fig. A1 Longitudinal chemical composition profile measured by EPMAYou can also read