PHYSICAL REVIEW ACCELERATORS AND BEAMS 24, 032802 (2021)
←
→
Page content transcription
If your browser does not render page correctly, please read the page content below
PHYSICAL REVIEW ACCELERATORS AND BEAMS 24, 032802 (2021)

                             Bunch-by-bunch three-dimensional position and charge
                                        measurement in a storage ring
                                                              Xingyi Xu
                    Shanghai Institute of Applied Physics, Chinese Academy of Sciences, Shanghai 201800, China
                              and University of Chinese Academy of Sciences, Beijing 100049, China

                              Yongbin Leng,* Yimei Zhou, Bo Gao, Jian Chen, and Shanshan Cao
                   Shanghai Advanced Rearch Institute, Chinese Academy of Sciences, Shanghai 201204, China;
                   Shanghai Institute of Applied Physics, Chinese Academy of Sciences, Shanghai 201800, China;
                              and University of Chinese Academy of Sciences, Beijing 100049, China

              (Received 25 August 2020; revised 27 November 2020; accepted 26 February 2021; published 15 March 2021)

                   Bunch-by-bunch beam parameters monitor is a very useful tool for accelerator operation and
                optimization. An in situ bunch-by-bunch three-dimensional position and charge measurement system
                has been developed at the Shanghai Synchrotron Radiation Facility. Signals from beam position monitors
                carry almost full beam information, a broadband digital receiver can retain most information. Therefore, a
                four-channel wideband oscilloscope is employed to capture the signals from all electrodes of the beam
                position monitor. Correlation coefficient-based methods are used to extract these bunch-by-
                bunch parameters synchronously. We evaluated the performance of this bunch-by-bunch information
                extraction method, the measurement uncertainty of longitudinal phase is less than 0.2 ps, the uncertainty of
                transverse position is less than 10 μm and the charge uncertainty is 0.3% under the condition that the bunch
                charge is 600 pC. Thanks to the great performance of the new system, it is accurate enough to study the
                transient state during injection. In addition, an in situ wakefield measurement system is planned to be
                established based on this system.

                DOI: 10.1103/PhysRevAccelBeams.24.032802

                     I. INTRODUCTION                                       In order to increase the instability threshold of the charge
   Brightness and stability are key specifications of the               of each bunch, high-order harmonic cavity technology is
third-generation synchrotron radiation light sources [1],               usually used to increase the charge of each bunch through
which have the following basic characteristics: ultra-low               the longitudinal bunch distribution control of multiple high
beam emittance (few nmrad or even tens of pmrad),                       frequency systems, thereby increasing the total average
ultrahigh beam stability(orbital feedback control accuracy              current. It is necessary to carry out online synchronous
is mostly micron or submicron level), high average beam                 monitoring of the transverse and longitudinal parameters of
                                                                        each bunch to determine how the amplitude and phase
current (above 300 mA), small-aperture beam vacuum pipe
                                                                        parameters of these high-frequency systems work together
(below 30 mm in diameter), a large number of vacuum
                                                                        best. At the same time, it is also necessary to design and
inserts, top-up operation mode, small dynamics aperture,
                                                                        develop a bunch-by-bunch feedback system with reason-
with high time resolution experiment ability (time reso-
                                                                        able bunch-by-bunch parameters to suppress the instability
lution ps order) and so on [2]. The above-mentioned
                                                                        of the beam in the operation process to ensure the regular
characteristics make the following scientific and techno-
                                                                        operation. In addition, “top-up” operation mode requires
logical problems the focus of research and solution: how to
                                                                        frequent injection to maintain a constant high current. The
ensure beam stability under the condition of large current              injection process is a disturbance for the storage ring, which
intensity and how to minimize the disturbance of the                    will affect the beam stability. It is significant to obtain real-
injection process to users.                                             time bunch-by-bunch three-dimensional parameters includ-
                                                                        ing the position and size parameters of both stored and
  *
      lengyongbin@sinap.ac.cn                                           injected bunches to optimize the injector and kickers
                                                                        parameters.
Published by the American Physical Society under the terms of              On the other hand, although the regular injection process
the Creative Commons Attribution 4.0 International license.
Further distribution of this work must maintain attribution to          (about once every 10 minutes for Shanghai Synchrotron
the author(s) and the published article’s title, journal citation,      Radiation Facility) is a disturbance for user’s experiments,
and DOI.                                                                it provides an opportunity for accelerator physicists and

2469-9888=21=24(3)=032802(16)                                   032802-1               Published by the American Physical Society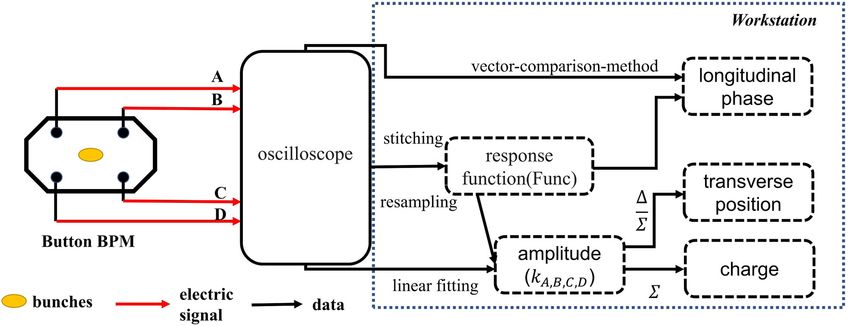
XU, LENG, ZHOU, GAO, CHEN, and CAO                                       PHYS. REV. ACCEL. BEAMS 24, 032802 (2021)

beam diagnostic personnel to monitor machine status in real        realizes the measurement of important bunch parameters,
time and obtain more beam information [3–5]. The storage           but also can be used for beam dynamics analysis, injection
ring is very stable during decay mode, transverse oscillation      transient process and research on unstable phenomena such
amplitude is usually suppressed to a few microns, longi-           as beam loss. In addition, institutions such as SSRF [15]
tudinal oscillation amplitude is usually suppressed to a few       and PLS [35] used oscilloscopes to measure the transverse
picoseconds, and the closed-orbit stability reaches sub-           position of each bunch.
micron. Most of beam parameters that can be measured                  Longitudinal phase measurement (sometimes called
are steady-state (such as current, closed-orbit, bunch length,     beam arrival time measurement in free electron lasers) is
profile size). If no excitation (disturbance) is applied, more     another key part of bunch-by-bunch measurement. The
machine parameters (such as Beta function, chromaticity,           accelerator facilities are usually equipped with a bunch-by-
damping time, instability growth time) cannot be obtained. It      bunch longitudinal feedback system to solve problems such
is difficult to judge whether the synchrotron radiation facility   as longitudinal instability. The longitudinal feedback
is operating under the design model and whether there is           system of most accelerators is based on I-techs Libera
operating risk. If the three-dimensional parameters of the         bunch-by-bunch module and Dimtels iGp bunch-by-bunch
bunches can be monitored in real time of each inject events,       feedback processor [36–39]. In addition to feedback
it is possible to obtain the above-mentioned machine               system, the most common method is using an oscilloscope
parameters through the analysis of this unsteady state             for direct measurement, such as LNLS [40], NSLS-II [41],
process, so as to realize the online tracking of the machine       Spring-8 [42] and so on. Considering data acquisition and
status and even the early warning of operational risks.            online applications, most devices will also use phase
   Obviously, it is necessary to establish a bunch-by-bunch        detectors or IQ detections to achieve longitudinal phase
parameter measurement system with high resolution and              measurement, such as KEK-PF [43], NSLS-II [41], etc.
high refresh rate. In the early days, limited by electronics       KEKB has proposed a set of bunch-by-bunch detection
technology, beam measurement generally performed on the            method based on the gate circuit [44,45].
storage ring mainly included beam closed-track measure-               Bunch-by-bunch charge measurement is an indispen-
ment [6] and turn-by-turn beam measurement [7]. In recent          sable part of bunch-by-bunch measurement. For synchro-
years, with the development of electronic technology and           tron radiation facilities, the BCM (beam current monitor)
the need for accelerator machine research, high-precision          system is an important beam measurement subsystem for
bunch-by-bunch measurement has become a hot spot in                monitoring the beam filling mode and studying the operat-
accelerator research around the world [8,9,9–22].                  ing status of the machine. The front-end signal pickup of
   The bunch-by-bunch measurement mainly includes                  the BCM system usually includes BPM, synchrotron
transverse position measurement, longitudinal phase meas-          radiation light, fast current transformer (FCT) and wall
urement and charge measurement. High-resolution trans-             current probe (WCM), etc. The commonly used signal
verse position measurement is most important for studying          acquisition equipment are digital beam signal processors
the three-dimensional bunch position movement process.             and oscilloscopes. The former is widely used in NSLS-II
The commonly used measurement methods mainly include               [46], BEPC-II [47], SSRF [48], and ALS [49]. The latter is
three categories: bunch-by-bunch measurement based on              used in Australian Synchrotron [50], Swiss Light Source
commercial bunch-by-bunch feedback system, bunch-by-               [51], HLS [52] and other facilities. The most representative
bunch measurement system based on digital oscilloscope,            ones are the work of ALS and HLS in recent years. ALS has
and bunch-by-bunch measurement system based on high-               upgraded the BCM system in recent years, subdividing the
speed acquisition board. Among them, the additional                length of the ALS loop into 62.5 ps (twice the beam length)
function provided by the commercial bunch-by-bunch                 interval, changing the sampling position by setting time-
transverse feedback system is the earliest method used             shift, and finally covering the entire sampling loop. After
for bunch-by-bunch position measurement. Commonly                  summing all the sampling points, use DCCT to calibrate the
used commercial processors include the digital feedback            charge of each bunch. The storage ring charge measure-
processor designed by Spring-8 [23] and commissioned by            ment accuracy of this system is better than 1%, and the
TED (Tokyo Electron Device), the Libera BXB module                 beam loss of 0.2 pC can be measured. Unlike this, HLS
(bunch-by-bunch unit) developed by I-tech [24], and the            presents a novel bunch current measurement system based
iGp (Integrated Gigasample Processor) BXB feedback                 on monitoring the distribution of synchrotron radiation.
processor by Dimtel [25]. Bunch-by-bunch transverse                According to preliminary tests of the daily operation mode
feedback systems have been widely used in electron storage         and single-bunch mode, the measured root-mean-square of
rings, such as ALS [26], PEP-II [27], DAΦNE [28],                  the beam current is 1%.
DELTA [29], TLS [30], DIAMOND [31], ANKA [32],                        In summary, research institutions around the world have
BEPC-II [33], HLS [34], etc. Some laboratories have                put forward many excellent solutions for bunch-by-bunch
specially developed bunch-by-bunch measurement systems             measurement. However, it can be seen that for the existing
based on high-speed acquisition boards, which not only             bunch-by-bunch measurement system, the measurement of

                                                             032802-2
BUNCH-BY-BUNCH THREE-DIMENSIONAL …                                        PHYS. REV. ACCEL. BEAMS 24, 032802 (2021)

the transverse position, longitudinal phase and charge is
relatively independent. Each subsystem is composed of
different hardware and software from signal pick-up to
signal processor. According to the survey results, there
is almost no mature bunch-by-bunch three-dimensional
position and charge measurement system. It is also very
meaningful to measure each parameter independently, but
for the study of some physical processes, simultaneously
measurement is necessary.
   This paper reports the new progress in the bunch-by-
                                                                    FIG. 1. Cross section (left) and longitudinal section (right) of
bunch three-dimensional position and charge measurement.
                                                                    button-type BPM.
We have developed a set of signal processing methods
based on correlation functions and software resampling,
beam parameters can be measured with high repetition rate           When the external resistance is Z, the signal VðtÞ we can
from the button beam position monitor (BPM). Using this             collect is
system, the three-dimensional position and charge of all
bunches on every turn can be measured simultaneously.                       VðtÞ ¼ IðtÞ · Z
The measurement uncertainty of the system is evaluated.                            −Z t − t0
                                                                                 ¼     ·     · I 0 ðtÞ · fðareaÞ · Fðδ; θÞ:     ð6Þ
Without external clock and complex electronics front-end,                          βc α2
the measurement uncertainty of the method is improved
compared with the traditional amplitude difference ratio            Where I(t) is the current intensity through the resistor. It can
and algorithm.                                                      be seen from Eq. (6) and Eq. (1) that the collected voltage
                                                                    signal is related to the transverse position(Fðδ; θÞ), longi-
                                                                    tudinal position(longitudinal phase t0 ) and charge(e · N) of
                II. THEORETICAL BASIS                               bunch. Therefore, there is theoretical support for extracting
   Figure 1 shows cross section (left) and longitudinal             bunch-by-bunch parameters from the signal.
section (right) of a button BPM. When a bunch passes                   Unfortunately, the actual collected signal is not com-
through the button electrode, the electrical signal will be         pletely in accordance with the theoretical derivation, the
drawn from the electrode by the feedthrough, which                  limited bandwidth of the feedthrough will introduce time
contains almost all parameter information of the bunch.             delays. In addition, the bandwidth limitation of the acquis-
In the following analysis, we consider N particles of charge        ition device will also change the signal waveform in the
e in a bunch of root-mean-square temporal length α (in time         time domain. Therefore, we have done a lot of algorithmic
units). A bunch with a longitudinal Gaussian distribution           work to try to extract the bunch-by-bunch parameters from
can be expressed in the time domain as following [53,54]:           the time domain signal.

                      eN           ðt − t0 Þ2                        III. PARAMETERS EXTRACTION ALGORITHM
               I 0 ¼ pffiffiffiffiffiffi exp −             :         ð1Þ
                      2π α            2α2                              The signal excited by a bunch passing through the BPM
Where t0 is the time interval relative to the reference time.       collected by a broadband device is very short-lived (about
When a bunch passes through the electrode, due to                   1 ns on SSRF), which means that the acquisition device can
electrostatic induction, induced charges QðtÞ will accumu-          only collect a small number of sampling points. As shown
late on the electrode:                                              in Fig. 2, it is the signal we obtain when each bunch passing
                                                                    BPM under regular operation (top-up). The signal is
                QðtÞ ¼ I 0 ðtÞ · fðareaÞ · Fðδ; θÞ:          ð2Þ    actually several points on the continuous smooth response
                                                                    function:
fðareaÞ is a factor of the electrode area, which is related to

the shape and size of the electrode normal plane. where the                                         n−1
position related equation has been derived in [11]:                       Sðt0 ; nÞ ¼ Func t0 þ                ðn ¼ 1; 2…Þ: ð7Þ
                                                                                                      f
                               a2 − δ2
                Fðδ; θÞ ¼                         :           ð3Þ   Where t0 is the time of the 1th sampling point relative to the
                         a2 þ δ2 − 2aδ cos θ                        reference instant. n is sampling point index. Sðt0 ; nÞ is
                           qffiffiffiffiffiffiffiffiffiffiffiffiffiffiffi                         sampling point value. FuncðtÞ is response function which
                      δ ¼ x2 þ y2 :                           ð4Þ   represents signal excited by a bunch passing a button
                                                                  electrode. f is the sampling frequency. It can be known from
                  mπ          y
     θA;B;C;D   ¼    − tan−1                ðm ¼ 3; 1; 7; 5Þ: ð5Þ   Eq. (6) and Eq. (1) that the shape of the response function is
                   4          x                                     mainly affected by the bunch length. Since the bunch status

                                                              032802-3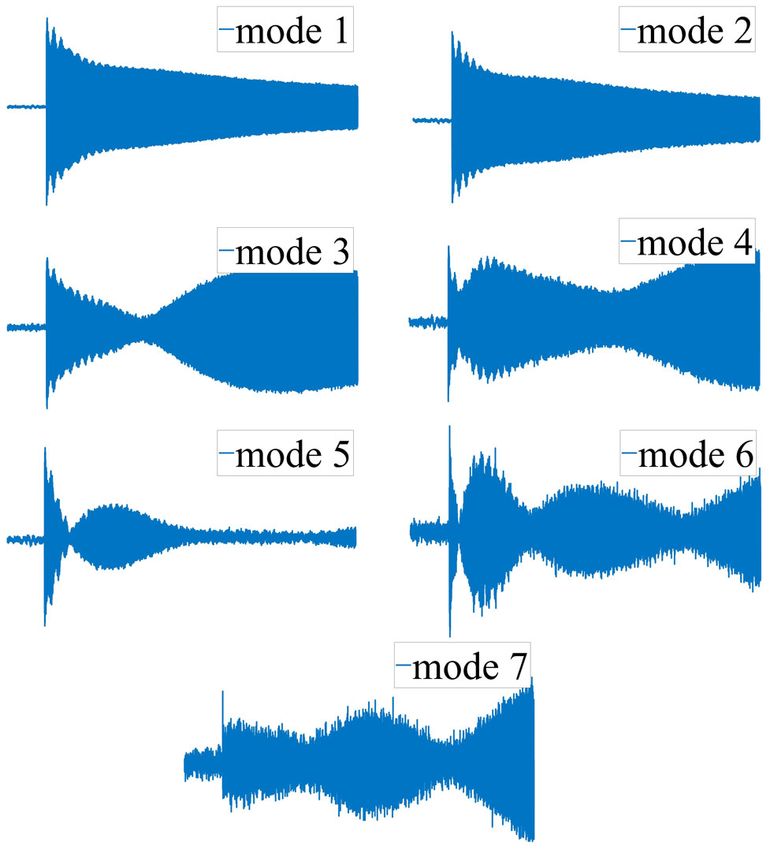
XU, LENG, ZHOU, GAO, CHEN, and CAO                                     PHYS. REV. ACCEL. BEAMS 24, 032802 (2021)

                                                                     In detail, the splicing of the response function is a
                                                                 combination of thousands of discrete signals excited when
                                                                 the same bunch passes through the BPM electrode thou-
                                                                 sands of times. The revolution frequency (f c ) and the
                                                                 sampling frequency of the oscilloscope (f) are accurately
                                                                 known (the uncertainty is less than 100 fs), which means
                                                                 that this splicing can be done through mathematical
                                                                 calculations. After finding the signal of the same bunch
                                                                 on each turn, the position of the signal on absolute time axis
                                                                 is calculated. After the phase alignment is completed, these
                                                                 signals constitute the initial response function of the bunch.
                                                                 Due to the inconsistency of sampling (mainly from the
                                                                 ADC of the acquisition device, longitudinal phase jitter,
FIG. 2. The signal obtained when a bunch passes BPM. The rf      and transverse position jitter), the response function
frequency is about 499.654 MHz and the sampling frequency        obtained by direct splicing of measurement data will not
is 10 GHz.                                                       be very smooth. However, ADC sampling error, phase
                                                                 jitter, and position jitter are all evenly distributed, so the
in the storage ring is relatively stable, the charge distribu-   fine response function is the most probable value of the
tion of the bunch can be considered unchanged on the order       response function obtained by splicing. By window
of milliseconds. Therefore, the response function is con-        smoothing the initial response function, the fine response
stant within milliseconds. The following formula holds:          function represented by its most probable distribution is
                                                                 obtained. In order to save computing resources, the fine
                         f ≠ m · fc :                     ð8Þ    response function after window smoothing is resampled by
                                                                 software to obtain a standard response function with a
m is the positive integer. When the bunch passes through         lower equivalent sampling rate for subsequent data process-
the BPM again, the acquire signal point will not be in the       ing. Figure 3 shows the construction result of the response
same position of the response function last time. f c is the     function of a sample bunch. We selected the data during the
revolution frequency. t0 can be obtain when the bunch            injection process to construct the response function. During
passes the BPM every turn, because f c and f are known. On       this time, the betatron oscillation is the strongest in the
the basis of removing the initial phase t0 , through the         regular operation of SSRF. It can be seen that the algorithm
splicing of multiturn sampling data, a high sampling rate        still works well if the beam is undergoing betatron
response function (about 100 THz for us) is constructed.         oscillation.
Because of the different charge distributions, the response          It is feasible to obtain the response function with a stable
functions of different bunches are different. The response       beam and reuse it for other measurements. But this is not
function for each bunch is constructed separately. I con-        the best choice. Building the response function in real time
struct the response function separately for each button and      will be better. It can be known from Eq. (6) and Eq. (1) that
each bunch. The shape of each electrode and the connected        the shape of the response function is mainly affected by the
cable cannot be guaranteed to be exactly the same. This          bunch length. If the beam length changes in different
means that the response function of each channel will not
be exactly the same. Therefore, independent construction of
the response function is a better choice.
   Due to the signal noise and the oscillation of the
transverse position of the bunch, the high sampling rate
response function constructed by multiturn splicing is not
very smooth. In addition to betatron oscillation, ADC
sampling error, longitudinal phase oscillation will cause
turn-by-turn variation, too. To eliminate the turn-by-turn
variation, “window smoothing” comes in. The response
function is the most probable distribution of data in
different turn. From a mathematical point of view, the
turn-by-turn variation can be almost completely eliminated
by window smoothing. Based on the minimum sum of
Euclidean distances from nearby sampling points, we              FIG. 3. The initial response function(red) and standard re-
obtained the smooth response function with less noise            sponse function(blue) of a typical bunch when the beam is
and lower sampling rate (about 10 THz).                          undergoing betatron oscillation.

                                                           032802-4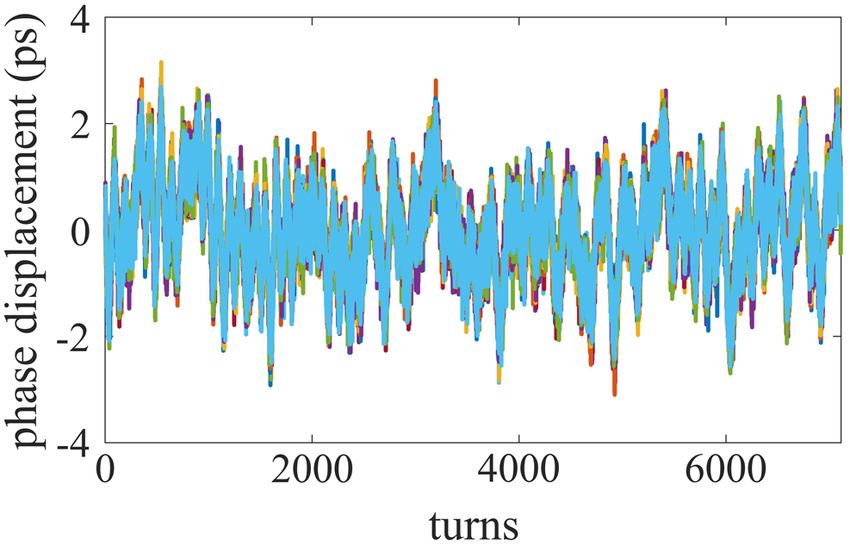
BUNCH-BY-BUNCH THREE-DIMENSIONAL …                                            PHYS. REV. ACCEL. BEAMS 24, 032802 (2021)

                                                                                1
experiments, using the response function constructed with a
stable beam (different bunch length) will cause the meas-
urement resolution to decrease.                                               0.5
    It can been seen from Fig. 3 that the bunch signal

                                                                       (ps)
contains ringing signal. Most of the ringing signal is part of
                                                                                0
the single bunch signal and not from the leading bunches.

                                                                         r
The bandwidth is not infinite and the cable has lead
resistance, lead inductance, and stray capacitance, the                       -0.5
ringing signal is generated. This is a valid signal, and
the ringing signal also contains amplitude and phase                           -1
information. At high bandwidth, the first bunch and the                         0          200         400         600         800
last bunch in a bunch train have similar response functions.                                       bunch index
Therefore, the influence of the ringing signal on the
                                                                    FIG. 4. The equilibrium longitudinal phase(φr ) of bunches in
measurement is limited. In addition, in each measurement,           top-up filling pattern. There are 720 buckets in SSRF.
the response function is established in real time, and even if
there is a limited ringing signal from the leading bunches,
                                                                    acquired when bunch m passes the BPM in turn j. fdm;j
                                                                                                                      n g is
this part of the signal is also included in the establishment
                                                                    an array in mathematics.
of the response function. In other words, we do not start the

fitting of the bunch shape with pure single bunch response.           m;j                            n
It will not have a great impact on the bunch measurement.           fdn g ¼ km;j · Funcm0 t0 þ
                                                                                                     f
    Bunch-by-bunch longitudinal phase consists of three
parts:                                                                            XN
                                                                                                           n
                                                                              þ         ki;j · ei;m;j t0 þ     þb
                                                                                                           f
                    φl ¼ φt0 þ φr þ φc :                      ð9Þ               i¼1;i≠m

                                                                                     ðn ¼ 1; 2; 3…Þ:                            ð11Þ
Where φt0 is the phase of the first sampling point of the
signal acquired when a bunch passes BPM each turn, that             Where fdm;jn g is the array, k is amplitude of signal. For
is, the initial phase relative to the reference instant. φt0 is     different bunches and different turns, k is different.
easy to determine. In the case of knowing the index of the          According to Eq. (6) and Eq. (1), it is proportional to
starting point of the signal in the whole data, it only             the distance of the bunch from the BPM electrodes and
depends on the sampling period of the signal acquisition            charge of the bunch in the case of ignoring the high-order
device and the revolution time. φr is the phase of response         term. Broadband acquisition equipment ensures that cross-
function, it represents the equilibrium phase of a bunch. For       talk is small enough to be ignored. After subtracting the
different bunch, φr is different, because the longitudinal          baseline and ignoring ei;m and ei;m;j , Eq. (10) and Eq. (11)
equilibrium phase of each bunch is different. In a physical         is simplified to:
sense, φr represents the equilibrium position of the longi-
tudinal oscillation of the bunch shown in Fig. 4. φc is the                               Funcm ðtÞ ¼ Funcm0 ðtÞ:               ð12Þ

phase difference relative to the response function. For                                                             n
different bunches and different turns, φc is different, and                          fdm;j
                                                                                       n   g ¼ km;j · Funcm0  t 0 þ    :        ð13Þ
                                                                                                                    f
it is the most important part of bunch-by-bunch measure-
ment. We developed a vector-comparison-method based on                 The lookup table (fLUTin g) is obtained by software
correlation coefficient to calculate it by comparing the data       resampling to the response function [Funcm ðtÞ]. The
acquired every time when the bunch passes BPM with the              sampling frequency is f(same as the acquisition equip-
response function of the bunch.                                     ment). The initial phase of the lookup table is ti .
   Funcm ðtÞ is the constructed response function of mth
                                                                                               n
bunch which consists of three parts:                                fLUTm;i
                                                                          n g ¼ Func  m  t i þ
                                                                                               f
                                    X
                                    N
                                                                                                n
       Funcm ðtÞ ¼ Funcm0 ðtÞ þ              ei;m ðtÞ þ b:   ð10Þ             ¼ Funcm0 ti þ            ðn ¼ 1; 2; 3…Þ: ð14Þ
                                   i¼1;i≠m                                                      f

Where Funcm0 ðtÞ is the signal excited by bunch m self. b is        if ti ¼ t0 :
the baseline which mainly depends on the acquisition
                                                                          fdm;j
                                                                            n g ¼ km;j · fLUTn g
                                                                                             m;i
                                                                                                             ðn ¼ 1; 2; 3…Þ:    ð15Þ
equipment. N is the total number of bunch. ei;m is the
signal generated by the bunch i at the bunch m which is             Mathematically, when ti ¼ t0 , the two arrays are in direct
mainly caused by crosstalk and reflection. fdm;j
                                             n g is the data        proportion. It means that the two vectors are in the same

                                                              032802-5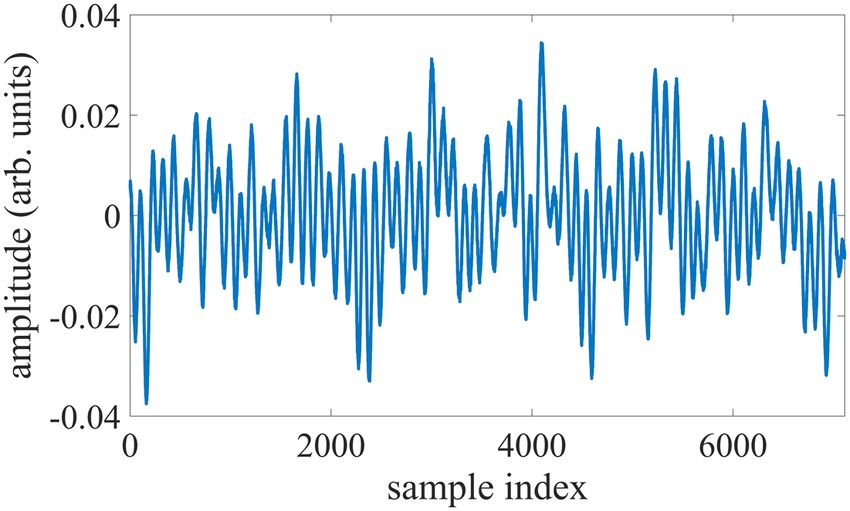
XU, LENG, ZHOU, GAO, CHEN, and CAO PHYS. REV. ACCEL. BEAMS 24, 032802 (2021)
1 104
1.5
correlation ceofficient 1
0.5 0.5
bunch data
0
0 -0.5
-1
-1.5 dn = 1.0029*LUT n - 42.1794
-0.5
0 0.5 1 1.5 2 -2
-2 -1.5 -1 -0.5 0 0.5 1
LUT index 104
LUT 104
FIG. 5. The relationship between correlation coefficient and m;j
FIG. 6. Linear fitting of fLUTm;i
n g and fdn g. km;j is the slope
index of LUT. The peak value is close to 1, which indicates that
obtained by fitting.
the match is successful and effective.
direction. By finding the lookup table with the closest shown in Fig. 6. Bunch-by-bunch transverse position (x,y)
direction, t0 can be obtained. A vector-matching-method and charge (Q) are given as follow:
based on correlation coefficient has been developed to find kA − kB − kC þ kD
the lookup table with the closest direction. x ¼ kx ·
kA þ kB þ kC þ kD
correlation coefficientm;j;i ¼ cosðθÞ k þ kB − kC − kD
y ¼ ky · A : ð18Þ
kA þ kB þ kC þ kD
dm;j
n · LUTn
m;i
¼ m;j : ð16Þ Wherein: kx and ky are constant. Equation (18) is valid only
jd j · jLUTm;i j
when the beam is at the center of the vacuum chamber. For
Where correlation coefficientm;j;i is the correlation coef- offset beam, it includes systematic error. In regular oper-
ficient of bunch m in jth turn’s data comparing with ith ation of SSRF, the beam is very close to the center of the
LUT of bunch m. Mathematically, it represents the cosine vacuum chamber, so this algorithm can meet the accuracy
of the angle between two vectors, ranging from −1 to 1. requirements. It should be implemented to include poly-
nomial fit to reproduce the monitor chamber structure if the
ibestm;j ¼ argmaxi ðcorrelation coefficientm;j;i Þ: ð17Þ beam is far from the center of the vacuum chamber [55,56].
According to Eq. (17), the index of the most matching LUT Q ¼ kq · ðkA þ kB þ kC þ kD Þ: ð19Þ
can be obtained by looking for the maximum value of
correlation coefficientm;j;i . Where ibestm;j is the most match- Wherein: kq is constant.
ing index of bunch m in jth turn. The relationship between
correlation coefficient and index of LUT is shown in Fig. 5. IV. MEASUREMENT APPARATUS
According to Eq. (15), km;j can be obtained by linear In order to reduce signal loss, broadband acquisition
m;j
fitting fLUTm;i
n g and fdn g. An example of the fitting is equipment is necessary. Since there were few standard
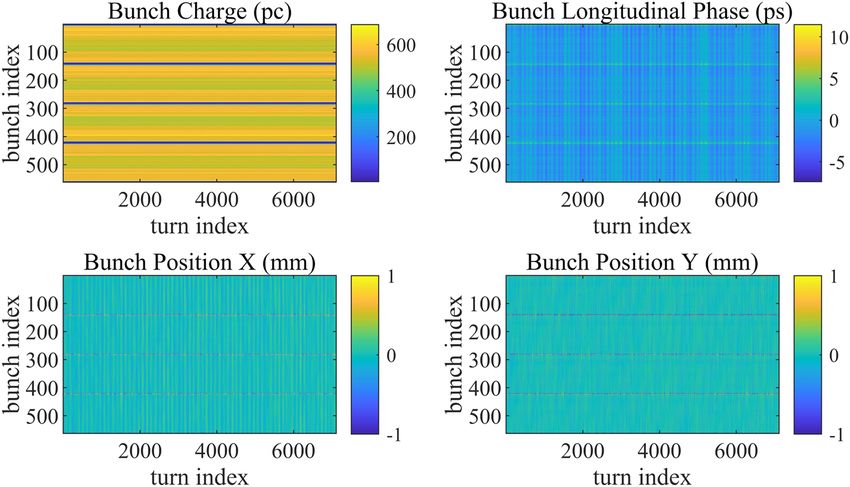
FIG. 7. Measurement scheme and algorithm flow. The oscilloscope direct samples the signal from the BPMs electrodes and fetches the
original waveforms over 7000 turns and more than 500 bunches for once. Data processing based on Numba and Python is done in a
workstation.
032802-6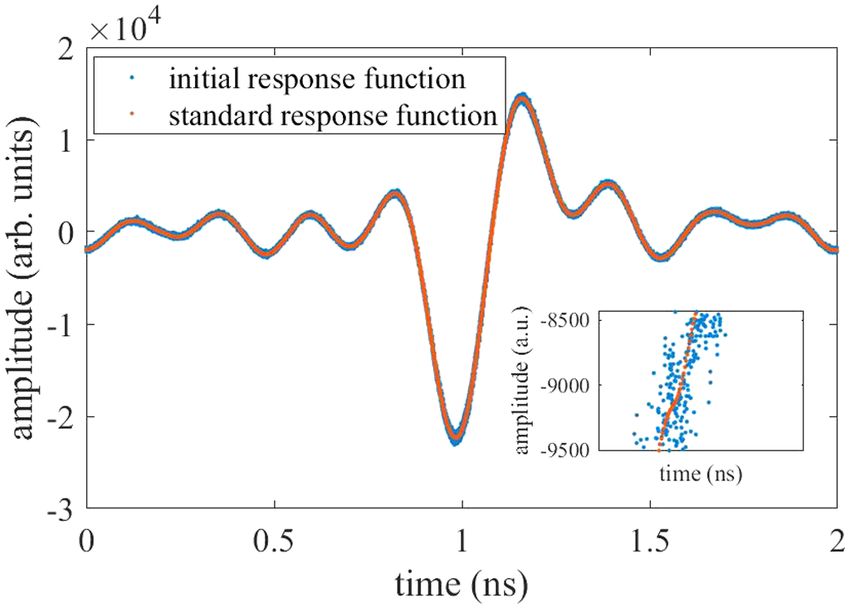
BUNCH-BY-BUNCH THREE-DIMENSIONAL …                                    PHYS. REV. ACCEL. BEAMS 24, 032802 (2021)

TABLE I.     Parameters of SSRF.

Parameter                                          Value
energy (E)                                       3.5 GeV
current (I 0 )                                   220 mA
rf frequency (frf )                            499.654 MHz
rf cavity voltage (V rf )                        4.5 MV
buckets (h)                                         720
revolution frequency (f o )                      694 kHz
bunch length (σ)                                   18 ps

electronics that could measure the beam signals with both
high sampling rate and huge memory capacity to store the
data, a broadband oscilloscope with a 20 GHz maximum            FIG. 8. The bunch response function with DC-1 GHz band-
                                                                width. The crosstalk between bunches is very large.
sampling rate and 6 GHz analog bandwidth was chosen to
record the signals from the four buttons of a BPM owing to
its high-sampling rate and available memory capacity            interval is about 2 ns in SSRF. Based on this calculation, the
(7000 turns of the SSRF operating mode). A workstation          signal crosstalk between the bunches is about 37% with
is used to extract bunch-by-bunch three-dimensional posi-       low-pass filter, which is far greater than the influence of
tion and charge from the signals, as shown in Fig. 7. The       HOM-related components. With the high-bandwidth
sampling rate of the oscilloscope was not an integer            oscilloscope, it not only retains more signal power but
multiple of the rf frequency (499.654 MHz in our storage        also avoids the crosstalk between the bunches, which
ring). As a result, a high sampling rate response function      makes it possible to measure bunch-by-bunch position
can be obtained by the splicing of multiturn sampling data.     and charge on every turn. In this case, the post-ringing
   SSRF is a third generation synchrotron radiation light       signal will almost decay to zero before the next bunch
source. It is composed of a group of accelerators: a            signal arrives.
150 MeV linear accelerator, a 180 m-long 3.5 GeV booster,          Therefore, although the system bandwidth is higher than
and a 432 m long 3.5 GeV storage ring. The machine runs         the cutoff frequency which will introduces HOM-related
routinely in top-up mode. Four bunch trains, each has 125       components, the bunch data has been measured without
consecutive bunches, are evenly spread in the 720 buckets       low-pass filter.
in the storage ring. The relevant parameters of the machine
are listed in Table I.                                                       V. EXPERIMENTS RESULTS
   For SSRF, the bunch length is stable at about 18 ps for a
long time, and the beam life is several hours, which makes         We use this bunch-by-bunch three-dimensional position
the response function not change in a short time. When the      and charge measurement system to monitor the beam state
oscilloscope works with four channels, the maximum              in SSRF. The experiment does not need special configu-
sampling rate is 10 GHz, that is to say, each channel           rations of the machine, so the data were collected unnoticed
can get 20 data points from a electrode during the 2 ns time    during daily operations. The typical results plotted in this
when the bunch passing BPM.                                     section were processed by using the data recorded during
   The bandwidth of the system described in this paper is       the injection on July 24, 2020 unless otherwise noted. The
DC-6 GHz, which is much higher than other bunch-by-             reason why we choose the injection process is that the beam
bunch measurement systems. However, very high band-             has strong betatron oscillations during the injection tran-
width will introduce no HOM-related components.                 sient which the influence of kickers.
According to the introduction before, most measurement             In one time, the signal recorded by the oscilloscope can
systems process narrowband signals. Bandwidth is often          be processed to obtain the three-dimensional position and
less than 1 GHz. Although there is no HOM-related               charge of more than 500 bunches in 7000 turns (every turn
components from far place with less than 1 GHz band-            in 1 ms). The processing time window size is mainly
width, the crosstalk between bunches is very large, which is    limited by the memory capacity of the oscilloscope. A set
the reason why most systems cannot achieve strict bunch-        of typical results is shown in Fig. 9. After summing the
by-bunch measurement. In order to evaluate the pros and         relative charge of all bunches, we use DCCT to calibrate the
cons, a special machine experiment was done in SSRF.            charge of each bunch. By averaging the charge of bunches
After setting the bandwidth to DC-1 GHz, we used the            in different turns, the filling pattern of the storage ring can
same device to construct a single-bunch response function       be obtained, as shown in Fig. 10.
(shown in Fig. 8). It can be seen that the effective range of      The bunch-by-bunch three-dimensional measurement
the response function is longer than 2 ns. The bunch            system was used to study the bunch transverse motion

                                                           032802-7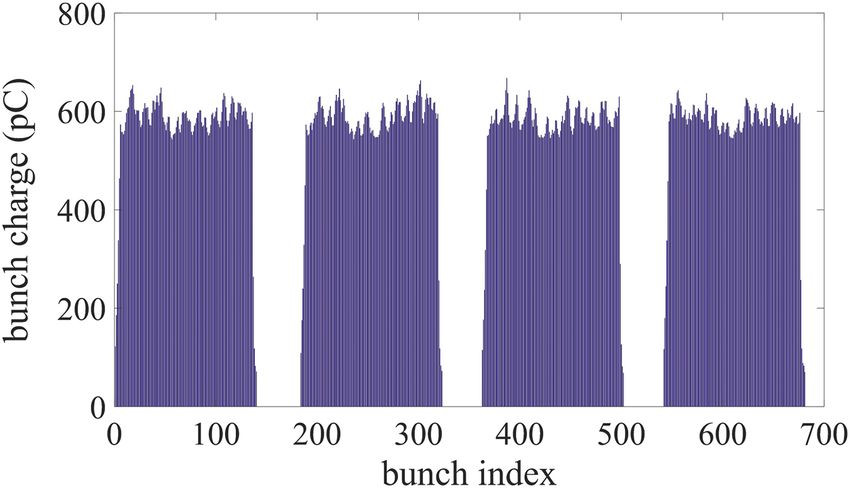
XU, LENG, ZHOU, GAO, CHEN, and CAO                                                    PHYS. REV. ACCEL. BEAMS 24, 032802 (2021)

                                                                                      0.5                            bunch 1

                                                                      position (mm)
                                                                                        0

                                                                                      -0.5

FIG. 9. Bunch-by-bunch three-dimensional position and charge                          0.5
                                                                                                                   bunch 160
result.

                                                                      position (mm)
during injection transient. With signal triggering, we make
                                                                                        0
the injection process happen about 800 turns after the start
of the signal acquisition. The transverse position changes of
three representative bunches are shown in Fig. 11.
   The transverse positions of the bunches before the
                                                                                      -0.5
injection process are very stable. After the injection
                                                                                                          fa
transient occurs, bunches deviate from the equilibrium
position and undergo strong betatron oscillation. The
amplitude of transverse oscillation is an exponential decay,
it could be considered as a betatron damping oscillation                                                           bunch 300
invoked exclusively by the kickers mainly (shown in bunch
                                                                      position (mm)

                                                                                      0.5
300 of Fig. 11). The spatial vector indicated that the kickers
fields influencing the bunches were not constant. for bunch                             0
1, this effect of kickers is very small. Therefore, the change
of the transverse oscillation amplitude of bunch 1 is mainly                          -0.5
affected by the wakefield. The wakefield oscillation of a
bunch is determined by the betatron oscillations of all                                -1
bunches. The propagation coefficient of the wakefield is                                 0       2000      4000      6000
considered a constant once the drive bunch and the witness                                              turns
bunch are decided, so the amplitude of second mode of a
bunch is a linear combination of the amplitudes of the first     FIG. 11. The transverse position changes of three representative
modes of all bunches (including itself). Bunch 160 is a          bunches during injection transient.
manifestation of the combined effect of betatron damping
oscillation and wakefield oscillation. The PCA method can
decompose these multiple coupled motions [18].                      The bunch-by-bunch longitudinal phase on every turn is
                                                                 calculated. The bunches have their own longitudinal
                                                                 oscillations in the non-injected state and the frequency
                                                                 of the oscillations is slow. It can be considered that all
                                                                 bunches have an approximately the same common mode
                                                                 oscillation. Figure 12 shows the phase oscillation of
                                                                 multiple stored bunches in the regular operation mode. It
                                                                 can be seen from the figure that the oscillation frequency
                                                                 and amplitude of each bunch are basically the same, but the
                                                                 initial phase is different.
                                                                    During the injection process, the injector replenishes a
                                                                 small charge on stored bunch. According to the longi-
                                                                 tudinal phase theory, this refilled charge should behave as a
                                                                 synchronous oscillation. From the measurement results,
FIG. 10. The filling pattern obtained by averaging bunch-by-     only superposition with the stored charge can be seen. In
bunch charge.                                                    this regard, our research group conducted a similar

                                                           032802-8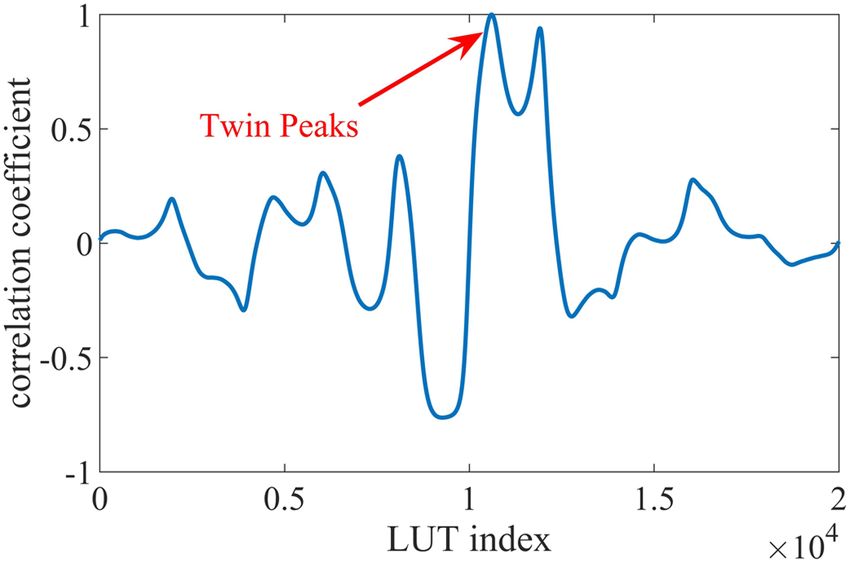
BUNCH-BY-BUNCH THREE-DIMENSIONAL …                                                PHYS. REV. ACCEL. BEAMS 24, 032802 (2021)

                                                                            measurement uncertainty of the average charge (current
                                                                            intensity). At a repetition frequency of 694 kHz, for a
                                                                            600 pC bunch, the uncertainty of bunch-by-bunch charge is
                                                                            1.6 pC. The uncertainty is better than 0.3%. Under the same
                                                                            conditions, the uncertainty of the average charge (current)
                                                                            measurement is 0.15 pC, which is better than 0.027%.
                                                                               The PCA method is used to evaluate the resolution of the
                                                                            bunch-by-bunch transverse position and longitudinal phase
                                                                            measurement in this paper. Principal component analysis
                                                                            (PCA) is a commonly used data processing method in the
                                                                            accelerator field. It mainly uses the singular value decom-
FIG. 12. Longitudinal phase oscillation of dozens of stored                 position (SVD) method to separate correlated signals and
bunches under regular operation mode.                                       random noise, analyzing the signal components in different
                                                                            physical motion modes according to the motion character-
                                                                            istics of the bunches in the accelerator. Compared with
experiment in SSRF [20]. This is not the focus of this paper,               traditional processing methods, it can reduce random meas-
so I will not go into details here.                                         urement errors and also remove some systematic measure-
                                                                            ment errors. In the field of accelerator beam measurement, it
                  VI. PERFORMANCE EVALUATION                                is usually used to extract the parameters of the optical model
   The measurement uncertainty is the most important                        of the storage ring [57,58], the performance evaluation of
index of the beam diagnostic system. The following will                     beam position probes [59], the betatron oscillation phase
analyze the measurement uncertainty of charge (current),                    analysis between beam position probes [60], etc.
transverse position, and longitudinal phase. As a necessary                    For an m · n real number matrix A, it can be decomposed
condition for the stable work of a synchrotron radiation                    into the following three matrix products:
facility, the charge of bunches is constant in a short time.
Therefore, BI (beam instrument) researchers generally use                                            A ¼ USV T :                       ð20Þ
the mean square error of the short-term continuous mea-
sured charge as an indicator of measurement uncertainty.                    U, S, and V are the temporal vectors [57], singular matrix
The system can measure the charge of all bunches on every                   and spatial vectors, respectively. The S matrix only has
turn (694 kHz). The continuous measurement results of a                     values on the diagonal, which are usually non-negative real
typical bunch are shown in Fig. 13.                                         numbers arranged in decreasing order of magnitude. These
   The charge of all bunches on every turn is of greater                    values are called singular values.
significance to particle physics researchers, and the oper-                    When the singular value is larger, the corresponding
ators of synchrotron radiation facility are more concerned                  principal component is the main common physical mode of
about the current intensity (average charge of charge). By                  the signal. Therefore, the beam motion state can be
doing a weighted average of the charges of all bunches in                   analyzed according to the signal characteristics of these
the storage ring, the average charge is obtained (shown                     modes. For beam position measurement, the PCA method
in Fig. 14).                                                                is used to decompose the data matrix composed of multiple
   The mean square error is used to evaluate the bunch-                     electrode signals, and the signals related to the main
by-bunch charge measurement uncertainty and the                             oscillation can be separated separately. The mode with a
                                                                            singular value close to 0 is mainly a vector caused by

                584

                582
  charge (pC)

                580

                578

                576

                574
                      0      1000 2000 3000 4000 5000 6000 7000
                                          turn index

FIG. 13.                  The continuous measurement results of a typical
bunch.                                                                             FIG. 14.   The average charge in different turns.

                                                                      032802-9
XU, LENG, ZHOU, GAO, CHEN, and CAO                                                                PHYS. REV. ACCEL. BEAMS 24, 032802 (2021)
                     0.2

                    0.15
   singular value

                     0.1

                    0.05
                                          noise floor
                      0
                           0   5      10           15   20
                                   mode index

FIG. 15. The singular values of each transverse position mode   FIG. 17. The frequency spectrum analysis of these seven
obtained by PCA analysis.                                       principal components show that they are the betatron oscillations
                                                                and coupled motions in the vertical and horizontal directions.
various random noises. If the singular values representing
the main beam motion mode in the S matrix are also set          the vertical and horizontal directions, which are the
to 0 and the recombined matrix is denoted as S1 , the           common motion modes of all bunches [18]. The frequency
result of US1 V T represents the random noise after beam        spectrum analysis of these seven motion modes (shown in
movement is removed. Calculating the standard deviation         Fig. 17) shows that the frequency spectrum is consistent
of the column vector of this data matrix, you can get           with the tune.
the measurement uncertainty of different bunches.                  According to the above theory, the equation US1 V T was
Therefore, this method is often used for the resolution         used to calculate the measurement uncertainty(shown in
evaluation of beam transverse position and longitudinal         Fig. 18). The figure shows the transverse position meas-
phase measurement.                                              urement uncertainty of bunches with different charges in
   The PCA method is used in the uncertainty analysis of        the unstable state during the injection transient. The
the bunch-by-bunch transverse position measurement. The         measurement uncertainty is inversely proportional to the
data matrix of the transverse position of 512 bunches on        bunch charge, because the greater the charge, the greater
7000 turns is the real number matrix A, that is, m ¼ 512,       the signal-to-noise ratio, so this is consistent with the
n ¼ 7000. Doing model decomposition in time and space,          theory. When the charge is about 600 pC, the bunch-by-
singular matrix is obtained (shown in Fig. 15).                 bunch transverse position measurement uncertainty is
   The first seven principal components (shown in Fig. 16)      better than 10 μm.
are the betatron oscillations and their coupled motions in         Similarly, we used the PCA method to evaluate the
                                                                measurement uncertainty of the bunch-by-bunch longi-
                                                                tudinal phase. It can be seen that the oscillation frequency
                                                                and amplitude of each bunch are basically the same, but the
                                                                initial phase is different. The longitudinal phase PCA
                                                                decomposition results of the bunches are very concentrated.
                                                                A mode with a singular value close to 1 occupies the largest
                                                                 measurement uncertainty (mm)

                                                                                                                                   bunch
                                                                                                0.03                                uncertainty = 2.72/charge

                                                                                                0.02

                                                                                                0.01

                                                                                                  0
                                                                                                       0   100   200   300    400    500    600     700         800
                                                                                                                       bunch charge (pC)

                                                                FIG. 18. The bunch-by-bunch transverse position measurement
FIG. 16. The time domain waveforms of the first seven           uncertainty with different bunch charge. The fitted line shows that
principal components in horizontal after the injection.         the inverse relationship between the two is established.

                                                         032802-10
BUNCH-BY-BUNCH THREE-DIMENSIONAL … PHYS. REV. ACCEL. BEAMS 24, 032802 (2021)
1
singular value 0.8
0.6
0.4
0.2 noise floor
0
0 5 10 15 20
mode index
FIG. 19. The singular values of each longitudinal phase mode FIG. 21. The frequency spectrum analysis of the first principal
obtained by PCA analysis. components about longitudinal phase after the injection.
component of the longitudinal phase oscillation of the voltage measurement error(ADC effective bits). When the
bunches (shown in Fig. 19). oscilloscope is in a dynamic range of plus or minus 5 V, the
The time-domain waveform (Fig. 20) and frequency random measurement error of a single point is about 0.02 V.
spectrum (Fig. 21) of the first principal mode obtained by Different from other bunch-by-bunch measurement algo-
mode decomposition and Fourier transform are shown in rithms, our algorithm does not only use peak points but
the figure. It can be seen that the bunches in the storage makes full use of all sampling points, so it has several times
ring have a strong common longitudinal oscillation. This the processing gain.
oscillation is determined by the rf cavity and the longi- The systematic error mainly comes from the crosstalk
tudinal coupling wakefield. between bunches. According to Eqs. (10)–(13), this term
After removing this mode, the rest is random measure- was ignored as a constant. Because high-bandwidth acquis-
ment noise and undefinable high-order motion mode. The ition equipment is used and the state of the bunches is
uncertainty of the longitudinal phase measurement is stable, it is reasonable to ignore this item (Fig. 8 and Fig. 3).
evaluated by the same method as the transverse position The mathematical analysis also support this point. If this
measurement. The measurement uncertainty of longi- item is not omitted, we find that the influence of it will be
tudinal phase is inversely proportional to the bunch charge. multiplied by k − 1 by rederive Eqs. (10)–(13). Because k
When the charge is about 600 pC, the bunch-by-bunch is always close to 1, it has little effect. In fact, the crosstalk
transverse position measurement uncertainty is better than between bunches can be completely removed by iterating
0.2 ps (shown in Fig. 22). the current algorithm. The price of this is that it requires a
The sources of noise was evaluated. The main sources in lot of computing resources. In the future, we plan to
the bunch-by-bunch measurement based on the high- evaluate the necessity of doing so.
sampling oscilloscope include two parts: One part is the The feasibility of this bunch-by-bunch information
clock jitter of the oscilloscope itself. The oscilloscope we extraction algorithm on other devices has been study.
use has a new generation of time reference structure which Because the selected data acquisition equipment is an
provides accurate time accuracy. The lowest internal clock oscilloscope without an external clock. This means that
jitter is less than 100 fs. Another part comes from the signal
measurement uncertainty (ps)
bunch
1 uncentainty = 117.3/charge
0.8
0.6
0.4
0.2
0
0 100 200 300 400 500 600 700 800
bunch charge (pC)
FIG. 22. The bunch-by-bunch longitudinal phase measurement
FIG. 20. The time domain waveforms of the first principal uncertainty with different bunch charge. The fitted line shows that
components about longitudinal phase after the injection. the inverse relationship between the two is established.
032802-11XU, LENG, ZHOU, GAO, CHEN, and CAO PHYS. REV. ACCEL. BEAMS 24, 032802 (2021)
2
enough to extract the phase. When the sampling frequency
measurement uncertainty (ps) 1 of the oscilloscope drops to 5 GHz, the number of effective
correlation coefficient
1.5 points oscilloscope capture is 5 at a time. The result
of correlation coefficient in this case is shown in
uncertainty
1 correlation ceofficient 0.995 Fig. 24. It can be seen that at this time, the “1” peak of
correlation coefficient with different LUTs is not sharp,
and even appears as double peaks. It is fatal to the vector-
0.5 comparison-method which will cause larger measurement
0.99 error, and even find a completely wrong matching result.
0 According to our research, for a bipolar pulse signal, 8 or
0 100 200 300 400 500 600 more data points are necessary.
bunch charge (pC)
VII. APPLICATION PROSPECTS
FIG. 23. The relationship between the measurement uncertainty
and correlation coefficient with different charge. Pearson correlation For BI engineers, comprehensive and multidimensional
coefficient of measurement uncertainty and correlation coefficient is monitoring of beam state is the main goal. For physicists,
about 0.95. single bunch is a basic unit for physics study. Parameters
of individual bunch is more meaningful than average
the measurement of the longitudinal phase is almost values. The bunch-by-bunch three-dimensional position
absolute (based on the timing system in the oscilloscope). and charge measurement system will be an important
However, the data acquisition phase and the bunch are not tool for physicists to study relativistic particles and high-
synchronized, which puts forward higher requirements on energy physics. For example, during the injection transient,
the extracting algorithm. We developed a vector-comparison- the fusion process of the injected bunch and the stored
method based on correlation coefficient to solve it by bunch can be observed with a high refresh rate. The
comparing the data acquired every time when the bunch system recommended in this paper has such capabilities.
passes BPM with the response function of the bunch. Therefore, a high repetition rate, accurate bunch-by-bunch
correlation coefficient represents the cosine of the angle three-dimensional position and charge measurement sys-
between two vectors (bunch data and the response function). tem has broad application prospects.
When correlation coefficient is closer to 1, the two vectors For 3D position and beam charge measurement, turn-by-
are closer together. Therefore, correlation coefficient can be turn transverse and longitudinal position can be obtained;
used to characterize the error. The result of experiment is combined with position measurement, position dependence
shown in Fig. 23. of BPM sum signal can be evaluated, then the accuracy of
In our experiment, the oscilloscope can capture 20 points beam charge monitor will be improved; for beam current
when the bunch passes through the BPM each time. 10 of measurement, refresh rate can reach to a few microseconds,
them are large enough to be effective. It can be seen from which is far better than dc current transformer (DCCT), it is
Fig. 5 that correlation coefficient has the sharp peak around able to locate the occurrence of beam loss more accurately.
1 with the different LUTs. When the sampling frequency of In addition, there are some other accelerator parameters that
the oscilloscope is not high enough, the data will not be can also be measured: the instantaneous rf frequency of the
accelerator can be obtained while calculating the longi-
tudinal phase, because the system works at the internal
clock; beam orbit, dispersion function, chromaticity and
other parameters can theoretically be calculated in real time
[61,62]. In the future, we also plan to use machine learning
algorithms to extract these parameters from the bunch-by-
bunch information.
As a user facility, to provide more stable synchrotron
radiation is the main task. Therefore, it is very important to
find the cause of instability, The bunch-by-bunch three-
dimensional position and charge measurement system
provides the possibility of accurate three-dimensional
correction of each bunch. Wakefield is one the main source
[63–65]. For longitudinal wakefield measurement, by
averaging the bunch-by-bunch longitudinal phase of each
FIG. 24. The relationship between correlation coefficient and turn, the longitudinal equilibrium phase (acceleration phase
index of LUT with 5 GHz sampling frequency (only 5 valid to high frequency system) of each bunch can be obtained.
points). By establishing a mathematical model, the longitudinal
032802-12BUNCH-BY-BUNCH THREE-DIMENSIONAL … PHYS. REV. ACCEL. BEAMS 24, 032802 (2021)
wakefield function can be solved. This helps us optimize bunch-by-bunch information extraction method on other
the filling pattern and reduce longitudinal instability. For devices has been studied. When the data acquisition
transverse wakefield, the injection process is a good equipment is suitable, this method is very versatile for
opportunity to calculate it. During injection, bunches will various ring accelerators.
deviate from the equilibrium orbit with the action of kicker. The bunch-by-bunch three-dimensional position and
Later, the transverse position oscillation is affected by the charge measurement system has broad application pros-
magnet and transverse wakefield. Therefore, we can cal- pects. Next step, based on this, an in-situ wakefield
culate the transverse wakefield function with the bunch-by- extraction system is planned to be established. In addition,
bunch transverse position. Actually, establishing an in-situ in order to optimize the injector, the bunch-by-bunch
wakefield extraction system based on bunch-by-bunch parameters during the injection process will be extracted.
measurement is the next step SSRF BI group is committed These studies will allow us to understand and optimize the
to do. The injection process as another source of beam beam instability.
instability is the focus of research. Using the bunch-by- As a price to improve accuracy, the algorithm of this
bunch measurement system, important parameters of the system is more complicated than others and requires a lot of
injection process can be measured by separating the computing resources at the software level. For this reason,
response functions of the stored bunch and the injected we tried to use the GPU as a part of the computing unit.
bunch. We can use parameters to optimize the state of the In the future, we also plan to use machine learning
injector to make the beam more stable. Using these algorithms to extract parameters from the bunch-by-bunch
parameters, the injector can be optimized to reduce beam information.
instability. The bunch-by-bunch feedback system is the
main tool to reduce beam instability and correct bunch
deviation. ACKNOWLEDGMENTS
This work was supported by Ten Thousand Talent
VIII. CONCLUSION Program and National Natural Science Foundation of
China (No. 11575282) and Chinese Academy of
The bunch-by-bunch three-dimensional position and
charge measurement has been completed at SSRF. With Sciences Key Technology Talent Program.
broadband oscilloscope which has high sampling rate, four
channels and large memory capacity, the raw data of BPM
signal was obtained. We have developed a set of algorithms
based on correlation-coefficient to extract bunch-by-bunch [1] G. Yang, Y. Leng, R. Yuan, and Y. Yan, Beam instabilities
information from the waveform. The measurement uncer- based on spectrum of turn-by-turn position, High Power
tainty of longitudinal phase is less than 0.2 ps, the Laser Part. Beams 23, 110842 (2011), http://www.hplpb
uncertainty of transverse position is less than 10 μm and .com.cn/en/article/id/5393.
the charge uncertainty is 1.6 pC at 600 pC bunch charge [2] H. Tanaka et al., Trends and challenges in the future
in SSRF. storage ring light sources, in Proc. of ICFA Advanced
This is the first time to propose a technology that Beam Dynamics Workshop (FLS’18) (JACoW, Geneva,
can continuously and synchronously measure the three- 2018).
dimensional position and charge of all bunches in the [3] Z. Duan et al., Survey of injection schemes for next-
generation light source rings, in Proc. of ICFA Advanced
storage ring on every turn. With unified hardware and
Beam Dynamics Workshop (FLS’18) (JACoW, Geneva,
processing software modules, the bunch-by-bunch process- 2018).
ing system in this paper can synchronously output its three- [4] C. Steier, A. Allézy, A. Anders, K. Baptiste, E. Buice, K.
dimensional position and charge each time the bunch Chow, G. Cutler, S. De Santis, R. Donahue, D. Filippetto
passes through the BPM pick-up. For the longitudinal et al., Status of the conceptual design of als-u, in 9th Int.
phase, the measurement uncertainty is reduced by one to Particle Accelerator Conf.(IPAC’18), Vancouver, BC,
two orders of magnitude compared with the existing Canada, April 29-May 4, 2018 (JACOW Publishing,
methods. For the charge measurement, compared to the Geneva, Switzerland, 2018), pp. 4134–4137.
previous similar work, the measurement uncertainty is [5] Y. Zhou, Z. Chen, B. Gao, N. Zhang, and Y. Leng, Bunch-
reduced to about one-third at the same repetition frequency. by-bunch phase study of the transient state during injec-
tion, Nucl. Instrum. Methods Phys. Res., Sect. A 955,
For the transverse position measurement, under the same
163273 (2020).
conditions, the uncertainty of this system is not inferior to [6] Y. Wang and Z. Liu, Nsrl transformation of beam position
other common systems before. monitoring system for electron storage ring and closed-
This bunch-by-bunch measurement system can work in track measurement, Journal of University of Science and
the regular operation mode of the synchrotron radiation Technology of China 28, 732 (1998).
accelerator, so as to realize the synchronous extraction [7] P. Castro, Applications of the 1000-turns orbit measure-
of the parameters of each bunch. The feasibility of this ment system at lep, in Proceedings of the 1999 Particle
032802-13XU, LENG, ZHOU, GAO, CHEN, and CAO PHYS. REV. ACCEL. BEAMS 24, 032802 (2021)
Accelerator Conference (Cat. No.99CH36366), Vol. 1 ator Conference (JACOW, Melbourne, Australia, 2019),
(IEEE, New York, 1999), pp. 456–460, Vol. 1. pp. 2625–2628.
[8] H. Chen, J. Chen, B. Gao, and Y. Leng, Bunch-by-bunch [22] X. Xu, Y. Zhou, and Y. Leng, Machine learning based
beam size measurement during injection at Shanghai image processing technology application in bunch longi-
synchrotron radiation facility, Nucl. Sci. Tech. 29, 79 tudinal phase information extraction, Phys. Rev. Accel.
(2018). Beams 23, 032805 (2020).
[9] G. Kotzian, D. Valuch, and W. Höfle, Sensitivity of the [23] K. K. T. Nakamura, S. Dat, and T. Ohshima, Transverse
LHC transverse feedback system to intra-bunch motion, bunch-by-bunch feedback system for the spring-8 storage
Proceedings of IPAC2017, Copenhagen, Denmark (JA- ring, in Proceedings of the 9th European Particle Accel-
CoW, Geneva, Switzerland, 2017). erator Conference, Lucerne, 2004 (EPS-AG, Lucerne,
[10] G. Kotzian et al., Transverse feedback parameter extraction 2004) [http://accelconf.web.cern.ch/AccelConf/e04/].
from excitation data, in 8th Int. Particle Accelerator [24] V. Poucki, P. Lemut, M. Oblak, and T. Karcnik, Combating
Conf.(IPAC’17), Copenhagen, Denmark, 14–19 May, multibunch instabilities with the libera bunch-by-bunch
2017 (JACOW, Geneva, Switzerland, 2017), pp. 1920– unit, in Proceedings of the 11th European Particle Accel-
1923. erator Conference, Genoa, 2008 (EPS-AG, Genoa, Italy,
[11] N. B. Kraljevic, P. Burrows, R. Ramjiawan, D. Bett, G. 2008), p. 1251–1253.
Christian, T. Bromwich, R. Bodenstein, and C. Perry, [25] D. Teytelman, igp-120f signal processor-technical user
JACoW: Optimisation of a High-Resolution, Low-Latency manual, Dimtel Inc (2008).
Stripline Beam Position Monitor System for Use in Intra- [26] W. Barry, J. Byrd, J. Corlett, J. Johnson, G. Lambertson,
Train Feedback, Tech. Rep. (2017). and J. Fox, Commissioning of the als transverse coupled-
[12] K. Scheidt and B. Joly, Upgrade of beam phase monitors bunch feedback system, in Proceedings Particle Acceler-
for the esrf injector and storage ring, Proceedings of ator Conference (IEEE, New York, 1995), Vol. 4,
IBIC2013, Oxford, UK, 757 (2013), http://accelconf.web pp. 2423–2425.
.cern.ch/IBIC2013/papers/wepc33.pdf. [27] W. Barry, J. Byrd, J. Corlett, M. Fahmie, J. Johnson, G.
[13] R. H. A. Farias, L. Lin, A. R. D. Rodrigues, P. F. Tavares, Lambertson, M. Nyman, J. Fox, and D. Teytelman, Design
and A. Hofmann, Oscilloscope measurement of the syn- of the pep-ii transverse coupled-bunch feedback system,
chronous phase shift in an electron storage ring, Phys. Rev. in Proceedings Particle Accelerator Conference (IEEE,
Accel. Beams 4, 072801 (2001). New York, 1995), Vol. 4, pp. 2681–2683.
[14] T. Ieiri, K. Akai, H. Fukuma, T. Kawamoto, E. Kikutani, [28] A. Drago, J. Fox, D. Teytelman, and M. Tobiyama,
and M. Tobiyama, Bunch-by-bunch measurements of the Commissioning of the igp feedback system at daϕne,
betatron tune and the synchronous phase and their appli- SLAC National Accelerator Laboratory (United States).
cations to beam dynamics at kekb, Phys. Rev. Accel. Funding organisation: US Department of Energy (United
Beams 5, 094402 (2002). States) (2011).
[15] Y. Yang, Y. Leng, Y. Yan, and N. Zhang, Bunch-by- [29] M. Höner, A. Nowaczyk, M. Bakr, H. Huck, S. Khan, R.
bunch beam position and charge monitor based on broad- Molo, A. Schick, P. Ungelenk, and M. Zeinalzadeh,
band scope in ssrf, Proceedings of IPAC2013, Shanghai, Bunch-by-bunch feedback systems at the delta storage
China (2013), pp. 595–597, http://accelconf.web.cern.ch/ ring, in Proc. 3rd Int. Particle Accelerator Conf (JACoW,
IPAC2013/papers/mopme054.pdf. Geneva, 2012).
[16] Y. Yang, Y.-B. Leng, Y.-B. Yan, and Z.-C. Chen, Injection [30] C. Kuo, K. Hu, Y. Cheng, P. Chiu, Y. Chen, and K.
performance evaluation for SSRF storage ring, Chin. Phys. Hsu, New bunch-by-bunch feedback system for the tls,
C 39, 097003 (2015). in Proceedings of DIPAC2011, Hamburg, Germany
[17] L. Duan, Y. Leng, R. Yuan, and Z. Chen, Injection transient (1995), http://accelconf.web.cern.ch/DIPAC2011/papers/
study using a two-frequency bunch length measurement tupd23.pdf.
system at the SSRF, Nucl. Sci. Tech. 28, 93 (2017). [31] Operational status of the transverse multibunch feedback
[18] Z. Chen, Y. Yang, Y. Leng, and R. Yuan, Wakefield system at diamond.
measurement using principal component analysis on [32] E. Huttel, N. Hiller, V. Judin, B. Kehrer, S. Marsching, A.
bunch-by-bunch information during transient state of Müller, and N. Smale, Characterization and stabilization of
injection in a storage ring, Phys. Rev. Accel. Beams 17, multi-bunch instabilities at the anka storage ring, in 3rd Int.
112803 (2014). Particle Accelerator Conf.(IPAC’12), New Orleans, Loui-
[19] H. Chen, J. Chen, B. Gao, L. Lai, Y. Leng, and N. Zhang, A siana, USA (JACoW, Geneva, 2012).
fast beam size diagnostic system using high-speed photo- [33] L. M. Y. F. S. L. W. J. Yue, J. S. Cao, and X. Y. Zhao,
multiplier array at ssrf, in 8th Int. Particle Accelerator Longitudinal and transverse feedback systems for the
Conf.(IPAC’17), Copenhagen, Denmark, 14–19 May, bepcii storage rings, in Proceedings of IBIC2013, Oxford,
2017 (JACOW, Geneva, Switzerland, 2017), pp. 345–348. UK (2013), pp. 373–375, http://accelconf.web.cern.ch/
[20] Y. Zhou, H. Chen, S. Cao, and Y. Leng, Bunch-by-bunch IBIC2013/papers/tupc09.pdf.
longitudinal phase monitor at SSRF, Nucl. Sci. Tech. 29, [34] W. Li, Development of digital bunch-by-bunch feedback
113 (2018). system for storage ring HLS II, Ph.D. thesis, USTC (2014).
[21] X. Xu, Y. Leng, and Y. Zhou, Machine learning appli- [35] J. Lee, M. H. Chun, G.-J. Kim, D.-C. Shin, D.-T. Kim, and
cation in bunch longitudinal phase measurement, in S. Shin, Bunch-by-bunch position measurement and analy-
Proceedings of the 10th International Particle Acceler- sis at PLS-II, J. Synchrotron Radiat. 24, 163 (2017).
032802-14You can also read