Discriminating Divergent/Convergent Phases of Meeting Using Non-Verbal Speech Patterns
←
→
Page content transcription
If your browser does not render page correctly, please read the page content below
S. Bødker, N. O. Bouvin, W. Lutters ,V. Wulf and L. Ciolfi (eds.)
 ECSCW 2011: Proceedings of the 12th European Conference on Computer Supported Cooperative Work,
 24-28 September 2011, Aarhus, Denmark
 © Springer 2011

Discriminating Divergent/Convergent
Phases of Meeting Using Non-Verbal
Speech Patterns
Junko Ichino
University of Electro-Communications
ichino@is.uec.ac.jp

Abstract. The goal of this paper is to focus on non-verbal speech information during
meeting and see if this information contains cues enabling the discrimination of meeting
phases—divergent and convergent phases using decision trees. Group task experiments
were conducted using a modified 20Q. The recorded speech was analyzed to identify
various utterance pattern features—utterance frequency, length of utterance, turn-taking
pattern frequency, etc. Discrimination trials were conducted on groups of friends, groups
of strangers, and on both groups together using these features, and discrimination
accuracy rates were obtained of 77.3%, 85.2% and 77.3%, respectively, in open tests.
These results are quite good, considering that they are based on non-verbal speech
information alone. Among the features relating to utterance patterns used in this work, we
found that silence frequency and quasi-overlapping frequency were especially effective
for discrimination. Our results did not find that group friendliness or task difficulty
information contributed to effective discrimination of the meeting phases.

Introduction
There are typically two most basic phases, a divergent phase and a convergent
phase in idea generation meetings or problem solving meetings that are the focus
on this study. In a divergent phase, issues and ideas are brought to light. In a
convergent phase, the issues and ideas are sorted and classified, and solutions are
considered and prioritized (Guilford, 1983; Levine et al., 2004). It is important to
keep these two phases, which we call meeting phases in this paper, separate in

                                               153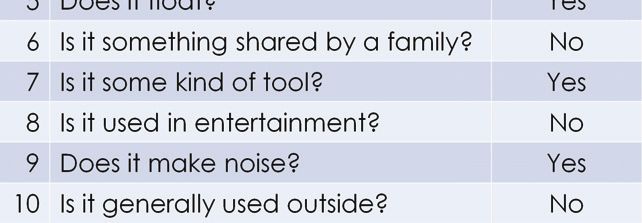
Junko Ichino

these kinds of meetings, since such meetings often contain a mix of divergent and
convergent activities. At the scene of meeting, a person who plays a role of
facilitator in the meeting has to skillfully organize people who attempt to reach a
consensus in spite of divergent phase or people who try to encourage discussion
among members in spite of convergent phase. He or she also needs to determine
the appropriate point at which a meeting transitions from the divergent phase to
the conversion phase, and vice versa (Hori, 2004). However, there is less case of
controlling meeting phases properly in actual meeting. Of course, one can hire a
facilitator or moderator, but these kinds of specialists are in high demand and
costly. Meeting support systems of the future must therefore be capable of
effective facilitation.
    Many researchers have explored methods to introduce their system into idea
generation meetings or problem solving meetings. ShrEdit work (McGuffin and
Olson, 1991) showed how intermixed the two phases of the meeting are, and
illustrated how the tools was used to support both. However, a host of other
support tools after ShrEdit have been developed that support either divergence or
convergence—for example AIDE (Nishimoto et al., 1999) and Inspiration
(Inspiration Software Inc.) provide support for divergent phase while Colab
(Stefik et al., 1987) and Gungen (Munemori et al., 1994) support convergent
phase—and the function of the two kinds of systems have very different features.
And some of our own previous work aimed at supporting both phases in a
meeting showed that certain features are only useful during one of the phases
(Ichino et al., 2009). These studies suggest that a meeting support system can
cover a whole meeting, not only one part of it, if each of these functions or
systems which help only one phase of meeting is integrated into one supporting
environment. We therefore propose that it is important to understand how to
discriminate meeting phases in real time, so that a system can switch from the
function or legacy system which supports one phase of meeting to the function or
legacy system which supports another phase, and can present information on a
current phase to facilitators and moderators.
    The goal of this paper is to focus on speech information during meeting and
see if this information contains cues enabling the discrimination of meeting
phases. Our work is dedicated to implementing such a system as described above,
with the ultimate goal of promoting collaborative work in groups. This is of
course where the automatic methods would in turn be the most useful. As a step
one in a series of investigations that would need to be carried out for the
automatic methods to be ultimately validated, here we will ignore real-time
considerations in this paper.
    It is well known that in human-to-human communication, non-verbal
information plays a major role alongside verbal information in expressing the
intent of the speaker (Mahl, 1956). If one observes the dialog of actual meetings,
it is apparent that meeting phases are not just manifested by the verbal content or

                                        154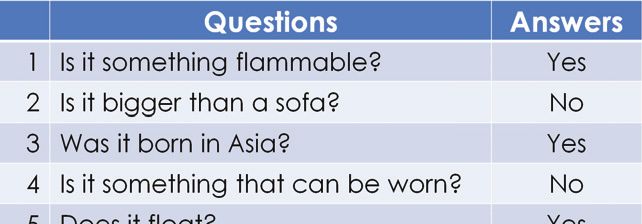
Discriminating Divergent/Convergent Phases of Meeting Using Non-Verbal Speech Patterns

the context, but by conversational tempo, rhythm, pauses before and after speech,
turn-taking, and a host of other subtle expressive changes in the conversation. In
other words, the information enabling one to discriminate meeting phases is often
manifested in the form of non-verbal speech information. Non-verbal speech
information we will analyze in this paper include length of utterance, switching
pauses between speakers, turn-taking pattern frequency, and other utterance
patterns. In order to link these utterance patterns and meeting phases, we will
develop a decision tree supervised learning approach for discriminating divergent
versus convergent phases of meetings.

Related work
Computer scientists have been analyzing how meetings and discussions are
structured and investigating how this information might be shared and stored for
years. Progress has been made in structuring and visualizing statements and
descriptive content (e.g., Amitani et al., 2005) and in managing argument design
intent and design rationale for the development of software design (e.g., Conklin
et al., 1988). In these studies, conversation is modeled and structured as an aspect
of knowledge based on verbal speech information, then communication is
supported based on the model. Due to the technological challenge of analyzing
conversational structures in real time, this approach has not been applied to the
real-time support of meetings. It has also become apparent that, for correctly
understanding the meaning of speech and actions in natural human-to-human
communication, it is not enough to just to understand verbal information and
other symbolic messages. Non-verbal information is equally important.
   Based on this fundamental insight, there has been an upsurge in recent research
across a number of different fields exploring the relationship between human
dialog communication and non-verbal speech information. In the areas of CSCW
and groupware, a number of studies have been done to implement computer-based
real-time support for meetings using mostly non-verbal speech information. For
example, DiMicco et al. (2007) and Ichino et al. (2009) have proposed schemes
that detect the speech time of participants, then present a visualization of the
results on a shared display. Another approach called Conversation Clock uses
variations in speech energy or volume to display the interaction history of
participants as social cues on a table display (Bergstrom et al., 2007). Meeting
Mediator is another scheme that seeks to enhance group collaboration patterns by
dividing meetings into brainstorming and problem-solving phases, then
visualizing group dynamics using speech features (speaking length and speaking
energy) and physical movement (Kim et al., 2008; Olguin et al., 2009). The goal
of most of these systems is to exploit group dynamics feedback to enhance group
satisfaction and performance (Smith et al., 1959), and to develop ways of
measuring group dynamics using speech and providing persuasive feedback.

                                                155
Junko Ichino
And this approach is not just confined to CSCW and groupware. Studies of
non-verbal information in dialog have been applied in discourse analysis, social
psychology, Japanese language education, and other areas as well. Osuga et al.
developed a scheme for discriminating whether a speaker would yield his turn or
continue speaking based on decision tree learning using dialog prosodic features
(basic frequency (F0), power, duration, etc.) alone (Ohsuga et al., 2006). Nagaoka
et al. (2003) compared cooperative dialog with non-cooperative dialog, and found
that in the former, speakers tend to observe the same temporal speech patterns
(duration and switching pauses) and backchannel responses. A number of
different researches including Wrede et al. (2003) and Cetin et al. (2006) analyzed
the prosodic information in human-human dialogs, and found that the prosody and
overlapping speech of speakers were closely related to dialog hotspots. Most of
these conversational studies have involved just two people (dialogs), but recently
we have seen a growing number of studies involving multi-party conversations.
For example, Chang et al. analyzed how frequently participants chimed in and
prosodic features of poster session conversations, and found that with this
information alone, they could predict the points in the presentation that were most
interesting and most concerned the listeners (Chang et al., 2008). Bono et al.
(2004) also studied multi-party conversations at a poster exhibit presentation, and
discovered they could estimate the interest of the listeners from their interaction
behavior: standing position, sojourn time, gazing distribution, and the like.
All this work demonstrates the importance of non-verbal information, and the
effectiveness of non-verbal speech information for supporting dialog. Yet none of
this research analyzing dialog speech has focused on discriminating divergent and
convergent phases of meetings. It is generally thought that the discrimination of
meeting phases calls for human judgment based on an assortment of different
information: knowledge of conversational context and background, shared beliefs
of the group members, gestures and eye-gaze information, and so on.
Implementing a system that could support such discrimination functionality would
require very advanced processing capability. Not to mention the fact that
background knowledge and shared belief are highly speaker and task dependent,
and would therefore be very difficult to generalize. In this regard, non-verbal
speech information would certainly offer a significant advantage, for non-verbal
information can be readily input and processed right on the spot, and thus could
be used to implement a wide range of different systems.
Divergent and convergent phase meeting experiments
Experimental Design and Hypotheses
Focusing on divergent and convergent phases of meetings, our goal was to see if
there were any clear discernable differences in the non-verbal speech information
156Discriminating Divergent/Convergent Phases of Meeting Using Non-Verbal Speech Patterns
among group members between the two phases.
Non-verbal speech information is broadly classified into two categories:
acoustic phonetic attributes such as volume, pitch, speed, accent, and so on, and
temporal patterns such as pauses and utterance timing (Daibo, 1998). In a
previous study by one of the authors involving brainstorming and problem-solving
meeting experiments (Ichino et al., 2009), different temporal utterance patterns
were observed for divergent and convergent phases of meetings. In this work,
therefore, we will focus on the latter utterance patterns.
H1. Utterance pattern information will contribute to discriminate the divergent
and convergent phases of meetings.
In actual real-world meetings, sometimes all the members will know one
another such as a typical office meetings, and sometimes the participants will be
meeting one another for the first time such as a meeting with new clients. We
know that the way people converse varies considerably in terms of eye-contact,
posture, whispering, doing things at the same time, and so on, depending on
whether they know the other people or not (Nakai, 2006). In terms of the utterance
patterns we are interested in, we speculate that meeting with friends or strangers
would be manifested in various differences: for example, we would expect the
speech tempo to be somewhat faster if the group members are on friendly terms
and the timing and pauses when starting to speak might be different between
meeting with friends and meeting with strangers. Assuming significant differences
between meeting with friends as opposed to strangers, the structural approach we
describe in the later section of dividing the groups using a classifier (decision tree)
should provide a good way of judging, and here we assess the potential utility of
this approach.
H2. There will be some differences between meeting with friends and strangers
in utterance pattern information of each meeting phase.
In addition, the difficulty of issues to be solved in real meetings also varies
widely. This suggests that the difficulty of the issue could affect the behavior and
the performance of the group members (Wilson et al., 2004). Compared to
simpler problems, if issues are harder to deal with, members would have to think
about them longer, which presumably would prolong the discussion and have
other effects on utterance patterns. Just as we observed earlier regarding
friendliness of group members, here again we will test whether using a classifier
to divide the meetings in terms of task difficulty works well or not.
H3. There will be some differences between task difficulties in utterance
pattern information of each meeting phase.
The experimental factors outlined above are summarized in Table I: two
meeting phases X two levels of group friendliness X two task difficulties. We
157Junko Ichino
analyzed the group friendliness as between-subjects factors and the meeting phase
and task difficulty as a within-subject factor. We conducted the Twenty Questions
experimental sessions simulating how real meetings deal with above experimental
factors, and extracted non-verbal speech information.
Level
Factor Code
1 2
Meeting phase P Divergent (Pd) Convergent (Pc)
Group friendliness G Friend (Gf) Stranger (Gs)
Task difficulty T Easy (Te) Hard (Th)
Table I. Experimental factors.
Tasks
To create a simulating situation in which divergent and convergent phases might
occur naturally in a meeting environment, we conducted a series of meeting
experiments based on a modified version of the game Twenty Questions that
involved groups of four participants.
In the traditional game of Twenty Questions (20Q), one player is chosen to be
the Answerer, and that person chooses a subject but does not reveal this to the
others. The other players than take turns by asking up to 20 questions that can be
answered either 'yes' or 'no' to guess the subject. It have been regarded that it is
difficult to control the difficulty of the task (Tailor et al., 1952), but in 20Q, the
difficulty of the task can be manipulated by altering the obscurity of the word that
the others have to guess.
For the purposes of our experiments, we modified 20Q by dividing it into two
parts—first half and second half of the game—so that both divergent and
convergent meeting phases would emerge in the game. Note that this modification
of 20Q is the same as that used by Wilson (2004) and Kim et al. (2008; 2009) in
their studies assessing two meeting phases of brainstorming and problem-solving.
The first half of the game corresponds to the divergent brainstorming phase, while
the second half corresponds to the problem-solving convergent phase. Answers
are considered and given by the group. In the divergent phase in the first half of
the game, the Answerer provides the group with a set of ten yes/no condition pairs
(Figure 1). The group then brainstorms to come up with the greatest number of
items satisfying the ten conditions. Then in the convergence phase in the second
half of the game, the group tries to name the object that the Answerer has in mind
by asking up to ten questions in addition to the ten conditions provided in the first
phase. The group strategizes and discusses with the goal of coming up with the
correct answer with the fewest number of questions. The group asks the Answerer
yes/no questions, and the Answerer responds with a simple yes or no.
The difficulty of the task can be readily manipulated by varying how hard it is
to recall the answers. Here we used "number of Google hits" as a rough indicator
of difficulty, and extracted multiple terms at random assuming these terms with
158Discriminating Divergent/Convergent Phases of Meeting Using Non-Verbal Speech Patterns
relatively few hits would be harder and terms with many hits would be easier to
recall. Finally, each term was selected after two experimenters conferred and
agreed.
Subjects
We recruited 40 male and female subjects ranging in age from 20 to 40 years old
from the general public. Twenty of the subjects already knew each other. The
subjects were arranged into ten groups of four subjects each, five groups were
composed of friends (Gf) and the other five groups were made up of strangers (Gs).
Each group consisted of two men and two women to maintain a gender balance.
The experiment took approximately two hours, and the subjects were paid for
their participation.
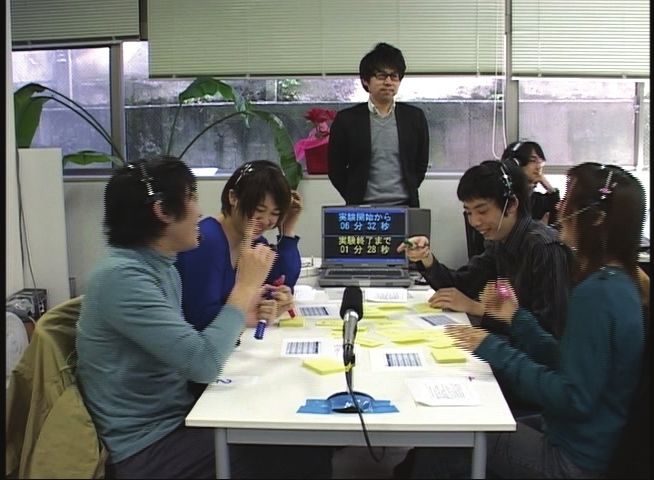
Experimental Setup
Each experiment involved a group of four who worked together in solving
problems. The four participants sat at a rectangular table, two across from each
other (Figure 2). During the experiment, each of the subjects wore a headset
microphone (Shure SM10A-CN). Each participant was also provided with a pen
and was encouraged to jot information down on post-it notes that were provided.
Each session was recorded using a video camera placed at an angle where it could
capture all movement, and all speech and non-verbal sounds from the subjects
were recorded.
Experimental Procedure
Before starting the experiments, we explained the rules of the game to groups of
subjects and had them play one practice game. Then after a short break, the
groups started working on the games. There were ten test groups, five made up of
friends (Gf) and the remaining five consisting of strangers (Gs). Each group had
two hours, enough time for two to three games (not counting the practice game).
In order to counterbalance the task difficulty order effect, the ten groups are
divided into two sets. One set did the experiments in the order Te→Th (→Te), while
the other set did the experiments in the opposite order Th→Te (→Th).
As we observed earlier in the tasks subsection, each game was divided into two
parts: the first half of the game was the divergent phase for brainstorming (Pd) and
the second half of the game was the convergent phase for problem solving (Pc).
The divergent phase time was fixed at eight minutes. For the convergent phase,
groups are given ten minutes at the beginning of a game, but if they got the correct
answer before the ten minutes was up, the game was ended. If a group could not
figure out the correct answer within ten minutes, the game is extended up to 15
minutes. Group members could direct questions to the Answerer at any time
159Junko Ichino
during the convergent phase. While the experiment was in progress, subjects were
free to jot down any potential answers conceived by the group, any potential
questions conceived by the group, or any answers provided by the Answerer in
response to questions on a sticky note.
Answerer
PC display showing
processing time and
remaining time
Headset microphone
10 yes/no questions
and answers
Post-its
Figure 1. Typical set of ten yes/no Figure 2. Experimental setup.
question-and-answer pairs distributed in
the divergent phase of Twenty-Questions.
Method of analysis
In this work, we developed a procedure of discriminating the divergent phase
from the convergent phase of meetings based on utterance pattern-related
information using statistical decision tree learning. We then compared groups of
friends versus strangers, then further subdivided those groups to deal with easy
versus hard tasks, to assess the ability of these different parameters to discriminate
divergent versus convergent phases.
Audio Data
For audio data, we used the conversational speech recorded for a total of 22
games in the meeting experiments described in the previous section. We analyzed
only the conversation among 4 group members while they participated in the 20Q
game sessions. The conversation with the Answerer, which means the members'
questions to the Answerer and the Answerer's responses, were excluded in the
analysis.
Units of Analysis
Various units have been proposed for analyzing utterances (Bono et al., 2007).
With the idea of constructing a real-time meeting support system, here we adopted
the inter-pausal unit (IPU) as an objectively definable silence bound unit, and
following (Koiso et al., 1998) we define an IPU as a sequence of speech bounded
by silence longer than 100 ms. After semi-automatically deriving silence intervals
based on speech volume, we verify and correct the results manually, and divide
into IPUs.
160Discriminating Divergent/Convergent Phases of Meeting Using Non-Verbal Speech Patterns
Utterance Pattern Features
There are five utterance pattern features used for discrimination in the work. Here
the (a) utterance frequency is the number of utterances (i.e., number of IPUs) per
minute of elapsed phase time; (b) ratio of overlap speech time (%) is the
proportion of time (%) member m speaks when another member is speaking (IPU)
during total elapsed phase time; (c) length of utterance is the average time length
of each IPU (ms) spoken by member m during a phase; (d) switching pause is the
average interval (ms) during a phase for member m to begin speaking after
another member has finished speaking (IPU) (if a speaker begins speaking before
the previous speaker has finished, that is not included); and (e) frequency of
different types speaker transition is the number of transitions to another speaker
when member m is speaking during total elapsed phase time (min). In terms of
contiguous IPUs, here we follow (Horiuchi et al., 1997; Koiso et al., 2000) in
defining the types of transitions between speakers' utterances based on the speaker
of each IPU and the temporal relationship into the five categories shown in Table
II.
Silence After the previous IPU by m or other member is finished, member m begin the next IPU
after a long pause exceeding 1,700 ms.
Continuation After the previous IPU by member m is finished, member m starts the next IPU after a
pause of less than 1,700 ms.
Switching After the previous IPU by some member other than m is finished, member m starts the next
IPU after a pause of less than 1,700 ms.
Quasi‐overlap Just before (less than 200 ms) the previous IPU by a member other than m is finished,
member m starts the next IPU.
Overlap During the previous IPU by some member other than m, member m starts the next IPU and
both IPUs continue simultaneously for longer then 200 ms (including cases where the two
IPUs are not contiguous).
Table II. Types of speaker transitions.
Discrimination Results and Analysis
Samples and Discrimination Method
Using features from all subjects extracted from a total of 176 speakers
participating in 44 phases of 22 games of 20Q (see Table III) conducted in the
meeting experiments described above, we carried out experiments to see if we
could discriminate the divergent and convergent phases of meetings.
We employed statistical decision tree learning to discriminate the meeting
phases. A decision tree is a tool for helping you to choose between several courses
of action. It provides a structure within which you can lay out options and
investigates the possible outcomes of choosing those options. A general measure
for evaluating of decision tree learning is the discrimination accuracy of the
decision trees. We created decision trees for closed data (closed test) and open
data (open test). The "closed test" is used to conduct evaluations using a dataset
that was used to construct the decision tree, while the "open test" is used to
161Junko Ichino
Number of phases Number of Number of Number of
Group Task Meeting phase (groups) assumed phases (groups) peoples
friendliness difficulty for meeting classified by per group samples
experiment arbiters
Total 44 44 176
Friends 22 22 88
(Gf) Easy (Te) 12 12 48
Divergent (Pd) 6 6 * 4 = 24
Convergent (Pc) 6 6 * 4 = 24
Hard (Th) 10 10 40
Divergent (Pd) 5 7 * 4 = 28
Convergent (Pc) 5 3 * 4 = 12
Strangers 22 20 88
(Gs) Easy (Te) 12 10 48
Divergent (Pd) 6 7 * 4 = 28
Convergent (Pc) 6 5 * 4 = 20
Hard (Th) 10 10 40
Divergent (Pd) 5 9 * 4 = 36
Convergent (Pc) 5 1 * 4 = 4
Table III. Number of samples used in discrimination experiment.
conduct evaluations using a dataset that was not used to create the tree. We used
decision tree learning not only for its discrimination accuracy but also because we
required a simple way to explain the discrimination results. We used C4.5 for the
learning tree algorithm (Quinlan, 1992).
Supervised data is required to conduct discrimination experiments using
decision tree learning. In the meeting experiment described in the previous section,
we assume that the brainstorming task in the first half of the meeting corresponds
to the divergent phase while the problem-solving task in the latter half of the
meeting corresponds to the convergent phase. Three raters were used to determine
which phase the brainstorming and problem-solving tasks actually belonged to.
First, we asked the raters to independently classify 44 tasks as either divergent or
convergent while they watched a video with sound of all the groups in action. The
raters were instructed to make their decisions based on the criteria that the
"divergent phase is when all sorts of possibilities are explored through free
association to ideas" while the "convergent phase is when opinions are
consolidated to achieve tangible results" (Hori, 2004). The arbiters were next
asked to make a final decision as to which tasks were divergent and which were
convergent based on majority rule. As a result, all 22 of the brainstorming tasks
from the first phase were classified as divergent. Of the 22 problem-solving tasks
from the second phase, 15 were classified as convergent while 7 were classified as
divergent. These convergent or divergent results as determined by the arbiters was
added to the data of the four subjects who conducted the tasks, and this was used
as the supervisory data. Table III summarizes the number of samples used in the
experiments.
Verifying Appropriateness of Task Difficulty Settings
After the meeting experiments were completed, we analyzed the task performance
of the groups during the second half of the game to verify the appropriateness of
task difficulty settings. Performance was measured using three criteria: (1) the
162Discriminating Divergent/Convergent Phases of Meeting Using Non-Verbal Speech Patterns
number of questions the group asked the Answerer (number of questions), (2)
whether the group had enough time to get the correct answer (answer time), and
(3) the proportion of groups that figured out the Answerer's term within the time
limit (15 minutes) (accuracy rate). Figure 3 shows means and standard errors for
the three performance criteria. A two-way ANOVA (analysis of variance) based
on 2 (group friendliness G: Gf • Gs) X 2 (task difficulty T: Te • Th) revealed that
the task difficulty T main effect was significant for all three criteria. Compared to
hard tasks (Th), easy tasks (Te) were found to require (1) fewer questions (Te: 2.1
question vs. Th: 4.8 questions, F (1,18) =6.707, p = .019), (2) shorter answer
periods (Te: 4.2 minutes vs. Th: 9.7 minutes, F (1,18) = 5.488, p = .031), and
yielded (3) higher accuracy rates (Te: 91.7% vs. Th: 50.0%, F(1,18) = 5.272, p
= .034). Moreover, it was found that group friendliness G main effect and
interaction G X T were not significant for all three criteria. These results show
that the task difficulty and the task performance during second half of the game
were proportionate, thus indicating that the task difficulty was set more or less
correctly.
(1) Number of questions (2) Answer time (3) Accuracy rate
(No.) (Mins.) (%)
7 16 100
6 14
80
5 12
10 60
4
8
Easy
3
Easy
6 40
2 4
Hard
Hard
Easy
20
Hard
Hard
Hard
Hard
Easy
Easy
Easy
1 2
0 0 0
Friends Strangers Friends Strangers Friends Strangers
Figure 3. Task performance in the latter half of the game. Groups were made up
either friends (Gf) or strangers (Gs), and given tasks that were either easy (Te) or
hard (Th).
Results
First we present discrimination results using data for all subjects and
discrimination results based on data for groups of friends and groups of strangers.
Next we present discrimination results for groups of friends and strangers, further
broken out in terms of task difficulty.
Discrimination results: data for all subjects and classified according to friend
versus stranger
Table IV shows the divergent (Pd) / convergent (Pc) discrimination results based
on decision trees constructed for each condition. The first tier shows the decision
tree results for all subjects data, the second tier shows the results for just the
subjects who are friends (Gf), and the fifth tier shows the decision tree results for
the subjects who are strangers (Gs) data. One can see that in the closed test, the
discrimination rate results are over 90% for all subjects and for strangers (Gs),
163Junko Ichino
Group friendliness Task difficulty Closed test Open test
All subjects 92.0% 77.3%
Friends (Gf) 84.1% 77.3%
Easy (Gf X Te) 85.4% 75.0%
Hard (Gf X Th) 92.5% 70.0%
Strangers (Gs) 92.0% 85.2%
Easy (Gs X Te) 89.6% 62.5%
Hard (Gs X Th) 97.5% 95.0%
Table IV. Divergent (Pd) / convergent (Pc) discrimination rates.
which is approximately 8 points higher than the results for friends (Gf). Yet in the
open test, the discrimination rate at the highest was 85% for strangers, but
hovered below 80% for all subjects and the friends condition (Gf). We examined
the 14 misclassified data points in the closed test under the friends condition (Gf),
but failed to find any consistent trend.
Figure 4 shows a series of decision trees reflecting the various conditions.
Figure 4 (i) shows results of the data for the subjects who are friends (Gf), (ii)
shows the results for the subjects who are strangers, and (iii) shows the results
based on data for all subjects. For example, leaf Pc1 branching to the left from the
highest node reveals that 19 data points were correctly discriminated as
convergent (Pc), and of these 1 data point was misclassified as divergent (Pd).
One can see that the friends (Gf) tree in (i) has 3 leaves, 1 discriminated to be
divergent (Pd) and the other 2 discriminated to be convergent (Pc). Important
features as discrimination factors from the top are (1) silence frequency, and (2)
overlap frequency. Among the leaves, the conditions summarizing leaf Pd1 that is
discriminated as divergent (Pd) are "low frequency overlap including silence." But
at the same time, the leaf discriminated as being convergent (Pc) showing the most
data points is Pc1, with 19 points. The condition summarizing this leaf is
"absolutely no silence."
Now turning to tree (ii) for strangers (Gs), this tree has 4 leaves: 1
discriminated as divergent (Pd) and 3 discriminated as being convergent (Pc).
Important features as discrimination factors from the top are (1) quasi-overlapping
frequency, (2) quasi-overlapping frequency, and (3) switching pause. Conditions
summarizing leaf Pd2 discriminated as divergent (Pd) are "quasi-overlapping is
present, but not too frequently, and switching pauses are prolonged." On the other
hand, the leaf discriminated as convergent (Pc) yielding the most data points is Pc3,
with 10 points. The condition summarizing this leaf is "absolutely no quasi-
overlapping."
Tree (iii) for all subjects has 9 leaves: 4 discriminated as divergent (Pd) and 5
discriminated as being convergent (P c ). Here the important features as
discrimination factors from the top are (1) silence frequency, (2) quasi-
overlapping frequency, and (3) utterance frequency. The leaf discriminated as
being divergent (Pd) with the most data points is Pd4, with 94 points. The
conditions summarizing this leaf are "silence and presence of not-too-frequent
quasi-overlapping." On the other hand, the leaf discriminated as convergent (Pc)
164Discriminating Divergent/Convergent Phases of Meeting Using Non-Verbal Speech Patterns
(i) Friends (Gf) (nodes: 2, leaves: 3) (ii) Strangers (Gs) (nodes: 3, leaves: 4)
Silence frequency Quasi-overlapping frequency
=0 >0 =0 >0
Convergent(Pc1) Overlapping frequency Convergent (Pc3) Quasi-overlapping frequency
[19 / 1] ≦8.8 >8.8 [10 / 0] ≦1.7 >1.7
Divergent (Pd1) Convergent (Pc2) Switching pause Convergent (Pc4)
[62 / 12] [7 / 1] ≦448 >448 [4 / 0]
Convergent (Pc5) Divergent (Pd2)
(iii) All subjects (nodes: 8, leaves: 9) [5 / 1] [69 / 6]
Silence frequency
=0 >0
Convergent (Pc6) Quasi-overlapping frequency
[33 / 3] =0 >0
Utterance frequency Quasi-overlapping frequency
≦0.8 >0.8 ≦1.0 >1.0
Divergent (Pd3) Convergent (Pc7) Divergent (Pd4) Silence frequency
[2 / 0] [7 / 0] [94 / 8]
≦0.6 >0.6
Quasi-overlapping frequency Length of utterance
≦1.0 >1.0 =931 >931
Convergent (Pc8) Divergent (Pd5) Convergent (Pc9) Quasi-overlapping frequency
[2 / 0] [18 / 1] [12 / 2] ≦1.7 >1.7
Divergent (Pd6) Convergent (Pc10)
[6 / 0] [2 / 0]
Figure 4. Decision trees generated in the closed test.
having the most data points is Pc6, with 33 points. The condition summarizing
this leaf is "absolutely no silence."
It is apparent from the fact that quasi-overlapping frequency is selected as a
feature in leaves of the (ii) and (iii) trees that the discrimination is not monotonic.
We found from the ANOVA that quasi-overlapping frequency is less significant
in the divergent phase (Pd) than in the convergent phase (Pc) (referring to Figure 5,
0.7 times per minute for Pd versus 1.2 times per minute for the Pc. F (1,168) =
6.938, p = .009).
Discrimination results: data classified for easy versus hard tasks
Let us next examine the discrimination results shown in tiers 3-4 and 6-7 in Table
IV based on decision trees constructed to further sub classify the friends (Gf) and
strangers (Gs) subject data in terms of task difficulty. In the closed test, the
discrimination rate results were above 90% for hard tasks (Th) for groups of both
friends (Gf) and strangers (Gs), which was approximately 7-8 points higher than
for easy tasks (Te). In the open test, the discrimination rate increased by about 5
points for easy tasks (Te) in the case of friends (Gf). Turning to groups of strangers
(Gs), the discrimination rate exceeded 90% for hard tasks (Th), about a 33 point
gain over easy tasks (Te). Examining the misclassified data points for the easy
tasks (Te), it was found that most involved data for groups of subjects that
completed their easy task assignment within a relatively short period of time. It
could be that these kinds of data features are not suitable for averaging over
165Junko Ichino
relatively short periods. Here we would infer that, when tasks are differentiated on
the basis on difficulty, since data for one condition is insufficient, (see Table III),
a data session that ends after only a short period might have a large impact on the
results.
Considerations
Effectiveness of Utterance Pattern Features (H1)
Let us first consider the overall effectiveness of the various features associated
with the utterance patterns derived from the discrimination experiment results.
The discrimination results presented in Table IV suggest that it is indeed possible
to discriminate divergent and convergent phases of meetings without relying on
verbal information by using utterance patterns alone. Based on a review of the
three decision trees shown in Figure 4 (and other trees for classifying task
difficulty that are omitted from the paper), the (e) speaker transition types silence
and quasi-overlapping frequency features noted earlier played an especially
significant role in discrimination.
Relationship between meeting phases discriminated by decision trees and
observed
A cursory review of decision trees (i), (ii), and (iii) in Figure 4 will reveal that
different conversational styles pervade the divergent and convergent phases. In the
divergent phase, stretches of speech are comparatively long, and conversation
proceeds through turn-taking at moderate intervals. In convergent phases, by
contrast we would expect to see a series of comparatively short statements that are
strung together. In addition, we conducted a mixed-model analysis of variance
(ANOVA) with the random factor of subject group (S) and the fixed factors of
meeting phases (P: Pd • Pc), levels of group friendliness (G: Gf • Gs), and degrees
of task difficulty (T: Te • Th) on the several features presented earlier. The reason
we included the subject group factor is to see the subject group effects on analysis.
And we found that the features utterance frequency; length of utterance;
switching pause; and frequency of silence, switching, and quasi-overlap were all
significant as meeting phase P main effects. Moreover, we found that compared to
convergent phases (Pc), utterances were less frequent; length of utterances was
longer; switching pauses were longer; silences were more frequent; and switching
and quasi-overlapping were less frequent in divergent phases (Pd) (Figure 5). We
also didn’t observe a significant main effects of subject group S, group
friendliness G, and task difficulty T with the all features. The interaction (P X T X
S) was significant with only the feature frequency of switching. None of other
features and none of other interactions were significant. All of these decision tree
learning and ANOVA results are in agreement with our qualitative observations.
In watching video of divergent phase sessions, we frequently observed
166Discriminating Divergent/Convergent Phases of Meeting Using Non-Verbal Speech Patterns
participants carefully explaining vocabulary to share presuppositions and
knowledge in conveying new ideas to other members. Then in the convergence
phase sessions, we actually observed each member of the group succinctly narrow
down to the key points in short phrases without long pauses in between.
Generally, during the divergent phase of problem-solving meetings, members
are primarily focused on getting out their thoughts and are more concerned with
quantity of ideas than quality. It is a free-wheeling session without anyone being
too critical with an emphasis on coming up with ideas. Meanwhile, the convergent
phase sessions are quite different. Here the emphasis is on sorting out the ideas
raised during the divergent phase, and honing in on one idea (Hori, 2004). This
might lead one to expect fewer pauses in divergent phases than in convergent
phases, and continuous talking without interruptions. Yet, with the results of our
experiments, we found just the opposite. We believe this can be attributed to the
instructions and the clear-cut goal we gave the subjects, telling them to work
together as a group within time limits during the convergent phase to come up
with the correct answer. In ordinary meetings, of course, people are usually under
similar time constraints to solve problems and make decisions. The findings
presented here should prove useful in understanding typical real-world meetings
held under similar circumstances.
Utterance frequency Percent overlap speech time Length of utterance Switching pause
(times/min.***
) (%) (s) ** (s) **
18 4 1 1.4
16 1.2
14 0.8
3 1
12
0.6
Convergence
Convergence
Convergence
Convergence
10 0.8
Divergence
Divergence
Divergence
Divergence
2
8 0.4 0.6
6 0.4
4 1
0.2
2 0.2
0 0 0 0
Phase Phase Phase Phase
Frequency of speaker transitions
(times/min.)* * *
6
5
4
Convergence
Divergence
3
2
1
0
Silence
沈黙 Continuation
継続 Switching
交替 Quasi‐overlap
準重複 Overlap
重複
Figure 5. Feature means and standard errors.
Classification Results Based on Group Friendliness (H2)
Next we will consider results of our classification based on group friendliness.
We compared the discrimination accuracy of decision trees created for different
degrees of group friendliness—i.e., friends versus strangers—against a decision
tree based on data for all subjects. First, we compared conditions for friends (Gf)
and for all subjects. As one can see in Table IV, the discrimination rate for both
under the open test condition is exactly the same at 77.3%. Now when we
167Junko Ichino
compare the groups of strangers (Gs) with all subjects, Table IV shows that the
discrimination rate for strangers (Gs) is approximately eight points higher than for
all subjects (open test). These results are fairly inconclusive, so it would be
difficult to effectively discriminate between divergent and convergent phases
using decision trees based on different degrees of friendliness. However, the
amount of data per condition is very thin, so we cannot be certain.
Here we will consider our earlier inference in the subsection “Experimental
Conditions” that utterance patterns would differ if the degree of friendliness of
groups differed. First, let us compare the decision trees shown in Figure 4 (i) and
(ii) reflecting groups of friends (Gf) and strangers (Gs), respectively. Nodes on the
friends (Gf) decision tree were silence frequency and overlapping frequency,
while those on the strangers (Gs) decision tree were quasi-overlapping frequency
and switch pauses, so clearly the features used for discrimination are different.
This tells us that our inference was essentially correct. Now, comparing the (i)
friends condition (Gf) and (ii) strangers condition (Gs) with the decision tree for
(iii) all subjects, it is apparent that both (i) and (ii) are effectively discriminated
with few features (number of nodes). This suggests that when using utterance
patterns to discriminate meeting phases, the effective utility of using the group
friendliness information would not be lost. We need to reassess the effectiveness
of classification based on group friendliness using more data and better statistical
accuracy.
Generally, real-world human relationships evolve over time starting with a
slight acquaintance that grows into full-blown friendship, so it is hard to apply the
notion of strangers to a single category. Actually, we must consider a more
flexible way of implementing decision trees based on different degrees of
friendliness that accommodates phased changes in the degree of friendliness.
We also observed in Figure 3 that, while there was no marked difference in
significance, the task performance of subjects who were friends (Gf) was better
than that of subjects who were strangers (Gs) ((1) number of questions: 2.7 for Gf
vs. 3.9 for Gs, F(1,18) = 1.345, p = .261; (2) answer time: 4.8 mins. for Gf vs. 8.6
mins. Gs, F(1,18) = 2.737, p = .115; (3) percentage correct answers: 81.8% for Gf
vs. 63.6% for Gs, F(1,18) = 1.021, p = .326). The findings reported here are
consistent with those of Wilson et al. (2004) who conducted a similar 20Q based
experiment that divided subjects into groups of friends and strangers.
Classification Results Based on Task Difficulty (H3)
Let us next consider the results of our classification based on task difficulty. We
compared the discrimination accuracy of decision trees created for different
degrees of task difficulty—i.e., easy versus hard tasks—applied to groups of
friends (Gf) and to groups of strangers (Gs) against a decision tree that was not
classified for task difficulty. We found that just the hard task condition (Gs X Th =
95.0% in Table IV) had a discrimination rate ten points higher than the
168Discriminating Divergent/Convergent Phases of Meeting Using Non-Verbal Speech Patterns
unclassified case (Gs = 85.2% in Table IV) in the open test. For all other
conditions (Gf X Te, Gf X Th, and Gs X Te), the discrimination rate was lower than
the unclassified case. These results suggest that using decision trees for different
degrees of task difficulty may not effectively discriminate between divergent and
convergent phases of meetings. Data for one condition is insufficient, so we need
to reassess the effectiveness of classification based on task difficulty using more
data and better statistical accuracy.
Moreover, in typical meetings, we can assume that the difficulty of topics
varies throughout the meeting. As we noted earlier regarding different degrees of
group friendliness, here too we must consider a more flexible way of
implementing decision trees based on different degrees of task difficulty that
accommodates phased changes in the degree of difficulty.
Next, let us consider our hypothesis in the previous subsection that, differences
in task difficulty would be reflected in different utterance patterns. Although not
included in the paper, we found that comparing easy versus hard tasks for groups
of friends (Gf X Te versus Gf X Th) based on decision trees, produced different
features used for discrimination. But when we compared easy versus hard tasks
for groups of strangers (Gs X Te versus Gs X Th), both included quasi-overlapping
frequency nodes. This indicates that this conjecture is not supported.
Now to briefly summarize the above considerations, features associated with
utterance patterns do apparently contain information capable of discriminating
divergent and convergent phases of meetings. Having this information should
prove useful for linking discrimination and control of meeting phases in
implementing meeting support systems. However, our experiments did not
suggest that dividing up groups in terms of friendliness or task difficulty would
serve as an effective approach in discriminating phases of meetings.
Conclusion and future work
In this study, we conducted experiments comparing non-verbal speech
information among subjects to see if this information was useful in discriminating
divergent and convergent phases of meetings. Using audio recordings of modified
Twenty Questions experimental game sessions, we created decision trees using
only information relating to utterance patterns—utterance frequency, length of
utterance, turn-taking pattern frequency, etc.—then conducted experiments to
discriminate divergent and convergent meeting phases using decision tree learning.
As a result, the percentage of correct answers for groups of friends was 77.3%, for
groups of strangers was 85.2%, and for all subjects was 77.3% (under the open
test condition). These findings suggest that, even when verbal information is not
used, one can nevertheless achieve fairly accurate discrimination between
divergent and convergent phases of meetings from features associated with non-
verbal utterance patterns alone. Among the features relating to utterance patterns
169Junko Ichino
used in this work, we found that silence frequency and quasi-overlapping
frequency were especially effective for discrimination. Our results did not find
that group friendliness or task difficulty information contributed to effective
discrimination of the meeting phases, so this calls for further study using more
data to achieve more stable discrimination accuracy.
Our results demonstrated that utterance patterns clearly differed between
divergent and convergent phases when groups engaged in problem solving within
a limited time frame through experimental sessions of Twenty Questions.
Choosing an appropriate task for a semi-controlled study like this requires striking
a difficult balance between ecological validity of the task, and the level of control
required to obtain meaningful answers to our questions. We chose the 20
questions task because a) we believe that it contains most of the relevant elements
and patterns of many common tasks (e.g., exchange of information that is not
available to everyone), b) has successfully been used in previous studies, which
allow us also to compare our results at the same level of validity (Tailor et al.,
1952; Wilson et al., 2004), and c) this task allow us to control the level of
difficulty in a straightforward way.
However, these results were obtained under conditions ideal for the algorithms
to work, namely, a relatively simple task with explicit divergent and convergent
phases. Clearly an important next phase is to investigate other tasks. Thorough
analysis of the features differentiating divergent and convergent phases of
meetings would require more empirical research. It will be necessary to show that
divergent and convergent activities can be extracted from more naturalistic
meetings, such as the early design phases in software engineering or product
design which often contain a mix of divergent and convergent activities.
Building on the work presented here, we would like to perform a more detailed
analysis to investigate the generality of using decision trees based on more data. In
this work we focused on simple binary discrimination between divergent and
convergent phases, but this approach could also be applied to probabilistic
behavior, so we would like to add a labeling method and discrimination scheme.
Toward implementing a meeting support system, we intend to propose a
framework that captures continuous information in real time and implements
group interaction control at the discrimination determination stage. We therefore
plan to investigate a discrimination method capable of defining features in real
time. We would also like to explore other types of the non-verbal information that
we didn't touch on in this study—prosodic information such as volume, pitch,
velocity, and accent—to assess their potential for discriminating phases of
meetings. And by opening the way to other non-verbal cues, such as eye gaze and
gesture, this will lead to far better future understanding of the multiple phases of
meetings.
Furthermore, we also must investigate whether these methods are language or
culture specific. Certainly there are differences in conversational style in different
170Discriminating Divergent/Convergent Phases of Meeting Using Non-Verbal Speech Patterns
languages. We should make certain the possible influence on the generalizability
of the our assumptions and conclusions that meetings can have that encompass
people of different cultures, for instance, if people from different countries and
cultures really share similar behaviors and patterns in regard to both 'silence
frequency' and 'overlapping frequency'.
Acknowledgments
The authors wish to acknowledge that part of this work was supported by a grant-in-aid for
scientific research by the Japan Society for the Promotion of Science (JSPS) (No: 19800015).
References
Amitani, S., and Hori, K. (2005): ‘A Method and a System for Supporting the Process of
Knowledge Creation’, Trans. Information Processing Society of Japan, vol. 46, no. 1, pp.
89-102.
Bergstrom, T. and Karahalios, K. (2007): ‘Conversation Clock: Visualizing audio patterns in co-
located groups’, Proc. 40th Hawaii international Conference on System Sciences, IEEE, 3,
pp. 1317-1325.
Bono, M., Suzuki, N., and Katagiri, Y. (2004): ‘Conversation: Do Interaction Behaviors Give
Clues to Know Your Interest?’, Cognitive studies: bulletin of Jpn. Cognitive Science Society,
vol. 11, no. 3, pp. 214-227.
Bono, M., and Takanashi, K. (2007): ‘Methodology for Analyzing Multi-Party Interaction:
Overview of Analytic Units of Verbal and Non-Verbal Communication’, J. Jpn. Society for
Artificial Intelligence, vol. 22, no. 6, pp. 838-845.
Cetin, O. and Shriberg, E. (2006): ‘Analysis of Overlaps in Meetings by Dialog Factors, Hot spots,
Speakers, and Collection Site: Insights for Automatic Speech Recognition’, Proc.
Interspeech 2006, pp. 293-296.
Chang, Z., Takanashi, K., and Kawahara, T. (2008): ‘Analysis on Morphological and Prosodic
Features of Aizuti and its Correlation to Conversation Mode in Poster Presentations’, Jpn.
Society for Artificial Intelligence Technical Report, SIG-SLUD-A802, pp. 7-13.
Conklin, J., and Begeman, M. L. (1988): ‘gIBIS: A Hypertext Tool for Exploratory Policy
Discussion’, Proc. CSCW'88, ACM Press, pp. 140-152.
Daibo, I. (1998): Gesture and communication medium. Saiensu-sha, JP.
DiMicco, J. M., Hollenbach, KJ, Pandolfo, A., and Bender,W. (2007): ‘The Impact of Increased
Awareness while Face-to-Face. Special Issue on Awareness Systems Design’, Human-
Computer Interaction. vol. 22, no. 1.
Guilford, J.P. (1983): ‘Transformation: Abilities or functions’, J. Creative Behavior, 17, pp. 75-86.
Hori, K. (2004): The ABC of facilitation. Nikkei Publishing.
Horiuchi, Y., Yoshino, A., Naka, M., et al. (1997): ‘The Chiba Map Task Dialogue Corpus
Project’, Research reports of Faculty of Technology, vol. 48, no. 2, Chiba University, pp.
33-60.
Ichino, J., Takeuchi, K. and Isahara, H. (2009): ‘Improvement of Member's Concentration during
Discussion’, Proc. HCII2009, LNCS 5617, pp. 59-68.
171Junko Ichino
Inspiration Software Inc.: ‘Inspiration’, http://www.inspiration.com/.
Kim, T., Chang, A., Holland, L., and Pentland, A. (2008): ‘Meeting mediator: Enhancing Group
Collaboration using Sociometric Feedback’, Proc. CSCW'08, ACM Press, pp. 457-466.
Koiso, H., Horiuchi, Y., Tutiya, S., Ichikawa, A., and Den, Y. (1998): ‘An analysis of turn-taking
and backchannels based on prosodic and syntactic features in Japanese map task dialogs’,
Langurage and Speech, vol. 41, no. 3-4, pp. 295-321.
Koiso, H., and Den, Y. (2000): ‘How is the Smooth Transition between Speakers Realized?’,
Cognitive studies: bulletin of Jpn. Cognitive Science Society, vol. 7, no.1, pp. 93-106.
Levine, J.M. and Moreland, R.L. (2004): ‘Collaboration: The Social Context of Theory
Development’, Personality and Social Psychology Review, vol. 8, no. 2, pp. 164-172.
Mahl, G. F. (1956): ‘Disturbances and silences in the patient's speech in psychotherapy’, J.
Abnormal and Social Psychology, 53, pp. 1-15.
McGuffin, L., and Olson, G. M. (1992): ‘ShrEdit: A shared electronic workspace’, CSMIL
Technical Report 45, University of Michigan, Cognitive Science and Machine Intelligence
Laboratory.
Munemori, J., Horikiri, I, and Nagasawa, Y. (1994): ‘Groupware for New Idea Generation Support
System (GUNGEN) and Its Application and Estimation to the Student Experiments of the
Distributed and Cooperative KJ Method’, Trans. Information Processing Society of Japan,
vol. 35, no. 1, pp. 143-153.
Nakai, Y. (2006): ‘Verbal and non-verbal engagement displays in a Japanese face-to-face
conversation between two native speakers and two non-native speakers’, Bulletin of Center
for Jpn. Language, 19, Waseda University, pp. 79-98.
Nagaoka, C., Komori, M., Draguna Raluca Maria, et al. (2003): ‘Mutual Congruence of Vocal
Behavior in Cooperative Dialogues’, Proc. Human Interface 2003, Japan, pp. 167-170.
Nishimoto, K., Mase, K., and Nakatsu, R. (1999): ‘How an Autonomous Information Retrieval
Agent Affects Divergent Thinking by a Group’, J. Jpn. Society for Artificial Intelligence, vol.
14, no. 1, 58-70.
Ohsuga. T., Horiuchi, Y., Nishida, M., and Ichikawa, A. (2006): ‘Prediction of Turn-Taking from
Prosody in Spontaneous Dialogue’, Trans. Jpn. Society for Artificial Intelligence, vol. 21, no.
1, pp. 1-8.
Olguin, D.O., Waber, B.N., Kim, T., et al. (2009): ‘Sensible organizations: Technology and
methodology for automatically measuring organizational behavior’, IEEE Trans. Syst., Man,
Cybern. B, Cybern., vol. 39, no. 1, pp. 43-55.
Quinlan, J. R. (1992): C4.5: Programs for Machine Learning. Morgan Kaufmann.
Smith, E.E. and Kight, S.S. (1959): ‘Effects of Feedback on Insight and Problem-Solving
Efficiency in Training Groups’, J. Applied Psychology, 43, pp. 209-211.
Stefik, M., Foster, G., Bobrow, D. G., Kahn, K., Lanning, S., and Suchman, L. (1987): ‘Beyond
the chalkboard, Computer support for collaboration and problem solving in meetings’,
Comm. ACM, vol. 30, no. 1, pp. 32-47.
Taylor, D. W., and Faust, W. I. (1952): ‘Twenty questions: Efficiency in problem solving as a
function of size of group’, J. Experimental Psychology, 44, 360-368.
Wrede, B and Shriberg, E. Spotting (2003): ‘"Hot Spots" in Meetings: Human Judgements and
Prosodic Cues’, Proc. Eurospeech 2003, pp. 2805-2808.
Wilson, D.S., Timmel, J. J., and Miller, R.M. (2004): ‘Cognitive cooperation: when the going gets
tough, think as a group’, Human Nature, vol. 15, no. 3, pp. 225-250.
172You can also read