O/W cosmetic emulsions: Influence of UV agent and thickener on rheology, stability and sensory analysis
←
→
Page content transcription
If your browser does not render page correctly, please read the page content below
Advisor:
                                                                    Ph.D Diego Camilo Pradilla Raguá

O/W cosmetic emulsions: Influence of UV agent and
thickener on rheology, stability and sensory analysis
Cristian Fabian Rodríguez Rodríguez1,† and Sebastian Camilo Casadiego
Fierro2,‡
1,2
      Chemical and Food Engineering Department, Universidad de los Andes | Bogotá, Colombia
†   cf.rodriguezr@uniandes.edu.co
‡   sc.casadiego@uniandes.edu.co

Abstract
The cosmetic industry has implemented different innovative emulsion formulation and processing techniques intending to
improve the cosmetic products that are marketed, where the most important thing is to meet the needs of consumers. In
consequence, an analysis was developed to determine the formulation variables that directly affect the rheological, stable,
and textural properties in direct cosmetic emulsions (O/W). The effect of the incorporation at different concentrations of
thickener (carbopol) and UV filter (TiO2 ) in the systems was studied. Similarly, the variation in the amount of dispersed
phase was taken into account to define the most convenient formulation in those emulsions. For the rheological properties,
the elastic module in the different emulsions were analyzed, which made it possible to determine that, with a higher
concentration of dispersed phase, UV filter, and thickener, the elasticity of the emulsion increases, which inhibits some
instability mechanisms. In the stable aspects analysis, it was evident that with the TiO2 incorporation and carbopol, the
droplet size is significantly reduced, which allows greater stability to the emulsion. However, the presence of these two
agents could generate sedimentation phenomenon and the absence of thickener causes creaming. Finally, for the textural
properties as relevant results, it is evident that the greater the dispersed phase is the lower the spreadability parameter
and the hardness is directly influenced by the droplet size.

Key words: Direct emulsions, rheological properties, stable properties, textural properties, thickener, UV filter, elastic
modulus, elasticity, sedimentation, creaming, spreadability, hardness.

Introduction                                                        ported that the increase in the emulsions elasticity occurs as
                                                                    the interactions between drops obtained [3]. These behavior
In recent years, different companies have had a greater inter-      occurs by increasing the oil concentration in O/W emulsions,
est in developing products that are market leaders, that meet       where drops are closer to each other. The particle size distribu-
the needs of consumers and are economically competitive. Ac-        tion in these cases is no longer monomodal and small droplets
cording to Tanguy and Marchal [1], current trends are focused       are created, thus allowing the formation of smaller clusters and
on increasing demand for products with improved performance         an increase in molecular interactions. Additionally, C. Gómez
and accelerating innovation in product development. For this,       [4] complemented the study and establishes that the addition
they have carried out investigation focused on the study of the     of active ingredients as thickeners increases the values of the
properties of the products and how the process and formula-         elastic moduli by reducing the size of the droplet size, while
tion variables on the quality and performance of those prod-        the same relationship happens with the UV agent reported by
ucts. The investigation or research process begins by identify-     M. Rossano, et al [5], causing what F. Mendoza raises related
ing needs, followed by prototyping, analysis of results and final   to the proximity between the drops. On the other hand, separa-
product, where the effect of the factors mentioned above on the     tion can occur due to some phenomena such as creaming, floc-
response variable being studied is observed. However, product       culation, sedimentation, phase inversion, among others [6]. M.
development involves problematic scenarios or adverse effects       Grecco and R. Dos Santos [7] reported that small droplet diame-
and the cosmetic field is no exception. In consequence, some        ters favor stability since it prevents the emulsion breaking and
of the products (i.e, emulsions) present instability, changes in    phase separation. Regarding the addition of thickeners, S. De
their appearance, unwanted texture, among other aspects that        Souza and M. Bruschi [6] established that stability is greater as
decrease their quality. For this, investigations have been de-      the concentration of those thickeners increases. This happens
veloped that contribute to the establishment of correlations be-    because the thickeners increase the system viscosity, which de-
tween the parameters to have a product according to the objec-      creases the droplet size of the emulsion and this is related to a
tives set.                                                          more stable product. The effect of the UV agent on the stability
      For example, in the emulsions rheology, F. Mendoza [2] re-    of the emulsion is described by M. Rossano, et al [5], where it

Compiled on: May 29, 2021.

                                                                                                                                1
2 |

is reported that the addition of TiO2 on the systems increases       • Impeller: Propeller.
stability and this in turn contributes to the decrease in droplet    • Tip velocity:
size.
                                                                                    π·N·D   π · 750 rpm · 0.055 m
                                                                             Vp =         =                       = 2.15 m/s       (1)
    However, the study of products, in general, goes beyond                          60               60
rheology and stability. Texture studies are also needed to es-
tablish how it is perceived on the skin (cosmetics) at the time        Where:
of use and what are aspects to improve. Concerning sensory             D: Impeller diameter (0.055 m).
properties and analysis, qualitative and quantitative evalua-          N: Rotation speed (750 rpm).
tion mechanisms have been implemented. However, qualita-             • Homogenization-incorporation speed: 750 rpm.
tive mechanisms such as Quantitative Descriptive Analysis are        • Homogenization time: 10 minutes.
not as viable since they require a select group of panelists and     • Peristaltic pump rate: 30 ml/min.
may be perceptual biased [8]. For this, other types of strategies
have been implemented, such as Spectrum Descriptive Analy-          Formulation variables:
sis, which is based on quantified analysis using instruments        It refers to the conditions of each of the samples. The levels
[9]. Different studies have modified properties and their for-      selected affect our response variables: elastic module, stability,
mulation to analyze the impact on sensory analysis. For exam-       and texture profile.
ple, dispersed phase concentrations, thickening agent addition,
UV filter, surfactant change, and other aspects [10]. With the
                                                                     • Dispersed phase concentration: Taking into account that
results obtained, it is possible to make decisions about the for-
                                                                       the oil is the dispersed phase, this indicates the amount of
mulation of new products that satisfy needs. It should be noted
                                                                       oil dispersed in the mixture of water and surfactant. Since
that some of the properties change over time and it is very im-
                                                                       the emulsions were diluted (φ ≤ 40% w/w) , the levels are
portant to observe their behavior for decision making.
                                                                       as follows:
    Literature mentions studies focused on hardness and the
addition of thickeners and UV agent increases this parameter           – 10% w/w.
(hardness) because the molecular interactions will be greater          – 40% w/w.
[4, 11]. Other parameters such as adhesiveness, compressibil-
                                                                     • Surfactant concentration: It refers to the concentration of
ity and, spreadability have not been studied in-depth together.
                                                                       surfactant in relation to the total amount of the emulsion.
However, a proportional correlation between droplet size and
                                                                       The value used was 4% w/w according to the literature and
texture parameters is expected according to studies that have
                                                                       previously developed studies [15].
been carried out individually [4, 11, 12, 13, 14]. Following the
above, there is a need to study the rheology, stability and tex-
                                                                     • UV agent concentration: It refers to the concentration of
ture of the diluted O/W emulsions to complement studies that
                                                                       UV agent in relation to the total amount of the emulsion. It
have been carried out previously. The difference of our study
                                                                       is our first study variable. For this, the levels selected for
concerning those mentioned in the literature is that three for-
                                                                       subsequent analysis are the following:
mulation conditions are being analyzed simultaneously: dis-
persed phase, thickener and UV agent, where the last two refer         – 1% w/w.
to active ingredients popularly used in the cosmetic industry          – 5% w/w.
and to that generally studies analyze only one variable. For
that reason, it is necessary to develop a time-based stability       • Thickener concentration: It refers to the concentration of
study and analyze the effect of the amount of thickener and UV         thickener in relation to the total amount of the emulsion. It
agent on rheology, stability and sensory analysis, to determine        is our second study variable. For this, the levels selected for
the most influential variable in the study.                            subsequent analysis are the following:

                                                                       – 0.5% w/w.
Materials and methods
                                                                       – 2.5% w/w.

Materials:
                                                                    All the emulsions formulation are summarized in Table 1. The
The emulsions were made with deionized water (Universidad           formulation is for 500 grams.
de los Andes, Colombia) and mineral oil USP-grade (Químicos
Campota, Colombia). The surfactants used for the emulsions
                                                                    Emulsification process:
are non-ionic from the sorbitan mono-oleate family. The sur-
factant was Tween 20 (Croda, England) with an HLB of 16.7 in        The aqueous phase with deionized water (Universidad de los
the aqueous phase, while in the oil phase the surfactant was        Andes, Colombia) and Tween 20 (Croda, England) was homoge-
Span 80 (Croda, England) with an HLB of 4.3. On the other           nized for 10 minutes at 750 RPM with a propeller. The oil phase
hand, titanium dioxide (BioQuim.ISM, Colombia) was used as          with mineral oil USP-grade (Químicos Campota, Colombia) and
UV agent. In turn, carbopol (BioQuim.ISM, Colombia) was used        Span 80 (Croda, England) was homogenized at the same con-
as a thickening agent. Finally, to regulate the pH of the solu-     ditions already mentioned. Once the homogenization process
tion, it was necessary to use triethanolamine (Universidad de       was completed, the incorporation of the dispersed phase began.
los Andes, Colombia), a product widely used to neutralize car-      To do this, incorporation took place with a peristaltic pump
bopol gels.                                                         (Fischer Scientific, USA) at a constant flow of 30 ml/min while
                                                                    the system was stirred with a propeller and the mixing device
                                                                    Hei-Torque Value 400 (Heidolph, Germany). When the dis-
Methods:                                                            persed phase was being added, the UV agent and carbopol were
                                                                    incorporated into the mixture. At the end of the process, the
Process parameters:                                                 pH of the emulsion was regulated to 5.5 (pH of some facial cos-
They are those parameters that were implemented in all the          metic products) with a pH-meter (Metter Toledo, Switzerland)
emulsions developed. The values were kept constant because          because they were remaining acidic. For this, triethanolamine
the study is focused on the formulation variables.                  (Universidad de los Andes, Colombia) was used.
| 3
Table 1. Emulsions formulation.
Emulsion Tween 20 (g) Span 80 (g) UV agent (g) Carbopol (g) Mineral oil (g) Water (g)
60% continuous phase - 40% dispersed phase
1 12.57 7.12 25 12.5 177.88 264.93
2 13.11 7.42 5 12.5 185.58 276.39
3 12.84 7.27 25 2.5 181.73 270.66
4 13.59 7.69 0 0 192.31 286.41
90% continuous phase - 10% dispersed phase
5 12.57 7.12 25 12.5 39.13 403.68
6 13.11 7.42 5 12.5 40.83 421.14
7 12.84 7.27 25 2.5 39.98 412.41
8 13.59 7.69 0 0 42.31 436.41
Characterization: Each sample was added to the 20 mL Turbiscan vial with a
Microscopy: height of approximately 40000 µm. This height can vary a few
To analyze the droplet size and the impact of the formulation µm according to the experimenter. The Turbiscan works with
variables on the diameter, micrographs were taken on a BA310 the Lamber-Beer law, where the transmission and backscatter-
series microscope (Motic, China) with a 100X objective lens and ing of light is measured in an infrared close to 820 nm from the
immersion oil. There, using the microscope software, the di- bottom to the neck of the vial. Instability phenomena can be
ameter of the drops were measured. Weighted average diame- analyzed with transmittance or backscattering [17]. However,
ter is calculated using the Sauter’s method (d3,2 ) [16]: the literature performs more analyzes related to backscatter-
ing than transmittance. Therefore, it is chosen to analyze only
Pn
ni d3 with this method. The backscattering is calculated by the Tur-
d3,2 = Pni i (2) biscan as follows [17]:
n d2
i i i
s
Where: 3φ(1 – g)Qs
BS = (4)
2d
ni : Number of droplets with diameteri .
di : diameteri . Where:
φ: Dispersed phase volume.
On the other hand, the surface area of a drop (assuming it is g: Mie theory optical parameter.
completely spherical) is: Qs : Mie theory optical parameter.
2 d: Average particle size.
D3,2
SA = 4π (3)
2
Texture analysis:
Where: Texture analysis is directly related to the sensory properties of
the product. In order to compare the emulsions a Spectrum
d, 3, 2: Sauter’s weighted average diameter. Descriptive Analysis (SDA) has been implemented, an analysis
focused on the comparison of attributes of products and emul-
Rheology: sion sensory characteristics. There are different attributes for
Studies such as the one carried out by Ingrid C. Gómez, empha- the SDA, however, the ones that we consider most important
size the importance of rheology and texture, its relationship of for the study are:
macroscopic properties [4]. Taking into account the influence
of the formulation and composition of the product on those • Appearance: Brightness and color.
macroscopic properties, a flow sweeps test was developed on • Pick-up: Hardness, compressibility and adhesiveness.
the AR-G2 Rheometer (TA Instruments, US) to analyze the rhe- • Rub-out: Spreadability.
ological behavior of each of the developed emulsions. The pa-
rameters are: The analysis was developed in the texture analyzer TA.HD Plus
(Stable Micro Systems, UK) with 5 kg cell, according to previous
• Geometry: 20 mm parallel plates. investigations [18]. The mechanism of the texture analyzer is
• Shear rate: 1 s–1 to 100 s–1 . related to the analytical probe that measures vertical displace-
• Oscilation amplitude: 0.1 rad/s to 100 rad/s. ments. Further, sensor position and resistance to displacement
• Controlled effort: 1 Pa. are recorded in order to calculate each of the texture properties
of the emulsion [18]. Therefore, a topical with double compres-
The rheometer applies a force to the sample and measures the sion test in the Cosmetics Skincare Product Texture Measurement
reaction to the force and the force it exerts on the rheometer. Analysis Category was performed with 100 mL of each emulsion.
In this way, the dynamic modules (G’) of the emulsions are These were introduced to the cylindrical accessory of the tex-
established looking for the zone of linear viscoelasticity. turometer with dimensions of 6 cm diameter and 7.5 cm height.
The cylinder to perform the compressions has a diameter of 4
Stability: cm and 0.5 cm high. According to the texture analyzer settings,
To analyze the instability phenomena in the emulsions, a the test conditions are as follows:
Turbiscan (Lab Formulaction, France) was implemented using
this parameters or configuration: • Pre-test speed: 1 mm/sec.
• Test speed 2 mm/sec.
• Test: Scheduled analysis. • Post-test speed: 2 mm/sec.
• Temperature: 25 ºC. • Targed mode: Distance.
• Scan time: 10 minutes. • Distance: 15 mm.
• Number of scans: 25. • Time: 5 sec.4 |
• Trigger type: Auto (Force). ameter decrease of 99.38% and 97.5%, respectively. This also
• Break mode: Off. confirms results that relate carbopol and UV agent as viscosity
• Tare mode: Auto. modifiers and therefore, the droplet size decreases according
• Advanced options: On. to the addition of these active ingredients [21, 22].
• Control oven: Disabled.
• Frame deflection correction: Off (XT2 compatability). Rheology:
For the rheology characterization, the influence of the formu-
Results and discussion
lation variables on the elastic modulus was analyzed. As can
be seen in Figure 3, emulsions formulation with 40% w/w, the
Microscopy:
elastic modulus (G’) values are significantly higher than those
Figure 1 shows the droplet size of the emulsions without UV that can be observed in Figure 4. There is an influence of the
agent and carbopol. The objective of this micrograph is to an- concentration of the dispersed phase on the elastic modulus.
alyze the effect of oil concentration on the droplet size of the From the figures mentioned above, it can be determined that,
emulsion. It is evidenced that the 10% w/w emulsion has a at a higher concentration of dispersed phase, the elasticity of
larger average droplet size compared to the 40% w/w emulsion. the system is greater, a relationship developed by Tadros et al
It should be noted that the droplet size depends on factors in ad- in the analysis of formation, stability, and rheology of emul-
dition to the oil concentration, it also depends on the impeller sions [23]. Additionally, it can be seen that the rheology of
used, speed and time of stirring and incorporation, type of sur- the systems also depends on the composition and amount of
factant, among others [19]. Under the conditions used there is thickener and UV filter present.
an weighted average droplet size of 60.86 µm for the 10% w/w Also, according to Figure 3 the 40% w/w emulsion (1% w/w
emulsion and 26.22 µm for the 40% w/w emulsion. The values UV filter + 2.5% w/w thickener) have an increasing elastic mod-
obtained are consistent with the literature and confirm the re- ulus. This means that the system continues to maintain a vis-
sults obtained by T. Dapčević et al [20], where it is stated that coelastic behavior with direct dependence on the entire range
with a higher concentration of oil, there is a gradual decrease of the angular frequency. Additionally, another similar behav-
in the specific surface area. Assuming that the drops are com- ior is seen in Figure 4 where, the 10% w/w emulsion (5% w/w
pletely spherical, the surface area is 11637.9 µm2 for the 10% UV filter + 0.5% w/w thickener) also have a direct dependence
w/w emulsion and 2160.96 µm2 for the 40% w/w emulsion, in between the elastic modulus and the entire range of the angu-
accordance with the Dapčević’s relationship. To analyze what lar frequency. For these specific systems, it can be determined
happens with the addition of UV agent and carbopol, the mi- that the physical interactions are low. Unlike the other sys-
crograph in Figure 2 was taken. The average diameter of the tems, which have less steep slopes and have higher physical
10% w/w emulsion (5% w/w UV agent + 2.5% w/w carbopol) interactions [24].
is 4.76 µm and the 40% w/w emulsion (5% w/w UV agent +
2.5% w/w carbopol) average diameter is 4.14 µm. A drop di-
Figure 1. Droplet size of blank emulsions.
Figure 2. Droplet size of 5% w/w UV agent + 2.5% w/w carbopol emulsions.| 5
Based on the previous analysis, in the cosmetic industry it
is necessary that for the formulations and processes that are
carried out in the development of O/W emulsions, it is taken
into account that the greater the physical interaction between
the droplets of the system, the more stable will be the prod-
uct. In this way, the rheology of the systems must be analyzed
from their elastic modulus and the behavior that this has con-
cerning the variation of angular frequency. On the other hand,
the adequate elasticity of a system depends on the cosmetic to
be designed. For facial and body creams, the elastic modulus
ranges between 1x101 and 1x10³ Pa [25]. In the study carried
out, it can be determined that the systems that satisfy with
this range are the 10% w/w emulsions, since they have lower
magnitudes of elastic modulus compared to those that contain
40% w/w. Additionally, it must be taken into account that this
elasticity parameter increases for the other components that
are added in the systems (humectants, antioxidants, antifoams,
Figure 3. Elastic modulus G’ (Pa) for the 40% w/w emulsions (Week 0).
etc). Therefore, the base formulation must contemplate low
magnitudes in the elastic modulus and that it is independent
of the variation of the angular frequency.
Stability:
To establish the influence of the dispersed phase concentra-
tion on the stability, the data related to the blanks have been
selected because these emulsions do not have a UV agent or car-
bopol, which allows a more direct analysis of the results related
to the dispersed phase. In addition, to understand the behavior
of each of the emulsions, they have only been plotted with the
initial week (week 0) and the final week of the measurements
(week 5) of the emulsions. This is done to analyze results more
practical and simple. However, in Annex 1 are supplementary
material for the blanks emulsions. Before the results analy-
sis in this section, it is important to mention that according
to the Turbiscan vials height, the values have been adjusted to
Figure 4. Elastic modulus G’ (Pa) for the 10% w/w emulsions (Week 0).
40000µm - 45000µm to be more comparative. According to
To summarize the weekly results, Figure 5 has been cre- information provided by the laboratory worker, the vial should
ated. In Figure 5 it can be seen that the amount of thickener in not be completely filled to avoid spillage inside the equipment.
the emulsion is a factor that significantly influences the elastic For that reason, it is necessary to leave a safe distance before
modulus (G’) of the system. According to the rheological data the cover. Although attempts were made to approximate these
obtained, it can be determined that there is a direct correla- measurements, they were not always exact and therefore a vari-
tion, where at a higher concentration of carbopol the elasticity ation arises in the final values of the curve. However, this does
index increases. This is because the swelling of the thickener not affect the results obtained because it only indicates that one
particles leads to the viscous and elastic modulus values being vial was a little fuller than the other, since the instability phe-
large in the zone of linear viscoelasticity. Carbopol has flexi- nomena do not depend on the amount of emulsion, it depends
ble structures that allow it to increase its apparent viscosity in on the back-scattering scan carried out by the Turbiscan.
accordance to its low sensitivity to high shear rates [10]. On
the other hand, it is also important to mention the influence • Dispersed phase influence | Emulsion stability:
that the UV filter has on the elasticity index of an emulsion.
Observing in the same way Figure 5, for 10% w/w emulsions
with 2.5% w/w of thickener, the elastic modulus could be com-
pared at different UV filter concentrations. With higher TiO2
composition in the system, the elasticity index also increases.
Figure 6. Week 0 and week 5 | Delta backscattering results of O/W diluted
emulsions (blanks).
In relation to Figure 6, it is evident that the percentage of the
dispersed phase on the stability is a factor that influences the
Figure 5. Elastic modulus average (G’) for the O/W diluted emulsions. results. Higher instability values are observed in the 10% w/w6 |
emulsions compared to the 40% w/w emulsions. This compar- • Thickening agent influence | Emulsion stability:
ison is made through the delta backscattering values, when the
backscattering is higher, it presents more instability indices.
According to the literature, studies carried out by C. Sun and S.
Gunasekaran [26] confirm that increasing the concentration
of the oil phase influences the decrease in the stability, that is,
more unstable. At higher oil phase concentration, the viscosity
of the emulsion increases. In consequence, the droplets have a
higher packing density, where the interactions of the droplets
increase and a network is formed that helps to decrease the
instability rates [26]. Furthermore, when the oil concentration
is higher, the droplet size is smaller and polydisperse, which
results in the development of a more stable system [20].
It is possible to observe in Figure 6:
Figure 8. Week 0 and week 5| Delta backscattering results of O/W diluted
emulsions with 5% w/w UV agent + 0.5% w/w and 2.5% w/w carbopol.
According to Figure 8, it is evidenced that they present
lower values in the delta backscattering compared to the blanks
(y-axis). Thus, it is possible that the effect of carbopol is to
increase stability. The mentioned above aspect is consistent
with studies results and analysis such as the one carried out by
Ingrid C. Gómez, where the same relationship is presented [4].
The justification for this phenomenon is because the thickener
decreases the droplet size of the emulsion, making it more
stable. In addition, thickeners form networks that prevent the
Figure 7. Week 0 and week 5 | Zones of instability phenomena of O/W diluted
interaction between the droplets [28]. The other conditions
emulsions (blanks).
are plotted in order to analyze if the instability phenomenon
changes according to the dispersed phase concentration:
Instability phenomena in the zones:
• Clarification: Clear bands form in the lower zones or areas
of the emulsion due to the separation that occurs between
water and oil. Likewise, movement of the dispersed phase
towards the upper part of the emulsion is evidenced [27].
• Creaming: Creaming in the 10% w/w emulsion. Although
creaming is related to clarification, this phenomenon is di-
rectly influenced by the amount of oil. The difference in
densities between the two phases causes a separation where
the oil droplets migrate towards the top of the emulsion.
For the 10% w/w emulsion it was more evident since there
is less oil, which makes the speed in which the oil drops
(creaming velocity) remain at the top, is higher compared
to the 40% w/w emulsion [27].
Figure 9. Week 0 and week 5 | Delta backscattering results of O/W diluted
Key aspects of the dispersed phase influence on stability: emulsions with 5% w/w UV agent + 0.5% w/w and 2.5% w/w carbopol.
1. The dispersed phase concentration increases the viscosity
of the emulsion, which influences the stability (higher). In Figure 9 the same tendency to show greater instability with
2. When the concentration of dispersed phase is higher, the less amount of carbopol is confirmed for the reasons already
droplet size is smaller, a factor that promotes the stability of explained above. Also, compared with the initial week for both
the system due to polydispersity of the droplets. emulsions it is observed that the delta backscattering values
3. In the absence of UV agent and carbopol, a lower amount increase and this is because the emulsions are thermody-
of oil promotes creaming given the difference in densities be- namically unstable systems, therefore liquid/liquid mixtures
tween the two phases and the higher creaming velocity in the tend to separate naturally and reduce their interfacial area,
10% w/w emulsion. which is represented in higher values of delta backscattering.
In consequence, it is suitable that kinetic stability decreases
To analyze the influence of the thickening agent (carbopol) on over time. Finally, comparing the 10% w/w emulsion and the
the stability, the UV agent has remained constant. As well as 40% w/w emulsion, it is evident that the delta backscattering
the influence of the dispersed phase on stability, the data from values are higher, which agrees with the idea that has been
the initial week (week 0) and the final week of the measure- mentioned throughout the analysis and the greater instability.
ments (week 5) will be analyzed. Likewise, in Annex 2 are sup-
plementary material for emulsions not shown in the results It is possible to observe in Figure 8 and Figure 9:
analysis.| 7
mentation over time for the developed emulsions.
Oscillations occur throughout the measurements given the
creaminess of the emulsion, where wavelengths can influence
differently throughout the sample. Different from the blanks
that were liquid and had constant values, the variations in the
delta backscattering is normal in creams and is observed in
projects such as the one carried out by M. Suárez [31].
Key aspects of the thickening agent influence on stability:
1. The thickener reduces the droplet size, which influences
an increase in viscosity and therefore greater stability for the
emulsion.
2. With the variation in the concentration of the dispersed
phase, the thickener continues to increase stability, however,
it is evident that the effect is not the same in both emulsions
Figure 10. Week 0 and week 5 | Zones of instability phenomena of O/W diluted due to the amount of oil in the sample.
emulsions with 5% w/w UV agent + 0.5% w/w and 2.5% w/w carbopol. 3. The possible sedimentation in the emulsion due to the max-
imum peaks in the low areas or zones that the delta backscat-
tering presents is hypothesized. However, a more in-depth or
longer analysis would be required to test that hypothesis.
• UV agent influence | Emulsion stability:
To analyze the influence of the UV agent on stability, only two
emulsions will be chosen since the trend is the same for all
those carried out. However, supplementary material can be
found in Annex 3.
Figure 11. Week 0 and week 5 | Zones of instability phenomena of O/W diluted
emulsions with 5% w/w UV agent + 0.5% w/w and 2.5% w/w carbopol.
Instability phenomena in the zones:
• Possible sedimentation: Different from blanks emulsions,
the addition of carbopol inhibits clarification and creaming
and generates possible sedimentation in low areas. There
is droplets suspension at the bottom of the sample. It is
important that this phenomenon is recognized by the max- Figure 12. Week 0 | Delta backscattering results of O/W diluted emulsions
imum peak presented in the lower areas. Also, it is evident with 2.5% w/w carbopol + 1% w/w and 5% w/w UV agent.
that although there is a change in the concentration of the
oil phase, sedimentation behavior curve continues to occur.
Different from the 40% w/w emulsions and the same con- It is evident that the UV agent is one of the compounds that
ditions of UV agent and thickener, the delta backscattering influences stability. With less amount of UV agent, the emul-
values are in higher ranges, which indicate greater instabil- sion is more unstable and has a higher delta backscattering
ity and in accordance with the results obtained in the dis- values. The above aspect is in accordance with the literature
persed phase influence section. because, for example, there are studies that implement TiO2
as an emulsion stabilizer [17]. Also, J. Wang et al [32] reported
It is key to mention that according to the behavior of the delta that TiO2 nanoparticles are responsible for increasing Van Der
backscattering, the sedimentation that occurs is very minimal Walls interactions with oil droplets. Other studies confirm the
because the emulsion is stable. It could be considered as a hy- modification of the droplet size by the UV agent (TiO2 ), and
pothesis given the behavior of the curves. Also, it is observed therefore the stability increases [33]. Hence the reasons why
that in the final week the phenomenon is the same, the sedi- delta backscattering values indicates greater instability at a
mentation trend continues through the increase in the values lower amount of UV agent.
of the delta backscattering. J. Gómez, D. Pradilla and O. Ál-
varez carried out a study based on O/W emulsions where the It is posible to observe in Figure 12:
instability phenomena of those samples were flocculation with
the formation of "flocs" that produce droplet agglomeration
[29]. However, our results are not far from those obtained by
the aforementioned study, because when flocculation occurs
there is the possibility of it becoming sedimentation and this
is confirmed by J. Pérez, M. Santos and N. Zaritzky [30]. From
the above, it can be stated that flocculation is the beginning of
sedimentation, which leads us to hypothesize a possible sedi-8 |
smooth in texture. No significant changes in appearance. How-
ever, the following cases should be highlighted:
• Blanks appearance:
Figure 13. Week 0 | Zones of instability phenomena of O/W diluted emulsions
with 2.5% w/w carbopol and 1% w/w + 5% w/w UV agent.
Instability phenomena in zone:
Figure 14. Appearance of O/W diluted emulsions (blanks).
• Possible sedimentation: Literature indicates that emul-
sions with only UV agent generate creaming separation phe-
nomena [32]. However, this happens since there is no thick- According to the Figure 14, regarding color, the continuous
ening agent within the formulation. In this case, the impact phase acquires a cloudy color, while the dispersed phase has
that the carbopol has on the UV agent is greater and even if a white color. In addition, for the two emulsions made with-
there is a UV agent, the creaming is inhibited and the combi- out UV agent and carbopol, the liquid state in which they are
nation could generates sedimentation. Therefore, creaming found is evident. However, the fact that they are liquid is di-
is not noticeable and the particles reach the lower areas for rectly related to the absence of carbopol, mainly. The UV agent
sedimentation. also influences but it will be the subject of analysis in the next
item. Carbopol is classified as a water-soluble polymer and in
In the same way, it is important to mention that according emulsions it functions as a texturizing or thickening agent [21].
to the behavior of the delta backscattering, the sedimentation Consequently, it modifies properties such as viscosity, which
that occurs is very minimal because the emulsion is stable. It results in a change in the appearance of the emulsion (specifi-
could be considered as a hypothesis given the behavior of the cally in consistency). For this reason, if carbopol is not included
curves. Like the previous stability results, when the UV agent in the formulation, problems associated with the consistency
changes the concentration of the dispersed phase, it continues of the product may arise. Additionally, the absence of carbopol
to present possible sedimentation behaviors and can be seen in as a thickening agent makes the phase separation evident as
Annex 3. In addition, it is key to specify or report that to fully well. Although the separation is not complete, in terms of in-
identify which phenomenon of instability causes each of the tegrated product design, such phase separation is a negative
formulation variables it is required more extensive analysis and effect of what a consumer would look for when buying a cos-
with a greater number of formulations systems, formulations metic product. The fact that it is separated results in the loss
combining the components, with the individual components, of characteristics or properties from the moment it was cre-
among others. At the moment with results, it was only possible ated. Visually, there is a wide separation in both cases and an
to identify possible sedimentation in each of the 6 emulsions appearance of this type can become counterproductive if the ob-
made different from the blanks. jective is to have a successful product, generating disapproval
on the part of consumers. Therefore, it is suggested that for
Key aspects of the UV agent influence on stability: the development of emulsions a thickening agent be included
to stabilize the product.
1. TIO2 increases the viscosity of the emulsion, resulting in
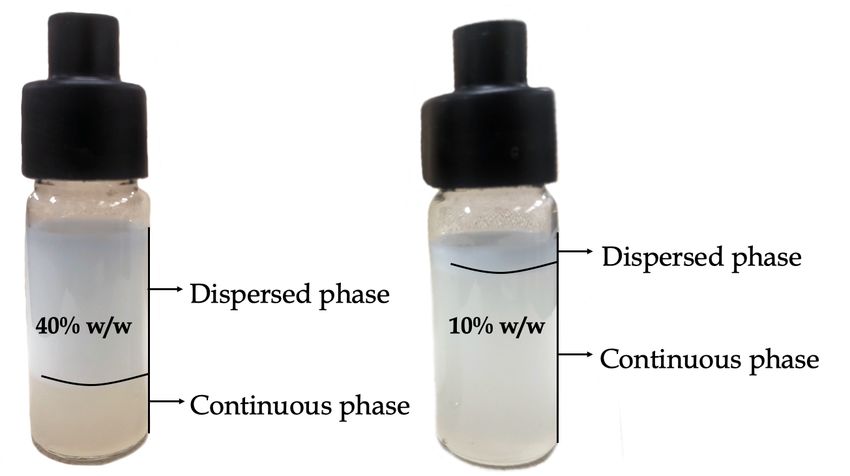
greater stability. • UV agent 5% w/w + 2.5% w/w carbopol appearance:
2. Although in studies they implement TiO2 as a stabilizer, it
is not recommended to use it alone since it does not have as In the literature there are studies such as the one developed by
much influence as carbopol on stability. M. Karsheva, where amounts of UV agent of 0.2% w/w are used
in emulsions [34]. Following the sensory analysis methodol-
Stability most influential factor:
ogy and to evaluate the influence and effect of the UV agent
Between UV agent and carbopol, it is important to note that
on the texture, values higher than the literature were chosen.
the factor that most influences stability is the addition of car-
In Figure 15, it is evident that for 2.5% w/w carbopol and 1%
bopol. Although emulsions stabilized with TiO2 generate a pos-
w/w UV agent a cream appearance is observed in both dispersed
itive effect compared to emulsions that do not have it due to
phase concentrations. However, if it is compared with the 5%
the increase in intermolecular forces, these emulsions end up
w/w level of UV agent, the lumps formation is observed, an
separating more quickly. On the contrary, when carbopol is im-
undesirable aspect in the sensory analysis. This is because the
plemented a drastic modification is made in the viscosity and
effect that the UV agent has on the texture is the considerable
more when the pH is regulated with triethanolamine since the
increase in consistency. The consistency was not expected to
efficiency of the polymer increases. This is confirmed by the
increase widely to create lumps within the emulsion. There-
studies mentioned above [4, 32, 33].
fore, as a result of this study, it is not advisable to implement
5% w/w of UV agent and 2.5% w/w of thickener. Regulating
Texture and sensory characteristics: the amount of UV agent or carbopol is required to create better
products concerning sensory analysis.
In relation to the Spectrum Descriptive Analysis, the appear-
ance of most of the emulsions were bright, white in color and| 9
face. The behavior of compressibility/spreadability according
to the concentration of the dispersed phase agrees with stud-
ies such as those developed by C. Picard [12], where it is also
said that the decrease in the amount of oil increases the com-
pressibility/spreadability of the sample. Secondly, given that
the blanks emulsions are in a liquid state due to the absence
of thickener, the texturometer cannot calculate the adhesive-
ness and that is why it gives values of zero or very close. The
analysis of the sensory parameter already mentioned will be
made later with the other emulsions. Likewise, the hardness
is better analyzed with another type of emulsion that allows a
more complete bar chart to be visualized. To observe in more
detail the influence of the concentration of the dispersed phase
on the sensory analysis, a percentage of UV agent and carbopol
has been established. The results of the double compression
test are:
Figure 15. Appearance of O/W diluted emulsions with 1% w/w and 5% w/w
UV agent + 2.5% w/w carbopol.
To analyze the pick-up and rub-out of the SDA methodol-
ogy, bar chart have been constructed. While property values
may change over the weeks, the objectives are not focused on
analyzing the sensory properties change over time (only stabil-
ity is analyzed with respect to time). The objectives in texture
analysis are related to analyzing which sensory variable is most Figure 17. Sensory chart bar for O/W diluted emulsions with 5% w/w UV
agent + 0.5% w/w and 2.5% w/w carbopol.
affected according to the formulation variables. Therefore, an
intermediate data measurement was selected to analyze these
influences (week 3). The results are the following: Analyzing Figure 17, it is observed that the correlation men-
tioned in Figure 16 is still presented. When there is less dis-
• Dispersed phase influence on sensory analysis: persed phase concentration, greater compressibility/spreading
is. Likewise, the amount of oil phase modifies the droplet size
Carrying out the double compression test, the following sen- of the emulsion, where the smaller the droplet size, the greater
sory bar chart is obtained: the hardness the emulsion will have due to the changes in vis-
cosity level that occur [4]. Additionally, the viscosity not only
influences the hardness of the emulsion but also the adhesive-
ness due to the better structure at the molecular level that these
emulsions have. Therefore, in consumer terms, when pres-
sure is applied to the skin there will be a noticeable difference
in tackiness [13]. Finally, it is important to mention that the
compressibility-spreadability values of Figure 17 vary with re-
spect to the blanks (Figure 16) because they are liquid (blanks).
For that reason, the texturometer at the time of performing the
two compression cycles, the liquid does not leave as much as a
cream.
• Thickener influence on sensory analysis:
According to Figure 17 the increase in the hardness of the emul-
sion is evidenced with the increase in the amount of carbopol.
As mentioned throughout the report, carbopol serves as a thick-
ening agent by modifying droplet size and creating molecular
Figure 16. Sensory bar chart for O/W diluted blanks emulsions.
networks that modify viscosity. Consequently, the hardness
also changes according to the increase or decrease of the thick-
In first place, it is observed that the factor most affected by ener. Although the spreadability is mainly modified by the oil
oil concentration is compressibility/spreadability. The above concentration in the O/W emulsion, the thickener also plays
is directly related to viscosity, where by definition it indicates a fundamental role. The change in consistency caused by the
the resistance to flow or deformation of the sample under anal- thickener makes it easier or more difficult to spread our cream.
ysis. When there are less amounts of oil, the viscosity of the Therefore, it is easier to spread a blank (liquid) because it is
emulsion decreases as the droplet size is larger, which results less consistent than the 40% w/w emulsion (5% w/w UV agent
in less resistance to deformation, therefore, the compressibil- + 2.5% w/w carbopol), for example. The customer will prefer a
ity is higher. In the case of spreadability, as the resistance to product with greater spreadability, however, it must be borne
flow is lower, it is easier to spread the emulsion on the sur- in mind that not adding components such as carbopol on the10 |
formulation will generate unwanted changes in the first part quite high instability indices, which is unfavorable for a prod-
of the SDA method, the appearance. Likewise, the phase sepa- uct. On the other hand, emulsions with 5% w/w UV agent and
ration of the sample and although they are thermodynamically 2.5% w/w carbopol present lump formation as mentioned in
unstable products, it is important to maintain the oil and wa- the texture analysis, an unwanted appearance and that gener-
ter mixture for as long as possible. Finally, as in the increase ate a strange sensation when applied, which is why it is also
of the oil phase, the adhesiveness also increases with the ad- discarded.
dition of carbopol due to the modification in the viscosity and
the factors that were explained previously.
Conclusions
• UV agent influence on sensory analysis: The behavior of the rheological, stable, and textural proper-
ties was analyzed with the variation of the dispersed phase,
thickener, and UV filter in the systems. From the analysis car-
ried out, it was determined that when the concentration of the
aforementioned substances was increased, the elastic modulus
also increased, which leads to several phase separation mech-
anisms being significantly inhibited in the system. Likewise,
the rheological and stable properties of each emulsion could be
related.
On the other hand, it was observed that the UV filter and the
thickener significantly affect the droplet size in the emulsions.
From the data, it was established that a higher concentration of
these agents considerably reduced the droplet diameter. In ad-
dition, it was determined that at higher concentrations of thick-
ening agent and UV protector, the delta backscattering values
decreased, which resulted in a significant increase in stabil-
Figure 18. Sensory chart bar for O/W diluted emulsions with 2.5% w/w ity. In this way, the analysis determined that the most influ-
carbopol + 1% w/w and 5% w/w UV agent. ential variable for stability in the systems is carbopol. However,
the presence of both agents probably promotes the sedimenta-
The addition of active ingredients as UV agent to formulations tion mechanism and the absence of thickener in the system
in visual terms generate more effects on sensory analysis than promotes creaming. Additionally, it was established that over
stability. For example, in the case of stability, it does not gen- time the stability of the systems was decreasing since the delta
erate such a significant impact compared to carbopol since the backscattering increased according to the tests that were de-
addition of the UV agent does increase the stability, but not veloped each week.
to a great extent. In sensory analysis, the UV agent increases
From the data obtained on the influence on the textural
consistency and makes a product "rougher" when applied to
properties, it was determined that the greater the dispersed
the skin (affirmation based on own experimentation). This
phase, the greater the spreadability in the emulsion, which ac-
change in consistency influences the hardness of the emul-
cording to the sensory criteria is one of the most important
sion, where the higher the amount of UV agent, the higher
conditions and taken into account when preparing emulsions.
the hardness value as illustrated in Figure 18 (keeping the
high-quality cosmetics. In addition, it is carried out in the tex-
amount of carbopol constant). Additionally, the compressivity-
ture tests that the lower the hardness the systems are easier
spreadability decreases to the point where it can be a bad ex-
to spread to the medium. On the other hand, concerning the
perience to apply the product, perhaps due to the formation of
adhesiveness parameter, it was evidenced that this has a direct
lumps in the case of 5% w/w UV agent. The results in the tex-
relationship with the viscosity of the emulsion. The more vis-
turometer confirm the sensory perception made by us and in
cous the emulsion, the greater the adhesiveness of the system.
the literature as in studies carried out by M. Fossa [11]. In addi-
For compressibility it could be determined that a lower amount
tion, with the previous conditions, as the viscosity and consis-
of dispersed phase has a lower resistance to deformation and,
tency of the emulsion change, the adhesiveness of the sample
therefore, the compressible parameter is high. Finally, it is
increases. These results can be seen visually in Figure 15 or the
suggested that the UV concentration be less than 5% w/w to
results in the texturometer in Figure 18.
avoid the formation of lumps in the sample. In our study it
Finally, from the results obtained in the textural parameters was possible to identify that an 40% w/w emulsion (1% w/w
for the systems, it was determined that the 40% w/w emulsion UV agent + 2.5% w/w thickener) meets the requirements of the
(1% w/w UV filter + 2.5% w/w carbopol) significantly adjusts to textural properties in the industry, since these systems must
the conditions and requirements proposed by the industry for consist of high spreadability, adhesiveness and a not very high
the design of O/W cosmetic emulsions [14]. This specific sys- value of hardness, although this parameter is proportional to
tem has adequate adhesiveness, which is of great importance the increase in stability in a cosmetic emulsion. It is of great
in the production of facial and body creams because the prod- importance to know all these aspects developed in this study,
ucts must adhere to the skin properly and for a considerably because they allow the timely analysis of decisions for the re-
long time. On the other hand, it was evidenced that the system spective formulation of emulsions in the cosmetic industry.
also has a high spreadability, which has a positive effect on the
main feeling that the consumer has when using it. The cos-
metic emulsion can be spread very easily, it covers the largest References
surface in the area of application. Finally, it was evidenced that
this emulsion mentioned above has a low hardness, which al- [1] C. WibowoDept and K. Ng. “Product-Oriented Process
lows it to have a high spreadability and adequate stability. In Synthesis andDevelopment: Creams and Pastes”. In:
this way, it was determined that this system at these condi- Process system engineering 47 (2001).
tions satisfies the sensory criteria applied by the cosmetic in-
dustry for products. The other emulsions are not chosen for a
consumer-industry relationship since the blanks samples have| 11
[2] M. Hill. “Product and Process Design for Structured [18] L. Gilbert et al. “Predicting sensory texture properties
Products”. In: American Institute of Chemical Engineers 50 of cosmetic emulsions by physical measurements”. In:
(2004). Chemometrics and Intelligent Laboratory Systems 124 (2013),
[3] F. Mendoza. “Análisis multiescala de propiedades aso- pp. 21–31.
ciadas a la estabilidad de emulsiones directas altamente [19] G. Wei Lu and P. Gao. “CHAPTER 3 - Emulsions and
concentradas”. In: Universidad de los Andes (2018). Microemulsions for Topical and Transdermal Drug De-
[4] I. Gómez. “Diseño Integrado Multiescala de Emulsiones livery”. In: Handbook of Non-Invasive Drug Delivery Sys-
Directas: Relación entre propiedades reológicas y textu- tems. Ed. by Vitthal S. Kulkarni. Personal Care Cosmetic
rales”. In: Universidad de los Andes (2019). Technology. Boston: William Andrew Publishing, 2010,
pp. 59–94. ISBN: 978-0-8155-2025-2.
[5] M. Rossano et al. “Effects of aging on structure and
stability of TiO2 nanoparticle-containing oil-in-water [20] T. Dapčević et al. “Influence of oil phase concentra-
emulsions”. In: International Journal of Pharmaceutics 461 tion on droplet size distribution and stability of oil-in-
(2014), pp. 89–96. water emulsions”. In: Eur. J. Lipid Sci. Technol 115 (2013),
pp. 313–321.
[6] S. De Souza and M. Bruschi. “Investigation of the
physicochemical stability of emulgels composed of [21] Khabza. Carbomer: Overview, Advantages, and Tips to Use.
poloxamer 407 and different oil phases using the Qual- Nov. 2019.
ity by Design approach”. In: Journal of Molecular Liquids [22] G. Pereira et al. “Study of the colloidal stability and opti-
331 (2021). cal properties of sunscreen creams”. In: Eclética Química
[7] M. Grecco and R. Dos Santos. “Thixotropic Behav- 44 (2019), pp. 26–36.
ior of Oil-in-WaterEmulsions Stabilized with Ethoxy- [23] T. Tadros. “Emulsion Formation and Stability”. In:
latedAmines at Low Shear Rates”. In: Chemical Engineer- Wiley-VCH, 2013.
ing and Technology 42 (2019), pp. 432–443. [24] M. Ortega. “Estudio del comportamiento reológico de un
[8] H. Stone et al. “Sensory Evaluation by Quantitative fluido biológico con diferentes niveles de colesterol”. In:
Descriptive Analysis”. In: Food Technology 28 (1974), Universidad Nacional Autónoma de México (2014).
pp. 24–34. [25] E. Gwartney, D. Larick, and E. Foegeding. “Sensory Tex-
[9] R. McMullen, M. Gorcea, and C. Susan. “Emulsions and ture and MechanicalProperties of Stranded and Particu-
their characterization by texture profile analysis”. In: lateWhey Protein Emulsion Gels”. In: Journal Food Sci-
Jan. 2014, pp. 131–154. ISBN: 13: 9781937235512. ence 69 (2004).
[10] C. Picard et al. “Rheological and textural characteriza- [26] C. Sun and S. Gunasekaran. “Effects of protein concen-
tion of cosmetic emulsions containing natural and syn- tration and oil-phase volume fraction on the stability
thetic polymers: relationships between both data”. In: and rheology of menhaden oil-in-water emulsions sta-
Colloids and Surfaces A: Physicochemical and Engineering As- bilized by whey protein isolate with xanthan gum”. In:
pects 421 (2013), pp. 150–163. Food Hydrocolloids 23 (2009), pp. 165–174.
[11] M. Fossa and M. Campos. “Influence of UV filters on [27] S. Lee et al. “Emulsification Properties of Lactose Fatty
the texture profile and efficacy of a cosmetic formu- Acid Esters”. In: Food and Nutrition Sciences 9 (2018),
lation”. In: International Journal of Cosmetic Science 39 pp. 1341–1357. ISSN: 2157-9458.
(2017), pp. 622–628. [28] “Front Matter”. In: Handbook of Formulating Dermal
[12] C. Picard, G. Savary, and E. Gore. “Spreading behavior of Applications. John Wiley Sons, Ltd, 2016. ISBN:
cosmetic emulsions: Impact of the oil phase”. In: Biotri- 9781119364221.
bology 16 16 (2018), pp. 17–24. [29] J. Gómez, D. Pradilla, and O. Álvarez. “A Multiscale Ap-
[13] D. Adefunke and K. Dodou. “Quantitative Sensory Inter- proach to the Design and Manipulation of Oil-in-Water
pretation of Rheological Parameters of a Cream Formu- Emulsion-Based Products”. In: International Journal of
lation”. In: School of Pharmacy and Pharmaceutical Sciences Chemical Engineering (2021).
(2019). [30] J. Pérez, M. Santos, and N. Zaritzky. “Aplicación del
[14] Y. Pérez. “Análisis comparativo de propiedades, textura biopolímero quitosano para la remediación de eflu-
y estabilidad de mayonesas comerciales”. In: Universidad entes líquidos emulsionados provenientes de la indus-
de Oviedo (2013). tria petrolera”. In: Facultad de Ingeniería - UNLP (2017).
[15] D. Pradilla, W. Vargas, and O. Alvarez. “The application [31] M. Suárez. “Análisis de la estabilidad temporal de
of a multi-scale approach to the manufacture of concen- una crema humectante por medio del estudio de sus
trated and highly concentrated emulsions”. In: Chemical propiedades fisicoquímicas”. In: Universidad de los Andes
Engineering Research and Design 95 (2015), pp. 162–172. (2019).
ISSN: 0263-8762. [32] J. Wang et al. “Emulsions stabilized by highly hy-
[16] P. Kowalczuk and J. Drzymala. “Physical Meaning of drophilic TiO2 nanoparticles via van der Waals attrac-
the Sauter Mean Diameter of Spherical Particulate Mat- tion”. In: Journal of Colloid and Interface Science 589
ter”. In: Particulate Science and Technology 34 (Oct. 2015), (2021), pp. 378–387.
pp. 645–647. [33] M. Rossano et al. “Effects of aging on structure and
[17] M. Luo et al. “Heteroaggregation of CeO2 and TiO2 engi- stability of TiO2 nanoparticle-containing oil-in-water
neered nanoparticles in the aqueous phase: Application emulsions”. In: International Journal of Pharmaceutics 61
of turbiscan stability index and fluorescence excitation- (2014), pp. 89–96.
emission matrix (EEM) spectra”. In: Colloids and Sur- [34] M. Karsheva, S. Georgieva, and S. Alexandrova. “Rhe-
faces A: Physicochemical and Engineering Aspects 533 (2017), ological behavior of sun protection compositions dur-
pp. 9–19. ISSN: 0927-7757. ing formulation”. In: Korean J. Chem. Eng 29 (2012),
pp. 1806–1811.12 |
Annexes
Annex 1:
Delta backscattering curves: Blanks
WEEK 0 WEEK 3
WEEK 4 WEEK 5
Figure 19. Backscattering weekly results for O/W diluted blanks emulsions.| 13
Annex 2:
Delta backscattering curves: Thickening agent influence
WEEK 0 AND 5 WEEK 0 AND 5
WEEK 3 AND 4 WEEK 3 AND 4
WEEK 3 AND 4 WEEK 3 AND 4
Figure 20. Backscattering weekly results for O/W diluted emulsions.14 |
Annex 3:
Delta backscattering curves: UV agent influence
WEEK 3 WEEK 4
WEEK 3 WEEK 4
Figure 21. Backscattering weekly results for O/W diluted emulsions.You can also read