Development of Driver Posture Prediction and Accommodation Models for Military Vehicles: Fixed-Eye-Point, Out-of-Hatch, and Highly Reclined Driver ...
←
→
Page content transcription
If your browser does not render page correctly, please read the page content below
DISTRIBUTION A. Approved for public release; distribution unlimited. OPSEC#4597

Development of Driver Posture Prediction and
Accommodation Models for Military Vehicles:
  Fixed-Eye-Point, Out-of-Hatch, and Highly
       Reclined Driver Configurations

                                 Matthew P. Reed
                                  Sheila M. Ebert

      University of Michigan Transportation Research Institute

                                     Final Report

                                   UMTRI-2020-5

                                    February 2020

                                              i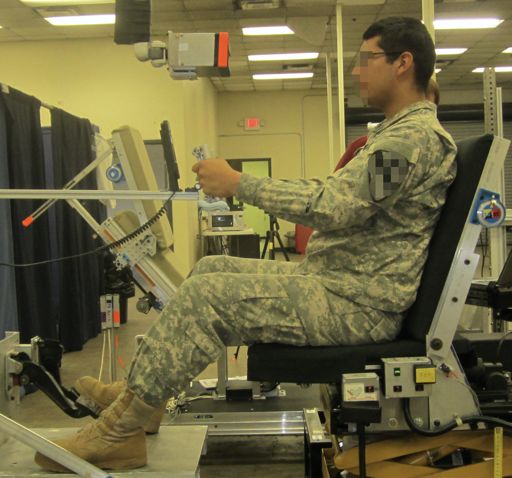
DISTRIBUTION A. Approved for public release; distribution unlimited. OPSEC#4597

Technical Report Documentation Page
 1. Report No.                                 2. Government Accession No.                           3. Recipient's Catalog No.
 UMTRI-2020-5
4. Title                                                                                            5. Report Date
Development of Driver Posture Prediction and Accommodation Models for
Military Vehicles: Fixed-Eye-Point, Out-of-Hatch, and Highly Reclined
                                                                                                    6. Performing Organization Code
Driver Configurations
7. Author(s)                                                                                        8. Performing Organization Report No.
Reed, M.P. and Ebert, S.M.                                                                          UMTRI-2020-5
9. Performing Organization Name and Address                                                         10. Work Unit No. (TRAIS)
University of Michigan Transportation Research Institute
2901 Baxter Rd.                                                                                     11. Contract or Grant No.
Ann Arbor MI 48109
12. Sponsoring Agency Name and Address                                                              13. Type of Report and Period Covered

                                                                                                    14. Sponsoring Agency Code

15. Supplementary Notes

16. Abstract
Accurate information on warfighter posture and position is essential for the design of military vehicles for safety
and effectiveness. In prior work, posture measurements from soldiers were used to develop statistical posture-
prediction and accommodation models for drivers in fixed-heel-point configurations and fixed-position squad
seats. In the current study in the series, soldiers were measured in mockups of three driver seating configurations:
fixed eye point, out of hatch, and highly reclined. In each configuration, soldiers adjusted certain components to
obtain a comfortable driving posture, which was measured by recording the three-dimensional locations of body
landmarks. Data were gathered with three ensembles: advanced combat uniform (ACU), body armor vest and
helmet (PPE level), and with the addition of a simulated rifleman kit. Internal joint center locations were
estimated from surface landmarks. Statistical posture-prediction models were developed using regression analysis
to predict the locations of important landmarks, such as the hip joint centers, eyes, and knees. Population
accommodation models were developed using standard parametric techniques. These models generate surface
contours that can be used in design to accommodate a desired percentage of a vehicle occupant population. The
models take into account the effects of population anthropometry, clothing and gear ensemble, and vehicle
configuration. Contours were generated for eye location, seat position, pedal location, steering yoke location,
helmet clearance, elbow clearance, knee clearance, and torso clearance.

17. Key Word                                                                  18. Distribution Statement
anthropometry, vehicle seats, posture, seat index point, H-
point, human accommodation reference point
 19. Security Classif. (of this report)             20. Security Classif. (of this page)                     21. No. of Pages     22. Price
            DIST A: Public Release                                                                                      74
Form DOT F 1700.7 (8-72)                  Reproduction of completed page authorized

                                                                          i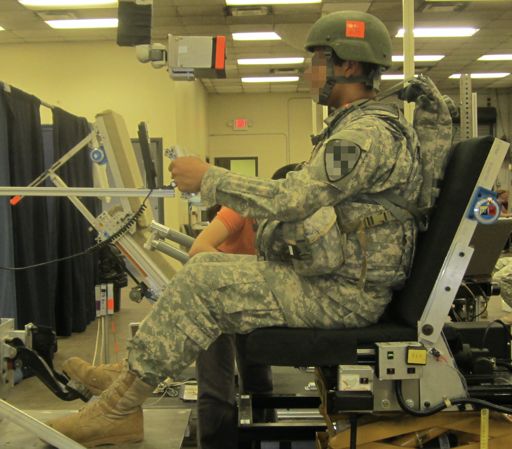
DISTRIBUTION A. Approved for public release; distribution unlimited. OPSEC#4597

                                             Metric Conversion Chart
                                APPROXIMATE CONVERSIONS TO SI UNITS
SYMBOL                       WHEN YOU KNOW    MULTIPLY        TO FIND                                   SYMBOL
                                                 BY
                                                       LENGTH
    In                inches                            25.4                millimeters                 mm
    Ft                feet                              0.305               meters                      m
   Yd                 yards                             0.914               meters                      m
   Mi                 miles                             1.61                kilometers                  km
                                                         AREA
      2
    in                squareinches      645.2                  square millimeters                       mm2
    ft2               squarefeet        0.093                  square meters                            m2
   yd2                square yard       0.836                  square meters                            m2
   Ac                 acres             0.405                  hectares                                 ha
         2
   mi                 square miles      2.59                   square kilometers                        km2
                                                       VOLUME
              fl oz                  fluid 29.57                   milliliters             mL
                                     ounces
                 gal                 gallons 3.785                 liters                  L
                     3
                 ft                  cubic    0.028                cubic meters            m3
                                     feet
              yd3                    cubic    0.765                cubic meters            m3
                                     yards
NOTE: volumes greater than 1000 L shall be shown in m3
                                                         MASS
              oz                   ounces      28.35                          grams         g
              lb                   pounds      0.454                          kilograms     kg
                 T                 short       0.907                          megagrams Mg (or "t")
                                   tons                                       (or "metric
                                   (2000                                      ton")
                                   lb)
                                           TEMPERATURE (exact degrees)
             o                                                                                  o
                 F               Fahrenheit            5 (F-32)/9            Celsius                C
                                                       or (F-32)/1.8
                                        FORCE and PRESSURE or STRESS
             lbf                poundforce 4.45                                           newtons       N

                                                                                                              2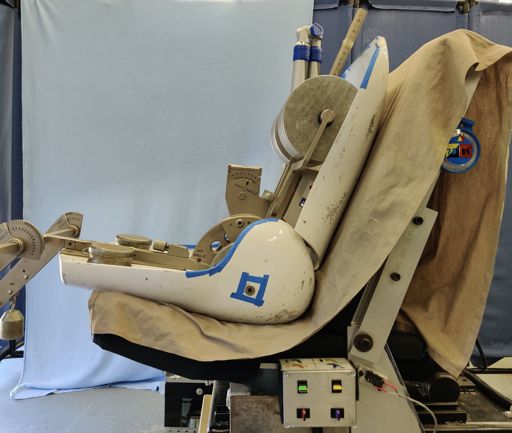
DISTRIBUTION A. Approved for public release; distribution unlimited. OPSEC#4597

      lbf/in2                 poundforce 6.89                                  kilopascals kPa
                              per square
                              inch
                                                    LENGTH
          mm                 millimeters           0.039                    inches in
              m              meters                3.28                     feet      ft
              m              meters                1.09                     yards yd
          km                 kilometers            0.621                    miles mi
                                                     AREA
               2
      mm                square             0.0016                          square      in2
                        millimeters                                        inches
          m2            square meters      10.764                          square      ft2
                                                                           feet
          m2            square meters      1.195                           square      yd2
                                                                           yards
          ha            hectares           2.47                            acres       ac
               2
      km                square             0.386                           square      mi2
                        kilometers                                         miles
                                                    VOLUME
     mL             milliliters                   0.034              fluid ounces          fl oz
      L             liters                        0.264              gallons               gal
          3
     m              cubic meters                  35.314             cubic feet            ft3
     m3             cubic meters                  1.307              cubic yards           yd3
                                                      MASS
          g            grams                0.035                        ounces              oz
      kg               kilograms            2.202                        pounds              lb
  Mg (or "t")          megagrams (or        1.103                        short tons          T
                       "metric ton")                                     (2000 lb)
                                       TEMPERATURE (exact degrees)
      o                                                                                          o
          C          Celsius                    1.8C+32               Fahrenheit                     F
                                      FORCE and PRESSURE or STRESS
     N             Newtons                   0.225                      poundforce                   lbf
    kPa            Kilopascals               0.145                      poundforce per lbf/in2
                                                                        square inch

*SI is the symbol for the International System of Units. Appropriate rounding should be
made to comply with Section 4 of ASTM E380.
(Revised March 2003)

                                                                                                           3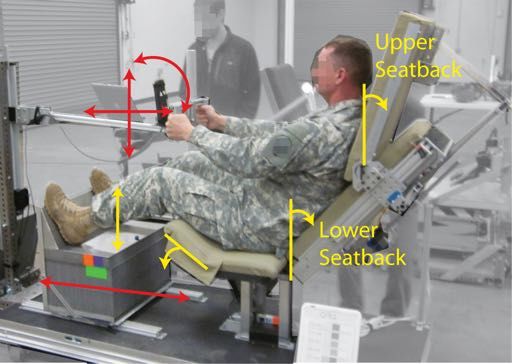
DISTRIBUTION A. Approved for public release; distribution unlimited. OPSEC#4597

                                 ACKNOWLEDGMENTS

This research was supported by the Automotive Research Center (ARC) at the University
of Michigan under agreement W56H2V-14-2-0001 with the US Army Tank Automotive
Research, Development, and Engineering Center (TARDEC) in Warren, MI. We thank
our colleagues Gale Zielinski and Frank Huston of the Ground Vehicle Systems Center,
who collaborated on all aspects of the project. We also thank Bruce Bradtmiller, Michael
Mucher, and Patricia Barrientos from Anthrotech for their assistance with data collection.
Our data collection would not have been possible without the generous assistance of Fred
Corbin and the Soldier volunteers at Fort Hood.

                                                                                            4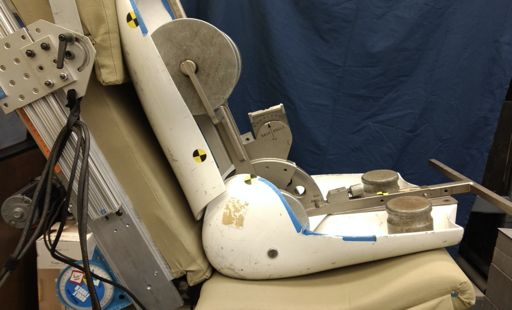
DISTRIBUTION A. Approved for public release; distribution unlimited. OPSEC#4597

                                                       CONTENTS

ACKNOWLEDGMENTS ...................................................................................................4

ABSTRACT.........................................................................................................................6

INTRODUCTION ...............................................................................................................7

METHODS ..........................................................................................................................8

RESULTS: POSTURE PREDICTION MODELS ............................................................28

RESULTS: POPULATION ACCOMMODATION MODELS ........................................46

DISCUSSION ....................................................................................................................59

REFERENCES ..................................................................................................................60

APPENDIX A ....................................................................................................................61
APPENDIX B ....................................................................................................................63
APPENDIX C ....................................................................................................................66
APPENDIX D ....................................................................................................................72

                                                                                                                                5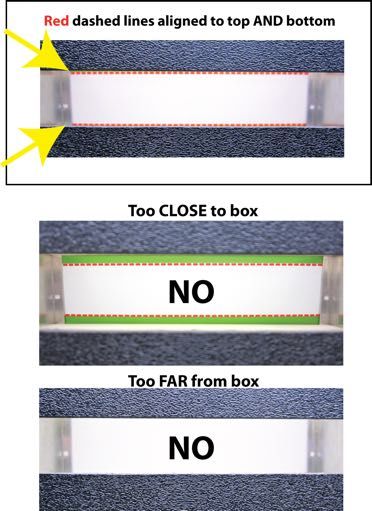
DISTRIBUTION A. Approved for public release; distribution unlimited. OPSEC#4597

                                         ABSTRACT

Accurate information on warfighter posture and position is essential for the design of
military vehicles for safety and effectiveness. In prior work, posture measurements from
Soldiers were used to develop statistical posture-prediction and accommodation models
for drivers in fixed-heel point configurations and fixed-position squad seats. In the
current study in the series, Soldiers were measured in mockups of three driver seating
configurations: fixed eye point, out of hatch, and highly reclined. In each configuration,
Soldiers adjusted certain components to obtain a comfortable driving posture, which was
measured by recording the three-dimensional locations of body landmarks. Data were
gathered with three ensembles: advanced combat uniform (ACU), body armor vest and
helmet (PPE level), and with the addition of a simulated rifleman kit. Internal joint center
locations were estimated from surface landmarks. Statistical posture-prediction models
were developed using regression analysis to predict the locations of important landmarks,
such as the hip joint centers, eyes, and knees. Population accommodation models were
developed using standard parametric techniques. These models generate surface contours
that can be used in design to accommodate a desired percentage of a vehicle occupant
population. The models take into account the effects of population anthropometry,
clothing and gear ensemble, and vehicle configuration. Contours were generated for eye
location, seat position, pedal location, steering yoke location, helmet clearance, elbow
clearance, knee clearance, and torso clearance.

                                                                                            6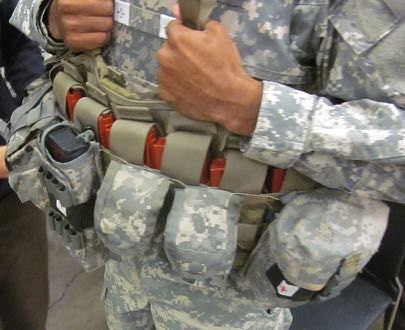
DISTRIBUTION A. Approved for public release; distribution unlimited. OPSEC#4597

INTRODUCTION

Driver accommodation models provide quantitative guidance for vehicle design by
predicting the distribution of driver-selected seat position and eye location, among other
variables. Designers use these models to select component adjustment ranges that
accommodate a large percentage of drivers and to ensure visibility within and outside of
the vehicle.

This report is one of a series documenting research to develop modern human-centered
design tools for military vehicles. For each project, we have gathered posture, position, and
adjustment data from Soldiers sitting in mockups of vehicle interior environments. The
data are analyzed to develop statistical models predicting posture and accommodation
requirements for individuals and populations as a function of Soldier and vehicle
characteristics.

The current report focuses on driver workstations with three configurations: a fixed eye
point, an out-of-hatch posture with a high seat height, and highly reclined postures. Most
conventional vehicle designs have fixed pedals and a highly adjustable seat, possibly with
an adjustable steering wheel. These fixed-heel workstations were addressed previously
(Zerehsaz et al. 2014a). Fixed-eye-point (FEP) designs are increasingly relevant for
scenarios in which drivers are fully under armor, driving using optical systems (e.g.,
periscopes) or camera-based systems with screen displays. Out-of-hatch (OOH) postures
are used in low-threat conditions when high levels of exterior vision are beneficial. OOH
conditions are typically encountered in adaptable driving positions that also include a
fixed-heel or fixed-eye driving condition. Highly reclined seating (HRS) is relevant for
some current combat vehicles and may be increasingly relevant for driving configurations
in other vehicles that are fully under-armor.

The data for the current study were gathered from Soldiers at Fort Hood, Texas. Trained
investigators obtained standard anthropometric dimensions and measured body landmark
locations as the Soldiers sat in a range of configurations in each mockup. The data were
analyzed using statistical techniques developed in earlier work to produce posture-
prediction and population accommodation models. The posture-prediction models give
the most likely component adjustments, body landmark locations, and segment
orientations as function of Soldier body dimensions and the vehicle layout. These models
are used to posture human figure models that represent Soldiers of specific sizes. The
population accommodation models are based on the same analysis but incorporate the
population variance to produce statistical representations of the boundaries of Soldier
preferences for component adjustment ranges as well as space claim for the head, torso,
knees, and elbows. Population accommodation models are used to assess current designs
and as design guidance for future vehicles.

                                                                                            7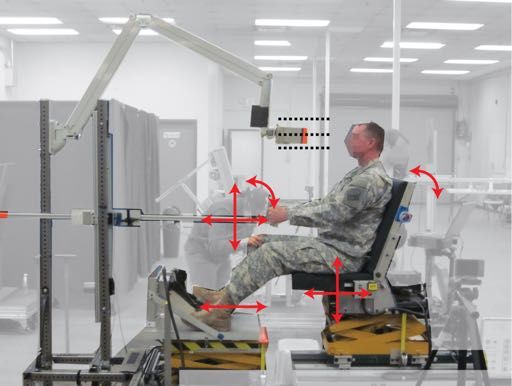
DISTRIBUTION A. Approved for public release; distribution unlimited. OPSEC#4597

METHODS

Human Research Approval

The study protocol was approved by a University of Michigan Institutional Review Board
and by the USAMRMC Office of Research Protections Human Research Protection
Office (HRPO). Written informed consent was obtained from each participant.

Data Collection Site

The Army provided access to facilities at Fort Hood, Texas. The equipment, which was
developed and fitted at UMTRI, was shipped to the base and set up by UMTRI and
Anthrotech staff. Data collection was conducted September through November 2014.
Soldiers were invited to participate by local personnel at each base. By design, the subject
pool was not recruited to match a particular profile. Rather this convenience sample was
intended to provide a broad range of human variability that is not necessarily
representative of any particular part of the Army. The analysis methods enable the results
to be tailored to any desired component of the current or future Army.

Standard Anthropometry

Anthropometric data were gathered from each Soldier to characterize overall body size
and shape following the procedures documented in Hotzman et al. (2011) for the ANSUR
II survey. Standard anthropometric measures were obtained using manual measurements.
The measurements included the core subset of dimensions gathered in ANSUR II.
Table 1 lists the dimensions along with their corresponding identification in ANSUR II.
All measurements were obtained with the Soldiers wearing their PT shorts, except that
stature was measured with and without boots to characterize heel height. Tables 2-4 list
summary statistics for selected anthropometric dimensions for Soldiers measured in each
of the three mockups.

                                                                                            8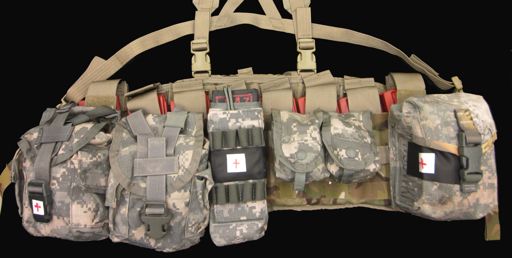
DISTRIBUTION A. Approved for public release; distribution unlimited. OPSEC#4597

                                                Table 1
                                   Standard Anthropometric Measures

        Measurement                                                Posture            ANSUR II
1       Weight                                                                           6.4.92
2       Tragion to Top of Head                                     Sitting               6.4.83
3       Head Length                                                Sitting               6.4.48
4       Head Breadth                                               Sitting               6.4.46
5       Erect Sitting Height                                       Sitting               6.4.72
6       Eye Height                                                 Sitting               6.4.35
7       Acromial Height                                            Sitting          6.4.2 (standing)
8       Knee Height                                                Sitting               6.4.58
9       Popliteal Height                                           Sitting               6.4.67
10      Acromial Breadth                                           Sitting               6.4.9
11      Bideltoid Breadth                                          Sitting               6.4.12
12      Maximum Hip Breadth                                        Sitting               6.4.52
13      Buttock-Knee Length                                        Sitting               6.4.20
14      Buttock-Popliteal Length                                   Sitting               6.4.21
15      Acromion – Radiale Length                                  Sitting          6.4.3 (standing)
16      Forearm – Hand Length                                      Sitting         6.4.41 (standing)
17      Stature Without Boots                                      Standing              6.4.76
18      Stature With Boots                                         Standing
19      Chest Circumference (max anterior pt)                      Standing              6.4.25
20      Waist Circumference at Omphalion                           Standing              6.4.88
21      Hip Circumference at Buttocks                              Standing              6.4.17
22      Bispinous Breadth                                          Standing

                                            Table 2
                    Anthropometry Summary, Fixed-Eye-Point (60 men, 19 women)

                Variable               Min            Mean              SD             Max
     Stature                           1519            1712            93.3            1941
     Weight (kg)                       43.9            76.8            15.1           128.8
     BMI (kg/m2)                        19             26.0             3.5            35.8
     Age (yr)                           19             24.1             4.4             39

                                                                                                       9
DISTRIBUTION A. Approved for public release; distribution unlimited. OPSEC#4597
Table 3
Anthropometry Summary, Out-of-Hatch (37 men, 12 women)
Variable Min Mean SD Max
Stature 1519 1708 77.0 1849
Weight (kg) 43.9 76.9 13.6 111.7
BMI (kg/m2) 19 26.3 3.7 33.7
Age (yr) 19 24.3 4.6 39
Table 4
Anthropometry Summary, Highly Reclined Seating (41 men, 12 women)
Variable Min Mean SD Max
Stature 1542 1711.6 84.1 1918
Weight (kg) 49.3 77.0 15.4 128.8
BMI (kg/m2) 20.3 26.1 4.0 35.8
Age (yr) 19 23.9 4.4 39
Ensemble Levels and Fitting
Testing was conducted in three ensemble levels selected to be the same as those used in
the earlier study with fixed-heel-point conditions. Figure 1 shows the three ensemble
levels. At the ACU level, Soldiers wore their own advanced combat uniform consisting
of a jacket, trousers, moisture wicking shirt and brown combat boots. All items were
removed from the pockets, extra padding removed from the knees, and any cap or helmet
removed. At the PPE (personal protective equipment) level, Soldiers wore an Improved
Outer Tactical Vest (IOTV) with Enhanced Small Arms Protective Insert (ESAPI) plates,
Enhanced Side Ballistic Inserts (ESBI), and an Advanced Combat Helmet (ACH) over
their ACU ensemble. Five sizes of IOTV were available at the study site. Examples are
shown in Figures 2-4. The Soldiers were given their self-reported sizes of helmet and
IOTV with front, back and side plates. The investigator helped the Soldier don the PPE
and checked the fit. The fit was considered acceptable if (1) the elastic waistband of the
IOTV was snug with the Velcro closure fully overlapped and (2) the bottom of the IOTV
was located below the navel and above the belt. The Soldiers wore the smallest size
helmet in which the Soldier’s head was in contact with the padding on the inside of the
top of the helmet.
The third level of gear was referred to as body-born gear (BBG) or encumbered (ENC),
which consisted of ACU, PPE, a hydration pack, and a Tactical Assault Panel (TAP).
Note that BBG/ENC is nominally identical to the rifleman ENC condition used in the
earlier study.
10DISTRIBUTION A. Approved for public release; distribution unlimited. OPSEC#4597
Figure 1. The three ensemble levels, from left: ACU, PPE, and BBG (ENC).
The TAP is an adaptable platform intended to replace the Fighting Load Carrier (FLC)
vest to allow for quick release of equipment in emergency situations (Figures 5 and 6).
The TAP is designed to carry a variety of basic Modular Lightweight Load-Carrying
Equipment (MOLLE) fighting load pouches. The TAP was equipped with a harness that
went over the head and around the sides. A CamelBak-style hydration system (Figure 5),
filled with 2.5 L of water, was attached to the back. The rifleman’s TAP represents the
load of a rifleman or driver of a transport vehicle. This ensemble includes a
communications radio. Table 5 lists the items carried in the TAP. Targets were applied to
the helmet and IOTV to facilitate tracking during testing (Figures 7 and 8). The locations
of these targets were recorded in trials in which this gear was present.
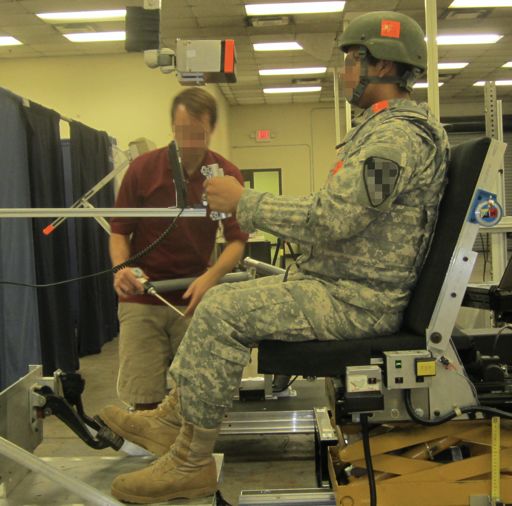
Figure 2. Soldier in his ACU selecting IOTV
11DISTRIBUTION A. Approved for public release; distribution unlimited. OPSEC#4597
Figure 3. Testing IOTV fit and Soldier tightening ACH and checking size
Figure 4. Participant in BBG (ENC) ensemble.
12DISTRIBUTION A. Approved for public release; distribution unlimited. OPSEC#4597
Figure 5. TAP and hydration close up
Figure 6. TAP laid flat.
Table 5
Inventory of Equipment in Rifleman BBG (ENC)
Item Count
Replica M16 magazine clips 8
Replica Multiband Inter/Intra Team Radio (MBITR) 1
Replica fragmentation grenade 2
Multipliers 1
Canteen case with weight of night vision goggles added 1
Improved first aid kit (IFAK) 1
TAP with pouches 1
13DISTRIBUTION A. Approved for public release; distribution unlimited. OPSEC#4597
Figure 7. ACH with reference points and interior with pads configuration tested
Figure 8. IOTV with reference points
Participant Interaction Scripts
Appendix A lists the participant interaction scripts for each mockup. These interaction
scripts ensured that each participant received the same information and instructions.
14DISTRIBUTION A. Approved for public release; distribution unlimited. OPSEC#4597
Mockups and Test Conditions
Fixed Eye Point (FEP)
The mockup shown in Figure 9 was fabricated for this data collection. The vertical and
horizontal seat position was adjustable using motorized controls. The seat back angle
could also be adjusted, and the seat cushion angle was fixed at 6 degrees (SAE A27). The
floor height was set to three different levels, depending on the test condition (see below).
The pedal and floor assembly could be moved fore-aft with a motorized control. A
steering yoke was mounted on a motorized support that could be moved fore-aft and
vertically.
Figure 9. FEP mockup. Red arrows show motorized adjustment ranges available to participant.
The seat Human Accommodation Reference Point (HARP) was measured using the SAE
J826 H-point machine (Figure 10). Note that the seat back angle in the mockup seat is
taken to be equal to be the angle of the undeflected surface of the seat back with respect
to vertical, which is equivalent to the H-point manikin torso angle when installed at
midrange positions. The HARP was measured with the seat back angle at 17 degrees.
15DISTRIBUTION A. Approved for public release; distribution unlimited. OPSEC#4597
Figure 10. Measuring the Human Accommodation Reference Point location in the FEP seat with the SAE
J826 H-point machine.
The mockup was intended to simulate a situation in which the driver of a military ground
vehicle needed to adjust the seat to attain an eye location in a narrow zone, such as when
driving with an indirect vision system. Such a system was simulated by using a
rectangular box shown in Figures 11 and 12. The front of the box (toward the subject)
was partially open so that the subject could see through to the back of the box. When the
participant was in the correct fore-aft and vertical position, the lines on the back of the
box were lined up with the edges of the front opening. Figure 12 shows the instructions to
the subject. Participants adjusted the seat position (fore-aft and vertical) and seat back
angle to place their eyes in the correct location.
Figure 11. Soldier positioning himself to the FEP.
16DISTRIBUTION A. Approved for public release; distribution unlimited. OPSEC#4597
Figure 12. Illustration to subjects for obtaining proper alignment to FEP fixture.
Table 6 lists the five test conditions with FEP, which were differentiated by the FEP
height above the floor and gear (ensemble) level. The FEP height above the floor was set
to produce a range of seat heights for each subject. Because the vertical offset between
the seat and the eye is strongly determined by body size, using fixed FEP heights above
the floor would mean that taller subjects would experience lower seat heights. To ensure
that all subjects experienced a similar range of seat heights, and to permit the testing to be
conducted with a relatively narrow range of both seat and floor height adjustment, a
posture prediction model from an earlier study (Reed and Ebert 2013) was used to choose
the low, medium, and high FEP settings for each subject.
Table 6
FEP Condition Matrix
Condition FEP Height
Gear Level
Number Above Floor
C02 Med BBG (ENC)
C09 Med PPE
C10 Low PPE
C11 High PPE
C16 Med ACU
17DISTRIBUTION A. Approved for public release; distribution unlimited. OPSEC#4597
The test conditions targeted a nominal seat height (HARP above heel) of 300, 425, and
550 mm. The eye height above HARP was predicted from the subject’s body dimensions
as:
EyeReHARPZ = –816 + 0.411*Stature+29*ln(BMI)+1262*SH/S
where Stature is erect standing height in mm, ln(BMI) is the natural log of the body mass
index (body mass in kg divided by stature in meters squared), and SH/S is the ratio of
erect sitting height to stature. [Note that this equation was used to set test conditions and
is not an outcome of the current study.]
A typical value of EyeReHARPZ for a midsize male is 654 mm. This value was added to
the target seat height for each condition to obtain the desired FEP above AHP. These
values were achieved by both changing the height of the heel surface and raising or
lowering the eye box (see Figures 13 and 14).
Figure 13. FEP at three settings of FEP above the floor, from left: low (C10), mid (C09), high (C11)
Figure 14. FEP set to mid height at three ensemble levels, from left: ACU (C16), PPE (C09), and ENC (C02)
Out of Hatch (OOH)
The FEP mockup was adapted for the OOH configurations. The goal in these conditions
was to obtain data on postures for Soldiers sitting on a high seat with their torsos
essentially upright. To obtain a sufficient range of postures for all participants, the seat
18DISTRIBUTION A. Approved for public release; distribution unlimited. OPSEC#4597
height was adjusted based on each participant’s body dimensions, according to these
equations:
Effective Leg Length (LL) = Stature without shoes – erect sitting height
Mid seat height (LP) = 0.95 * LL
Lower seat height (LP- offset) = 0.878 * LL
Higher seat height (LP- offset) = 1.022 * LL
The seat back angle was set to 5 degrees (fixed) for all OOH conditions. Testing was
conducted at three seat heights with PPE and only at the middle seat height (LP) with
ACU and ENC (Table 7). The steering yoke was fully adjustable up/down/tilt, and the
position of the yoke was an outcome measure as in the other driving configurations in
this study. In addition to the Soldier-selected (preferred) yoke position, the Soldier also
demonstrated the lowest comfortable position for the yoke (Figure 15). After the
participant had selected a comfortable driving posture with the steering yoke, the
investigator interactively placed a “pedal” block at the Soldier’s preferred right-foot
position to simulate an accelerator pedal. Figures 16 and 17 show the test conditions.
Table 7
Condition Matrix for Out-of-Hatch
Condition Seat Height Gear
Number SAE H30 (mm) Level
C01 LP ENC
C12 LP PPE
C13 LP + Offset PPE
C14 LP - Offset PPE
C15 LP ACU
19DISTRIBUTION A. Approved for public release; distribution unlimited. OPSEC#4597
Figure 15. Out-of-hatch condition with two yoke positions: preference (left) and lowest possible when able
to complete a quarter turn with both hands on the yoke.
Figure 16. Out-of-hatch conditions at three different seat heights as a proportion of leg length from lowest to highest
seat height (C14, C12, C1) from left to right.
20DISTRIBUTION A. Approved for public release; distribution unlimited. OPSEC#4597
Figure 17. Out-of-hatch conditions with three levels of garb ACU(C15), PPE (C12) and ENC (C01) from left to right.
Highly Reclined Seating (HRS)
Figure 18 shows the mockup used for the highly reclined configurations. The HARP was
established using the SAE J826 H-point was measured with the seat back at 30 degrees
(Figure 19); this point was used as the HARP for all conditions. The aft part of the two-
part seat pan was fixed in position and the angle of the forward part (under the thighs)
was adjusted with the seat back angle. The height and fore-aft position of the foot plate
could be adjusted manually. The upper portion of the seat back was fixed relative to the
lower portion. These two sections pivoted as a unit around a location aft of the pan to
provide back angle adjustment.
21DISTRIBUTION A. Approved for public release; distribution unlimited. OPSEC#4597
Figure 18. Highly reclined seat in which the Soldier positioned the foot platform fore-aft and the steering yoke up-
down, fore-aft and tilt.
Figure 19. Measuring HARP location using the SAE J826 H-point machine in the HRS mockup.
Figures 20-22 and Table 8 show the test conditions. Testing was conducted at three seat
back angles (angle of the lower portion of the seat back at 30, 40, and 50 degrees to
vertical). At the middle seat back angle, data were gathered with three seat heights. All
data were gathered at the PPE ensemble level, except that the condition with the middle
seat back angle and highest seat height was repeated with ACU only.
22DISTRIBUTION A. Approved for public release; distribution unlimited. OPSEC#4597
Figure 20. Highly reclined seat at three levels of garb ACU (C18), PPE (C04), ENC (C03)
Figure 21. Highly reclined seat at three seat heights 100 mm (C05), 150 mm (C04) and 200 mm (C06)
Figure 22. Highly reclined seat at three back angles 30˚ (C08), 40˚ (C04), 50˚ (C07)
23DISTRIBUTION A. Approved for public release; distribution unlimited. OPSEC#4597
Table 8
Condition Matrix for Highly Reclined Seat
Seat Back Seat Pan*
Angle Angle
Condition Re Vertical Re Horizontal Seat Height†
Number (deg.) (deg.) (mm) Gear Level
C03 40 35 150 ENC (no Camelbak)
C04 40 35 150 PPE
C05 40 35 100 PPE
C06 40 35 200 PPE
C07 50 40 150 PPE
C08 30 30 150 PPE
C18 40 35 200 ACU
* Front portion of pan under distal thighs.
† HARP above heel surface
Landmark Data
In each condition, the FARO Arm coordinate digitizer was used to record the three-
dimensional location of the landmarks and reference points listed in Table 9.
24DISTRIBUTION A. Approved for public release; distribution unlimited. OPSEC#4597
Table 9
Landmarks and Reference Points Recorded in Mockups
C7 (Cervicale) Most Forward Point on Torso
Back Of Head/Helmet Max Rearward Most Lateral Point on Torso (Right)
Top Of Head/Helmet Max Height Most Lateral Point on Thigh (Right)
Tragion (Right)
Ectoorbitale (Right) On PPE and ENC
Infraorbitale at Pupil Center (Right) Helmet (3 Reference Points)
Glabella IOTV (3 Reference Points)
Top of Hand Grip (Right) TAP (3 Reference Points)
Ulnar Styloid Process (Right) Camelbak (3 Reference Points)
Lateral Humeral Epicondyle (Right)
Anterior-Superior Acromion (Right) On Equipment or Mockup
Suprasternale (if reachable) Faro Arm Cart (3 Reference Points)
Substernale (if reachable) Mockup Platform (3 Reference Points)
ASIS (Right and Left) Seat Cushion (2 Reference Points)
Estimate of Greater Trochanter (Right) Seat Back (2 Reference Points)
Back of Pelvis Compressed (Right) Pedal (2 Reference Points)
Lateral Femoral Epicondyle (Right) Foot Platform Height Point
Suprapatella (Right and Left) Yoke (Center, Top and Bottom)
Infrapatella (Right)
Lateral Ball of Foot (Right) Condition Specific
Lateral Malleolus (Right) OOH: Yoke in lower position (center, top and bottom)
Heel (Bottom edge of sole at midline, Right) HRS: Upper Seat Back (2 Reference Points)
Toe (Bottom edge of sole, longest shoe point, FEP: Fixed-Eye-Point Box (3 Reference Points)
Right)
Laboratory Hard Seat
Data were also gathered from each participant in the laboratory hard seat shown in
Figure 23. This seat allows posterior landmarks on the spine and pelvis to be measured
along with the anterior landmarks that are accessible in the mockup seat. In the hard seat,
participants wore athletic shorts and no shirt to facilitate landmark identification and
measurement. The landmarks measured in the hard seat (Table 10) include a subset of
those measured in the mockup in addition to a set of posterior spine and pelvis
landmarks.
25DISTRIBUTION A. Approved for public release; distribution unlimited. OPSEC#4597
Figure 23. Hard seat
26DISTRIBUTION A. Approved for public release; distribution unlimited. OPSEC#4597
Table 10
Landmarks and Reference Points Recorded in Hard Seat
Back Of Head (max rearward) Acromion (Right and Left)
Top Of Head (Vertex) Lateral Humeral Epicondylel (Left)
Tragion (Left) Medial Humeral Epicondyle (Left)
Ectoorbitale (Left) Ulnar Styloid Process (Left)
Infraorbitale at Pupil Center (Left) Radial Sytloid Process (Left)
Glabella Suprasternale
Menton Substernale
Lateral Femoral Epicondyle (Right and Left) C7 (Cervicale)
Medial Femoral Epicondyle (Right and Left) T4
Suprapatella (Right and Left) T8
Infrapatella (Right and Left) T12
Medial Malleolus (Left) L1
Ball of Foot Medial (Left) L2
Toe, Longest Tibiale (Left) L3
Ball of Foot Lateral (Left) L4
Lateral Malleolus (Left) L5
Heel (Left)
ASIS (Right and Left) Hard Seat Platform (3 Reference Points)
PSIS (Right and Left) Faro Arm Cart (3 Reference Points)
Dependent Measures
The calculation of dependent measured followed the methods in Reed and Ebert (2013).
In brief, the hard seat data were used to estimate joint center locations in the spine, pelvis,
and extremities to create a subject-specific kinematic linkage. This information was used
with the landmarks obtained in the mockup conditions to estimate joint center locations.
Statistical analyses were conducted using linear regression to estimate the location of
important body landmarks and mockup components as a function of anthropometric and
mockup variables. These methods followed those used in previous work (Reed and Ebert
2013). In particular, potential predictors were included if they were statistically
significant with pDISTRIBUTION A. Approved for public release; distribution unlimited. OPSEC#4597
RESULTS: POSTURE PREDICTION MODELS
Fixed Eye Point (FEP)
Prior to statistical modeling, all of the data were expressed relative to the eye location
measured in the trial. Consequently, the results neglect any variability in eye location due
to adjustment or posture differences.
Tables 11 and 12 list the regression models computed from the landmark and joint-center
data. The full model is obtained by multiplying the coefficients by the predictors and
summing together with the intercept. X positive rearward of the eye location, Z is
positive above. To facilitate application to accommodation modeling, the fore-aft
accelerator heel point location (AHPX) is predicted as a function of seat height above the
heel surface. Because the seat (and hip) location relative to the eye location is
independent of the vertical offset between the heel and eye (the variable manipulated in
the test matrix), the test conditions were effectively varying seat height. When predicting
posture for individual Soldiers, the HARPZ is first predicted followed by AHPX. For
accommodation models, the input for predicting the distribution of AHPX is the mean
seat height (see Accommodation Models section, below).
Fore-aft seat position relative to the eye point was significantly related to all three
anthropometric predictors, although the R2 value was small (11%). The vertical seat
position was related to stature and torso length (expressed by SH/S), but the R2 value was
much higher (0.81). The hip location relative to seat HARP was not related to BMI,
unlike in some previous studies. This may be due to the relatively small range of BMI in
the subject pool. The R2 values were less than 25% for both coordinates.
The coordinates of the subjects’ preferred steering yoke positions were further forward
and lower for taller subjects. On average, lower yoke positions were measured for
subjects with longer torsos) and more-forward yoke positions were recorded for subjects
with higher BMI, likely due to greater abdomen extension.
The fore-aft location of the accelerator heel point (AHPX) in the subject’s preferred
position was modeled as a function of the subject-selected seat height and stature. As
expected, taller subjects placed their heels further forward; higher seat heights (also
associated with smaller stature) resulted in the feet placed more rearward, closer to the
eye point and seat HARP. However, the residual variance not accounted for by these
predictors is high, with a root-mean-square error (residual standard deviation) of 61 mm.
As expected from the seat height findings, the vertical knee location was associated with
seat height and stature. The fore-aft location was associated with stature alone, while the
knees are further outboard relative to seat centerline with higher BMI. The angle of the
side-view vector from hip to eye was computed as an overall measure of torso recline. As
expected from the seat HARP findings, the R2 value was low. The distance between hip
and eye is dominated by stature and SH/S with the highest R2 value of all of the models
(0.83).
28DISTRIBUTION A. Approved for public release; distribution unlimited. OPSEC#4597
Table 11
Regression Models for Posture Prediction (PPE Condition) for FEP Conditions
Variable Intercept Stature Ln(BMI) SH/S Seat EyeZ† R2adj RMSE
(mm) (mm) (nat. log Height*
kg/m2)
HARPX 484 -0.0890 67.7 -1054 0.11 38.7
HARPZ 526 -0.4015 -927 0.81 16.4
HipReHARPX 366 -0.0693 -511 0.09 21.3
HipReHARPZ -302 0.0813 296 0.23 11.8
YokeCenterX 176 -0.1589 -87.2 0.14 53.0
YokeCenterZ 408 -0.2281 -642 0.17 41.4
AHPX 36 -0.4447 0.259 0.33 61.3
AHPX -7 -0.5520 0.315 0.36 60.0
Leg Angle** 24.6 0.081 0.21 7.6
Leg Angle** 1.1 0.0544 0.14 7.9
Thigh Angle** 47.3 -0.091 0.49 4.6
Thigh Angle** 51.9 -0.041 0.15 5.9
Hip-Eye Angle -47 94.3 0.08 4.07
(deg)
Hip-Eye -516 0.4022 930 0.83 15.3
Distance
Seat Back -33.7 0.0089 73.8 0.06 3.6
Angle (deg)
* Seat height calculated as HARPZ-AHPZ
† Eye height relative to heel surface height; use as an alternative to seat height in prediction of AHP and
knee position. Note this value has positive values (typically between 900 and 1250 mm).
** Segment angles with respect to horizontal.
29DISTRIBUTION A. Approved for public release; distribution unlimited. OPSEC#4597
Table 12
Regression Models for Knee and Elbow Location for FEP Conditions
Variable Intercept Stature Ln(BMI) SH/S Seat EyeZ† R2adj RMSE
(mm) (mm) (nat. log Height*
kg/m2)
SuprapatellaX 8 -0.2731 0.46 27.2
re HARP
SuprapatellaY 500 -0.169 -124 0.44 29.5
re HARP
SuprapatellaZ -178 0.3106 -0.627 0.61 38.1
re HARP
SuprapatellaZ -184 0.5046 -0.555 0.54 41.7
re HARP
SuprapatellaZ -179 0.3127 0.368 0.48 38.2
re AHPZ
SuprapatellaZ -197 0.1859 0.366 0.49 37.8
re AHPZ
ElbowX re 318 -125 0.10 51.4
HARP
ElbowY re -101 0.0654 77.0 0.37 17.7
HARP
ElbowZ re -491 126 572 0.18 38.5
HARP
Table 13 shows the valid ranges of predictors based on the test conditions. Note that the
models are configured so that EyeZ is the primary predictor, but limits on seat height are
shown as well. High eye points above the floor (AHP) may require seat heights for small
drivers that are too high for them to comfortably reach the floor. Generally, seat heights
above about 435 mm begin to cause disaccommodation for small women.
Table 13
Valid Range of Predictors for FEP Models (mm)
Predictor Low High Limit Acceptable Cautions
Limit Extrapolation
Seat Height 300 550 ±50 Seat heights above about 435 mm
(HARP above will create disaccommodation for
AHP) small drivers that is not represented
in the accommodation models
EyeZ (eye point 900 1250 ±50 High eye points may result in
above AHP) disaccommodation based on seat
height for small drivers that is not
represented in the accommodation
models
30DISTRIBUTION A. Approved for public release; distribution unlimited. OPSEC#4597
Table 14 shows the effects of the ensemble relative to the PPE condition represented by
the equations in Tables 11 and 12. The largest effects were observed on the seat position.
Soldiers wearing body armor and gear placed the seat further rearward, although the
effect on the hip location with respect to seat HARP was minimal. Seat back angles were
more reclined with body armor and gear, though the torso was more upright (a total of 7
degrees more upright in ACU than in ENC). Table 15 lists regression equations for body
segment angles. These are useful for posturing manikins or other kinematic
representations of drivers.
Table 14
Ensemble Effects Relative to PPE Condition for FEP Conditions
Variable ACU BBG (ENC)
HARPX -51 70
HARPZ 8 -7
HipReHARPX 10 --
HipReHARPZ -- --
YokeCenterX -- --
YokeCenterZ -- --
AHPX -14 41
SuprapatellaX re HARP -10 --
SuprapatellaZ re HARP -- --
ElbowX re HARP 54 -72
ElbowY re HARP -20 10
ElbowZ re HARP -14 28
Hip-Eye Angle (deg) 3 -4
Hip-Eye Distance -- --
Seat Back Angle (deg) -1.0 1.9
31DISTRIBUTION A. Approved for public release; distribution unlimited. OPSEC#4597
Table 15
Regression Models Predicting Body Segment Angles for FEP Conditions
Angle Intercept Stature ln(BMI) (nat. H30 Hip- R2adj RMSE
(mm) (mm) log kg/m2) Eye
Angle
(deg)
Head -15.9 0.0129 0.03 6.5
Tragion* -42.9 0.0129 0.03 6.5
Neck -2.7
Thorax -41.2 0.0092 5.55 1.27 0.74 3.8
Abdomen 58.2 -0.0091 -6.68 1.33 0.54 6.2
Pelvis 78.2 -10.1 0.528 0.08 10.3
Thigh wrt 1.8 0.0265 -0.091 0.64 3.8
Horiz
Knee 184 -0.0405 -0.881 0.26 10.2
Leg wrt 24.6 0.081 0.21 7.6
Vertical
* Angle of vector from head-neck joint to tragion wrt vertical (positive rearward).
32DISTRIBUTION A. Approved for public release; distribution unlimited. OPSEC#4597
Out of Hatch (OOH)
Tables 16 and 17 list posture-prediction models for the OOH condition. For maximum
flexibility in application, key landmark locations are expressed relative to AHP, HARP,
and eye. Moreover, separate regression models are presented for some variables using
both seat height and AHPZ (vertical distance from eye to heel surface) as alternative
predictors. Torso posture was not substantially affected by the seat height conditions. The
torso was slightly more reclined at higher seat heights (contrary to expectation), but the
effect was small. Table 18 shows clothing/gear ensemble effects on key variables (effects
on variables not listed were negligible). The offsets are expressed relative to the PPE
condition.
The steering yoke was measured in two positions. Table 19 lists regression predictions
for yoke location (center point of yoke) for the Soldiers’ preferred position. Table 20 lists
predictions for the “lowest possible” position where they could still execute a quarter turn
with both hands on the yoke.
Table 21 lists regression equations for body segment orientations. These are useful for
manikin posture prediction or depicting the body as a kinematic linkage. The thigh and
leg angle predictions are also used with the knee contours to create clearance planes.
33DISTRIBUTION A. Approved for public release; distribution unlimited. OPSEC#4597
Table 16
Regression Models for Posture Prediction (PPE Condition) for OOH Conditions
Variable Intercept Stature Ln(BMI) SH/S Seat EyeZ† R2adj RMSE
(mm) (mm) (nat. log Height*
kg/m2)
HipReHARPX 490 0.2757 -63.6 -638 -0.601 0.68 20.9
HipReHARPZ -263 0.1321 24.8 -0.087 0.27 16.2
HARPReEyeX -297 80.3 0.28 0.25 36.6
HARPReEyeX -310 82.8 0.132 0.17 38.5
HARPReEyeZ 487 -0.5837 -743 0.294 0.83 15.5
HARPReEyeZ 713 -0.6093 -1129 0.173 0.72 20.0
HARPReAHPX 376 44.8
HARPReAHPZ 714 -0.5756 -1137 1.137 0.91 20.3
AHPReEyeX -225 67.4
Hip-Eye Angle -91.3 130 0.019 0.16 3.3
(deg)
Hip-Eye Angle -79.3 109 0.010 0.11 3.4
(deg)
Hip-Eye -325 0.4771 729 -0.251 0.77 16.0
Distance
Hip-Eye -518 0.3672 1079 0.64 20.0
Distance
* Seat height calculated as HARPZ-AHPZ
† Eye height relative to heel surface height relative; use as an alternative to seat height in prediction of
AHP and knee position. Note this value has positive values.
34DISTRIBUTION A. Approved for public release; distribution unlimited. OPSEC#4597
Table 17
Regression Models for Knee and Elbow Locations (PPE Condition) for OOH Conditions
Variable Intercept Stature Ln(BMI) SH/S Seat AHPZ† R2adj RMSE
(mm) (mm) (nat. log Height*
kg/m2)
SuprapatellaX re -95 -0.1548 -0.114 0.43 21.1
HARP
SuprapatellaY re -481 0.2116 138 -0.239 0.39 30.1
Centerline
SuprapatellaY re -489 0.4432 140 0.405 0.47 28.3
Centerline
SuprapatellaZ re -70 0.3631 -0.960 0.92 15.11
HARP
SuprapatellaZ re -19 0.7882 1.07 0.69 29.4
HARP
SuprapatellaX re -72 51.4
AHP
SuprapatellaZ re 323 0.3235 -591 0.75 17.7
AHP
SuprapatellaX re -297 40.7
Eye
SuprapatellaZ 795 -0.2446 -1321 -0.711 0.88 20.5
Eye
SuprapatellaZ 313 0.2463 -562 0.912 0.91 17.4
Eye
ElbowReHARPX -208 57.4
ElbowReHARPY -97 108 0.29 23.8
ElbowReHARPZ 221 49.4
35DISTRIBUTION A. Approved for public release; distribution unlimited. OPSEC#4597
Table 18
Effects of Clothing/Gear Ensemble on Posture Variables relative to PPE Condition for OOH Conditions
Variable ACUrePPE ENCrePPE
HARPReEyeX -39 79
HARPReEyeZ 3 -9
HARPReAHPX -16 9
HARPReAHPZ 0 3
HipReHARPX 18 -30
HipReHARPZ 0 31
HipReEyeX -27 37
HipReEyeZ 6 -34
YokeReHARPX* 24 -85
YokeReHARPZ -23 69
YokeReEyeX -15 -6
YokeReEyeZ -20 60
YokeReAHPX 8 -76
YokeReAHPZ -23 72
AHPReEyeX -23 70
SuprapatellaX re HARP 12 -20
SuprapatellaZ re HARP -- --
SuprapatellaX re EyeX -27 60
SuprapatellaZ re EyeZ -- --
SuprapatellaX re AHPX -- --
SuprapatellaZ re AHPZ -- --
Hip-Eye Angle (deg) 2.2 -2.7
Hip-Eye Distance -9 38
ElbowReHARPX 35 -98
ElbowReHARPY -15 7
ElbowReHARPZ -3 49
* Use the same values for low-yoke position (Table 20)
36DISTRIBUTION A. Approved for public release; distribution unlimited. OPSEC#4597
Table 19
Regression Models for Preferred Yoke Position for OOH Conditions
Variable Intercept Stature Ln(BMI) SH/S Seat AHPZ† R2adj RMSE
(mm) (mm) (nat. log Height*
kg/m2)
YokeReHARPX 95.4 -118 -0.259 0.13 64.8
YokeReHARPX 123 -119 0.159 0.10 65.8
YokeReHARPZ 321 72.1
YokeReEyeX -342.4 68.7
YokeReEyeZ -342.2 73.5
YokeReAHPX -117 78.6
YokeReAHPZ 49.2 0.6134 0.27 79.9
YokeReAHPZ 169 0.2257 0.687 0.41 72.1
YokeReAHPZ 413 0.866 0.39 73.1
YokeReAHPZ 24.3 -0.745 0.43 70.7
YokeReAHPZ 156 -0.2800 -0.985 0.44 70.2
37DISTRIBUTION A. Approved for public release; distribution unlimited. OPSEC#4597
Table 20
Additional Regression Models for Low Yoke Position for OOH Conditions
Variable Intercept Stature Ln(BMI) SH/S Seat AHPZ† R2adj RMSE
(mm) (mm) (nat. log Height*
kg/m2)
YokeReHARPX 121 -119 -0.286 0.15 63.5
(low)
YokeReHARPX 147 -120 0.172 0.11 64.9
(low)
YokeReHARPZ 226 76.1
(low)
YokeReEyeX -340 66.8
(low)
YokeReEyeZ -438 81.5
(low)
YokeReAHPX -115 81.5
(low)
YokeReAHPZ 139 0.5040 0.18 85.3
(low)
YokeReAHPZ 412 0.866 0.39 73.1
(low)
YokeReAHPZ 46 -0.663 0.33 76.8
(low)
Table 21
Regression Models Predicting Body Segment Angles for OOH Conditions
Angle Intercept Stature ln(BMI) SH/S AHPZ ACU/ R2adj RMSE
(mm) (mm) (nat. log re Eye ENC
kg/m2)
Head 0.6 7.7
Tragion* -26.4 7.7
Neck -8.7 7.8
Thorax -130 0.0231 141 1.1/-2.1 0.11 5.0
Abdomen 97.3 -0.0869 -13.9 -0.073 3.3/-7.1 0.32 5.7
Pelvis 14.7 -0.1293 -0.166 6.7/0 0.07 10.1
Thigh -39.0 0.1272 0.147 0.62 4.5
Leg 0.4 1.2
* Angle of vector from head-neck joint to tragion wrt vertical (positive rearward).
38DISTRIBUTION A. Approved for public release; distribution unlimited. OPSEC#4597
These predictions are valid over the experimental range as well as some reasonable
extrapolation. Table 22 shows the recommended range of input variables. In the
experiment, the vertical offset between the floor and eye was varied based on stature.
Figure 24 shows the distribution of floor-eye vertical offsets for the OOH conditions. By
design, each subject’s highest condition was approximately the highest for which they
could sit on the seat; higher eye locations would require them to stand, perhaps leaning
against the seat. The figure illustrates the design challenge for an OOH condition in
which each driver’s eye location should be about the same. If the floor is more than about
1350 mm below this eye location, the shortest drivers will not be able to sit at all.
An absolute boundary can be calculated from the shortest driver eye heights. In ANSUR
II, the mean difference in height of the eye and vertex (top of the head) is about 110 mm,
so we can estimate the eye height in the vehicle for a standing person by subtracting 110
mm from stature and adding 35 mm for boot thickness, or subtracting a net 75 mm. Using
the 5th-percentile female stature in ANSUR II of 1525 mm, the maximum height above
the floor for a driver eye point accessible to 95% of Army women is 1450 mm. Referring
to Figure 24, this is about the midpoint of the distribution of test conditions, recalling that
these are all seated test conditions. So, a floor-to-eye vertical offset of not more than
1300 mm would allow nearly all drivers to sit, while a 1450 mm offset would allow
nearly all Soldiers to drive, though the shorter ones would be forced to stand.
The design solutions will depend on the constraints of the particular vehicle, including
the adjustment ranges available for the seat and steering controller. For a particular
design, the posture prediction models presented above can be used to estimate postures
for people with a wide range of body size. In general, the models will be valid when the
distance from floor to eye is within the range in Figure 24 for the stature of interest.
Quantitatively, the models are valid when the floor-to-eye distance is at least 250 mm
less than stature. For conditions in which the floor-to-eye distance is larger, the lower-
extremity postures can be expected to differ, with drivers tending to stand rather than sit.
Table 22
Valid Range of Predictors for OOH Models (mm)
Predictor Low High Limit Acceptable Cautions
Limit Extrapolation
Seat Height 650 950 ±50 These ranges assume that the seat
(HARP above permits downward sloped thigh
AHP) angles without restriction.
EyeZ (eye point 1250 1650 ±50 High eye points may result in
above AHP) disaccommodation for the shortest
drivers (see text).
39DISTRIBUTION A. Approved for public release; distribution unlimited. OPSEC#4597
Figure 24. Eye locations above the heel surface (AHP) in OOH conditions.
40DISTRIBUTION A. Approved for public release; distribution unlimited. OPSEC#4597
Highly Reclined Seating (HRS)
Table 23 shows regression models for the HRS conditions. All landmark locations are
expressed relative to the seat HARP, which remained fixed in position for all trials. As
expected, the seat back angle had strong effects on torso posture variables. Unexpectedly,
the seat height did not significantly affect the fore-aft heel location, possibly due to the
relatively small range of seat heights used.
Body segment orientations are predicted two ways. Table 24 lists predictions based on
the anthropometric variables as well as seat back angle and seat height, while Table 25
lists predictions based on hip-eye angle only. The latter models are useful for obtaining
kinematically consistent predictions when hip and eye locations are predicted separately.
Table 26 lists the effects of gear/clothing ensemble on posture variables. Offsets for ACU
and ENC are presented relative to the PPE condition. Surprisingly, higher levels of gear
did not change hip location with respect to HARP. This finding is likely due to the fairly
flexed pelvis/lumbar postures in the seat, such that space was available behind the pelvis
even in the ACU condition. Ensemble strongly affected torso recline measures, such as
hip to eye, with the gear pushing the torso more upright at each fixed seat back angle.
41DISTRIBUTION A. Approved for public release; distribution unlimited. OPSEC#4597
Table 23
Regression Equations for HRS Conditions
Variable* Intercept Stature SH/S ln(BMI) BA** H30 R2adj RMSE
HipX -14.5 26.9
HipZ -5
EyeX -184 7.70 0.81 30.5
EyeY 15.9
EyeZ -480 0.393 621 63.5 -2.85 0.81 20.3
Hip-Eye 12.7 -8.76 0.714 0.68 4.1
Angle
Hip-Eye -540 0.403 740 41.8 -0.936 0.84 15.1
Distance
AHPX -995 -0.250 1093 0.23 54.2
SuprapatX -192 -0.126 -0.238 0.21 27.2
SuprapatY -514 0.181 117 0.24 43.5
SuprapatZ -82 0.319 -69.1 -0.346 0.33 42.6
YokeX 45 -157 6.02 0.46 59
YokeZ 413 46.5
ElbowX 38.7 -82.2 5.07 0.63 33.7
ElbowY -178 0.114 72.5 0.41 18.6
ElbowZ -290 162 0.23 41.0
ShoulderJntX 121 -54.0 6.11 0.84 22.2
ShoulderJntY -52.5 0.081 25.4 0.22 15.7
ShoulderJntZ -122 0.253 51.7 -2.64 0.67 23.1
AnklereAHPX 81
AnklereAHPZ 107
* mm and deg wrt HARP (SIP).
** Seat back angle wrt vertical (range 30 to 50 deg).
42DISTRIBUTION A. Approved for public release; distribution unlimited. OPSEC#4597
Table 24
Regression Equations for Body Segment Orientations for HRS Conditions
Variable Intercept Stature SH/S ln(BMI) BA H30 R2adj RMSE
PelvisAngle 98.5 -16.8 0.455 0.16 9.9
LumbarAngle 70.5 -20.3 0.773 0.57 6.1
ThoraxAngle -26.9 0.910 0.57 6.4
NeckAngle -7.7 0.151 0.06 4.8
HNTragAngle -32 0.275 0.12 5.9
HeadAngle -4.9 0.275 0.12 5.9
ThighAngle 4.9 0.032 -9.50 -0.043 0.20 6.3
re Horiz
Hip-C7 Angle -31.4 9.64 -0.796 0.68 4.6
LegAngle re 69.2 -0.022 13.4 -0.103 0.35 6.7
Vertical
Table 25
Body Segment Orientations as a Function of Hip-Eye Angle for HRS Conditions
Variable Intercept HipEye R2adj RMSE
PelvisAngle 52.8 0.746 0.25 9.3
LumbarAngle 21.9 1.07 0.70 5.1
ThoraxAngle -7.4 1.33 0.86 3.7
NeckAngle -5.1 0.262 0.15 4.5
HNTragAngle -24.1 0.252 0.08 6.1
HeadAngle 2.9 0.252 0.08 6.1
43DISTRIBUTION A. Approved for public release; distribution unlimited. OPSEC#4597
Table 26
Ensemble Effects relative to PPE Condition for HRS Conditions
Variable ACU ENC
HipX -- --
HipZ -- --
EyeX 52 -13
EyeZ -35 4
Hip-Eye Angle 4.9 -1.7
Hip-Eye Distance -22 0
YokeX 47 -21
YokeZ -47 19
ElbowX 57 -19
ElbowY -14 13
ElbowZ -40 34
ShoulderJntX 43 -6
ShoulderJntY -- --
ShoulderJntZ -35 5
Table 27 shows the valid ranges of input variables, which cover the experimental range
as well as some reasonable extrapolation. For seat height, the experimental range was 100
to 200 mm. The findings are probably valid for seat heights from 50 to 250 mm. The
results will be expected to be valid for the experimental seat back angle range of 30 to 50
degrees. The findings are probably valid for fixed back angles from 25 to 55 degrees.
44DISTRIBUTION A. Approved for public release; distribution unlimited. OPSEC#4597
Table 27
Valid Range of Predictors for HRS Models (mm and deg)
Predictor Low High Limit Acceptable Cautions
Limit Extrapolation
Seat Height (HARP 100 200 ±50 Higher and lower seat heights
above AHP) (mm) assume that the front of the seat
cushion is angled appropriately to
avoid interference while
supporting the thighs.
Seat Back Angle (deg) 30 50 ±5 deg More-upright seat back angles
may not be feasible with very low
seat heights; more-reclined seat
back angles would be expected to
require head support
45DISTRIBUTION A. Approved for public release; distribution unlimited. OPSEC#4597
RESULTS: POPULATION ACCOMMODATION MODELS
Overview
The development of population accommodation models followed the general procedures
presented in Zerehsaz et al. (2014a, b) for the fixed-heel driver and squad seating. The
regression models presented above are used to predict mean responses for male and
female sub-populations. The variance in the response (for example, eye location in HRS)
is predicted by considering both anthropometric variation and the residual variation in the
response that is not accounted for by the vehicle, seat, or anthropometric variables. This
residual is represented by the root mean square error (RMSE) in the regression tables.
Appendix B provides general background on the formulation of accommodation models.
Different accommodation models were developed for each driver condition, depending
on the constraints and variables in the test setup. Table 28 lists the models for each
mockup condition.
Microsoft Excel workbooks have been created that embody these accommodation
models. The Excel workbooks are considered to be the authoritative implementation of
the accommodation models. If discrepancies are found between the Excel workbooks and
this report, the Excel workbooks should take precedence. This report documents the
procedures and differences among the models across seating configurations. For the
examples, target accommodation was 90%.
Table 28
Accommodation Model Availability by Configuration
FEP OOH HRS
Eyellipse X
Helmet Contour X X X
Seat Adjustment X X
Steering Position X X X
Steering Position (Low) X
Pedal Fore-aft Adjustment X X X
Back Angle Adjustment X
Knee Clearance X X X
Elbow Clearance X X X
Elbow Clearance (non-driver) X
46DISTRIBUTION A. Approved for public release; distribution unlimited. OPSEC#4597
Anthropometry Inputs
The anthropometry inputs are the same as in the previous model development work.
Table 29 lists the inputs, which are the means and standard deviations of four variables
for men and women. The values in Table 29 were obtained from ANSUR II, but values
for any other population can be used as appropriate. In addition to these variables, the
fraction of the population that is male is used in all calculations. In the examples in the
sections that follow, the reference population is ANSUR II with 90% male.
Table 29
Reference Anthropometric Inputs from ANSUR II
Dimension Men Women
Mean SD Mean SD
Stature (S), mm 1756 68.6 1628 64.2
Erect Sitting Height (SH), mm 918 35.7 857 33.1
Erect Sitting Height / Stature (SHS) 0.523 0.0135 0.526 0.0141
Log(BMI)*, log(kg/m^2) 3.31 0.146 3.23 0.135
* Natural log; in Excel, use ln()
Calibration and Ensemble Inputs
The clothing/gear ensemble is entered as ACU, PPE, or ENC (BBG). As noted above, the
default for the regression and accommodation models is PPE, with the other conditions
applied as offsets. Generally, ensemble affects the hip location on the seat, and hence seat
fore-aft position, along with steering and elbow locations. For HRS, ensemble has a
strong effect on measures of torso posture (e.g., eye location). Note that if a seat has relief
for the hydration pack, ENC is taken as equivalent to PPE.
The HARP can be established using either the SAE J826 H-point machine or the Seat
Index Point Tool (SIPT). Choosing the SIPT shifts the estimated location of the HARP
with respect to the seat by 5 mm; this effect is added into calculations related to fore-aft
HARP location.
47You can also read