Shoreface and Holocene Sediment Thickness Offshore of Rockaway Peninsula, New York - Open-File Report 2021-1100
←
→
Page content transcription
If your browser does not render page correctly, please read the page content below
Prepared in cooperation with the National Fish and Wildlife Foundation

Shoreface and Holocene Sediment Thickness Offshore of
Rockaway Peninsula, New York

Open-File Report 2021–1100

U.S. Department of the Interior
U.S. Geological Survey
Shoreface and Holocene Sediment
Thickness Offshore of Rockaway
Peninsula, New York

By Emily A. Wei, Jennifer L. Miselis, and Arnell S. Forde

Prepared in cooperation with the National Fish and Wildlife Foundation

Open-File Report 2021–1100

U.S. Department of the Interior
U.S. Geological Survey
U.S. Geological Survey, Reston, Virginia: 2021 For more information on the USGS—the Federal source for science about the Earth, its natural and living resources, natural hazards, and the environment—visit https://www.usgs.gov or call 1–888–ASK–USGS. For an overview of USGS information products, including maps, imagery, and publications, visit https://store.usgs.gov/. Any use of trade, firm, or product names is for descriptive purposes only and does not imply endorsement by the U.S. Government. Although this information product, for the most part, is in the public domain, it also may contain copyrighted materials as noted in the text. Permission to reproduce copyrighted items must be secured from the copyright owner. Suggested citation: Wei, E.A., Miselis, J.L., and Forde, A.S., 2021, Shoreface and Holocene sediment thickness offshore of Rockaway Peninsula, New York: U.S. Geological Survey Open-File Report 2021–1100, 14 p., https://doi.org/10.3133/ofr20211100. Associated data for this publication: Forde, A.S., Wei, E.A., DeWitt, N.T., and Miselis, J.L., 2021, Archive of chirp subbottom profile data collected in 2019 from Rockaway Peninsula, New York: U.S. Geological Survey data release, https://doi.org/10.5066/P9ZO8QKJ. Stalk, C.A., DeWitt, N.T., Wei, E.A., Farmer, A.S., Miselis, J.L., and Fredericks, J.J., 2020, Coastal bathymetry and backscatter data collected in September and October 2019 from Rockaway Peninsula, New York: U.S. Geological Survey data release, https://doi.org/10.5066/P9WNJSFN. ISSN 2331-1258 (online)
iii
Contents
Abstract�����������������������������������������������������������������������������������������������������������������������������������������������������������1
Introduction����������������������������������������������������������������������������������������������������������������������������������������������������1
Purpose and Scope���������������������������������������������������������������������������������������������������������������������������������������1
Regional Geologic Setting����������������������������������������������������������������������������������������������������������������������������3
Data Collection and Processing������������������������������������������������������������������������������������������������������������������4
Seismic Stratigraphy�������������������������������������������������������������������������������������������������������������������������������������6
Discussion�����������������������������������������������������������������������������������������������������������������������������������������������������10
Summary�������������������������������������������������������������������������������������������������������������������������������������������������������12
Acknowledgments���������������������������������������������������������������������������������������������������������������������������������������13
References Cited�����������������������������������������������������������������������������������������������������������������������������������������13
Figures
1. Map showing Rockaway Peninsula study area in southwest Long Island, New York�����2
2. Maps showing multibeam and single-beam bathymetry and multibeam
backscatter������������������������������������������������������������������������������������������������������������������������������������4
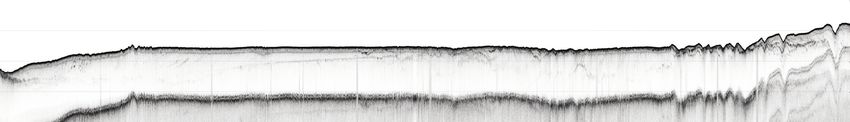
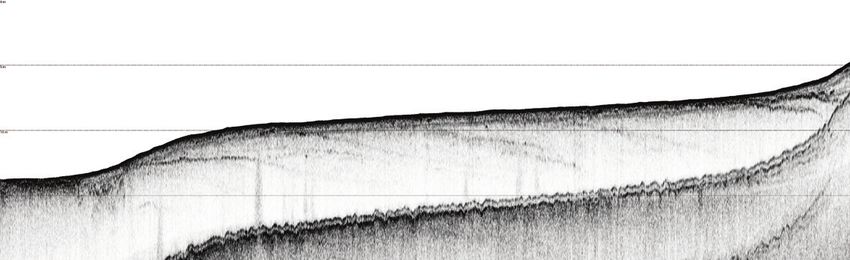
3. Graphs showing uninterpreted and interpreted dip profiles showing
configurations of shoreface sediment, Holocene sediment above the regional
unconformity, and underlying channels�����������������������������������������������������������������������������������7
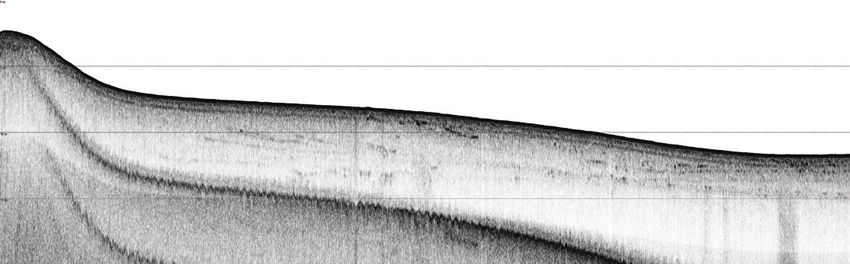
4. Graphs showing uninterpreted and interpreted profile of strike line 65 show
the westward dip of the regional unconformity, westward thickening of
Holocene sediment, and thickening Holocene sediment in the east because of
the ebb-tide delta��������������������������������������������������������������������������������������������������������������������������8
5. Maps showing shoreface and Holocene sediment thickness and depth of the
regional unconformity������������������������������������������������������������������������������������������������������������������9
6. Graphs showing Holocene and shoreface sediment volume and ratio for
zones I, II, III, and IV�������������������������������������������������������������������������������������������������������������������11
Tables
1. Volumes of Holocene and shoreface sediment deposits subdivided by region
and total volumes��������������������������������������������������������������������������������������������������������������������������5
2. Volumes of Holocene and shoreface units at each shore-perpendicular chirp
line transect���������������������������������������������������������������������������������������������������������������������������������12
Conversion Factors
U.S. customary units to International System of Units
Multiply By To obtain
Length
foot (ft) 0.3048 meter (m)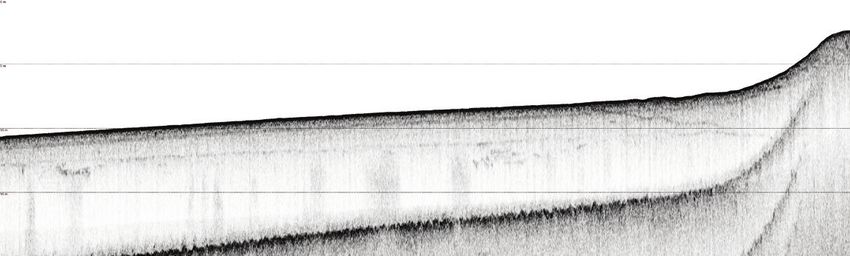
iv

     International System of Units to U.S. customary units

                            Multiply                              By                           To obtain
                                                              Length
      millimeter (mm)                                          0.03937     inch (in.)
      meter (m)                                                3.281       foot (ft)
      meter (m)                                                1.094       yard (yd)
      kilometer (km)                                           0.6214      mile (mi)
      kilometer (km)                                           0.5400      mile, nautical (nmi)
                                                               Area
      square meter   (m2)                                      0.0002471 acre
      square meter (m2)                                       10.76        square foot (ft2)
      square kilometer     (km2)                             247.1         acre
      square kilometer (km2)                                   0.3861      square mile (mi2)
                                                               Volume
      cubic meter   (m3)                                      35.31        cubic foot (ft3)
      cubic meter   (m3)                                       1.308       cubic yard (yd3)
      cubic meter (m3)                                         0.0008107 acre-foot (acre-ft)
                                                             Flow rate
      meter per second (m/s)                                   3.281       foot per second (ft/s)

     Datum
     Vertical coordinate information is referenced to the North American Vertical Datum of 1988
     (NAVD 88).
     Horizontal coordinate information is referenced to the World Geodetic System of 1984 (WGS 84).
     Depth, as used in this report, refers to distance below the vertical datum.

     Supplemental Information
     For chirp data, frequencies are given in kilohertz (kHz), pulse length is given in milliseconds, and
     ping rate is given in hertz.

     Abbreviations
     DEM            digital elevation model
     GPS            global positioning system
     USACE          U.S. Army Corps of Engineers
     USGS           U.S. Geological Survey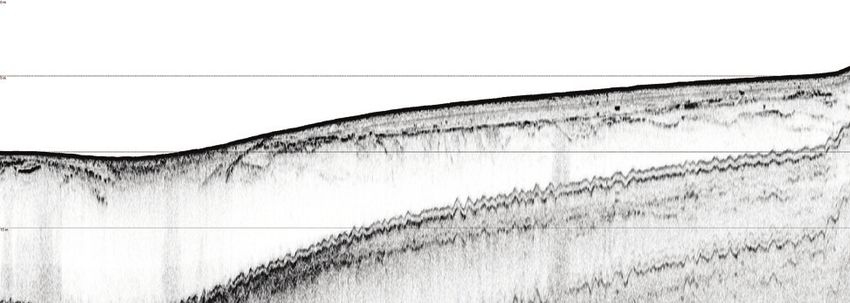
Shoreface and Holocene Sediment Thickness Offshore of
Rockaway Peninsula, New York

By Emily A. Wei, Jennifer L. Miselis, and Arnell S. Forde

                                                                     long-term (102 to 103 years) erosion, with short-term erosion
Abstract                                                             in the east-central peninsula and accretion in the western
                                                                     Rockaway Peninsula (Hapke and others, 2010; U.S. Army
      During September and October 2019, the U.S. Geological         Corps of Engineers [USACE], 2019). To mitigate erosion of the
Survey mapped the shoreface and inner continental shelf              coastline and damage to coastal infrastructure, the USACE and
offshore of the Rockaway Peninsula in New York using
                                                                     beach communities periodically nourish the beach (USACE,
high-resolution chirp seismic reflection and single-beam             2019). Nevertheless, this region is vulnerable to winter storms
bathymetry geophysical techniques. The results from this             (nor’easters) and occasional hurricanes, such as Hurricane
study are important for assessing the Quaternary evolution of        Sandy in 2012, which caused substantial damage to or destroyed
the Rockaway Peninsula and determining coastal sediment              1,000 coastal structures (USACE, 2019).
availability, which is crucial for establishing sediment budgets,          This investigation aims to quantify the volume of sediment
understanding sediment dispersal, and managing coastlines.           in the “active shoreface” to improve understanding of spatial
This report presents preliminary interpretations of seismic          variability in barrier storm response. The active shoreface is
profiles and maps of shoreface and Holocene sediment thick-          the region over which morphological change is rapid enough
ness from the shoreline to about 2 kilometers offshore. The          to adjust to the annual range in wave conditions (Stive and
results indicate that shoreface and Holocene sediment thickness      de Vriend, 1995). Despite advances in understanding the
demonstrates zonal variability because of underlying geology         linkages between shoreface slope and barrier response (Cowell
and sediment availability. Based on geomorphic features and          and Kinsela, 2018), much is still not known about shoreface
underlying stratigraphy, the study area is separated into west,      geology. Shorefaces are in shallow water; therefore, they can
west-central, east-central, and east zones. Holocene sediment,       be difficult to map with seismic reflection equipment because
which includes the shoreface and seafloor features with positive     breaking waves and shallow water restrict boat access and pose
morphology (for example, nearshore bars, ebb-tide deltas, and        substantial hazards to towed seismic equipment. Nevertheless,
sorted bedforms), thickens to the west and may be related to         this information would support several objectives, including an
accommodation and westward dip of the regional unconformity.         evaluation of the response of the peninsula to post-Hurricane
Shoreface units, which are thought to represent the active           Sandy coastal restoration projects, quantification of barrier
volume of littoral sediment, are thickest in the west-central        peninsula sediment budgets, and prediction of the resilience of
peninsula where the geologic base of the shoreface is deeper.        the barrier peninsula to storms and sea-level rise.
Shoreface units with moderate thickness are in the western
and eastern peninsula where there are positive morphological
features (for example, deposits accumulating updrift from the        Purpose and Scope
jetty, ebb-tide deltas, and so on). The thinnest shorefaces are in
the east-central Rockaway Peninsula because of less accom-                In support of the previously stated objectives and in
modation caused by the shoaling regional unconformity.               cooperation with the National Fish and Wildlife Foundation,
                                                                     the U.S. Geological Survey (USGS) completed a geophysical
                                                                     survey to understand how the geologic framework affects sedi-
Introduction                                                         ment availability offshore of the Rockaway Peninsula in New
                                                                     York (fig. 1; Stalk and others, 2020; Forde and others, 2021).
      Quantifying coastal sediment availability is relevant for      Using a modified beach-launched towed sled, chirp seismic data
coastal management because the volume of mobile, nearshore           were collected in water as shallow as 2 meters (m), allowing
sediment has been linked to patterns of shoreline erosion on         researchers to image more of the upper and lower shoreface
coastal margins (Miselis and McNinch, 2006); furthermore,            than typical seismic studies. This report interprets these
the availability of shelf sediment may affect long-term coastal      shallow-water chirp data and presents maps of shoreface and
behavior (Schwab and others, 2014). The study site, the              Holocene sediment thickness. Results from this report add to
Rockaway Peninsula in New York, has historically demon-              our knowledge of shoreface and inner shelf systems, especially
strated along-margin variability in short- (100 to 101 years) and    those that are subject to anthropogenic modifications.
2 Shoreface and Holocene Sediment Thickness Offshore of Rockaway Peninsula, New York
74°8’ 74°4’ 74°0’ 73°56’ 73°52’ 73°48’
r
40°38 Rive
' on
ds
Hu
oraine
r Hill m
Harbo
40°36
'
The
40°34 Narrows
'
Bay
Jamaica
Rockaway
40°32
Inlet Peninsula East
'
Rockaway Rockaway Inlet
Breezy Point Zone IV
Zone III
Zone I Zone II
Stone jetty
Line 65 Lon
40°30 Line 61 g
' Line 39 Isla Beach
nd
Line 14 Line 21
ATLANTIC OCEAN
Base modified from NOAA’s 0 1 2 KILOMETERS
NCEI Hurricane Sandy Digital VT NH
EXPLANATION
Elevation Models (National Chirp profile line Elevation, in meters 0 1 MILE
Centers for Environmental NY MA
Dip line (fig. 3) 100
Information, 2018)
WGS 84 ellipsoid, NAVD 88 CT
Strike line (fig. 4) 0
PA
land RI −75
g Is
Lon
NJ Study ATLANTIC
area OCEAN
Figure 1. Rockaway Peninsula study area in southwest Long Island, New York. The geophysical survey spans the area from
the nearshore to about 2 kilometers offshore of the Rockaway Peninsula. Chirp profile lines acquired over the survey (blue
lines), dip lines (red; fig. 3A–D), and a strike line (yellow; fig. 4) also are shown. The extents of geomorphic zones are indicated
by the white lines on the barrier peninsula. [WGS 84, World Geodetic System of 1984; NAVD 88, North American Vertical Datum
of 1988; NOAA, National Oceanic and Atmospheric Administration; NCEI, National Centers for Environmental Information]Regional Geologic Setting 3
Regional Geologic Setting Rockaway Peninsula has extended to the southwest by more
than 6.4 kilometers (km; USACE, 2016). The peninsula’s
The study area is in southwest Long Island, New York, progradation rate was rapid until 1902, at which point,
which was formed by the younger Harbor Hill and older progradation rates decreased by 50 percent from 1902 to 1927
Ronkonkoma terminal moraines during the last glacial (Sanderson, 2016; USACE, 2016, 2019).
advance (Taney, 1961). To the north of the Rockaway Rockaway Peninsula also has a long history of human
Peninsula lies the northeast-trending Harbor Hill moraine alterations. Anthropogenic modification and the construc-
(fig. 1; Stone and Borns, 1986), and to the south, the peninsula tion of jetties and groins beginning in 1914 contributed to
is flanked by glaciofluvial outwash (Taney, 1961). Erosion and stabilization of the Rockaway Peninsula shoreline (USACE,
reworking of glacially derived sediment have contributed to 2016). On the western end of the peninsula, a 2,560-m-long
much of the marine sediment offshore of Rockaway (Williams stone jetty was constructed in 1933 to stabilize the eastern side
and Duane, 1974). of Rockaway Inlet, and it is regularly dredged to maintain a
Rockaway Peninsula is a long linear barrier spit, formed depth of −20 feet (fig. 1; USACE, 2019). After jetty construc-
in a microtidal environment and dominated by storm and wave tion, the western peninsula began to rapidly prograde seaward
processes, such as overwash and breaching (Hapke and others, during the late 19th century, and progradation is continuing
2010). Tidal currents at the Rockaway Peninsula are generally at present (2021; USACE, 2016). This progradation provided
weak; however, they increase in velocity at Rockaway Inlet land for the establishment of the Breezy Point community on
and East Rockaway Inlet (USACE, 2019). Winds averaged the western end of the peninsula (fig. 1). Additionally, the East
from 1950 to 2019 are predominantly from the south and Rockaway Inlet is stabilized by a jetty on its eastern side that
range from 4.5 to 6.3 meters per second (m/s), and stronger was constructed in 1935 and is regularly dredged to maintain
storm-related winds are predominantly from the west and a depth of −12 feet (USACE, 2019). Initial beach nourishment
northwest with peak gusts from 21 to 32 m/s, as measured at efforts that supplied sand to beaches along the peninsula were
John F. Kennedy Airport (USACE, 2019). This wind forcing recorded as early as 1926, and subsequent beach renourish-
affects wave approach to the Rockaway Peninsula, which is ment projects between 1936 and 1965 occurred in response
primarily from the south and southeast (USACE, 2019). From to large storm events (USACE, 2019). The most extensive
a 32-year record of wave climate, significant wave heights are shoreline modification efforts began as part of the 1965 Flood
about 0.96 m with an average dominant period of 8.20 seconds Control Act in response to a severe storm in 1962 (USACE,
(Brutsché and others, 2016). 2019). Since 1975, beaches at Rockaway Peninsula have been
Although other barrier islands in the New York Bight, renourished every 1–4 years with an average nourishment
such as Fire Island, were formed about 8,000 years ago volume of 5.2×10⁶ cubic meters (USACE, 2019). The sedi-
(Rampino and Sanders, 1981), Rockaway Peninsula is thought ment used for sediment renourishment is typically dredged
to be much younger, having formed within only the past from the inner shelf and dredge pits can be identified in
400 years by westward-moving longshore sediment transport bathymetric maps (fig. 2A).
(Taney, 1961; Sanderson, 2016). Over the past 125 years,4 Shoreface and Holocene Sediment Thickness Offshore of Rockaway Peninsula, New York
A. Multibeam and single-beam bathymetry
73°56' 73°54' 73°52' 73°50' 73°48' 73°46'
40°34
'
Zone III Zone IV
Zone II
Zone I
y
Jett
Ebb-tide
40°32 delta
'
Sorted EXPLANATION
bedforms
Bathymetric depth,
Dredge in meters
pits −1
ift
Shoal updr
of jetty
−16
B. Multibeam backscatter
73°56' 73°54' 73°52' 73°50' 73°48' 73°46'
40°34
'
Zone III Zone IV
Zone II
Zone I
y
Jett
40°32
'
Sorted
bedforms EXPLANATION
Backscatter intensity,
in decibels
ift 11
Shoal updr
of jetty
−20
Base from National Centers for Environmental Information (2018) 0 1 2 KILOMETERS
WGS 84 ellipsoid
0 1 MILE
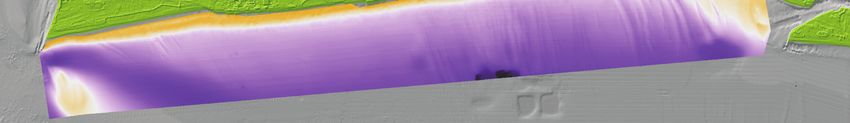
Figure 2. Multibeam and single-beam bathymetry and multibeam backscatter. A, multibeam bathymetry, in meters below the
North American Vertical Datum of 1988; Selected features with positive morphology are annotated. B, multibeam backscatter.
High intensity (bright colors) generally corresponds to harder seafloor substrate or increased roughness, whereas low intensity
(dark colors) generally corresponds to softer seafloor substrate. [WGS 84, World Geodetic System of 1984]
Data Collection and Processing to collect chirp seismic data in shallow-water environments.
The seismic sled is buoyed by two inflatable pontoon floats that
Between September 24 and October 14, 2019, 201 kilo- allow the chirp profiler to rest just below the water’s surface
meters of chirp seismic data were acquired as part of USGS during seismic acquisition and enable launching and recovery
field activity 2019-333-FA (https://cmgds.marine.usgs.gov/ from the shore. Additionally, the seismic sled was configured to
fan_info.php?fan=2019-333-FA) in the nearshore region of the ensure the quality of data collected in shallow-water depths and
Rockaway Peninsula in water depths of 2–16 m and extending reduce signal-multiple artifacts by allowing for minimal offset
about 2 km offshore to the inner shelf (fig. 1) aboard the between the water surface and the chirp receiver. Chirp data
USGS research vessel Sallenger (Forde and others, 2021). An were acquired at frequencies ranging from 0.7 to 12 kilohertz
EdgeTech SB–512i subbottom profiler and Ashtech Proflex (kHz), a pulse length of 20 milliseconds, and a ping rate of
800 global positioning system (GPS) receiver were strapped to a 5 hertz. Data were recorded in EdgeTech proprietary JSF and
purpose-built, towed sled platform modified by USGS scientists industry standard SEG-Y formats. More information on chirp
acquisition is available in a USGS data release (Forde andData Collection and Processing 5
others, 2021). During chirp acquisition, information about the Then, seafloor picks were vertically aligned to the previously
position of each seismic shot was collected by a sled-mounted discussed, custom-made DEM of gridded single-beam bathym-
Ashtech Proflex 800 GPS receiver and was written to the etry in SonarWiz. Gained SEG-Y files were imported into the
seismic trace headers. Differential positioning was obtained Kingdom software package (https://ihsmarkit.com/products/
through postprocessing the base station data (on the USGS kingdom-seismic-geological-interpretation-software.html) for
established benchmark RIIS) to the Proflex on the sled. More interpretation of surfaces. Interpretations of sediment units
information on positional accuracy and navigation details were based on sequence-stratigraphic principles (Mitchum and
specific to GPS and bathymetry data is available in a USGS data others, 1977; Christie-Blick and Driscoll, 1995). The “math on
release (Stalk and others, 2020). two maps” tool in Kingdom Suite software was used to calcu-
Also mounted on the seismic sled was an Odom Echotrac late the difference (in two-way travel time) between the seafloor
CV100 single-beam echo sounder that acquired bathymetry. and interpreted surfaces. Two-way travel time was converted
Single-beam data were merged with navigation data and to sediment thickness, in meters, using a sound velocity of
corrected for sound velocity and tides, as described by Stalk 1,500 m/s in the water column and an internal sound velocity of
and others (2020). Data were then processed and cleaned within 1,650 m/s in sediment. This sound velocity was used for similar
CARIS HIPS and SIPS data processing software. Further details studies at Fire Island in New York by Locker and others (2017).
of single-beam bathymetry processing are available in Stalk Sediment unit thickness and reflector depth maps were gridded
and others (2020). Single-beam bathymetry soundings collected using the surface function within Generic Mapping Tools
onboard the chirp sled were imported as XYZ files into the (https://www.generic-mapping-tools.org/) version 6.0.0 software
data processing and visualization software SonarWiz 7 (https:/ and exported to Esri’s ArcMap geographic information system
/chesapeaketech.com/), where they were gridded into a digital program for visualization.
elevation model (DEM) using the natural neighbors algorithm Within ArcMap, sediment thickness maps were clipped
and a grid size of 10 m. to boundaries of geomorphic zones. These clipped sediment
Chirp seismic files recorded in the full-waveform JSF thickness maps were imported into the Surface Volume
format were bandpass-filtered at frequencies of 3, 4, 10, and tool to calculate the Holocene and shoreface sediment unit
12 kHz to remove shallow-water artifacts and to enhance volume within each zone (table 1). To estimate the volume of
vertical resolution of shallow reflections in the seismic data sediment, in cubic meters, at each profile location, transects
processing program Seismic Unix (Cohen and Stockwell, 2010). were drawn along chirp lines that were perpendicular to shore
Chirp files in the JSF format were converted to SEG-Y format. (odd-numbered chirp dip profiles). The ArcMap add-on, Xtools,
SEG-Y files were imported into SonarWiz 7 for application was used to extract sediment thickness along these transects.
of time-varying gain. Heave corrections were applied using Individual transect profiles were plotted, and the Trapezoidal
the following methodology in SonarWiz to compensate for function within MATLAB integrated the area under each
sea surface roughness encountered during acquisition. First, profile. This integrated value represents the volume of sediment
seafloor picks were automatically tracked in SonarWiz with at each shore-perpendicular seismic profile.
manual quality assurance and quality control of the picks.
Table 1. Volumes of Holocene and shoreface sediment deposits subdivided by region and total volumes.
[m2, square meter; m3, cubic meter; %, percent; m3/m, cubic meter per meter; --, no data or not applicable]
Deposit volume in each Volume normalized by
Geomorphic zone Deposit area (1×10⁶ m2) Deposit volume (1×10⁶ m3)
zone (%) zone width (m3/m)
Holocene sediment
I 10.10 47.40 56.87 10,378.89
II 6.83 17.66 21.19 5,867.01
III 11.80 8.99 10.78 1,781.49
IV 6.89 9.29 11.15 2,707.44
Total 35.62 83.34 -- --
Shoreface sediment
I 2.34 4.48 24.33 980.17
II 2.10 4.94 26.87 1,642.20
III 2.89 4.49 24.39 889.60
IV 3.05 4.49 24.42 1,309.36
Total 10.38 18.40 -- --6 Shoreface and Holocene Sediment Thickness Offshore of Rockaway Peninsula, New York
The bathymetry of the shelf was mapped from the 2–16-m dipping reflections (figs. 3B–D and 4). Where present, the upper
depths using two Teledyne Reson Seabat T50–P multibeam surfaces of channels are truncated by the regional unconformity
echosounders in dual-head configuration that used a 200-kHz that can be traced along the entirety of the survey area and dips
pulse to acquire swath bathymetry with a 1-millimeter vertical towards the west (figs. 4 and 5C).
resolution and a 0.6-m pixel resolution (Stalk and others, 2020). Any sediment overlying the regional unconformity is
The spatial coverage of the multibeam survey is 23.1 square within the upper unit; thus, upper unit sediment encompasses
kilometers (fig. 2A, B). Navigation on the boat was recorded by “active shoreface” sediment and seafloor features with positive
an Applanix Pos MV Wavemaster II, and motion was recorded morphology (for example, nearshore bars, ebb-tide deltas, and
by an inertial measurement unit. Bathymetry data were loaded sorted bedforms). These features with positive morphology
into CARIS, and processing consisted of computing and also are observed in the multibeam bathymetry and backscatter
applying GPS tide corrections, applying sound-velocity correc- maps (fig. 2A, B). Upper unit sediment is thickest in line 14,
tions, computing total propagated uncertainty, applying filters slightly thinner in line 21, thin to absent at the seaward
that excluded points with low RESON quality and high total parts of line 39, and thick again in line 61 (fig. 3A–D). This
propagated uncertainty, generating a CUBE model from filtered east–west gradient in upper unit thickness also is apparent in
soundings, removing refraction artifacts, and cleaning manually strike line 65 (fig. 4). In line 14 and the western part of line 65,
(Stalk and others, 2020). More details on the acquisition and internal reflections within the thick upper unit have a seaward
processing of multibeam data are available in Stalk and others and westward dip, which indicates progradation oblique to the
(2020). CARIS extracted the multibeam backscatter, which was margin (figs. 3A and 4).
exported as a raster for visualization in ArcMap (fig. 2B). Strike line 65 also captures features in eastern Rockaway
Multibeam swath bathymetry has a narrower footprint in Peninsula that have bathymetric expression. At the far eastern
shallow water and some shallow-water areas were inaccessible end of line 65 is a thick deposit above the regional unconformity
to the vessel; therefore, 190 km of single-beam bathymetry in with low-amplitude, conformable internal reflections (fig. 4,
the nearshore zones were acquired by two personal watercrafts zone IV). In strike line 65, this feature is cross cut by V-shaped
that were each equipped with an Odom Echotrac CV100 single- incised valleys (fig. 4), whereas in dip line 61, it appears as
beam sounder mounted to the back (Stalk and others, 2020). In a smooth feature (fig. 3D). This deposit is likely an ebb-tide
the cross-shore direction, single-beam tracklines were spaced delta because it is at the mouth of the East Rockaway Inlet
about 50 m apart, and 2–3 alongshore transects were collected. (fig. 1). Just west of this feature are undulatory bedforms with
All single-beam datasets were merged with navigation data and less than 2 m of relief (fig. 4). These features are clearly visible
corrected for sound velocity and tides, as described by Stalk and in the seismic data as higher amplitude reflections observed
others (2020). The footprints of the multibeam and single-beam roughly 12–15 km along the profile (fig. 4). These undulatory
surveys overlap. Single-beam and multibeam bathymetry were bedforms have different acoustic properties than the ebb-tide
merged into a DEM using triangular irregular networks in delta in strike line 65, because bedform sediment is acoustically
ArcMap 10 (fig. 2A). transparent compared to the conformable reflections within the
ebb-tide delta deposit (fig. 4); furthermore, the bedforms have
shorter heights and wavelengths than the ebb-tide delta deposit.
These undulatory features also are observed in the multibeam
Seismic Stratigraphy bathymetry and backscatter maps. In the backscatter mosaic,
the undulatory bedforms are perpendicular to the shoreline
The most prominent feature in the Rockaway Peninsula
at eastern Rockaway Peninsula and appear as linear, low-
chirp seismic profiles is often the regional unconformity,
reflectivity (dark in the mosaic) areas at the seafloor (fig. 2B).
which is a subhorizontal reflection indicated by the green line
These dark areas of low acoustic reflectivity are separated by
(figs. 3A–D and 4). In dip profiles 14 and 21, the regional
bedform troughs with high reflectivity (light yellow in the
unconformity has a moderate amplitude and a gentle seaward
mosaic; fig. 2B).
dip (fig. 3A, B). In strike line 65, the regional unconformity
In dip profiles, the landward (north) and steeply dipping
deepens to the west and shoals in the central and eastern
part of the seismic profile indicates the extent of the active
peninsula, where it crops out at the seafloor at certain locations
shoreface. The base of the active shoreface is defined as a
(fig. 4). The seaward- and western-dipping structure of the
weak to high-amplitude reflection. This reflection has weak
regional unconformity also is apparent in the regional unconfor-
amplitudes in line 14, moderate amplitudes in line 21, and
mity depth map (fig. 5C).
higher amplitudes in lines 39 and 61 (fig. 3A–D). The active
Below the regional unconformity, the deepest deposits
shoreface was divided into the upper and lower shoreface units
imaged in the seismic profiles are acoustically transparent and
based on acoustic character. Where present, internal reflections
are truncated above by channels (shown in yellow in fig. 4).
within the upper shoreface unit (shown in blue) can appear as
The lower boundary of the acoustically transparent unit could
closely spaced, high amplitude, discontinuous, and chaotic,
not be detected because of a lack of penetration. Channels
as observed in lines 14 and 21 (shown in blue in fig. 3A, B).
that incise into the basal unit are infilled by either acoustically
These characteristics distinguish the upper shoreface unit from
transparent sediment or by deposits that contain flat-lying or
the lower shoreface unit (shown in pink), because the latterN S N S
0 Line 65
0
A Line 14 Upper shoreface Line 14
Lower shoreface 5
5 Seaward-prograding
GST
reflectors
Holocene unit 10
10 Base of
shoreface 15
15 Multiple Channel Transgressive surface 20
Pleistocene unit
25
20
0 0.5 1.0 1.5 0 0.5 1.0 1.5
0 0
Line 65 B Line 21 Line 21
Upper shoreface
5
5 Lower shoreface
GST 10
Two-way travel time, in milliseconds
Holocene unit
10
15
Water depth, in meters
Base of shoreface Transgressive surface
15 Channel 20
Multiple Channel
Pleistocene unit
25
20
0 0.5 1.0 1.5 2.0 0 0.5 1.0 1.5 2.0
0 0
Line 65 C Line 39 Line 39
Lower 5
5 shoreface
Transgressive surface
GST 10
10
15
Base of
Multiple Glacial outwash
15 shoreface 20
channels
25
20
0 0.5 1.0 1.5 0 0.5 1.0 1.5
0 0 EXPLANATION
Line 65 D Line 61 Lower shoreface Line 61
and ebb-tide delta 5 Channels
5 Transgressive surface
10 Lower shoreface
10 Base of GST Upper shoreface
shoreface Channels 15
Multiple Transgressive
15 20 surface
25
20
0 0.5 1.0 1.5 0 0.5 1.0 1.5
Distance, in kilometers
Seismic Stratigraphy 7
Figure 3. Uninterpreted and interpreted dip profiles showing configurations of shoreface sediment, Holocene sediment above the regional unconformity, and underlying
channels. A, line 14 is in zone I in west Rockaway Peninsula, New York; B, line 21 is in zone II in west-central Rockaway Peninsula; C, line 39 is in zone III in east-central
Rockaway Peninsula; D, line 61 is in zone IV in east Rockaway Peninsula. Line locations are shown in figure 1. The intersections of each dip line with line 65 in figure 4 are
indicated by the blue vertical lines. [GST, geologic shoreface toe]8 Shoreface and Holocene Sediment Thickness Offshore of Rockaway Peninsula, New York
SW NE
Zone I Zone II Zone III Zone IV
0 0
Line 14 Line 21 Line 39 Line 61
5
5 Line 65
Two-way travel time, in milliseconds
10
10
15
Water depth, in meters
15 20
25
20
Zone I Zone II Zone III Zone IV
0 Ebb-tide 0
Line 14 Line 21 Line 39 Sorted bedforms Line 61 delta
Holocene Lower Upper 5
5 Prograding reflectors shoreface
unit shoreface
10
10
Lower Regional Channels
15
Channels Pleistocene unit shoreface
Glacial outwash unconformity
15 Transgressive surface 20
Multiple channels
25
20
0 5 10 15
Distance, in kilometers
EXPLANATION
Channels
Lower shoreface
Upper shoreface
Transgressive surface
Figure 4. Uninterpreted and interpreted profile of strike line 65 show the westward dip of the regional unconformity, westward thickening of Holocene
sediment, and thickening Holocene sediment in the east because of the ebb-tide delta. Line 65 location is shown in figure 1. Above the profiles, gray rectangles
delineate the extent of the geomorphic zones. The intersections of line 65 with dip lines in figure 3 are indicated by the blue vertical lines.Seismic Stratigraphy 9
A. Shoreface thickness
73°58' 73°56' 73°54' 73°52' 73°50' 73°48' 73°46'
40°34
'
Zone IV
Zone III
Zone II
Zone I
40°32
'
EXPLANATION
Shoreface thickness,
in meters
8
0
B. Holocene sediment thickness
73°58' 73°56' 73°54' 73°52' 73°50' 73°48' 73°46'
40°34
'
Zone IV
Zone III
Zone II
Zone I
8 6 2
2
40°32
' 4
4 EXPLANATION
Holocene thickness,
in meters
11
0
C. Depth of the regional unconformity
73°58' 73°56' 73°54' 73°52' 73°50' 73°48' 73°46'
40°34
'
Zone IV
Zone III
Zone II
Zone I
40°32
'
EXPLANATION
Horizon depth, in
meters
−5
−16
Base from National Centers for Environmental Information (2018) 0 1 2 KILOMETERS
WGS 84 ellipsoid
0 1MILE
Figure 5. Shoreface and Holocene sediment thickness and depth of the regional unconformity.
A, shoreface thickness, in meters; B, Holocene sediment thickness with contours labeled in meters;
C, depth of the regional unconformity, in meters below the North American Vertical Datum of 1988.
[WGS 84, World Geodetic System of 1984]10 Shoreface and Holocene Sediment Thickness Offshore of Rockaway Peninsula, New York
is generally acoustically transparent with a few faint internal In zone I (west), thick Holocene deposits can be
reflections, as observed in lines 14 and 21 (fig. 3A, B). Where attributed to natural and human processes. First, westward-
these faint and discontinuous internal reflectors are observed increasing accommodation allows for thicker sediment
in lines 39 and 61, they downlap onto the base of the shoreface deposits to accumulate. The westward-prograding reflections
reflector (fig. 3C, D). The base of the lower shoreface in within the deposit above the transgressive surface in zone I
line 14 is vertically separated from the regional unconformity likely represent the westward growth and elongation of the
by the western Rockaway Peninsula prograding package barrier spit (Sanderson, 2016; USACE, 2019). Second, the
(fig. 3A). In line 21 in west-central Rockaway Peninsula, construction of the western Rockaway Peninsula jetty in the
the base of the shoreface dips towards the north such that it 1930s trapped sediments transported along shore from the
intersects the regional unconformity below the seafloor at east, resulting in the progradation of the shoreline and shore-
depths of about 11 m (fig. 3B). The shoreface thickness at face to the south and a seafloor deposit updrift from the jetty.
line 21 is substantially greater than shoreface thickness at The seaward progradation of the shoreface decreases with
lines 14 and 39 (fig. 3A–C) because the base of the shoreface increasing distance from the western Rockaway Peninsula
is farther seaward and seems to be controlled by underlying jetty. The result is a southwesterly progradational package at
geology. In line 39 to the east (fig. 3C), the upper shoreface the western end of the island.
was not imaged because the vessel could not navigate into This combination of geology and human alterations
shallower water because of the presence of submerged groins. explains why Holocene sediment volume normalized for
In east-central Rockaway Peninsula, the regional unconformity zone width is substantially higher in zone I and why zone I
is at or just below the seafloor surface, and the upper sediment Holocene deposits account for 56.87 percent of total Holocene
unit is thin (fig. 4). The regional unconformity is shallow at sediment volume (table 1). In zone II (west-central), Holocene
lines 39 and 61; therefore, discontinuous internal reflectors sediment thins because of the shoaling regional unconformity
within the shoreface downlap directly onto underlying chan- (fig. 4). Zone III (east-central) has thin to absent Holocene
nels in lines 39 and 61, and the base of the shoreface coincides sediment cover over lines 39 and 65 (figs. 3C and 4), and
with the regional unconformity (fig. 3C, D). the only Holocene sediment in zone III is contained within
the active shoreface (figs. 3C and 5). As a result, Holocene
sediment volume normalized by width is substantially smaller
in zone III (table 1). In eastern zone IV, Holocene sediment
Discussion thickness is variable and can be attributed to sorted bedforms
and the ebb-tide delta (figs. 3D and 4).
Based on interpretations of similar surfaces observed at The shoreface unit is thickest in zone II, and this may
Fire Island by Schwab and others (2013), Locker and others be due to preexisting paleochannels that deepen the base
(2017), and Liu and Goff (2018), this report interprets the of the shoreface; as a result, there is more accommodation
regional unconformity as the transgressive surface, which is for shoreface deposits in this region (fig. 3B). This also can
the erosional surface formed by the landward displacement be observed in strike line 65, where paleochannels formed
of the shoreline across the inner shelf and shoreface during over the past hundreds of years in zone II cause the lower
Holocene sea-level rise. This study proposes that the upper shoreface to extend farther seaward than in any other zone
unit was deposited in shallow submarine environments during (fig. 4). Channels in zone II are above the transgressive surface
sea-level highstand in the late Holocene following the inter- (fig. 3B), which indicates that they are younger than channels
pretations of Schwab and others (2013), Locker and others in zones I, III, and IV. Similar channel features that incise
(2017), and Liu and Goff (2018), and this report will refer to into Holocene sediment units at Fire Island were observed by
upper unit sediment hereafter as “Holocene sediment.” Thus, Locker and others (2017) and Liu and Goff (2018) and were
the transgressive surface separates Holocene sediment above interpreted as channels formed by temporary inlets or barrier
from older Pleistocene sediment below (figs. 3A–D and 4). breaches. Similarly, this study proposes that the alongshore
The transgressive surface, Holocene sediment thickness, series of channels in zone II represents channelization that
and active shoreface thickness demonstrate alongshore vari- occurred at the western end of the peninsula during its earlier
ability (fig. 5A–C), which served as the basis for partitioning period of rapid, westward growth. These tidal channels
the peninsula into four geomorphic zones, with zone I in the are important because they increase the volume of active
west and zone IV in the east (fig. 1). This study proposes that shoreface deposits such that zone II shorefaces have almost
variability in Holocene sediment and active shoreface thick- twice the normalized volume of zone III shorefaces (table 1).
ness is driven by the westward dip in the transgressive surface Additionally, the data in table 1 indicate that the deepening
because it provides more accommodation in zones I and II of the shoreface base by channels in zone II may be more
(west and west-central; fig. 5A, B). The volumes of Holocene effective than the westward-dipping transgressive surface in
and active shoreface sediment were calculated within each zone I at increasing shoreface volume.
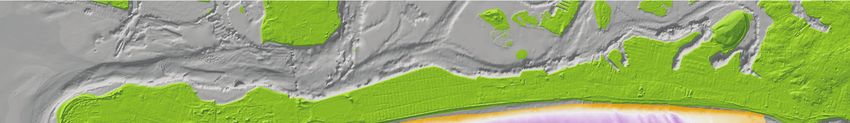
geomorphic zone (fig. 6A). Additionally, the volume of Volumes of zones III and IV shorefaces are affected
sediment was normalized by the alongshore width of the zone by the shoaling transgressive surface in eastern Rockaway
(table 1). Peninsula. Limited accommodation associated with theSummary 11
shoaling transgressive surface may contribute to the smallest The volumes of active shoreface and Holocene sediments
normalized shoreface unit volume in zone III (table 1). The were extracted at each shore-perpendicular chirp profile, with
shoaling of the transgressive surface in the east may be related subbottom profiles spaced about 500 m apart (fig. 6A, table 2).
to the presence of deep and laterally extensive channels Results from this analysis reinforce this study’s hypothesis
(fig. 3C) that resemble glacial outwash channels observed that Holocene sediment is highly variable and dependent on
offshore of Fire Island (Schwab and others, 2000). If these the geologic and morphologic characteristics of each zone. On
outwash deposits are composed of coarser sediment, it is the other hand, active shoreface volumes do not demonstrate
possible that sediment derived from glacial outwash could as great a magnitude of variability as Holocene sediment
armor the seabed from erosion, similar to what others have volumes (table 1). In parts of zone III and most of zone IV, the
observed offshore of Fire Island (Schwab and others, 2013). volumes of active shoreface and Holocene sediment converge
This armoring could have hindered wave-based erosion because of limited accommodation, which indicates that in
that occurred during the sea-level transgression. As a result, these zones, available Holocene sediment consists entirely
erosionally resistant glacial outwash channels may have of shoreface sediment (fig. 6B). This convergence in zone IV
exerted large controls in the westward dip of the regional is due to the ebb-tide delta, which represents Holocene and
unconformity. Where glacial outwash channels are present shoreface units. Divergence of Holocene and shoreface unit
in the east, the regional unconformity is shallower; on the volumes in zones III and IV occurs in areas with sorted
contrary, glacial outwash channels are absent in central and bedforms, which slightly increase Holocene unit volume.
western Rockaway Peninsula, where the regional unconfor-
mity deepens. The westward dip and eastward shoaling of the
transgressive surface play a large role in accommodation on A
Volume, in cubic meters
Zone I Zone II Zone III Zone IV
the shoreface and inner shelf and likely contribute to smaller 10,000
EXPLANATION
shoreface volumes in zone III (table 1). Though the shoaling 8,000 Holocene sediment
transgressive surface likely exerts the largest control on
per meter
Shoreface
6,000
shoreface and Holocene unit volumes in zone III, undulatory
4,000
bedforms in zones III and IV may affect shoreface and
Holocene volume on smaller scales. Undulatory bedforms in 2,000
zones III and IV are interpreted as sorted bedforms, which are 0
asymmetric bedforms commonly formed on coarse-grained B
Zone I Zone II Zone III Zone IV
deposits that migrate over periods of years to decades and 1.0
Ratio of shoreface
are similarly observed offshore of Fire Island (Schwab and
0.8
to Holocene
others, 2014; Goff and others, 2015) and the island of Long
0.6
Beach (Liu and others, 2018). Sorted bedforms may rework
underlying glacial outwash deposits and transfer sediment to 0.4
the inner shelf and shoreface, as proposed at Fire Island by 0.2
Schwab and others (2014) and Goff and others (2015). Even 0
0 5 10 15
though zone IV also has limited accommodation because
Distance along shore, in kilometers
of the shoaling transgressive surface, normalized shoreface
volume in zone III is greater than in zone IV because of Figure 6. Holocene and shoreface sediment volume and
localized deposition at the ebb-tide delta (figs. 3D and 4). ratio for zones I, II, III, and IV. A, volume, in cubic meters per
Thus, normalized Holocene sediment volume seems to be meter, of Holocene and shoreface sediment is shown for each
controlled by the depth of the transgressive surface, whereas shore-perpendicular chirp profile. Gray rectangles above the
normalized shoreface unit volume seems to be controlled by graphs and vertical dashed lines within the graphs delineate the
recent progradation in zone I, underlying tidal channels in extent of the geomorphic zones. B, ratio of shoreface to Holocene
zone II, limited accommodation in zone III, and the ebb-tide sediment.
delta deposits in zone IV.12 Shoreface and Holocene Sediment Thickness Offshore of Rockaway Peninsula, New York
Table 2. Volumes of Holocene and shoreface units at each shore-perpendicular chirp line transect.
[m3/m, cubic meter per meter]
Chirp line transect Holocene volume (1×10³ m3/m) Shoreface volume (1×10³ m3/m)
5 4.14 0.78
7 6.12 0.53
9 7.30 1.03
11 9.68 0.89
13 7.00 0.89
15 7.73 0.40
17 6.89 0.61
19 3.15 0.93
21 3.49 1.36
23 5.15 0.60
25 4.43 1.11
27 4.11 0.85
29 3.14 1.19
31 1.80 0.43
33 1.90 0.48
35 1.17 0.59
37 0.47 0.47
39 0.66 0.65
41 0.46 0.32
43 0.62 0.25
45 0.47 0.18
47 1.02 0.25
49 1.16 0.17
51 1.32 0.32
53 0.82 0.84
55 1.17 0.60
57 0.87 0.87
59 2.02 2.02
61 2.11 2.11
Summary the transgressive surface and includes the shoreface and
seafloor features with positive morphology. Maps indicate that
This report presents preliminary interpretations of seismic westward-thickening Holocene sediment may be related to
profiles, presents maps of active shoreface and Holocene sedi- accommodation and westward dip of the transgressive surface.
ment thickness, and quantifies active shoreface and Holocene The thickness and volume of shoreface units may be related
sediment volume from the shoreline to about 2 kilometers to underlying geology and positive morphological features.
offshore of the Rockaway Peninsula in New York. This The thickest shoreface units in zone II are spatially coincident
geophysical survey used an acoustic system mounted on with deeper geologic bases of the shoreface. Shorefaces
a modified, beach-launched towed sled and acquired data of moderate thickness in western and eastern Rockaway
in water depths as shallow as 2 meters, which allowed Peninsula are spatially coincident with positive morphological
researchers to image more of the upper and lower shoreface features (for example, deposits accumulating updrift from the
than other seismic studies. The results indicate that shoreface jetty, ebb-tide deltas, and so on). The thinnest shoreface units
and Holocene sediment thickness demonstrates variability are in east-central Rockaway Peninsula because of less accom-
that can be linked to geomorphic features and underlying modation caused by the shoaling transgressive surface and
stratigraphy. Holocene sediment is defined as sediment above glacial outwash channels. Quantifying the volume of sedimentReferences Cited 13
in the active shoreface and Holocene packages allows Goff, J.A., Flood, R.D., Austin, J.A., Jr., Schwab, W.C.,
researchers to better understand spatial variability in subaerial Christensen, B., Browne, C.M., Denny, J.F., and Baldwin,
barrier response to storms and sea-level rise because sediment W.E., 2015, The impact of Hurricane Sandy on the shore-
within shoreface and inner shelf deposits can be mobilized face and inner shelf of Fire Island, New York—Large
and transferred to the beach and dunes during storms and bedform migration but limited erosion: Continental Shelf
rising sea levels. Furthermore, this work supports objectives Research, v. 98, p. 13–25, accessed September 17, 2019, at
to evaluate the response of the peninsula to coastal restoration https://doi.org/10.1016/j.csr.2015.03.001.
projects, quantify peninsula sediment budgets, and predict the
short- and long-term resilience of the Rockaway Peninsula. Hapke, C.J., Lentz, E.E., Gayes, P.T., McCoy, C.A., Hehre,
R., Schwab, W.C., and Williams, S.J., 2010, A review
of sediment budget imbalances along Fire Island, New
York—Can nearshore geologic framework and patterns of
Acknowledgments shoreline change explain the deficit?: Journal of Coastal
Research, v. 263, p. 510–522, accessed December 17, 2019,
Many U.S. Geological Survey employees aided in field at https://doi.org/10.2112/08-1140.1.
operations at sea, on personal watercraft, and on land. We
thank Andrew Farmer, Nancy DeWitt, BJ Reynolds, Julie Liu, S., and Goff, J.A., 2018, Lower shoreface seismic
Bernier, Chelsea Stalk, Hunter Wilcox, and Joseph Terrano. stratigraphy and morphology off Fire Island, New
Noreen Buster and James Flocks provided helpful insight on York—Evidence for lobate progradation and linear ero-
seismic processing. We also thank Dave Foster and James sion: Continental Shelf Research, v. 163, p. 23–34,
Flocks for their insightful reviews. accessed December 30, 2019, at https://doi.org/10.1016/
j.csr.2018.04.013.
References Cited Liu, S., Goff, J.A., Flood, R.D., Christensen, B., and
Austin, J.A., Jr., 2018, Sorted bedforms off Western Long
Island, New York, USA—Asymmetrical morphology
Brutsché, K.E., Rosati, J., III, Pollock, C.E., and McFall, B.C.,
and twelve‐year migration record: Sedimentology, v. 65,
2016, Calculating depth of closure using WIS hindcast
no. 6, p. 2202–2222, accessed December 30, 2019, at
data: Vicksburg, Miss., U.S. Army Corps of Engineers,
https://doi.org/10.1111/sed.12462.
ERDC/CHL CHETN–VI–45, 9 p., accessed June 8, 2020, at
https://apps.dtic.mil/sti/citations/AD1006484. Locker, S.D., Miselis, J.L., Buster, N.A., Hapke, C.J.,
Wadman, H.M., McNinch, J.E., Forde, A.S., and Stalk,
Christie-Blick, N., and Driscoll, N.W., 1995, Sequence stra-
C.A., 2017, Nearshore sediment thickness, Fire Island,
tigraphy: Annual Review of Earth and Planetary Sciences,
New York: U.S. Geological Survey Open-File Report
v. 23, no. 1, p. 451–478, accessed October 19, 2019, at
2017–1024, 21 p., accessed September 20, 2019, at
https://doi.org/10.1146/annurev.ea.23.050195.002315.
https://doi.org/10.3133/ofr20171024.
Cohen, J.K., and Stockwell, J.W., Jr., 2010, CWP/SU–Seismic
Miselis, J.L., and McNinch, J.E., 2006, Calculating shoreline
Un*x release no. 44—An open source software pack-
erosion potential using nearshore stratigraphy and sedi-
age for seismic research and processing: Golden, Colo.,
ment volume—Outer Banks, North Carolina: Journal of
Center for Wave Phenomena, Colorado School of Mines,
Geophysical Research, v. 111, no. F2, no. F2, F02019,
accessed November 30, 2020, at https://github.com/
accessed May 21, 2020, at https://doi.org/10.1029/
JohnWStockwellJr/SeisUnix.
2005JF000389.
Cowell, P.J., and Kinsela, M.A., 2018, Shoreface controls
Mitchum, R.M., Jr., Vail, P.R., and Sangree, J.B., 1977,
on barrier evolution and shoreline change, in Moore, L.J.,
Seismic stratigraphy and global changes of sea level—Part
and Murray, A.B., eds., Barrier dynamics and response to
6. Stratigraphic interpretation of seismic reflection patterns
changing climate: Springer International Publishing, Cham,
in depositional sequences—Section 2. Application of seis-
Switzerland, p. 243–275, accessed December 10, 2019, at
mic reflection configuration to stratigraphic interpretation,
https://doi.org/10.1007/978-3-319-68086-6_8.
in Payton, C.E., ed., Seismic stratigraphy—Applications
Forde, A.S., Wei, E.A., DeWitt, N.T., and Miselis, J.L., 2021, to hydrocarbon exploration: Tulsa, Oklahoma, American
Archive of chirp subbottom profile data collected in 2019 Association of Petroleum Geologists memoir 26, p.
from Rockaway Peninsula, New York: U.S. Geological 117–133, accessed October 19, 2019, at https://archives.data
Survey data release, accessed July 2021 at https://doi.org/ pages.com/data/specpubs/seismic1/data/a165/a165/0001/
10.5066/P9ZO8QKJ. 0100/0117.htm.14 Shoreface and Holocene Sediment Thickness Offshore of Rockaway Peninsula, New York
National Centers for Environmental Information, 2018, Stive, M.J.F., and de Vriend, H.J., 1995, Modelling shore-
NCEI Hurricane Sandy digital elevation models: National face profile evolution: Marine Geology, v. 126, no. 1–4,
Oceanic and Atmospheric Administration, National Centers p. 235–248, accessed July 24, 2021, at https://doi.org/
for Environmental Information digital data, accessed 10.1016/0025-3227(95)00080-I.
January 20, 2021, at https://www.ngdc.noaa.gov/mgg/
inundation/sandy/sandy_geoc.html. Stone, B.D., and Borns, H.W., Jr., 1986, Pleistocene glacial
and interglacial stratigraphy of New England, Long Island,
Rampino, M.R., and Sanders, J.E., 1981, Evolution and adjacent Georges Bank and Gulf of Maine: Quaternary
of the barrier islands of southern Long Island, Science Reviews, v. 5, p. 39–52, accessed December 19,
New York: Sedimentology, v. 28, no. 1, p. 37–47, 2019, at https://doi.org/10.1016/0277-3791(86)90172-1.
accessed January 15, 2020, at https://doi.org/
10.1111/j.1365-3091.1981.tb01661.x. Taney, N.E., 1961, Geomorphology of the south shore of Long
Island: Beach Erosion Board, U.S. Army Corps of Engineers
Sanderson, E.W., 2016, Cartographic evidence for historical Technical Memorandum no. 128, 50 p. plus appendixes,
geomorphological change and wetland formation in Jamaica accessed December 19, 2019, at https://hdl.handle.net/
Bay, New York: Northeastern Naturalist, v. 23, no. 2, 11681/3478.
p. 277–304, accessed January 10, 2020, at https://doi.org/
10.1656/045.023.0208. U.S. Army Corps of Engineers, [USACE], 2016, Atlantic
Coast of New York, East Rockaway Inlet to Rockaway
Schwab, W.C., Baldwin, W.E., Denny, J.F., Hapke, C.J., Inlet and Jamaica Bay—Draft integrated Hurricane Sandy
Gayes, P.T., List, J.H., and Warner, J.C., 2014, Modification general reevaluation report and environmental impact state-
of the Quaternary stratigraphic framework of the inner- ment: U.S. Army Corps of Engineers, New York District,
continental shelf by Holocene marine transgression—An 270 p., accessed October 3, 2019, at https://www.nan.usace
example offshore of Fire Island, New York: Marine .army.mil/Portals/37/docs/civilworks/projects/ny/coast/
Geology, v. 355, p. 346–360, accessed October 11, 2019, at Rockaway/RockFeasStudy/1_Rockaway%20Draft%20Integ
https://doi.org/10.1016/j.margeo.2014.06.011. rated%20HSGRR%20and%20EIS.pdf?ver=2016-08-19-
094124-930.
Schwab, W.C., Baldwin, W.E., Hapke, C.J., Lentz, E.E.,
Gayes, P.T., Denny, J.F., List, J.H., and Warner, J.C., U.S. Army Corps of Engineers, [USACE], 2019, Final
2013, Geologic evidence for onshore sediment transport report—Integrated Hurricane Sandy general reevalua-
from the inner continental shelf—Fire Island, New York: tion report and environmental impact statement, Atlantic
Journal of Coastal Research, v. 29, no. 3, p. 526–544, Coast of New York, East Rockaway Inlet to Rockaway
accessed September 23, 2019, at https://doi.org/10.2112/ Inlet and Jamaica Bay: U.S. Army Corps of Engineers,
JCOASTRES-D-12-00160.1. New York District, 285 p., accessed September 25, 2019,
at https://www.nan.usace.army.mil/Portals/37/docs/
Schwab, W.C., Thieler, E.R., Allen, J.R., Foster, D.S., Swift, civilworks/projects/ny/coast/Rockaway/Rockaway%20Final
B.A., and Denny, J.F., 2000, Influence of inner-continental %20Report/Rock%20Jam%20Bay%20Final%20Report%20
shelf geologic framework on the evolution and behavior HSGRR%205-9-19.pdf?ver=2019-05-29-124532-717.
of the barrier-island system between Fire Island Inlet
and Shinnecock Inlet, Long Island, New York: Journal of Williams, S.J., and Duane, D.B., 1974, Geomorphology
Coastal Research, v. 16, no. 2, p. 408–422. and sediments of the Inner New York Bight Continental
Shelf: Fort Belvoir, Va., U.S. Army Corps of Engineers,
Stalk, C.A., DeWitt, N.T., Wei, E.A., Farmer, A.S., Miselis, Coastal Engineering Research Center, Technical
J.L., and Fredericks, J.J., 2020, Coastal bathymetry and Memorandum no. 45, 81 p., accessed October 15, 2019, at
backscatter data collected in September and October 2019 https://hdl.handle.net/11681/2870.
from Rockaway Peninsula, New York: U.S. Geological
Survey data release, accessed February 1, 2021, at
https://doi.org/10.5066/P9WNJSFN.You can also read