DEEP picker is a deep neural network for accurate deconvolution of complex two-dimensional NMR spectra - Nature
←
→
Page content transcription
If your browser does not render page correctly, please read the page content below
ARTICLE
                  https://doi.org/10.1038/s41467-021-25496-5                   OPEN

                  DEEP picker is a deep neural network for accurate
                  deconvolution of complex two-dimensional
                  NMR spectra
                  Da-Wei Li         1 ✉,   Alexandar L. Hansen            1,   Chunhua Yuan          1,   Lei Bruschweiler-Li1 & Rafael Brüschweiler       1,2,3 ✉
1234567890():,;

                  The analysis of nuclear magnetic resonance (NMR) spectra for the comprehensive and
                  unambiguous identification and characterization of peaks is a difficult, but critically important
                  step in all NMR analyses of complex biological molecular systems. Here, we introduce DEEP
                  Picker, a deep neural network (DNN)-based approach for peak picking and spectral decon-
                  volution which semi-automates the analysis of two-dimensional NMR spectra. DEEP Picker
                  includes 8 hidden convolutional layers and was trained on a large number of synthetic spectra
                  of known composition with variable degrees of crowdedness. We show that our method is
                  able to correctly identify overlapping peaks, including ones that are challenging for expert
                  spectroscopists and existing computational methods alike. We demonstrate the utility of
                  DEEP Picker on NMR spectra of folded and intrinsically disordered proteins as well as a
                  complex metabolomics mixture, and show how it provides access to valuable NMR infor-
                  mation. DEEP Picker should facilitate the semi-automation and standardization of protocols
                  for better consistency and sharing of results within the scientific community.

                  1 Campus Chemical Instrument Center, The Ohio State University, Columbus, OH, USA. 2 Department of Chemistry and Biochemistry, The Ohio State

                  University, Columbus, OH, USA. 3 Department of Biological Chemistry and Pharmacology, The Ohio State University, Columbus, OH, USA.
                  ✉email: lidawei@gmail.com; bruschweiler.1@osu.edu

                  NATURE COMMUNICATIONS | (2021)12:5229 | https://doi.org/10.1038/s41467-021-25496-5 | www.nature.com/naturecommunications                        1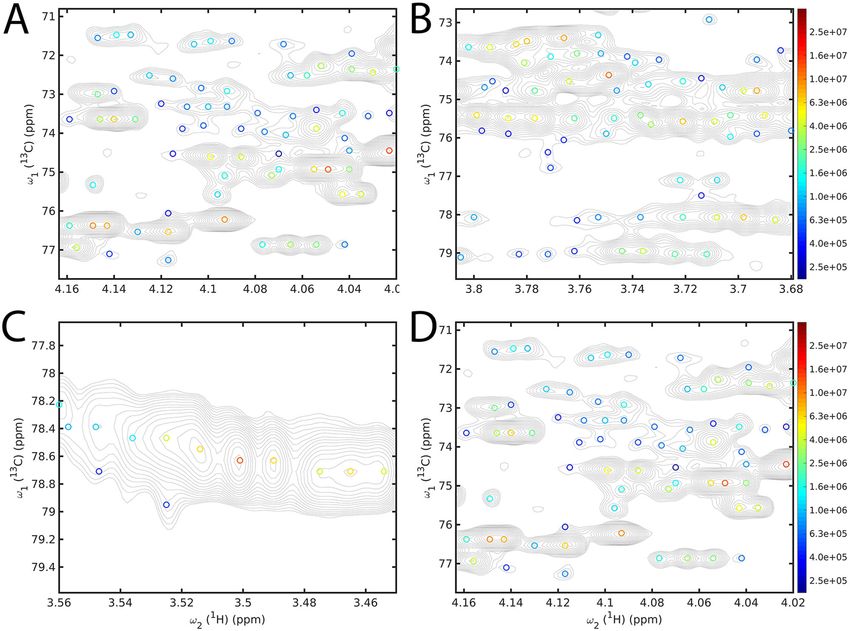
ARTICLE                                                                 NATURE COMMUNICATIONS | https://doi.org/10.1038/s41467-021-25496-5

M
           ultidimensional NMR spectroscopy is a powerful and                derive the most accurate set of empirical rules using a general-
           versatile method for the quantitative characterization of         purpose algorithm. While a traditional neural network typically
           a wide range of molecular systems ranging from small              contains only one or two hidden layers19,20, deep neural networks
molecules to large biomacromolecules and their complexes1,2. A               (DNN)19 are composed of many simple but nonlinear layers that
spectrum can consist of several hundred to thousands of cross-               starting from the raw input each transform the previous layer’s
peaks manifested as localized multidimensional spectral features             representation into a new representation at a higher, more
that in the case of 2D NMR belong to individual pairs of atoms               abstract level. With sufficient depth, deep learning can develop
that possess a nuclear spin. Identification and quantitative char-            extraordinarily complex functions capable of discovering intrinsic
acterization of cross-peaks critically affect all downstream ana-            structures in high-dimensional data that are invisible to the
lyses and can have a major impact on data interpretation. Each               human eye. In the past decade, deep learning had an important
cross-peak is characterized by the position of its center (i.e. fre-         impact on many different fields outperforming traditional algo-
quency coordinates corresponding to chemical shifts), its peak               rithms or even humans, such as in image labeling, speech
shape along each dimension (usually Voigt shape with variable                recognition, and natural language understanding20. Although
amounts of Lorentzian or Gaussian components), and its peak                  NMR data possess many unique properties, machine learning has
amplitude (or volume). The parameters that define the cross-                  started to make in-roads21, such as for spectral reconstruction of
peaks represent the chemical and biological information of                   non-uniformly sampled (NUS) datasets22,23, spectral denoising24,
interest about the molecule(s) present in the sample. The analysis           chemical shift prediction25–28, and also peak picking29.
of an NMR spectrum invariably involves some or all of the fol-                  Here, we introduce a sophisticated NMR spectral peak
lowing steps: (i) identification of the complete set of cross-peaks,          deconvolution method, based on a Deep Neural Network, called
known as peak picking; (ii) assignment of each cross-peak to the             DEEP Picker (as an abbreviation for Deep nEural nEtwork Peak
atoms it belongs to; and (iii) quantification of each cross-peak by           Picker). Its performance is demonstrated for different types of 2D
the determination of the peak amplitude or volume. Despite                   NMR spectra of folded and intrinsically disordered proteins in
many years of progress, the above steps can only be partially                solution and a mouse urine sample containing spectral regions
automated. This applies in particular to spectra of large molecular          with variable degrees of spectral overlaps.
systems or complex mixtures containing many cross-peaks that
tend to overlap, which makes their spectral deconvolution chal-
lenging without expert human assistance. However, due to the                 Results
large number of cross-peaks, such work can be tedious, time-                 Generation of the training set. Since for every deep learning
consuming, and subjective with results differing between experts             project the size and quality of database information are essential
and labs, thereby limiting the transferability of the analysis within        components, the exponential growth of data repositories over the
the research community. This makes the availability of an                    past decade has been one of the major drivers for the rapid
approach necessary that accomplishes the above tasks both with               progress in deep learning. Such data can be either obtained from
high accuracy and high reproducibility.                                      the real world (e.g. image libraries) or be synthetically generated
   Different methods have been proposed for peak picking and                 entirely in silico, such as in data augmentation techniques30. A
spectral deconvolution. The simplest approach is to select local             critical part of the successful training of a neural network is the
maxima as peak positions. However, because of spectral noise,                availability of a large amount of high-quality training data that
not all local maxima belong to true peaks. Moreover, in crowded              comprehensively mirror the envisioned applications. This
regions, some peaks may not correspond to maxima because of                  includes an optimal class balance of the training data by ensuring
the close vicinity of larger peak(s) with which such shoulder peaks          that the distribution of training data among all classes is unbiased,
overlap. To address these formidable challenges, numerous                    otherwise, DNN accuracy for the identification of members of the
approaches have been developed in the past. Early methods                    underrepresented class(es) will be reduced31,32. As an example,
focused on criteria based on signal intensity, volume, signal-to-            for NMR peak picking, if the peaks in the training set have
noise ratios, and peak symmetry3–11. Other peak picking methods              dominantly Gaussian lineshape, the resulting DNN is more likely
exploit various forms of matrix factorization12–14, or singular              to fail when applied to Lorentzian peaks and vice versa.
value decomposition15. Another approach models spectra as                       In order to ensure a large database of class-balanced, high-
multivariate Gaussian densities followed by filtering with respect            quality training data, we built our own database consisting of
to peak intensities and widths16–18. In these methods, certain               synthetic 1D NMR spectra with different peak widths, shapes,
spectral features are extracted after pre-processing and assessed            and peak overlaps. As discussed below, our 1D NMR-trained
following a set of rules to determine whether a data point is                DNN can be deployed also to higher dimensional spectra.
considered as a peak or not. Because these rules are defined based            Because for synthetic spectra the parameters of the individual
on experience, they often involve a lengthy trial and error process          peaks are accurately defined, their use as a training set has the
to decide which features best describe various types of peaks in             distinct advantage over an experimental training set that the
different types of spectra. Moreover, each feature requires criteria         “ground truth” is by definition known. A synthetic database has
that can depend on many parameters, especially when noise and                the additional advantage over an experimental database in that it
other artifacts are present, which must be fine-tuned manually.               allows almost unlimited coverage by sampling many more
Although these peak picking methods have shown steady                        different peak shapes and overlap scenarios without requiring a
improvements, much of the NMR community still relies at least                human expert’s input for peak classification. The shapes of all
in part on manual peak picking, whereby the final result is                   synthesized NMR peaks generated here follow a Voigt profile33,
dependent on the expertise and judgment of the human NMR                     which corresponds to the convolution of a Lorentzian and a
spectroscopist(s) working on the project. The latter currently still         Gaussian peak shape with the two shapes present in different
outperforms the best peak picker software.                                   amounts. The rationale for the Voigt profile is that in solution
   Neural network-type machine learning methods introduced the               NMR the natural lineshapes are in good approximation
concept of end-to-end learning where the machine is only given               Lorentzian, but after apodization using commonly used window
the input and the correct result. Thus, a machine-learning model             functions, such as the 2π-Kaiser window function, the peaks
is trained instead of hardcoded for the given data, where neural             acquire a Voigt profile with some Gaussian component with
networks discover the underlying key features and automatically              improved spectral resolution. The amount of the Lorentzian

2                NATURE COMMUNICATIONS | (2021)12:5229 | https://doi.org/10.1038/s41467-021-25496-5 | www.nature.com/naturecommunications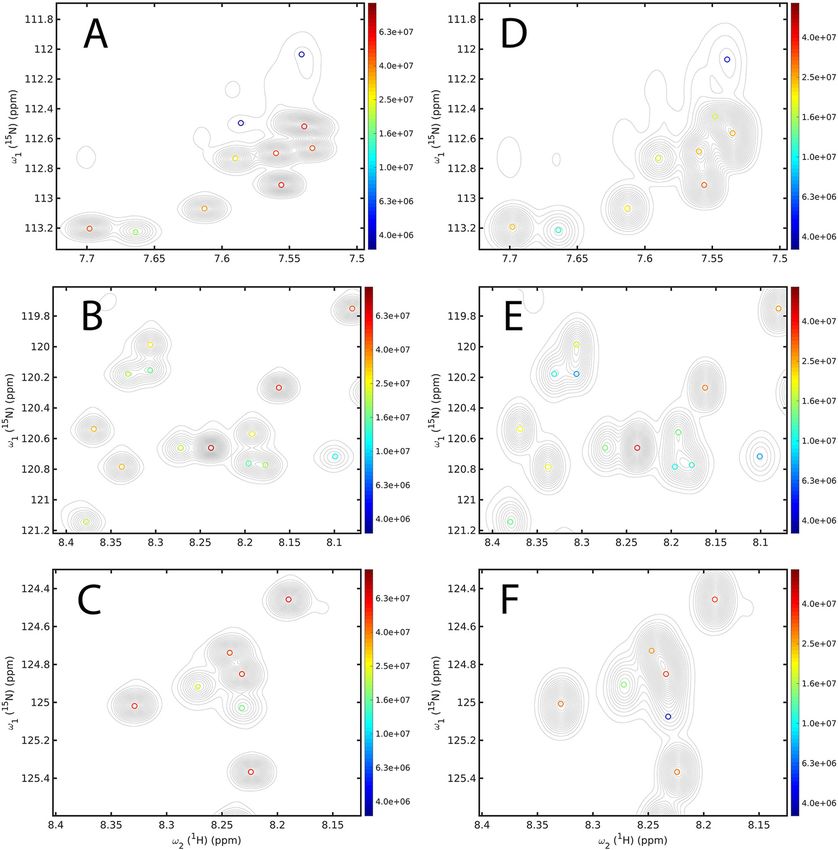
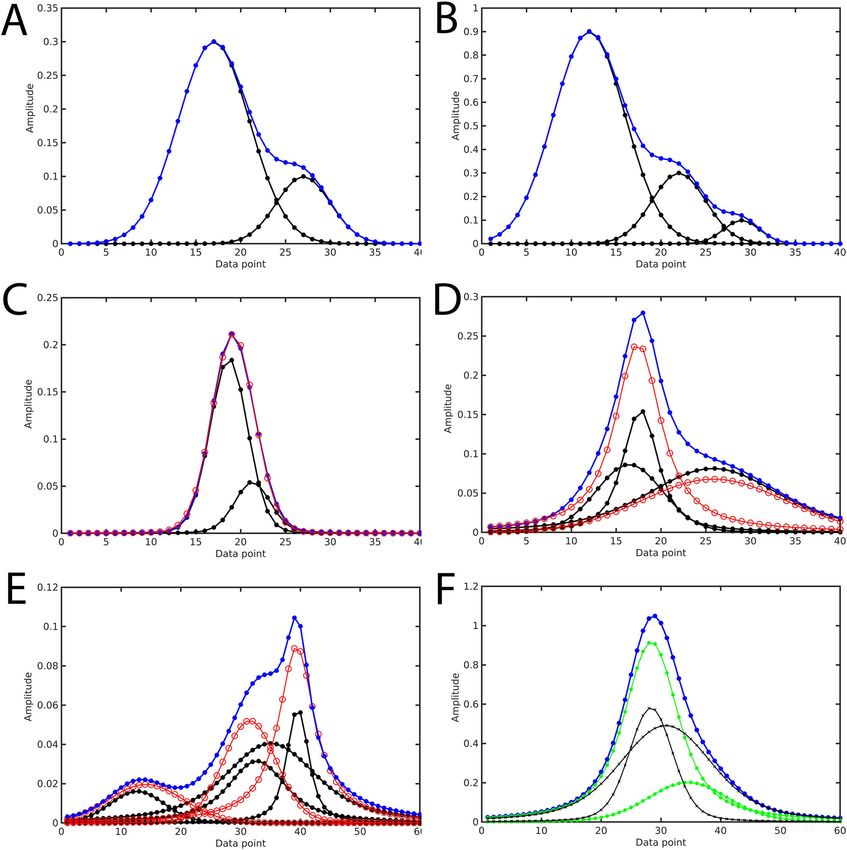
NATURE COMMUNICATIONS | https://doi.org/10.1038/s41467-021-25496-5                                                                    ARTICLE

component in the final peak shape depends on the natural                            Accurate identification of shoulder peaks is one of the most
linewidth, i.e. 1/(πT2) where T2 is the transverse relaxation time.             challenging tasks for any peak-picking algorithm. Unlike main
In our training set, the number of points per peak (PPP), which                 peaks, shoulder peaks do often not belong to local maxima of the
is given by the number of data points that sample the peak’s full-              full spectrum, which makes their identification along with the
width at half-height (FWHH) (i.e. FWHH/(digital resolution)), is                accurate determination of their positions and amplitudes signifi-
allowed to vary either from 6 to 20 points or from 4 to 12 points,              cantly harder. Figure 1F depicts the profile of two overlapped peaks
whereby the former is typical for protein and the latter for                    along with two distinct peak deconvolutions, which both achieve
metabolomics spectra. The Lorentzian component can vary
ARTICLE                                                                   NATURE COMMUNICATIONS | https://doi.org/10.1038/s41467-021-25496-5

Fig. 1 Examples of 1D NMR training sets of convoluted NMR spectra (blue) and their deconvolutions (black, red). A Sum spectrum (blue) that can be
unambiguously deconvoluted into two individual overlapping peaks (black). B Sum spectrum (blue) that can be unambiguously deconvoluted into three
individual overlapping peaks (black). C Sum spectrum (blue) of two overlapping peaks (black) can be accurately represented by a single peak (red). D Sum
spectrum (blue) generated from three distinct peaks (black), but can also be accurately explained by only two peaks (red). E Sum spectrum (blue)
generated from four distinct peaks (black), but can also be accurately explained by only three peaks (red). F Sum spectrum (blue) can be deconvoluted
equally well into two distinct peak pairs (one with black crosses and one with green circles).

location invariance of features. By contrast, location invariance              data point of the input spectrum. For any data point predicted to
generally does not apply here, since a shift of one peak (or                   be a peak (Class 2 or 1), DEEP Picker will also predict the sub-
feature) will generally affect the interpretation of nearby peaks (or          pixel peak position relative to the on-grid points, peak amplitude,
features). Therefore, we do not use max-pooling except for the                 peak width, and the Lorentzian vs. Gaussian components to the
penultimate layer. A convolutional layer with SoftMax                          Voigt shape using another convolutional layer, called output
activation37 called the output classifier layer, is utilized to classify        regressor layer. It is worth mentioning that all kernels were
every data point, which assigns an individual score for all three              applied multiple times, i.e. across the full input spectrum in a
peak classes (2, 1, or 0), which are then normalized for each data             sliding window fashion and each convolutional layer has multiple
point so that their sum is 1. The class with the maximal score is              kernels although in Fig. 2 only one kernel operating at an
then chosen as the predicted class with the numerical score as a               arbitrarily chosen position is illustrated for each layer. The loss
quantitative measure of confidence of the predicted class for each              function is the mean squared error (MSE) for the regressor and

4                  NATURE COMMUNICATIONS | (2021)12:5229 | https://doi.org/10.1038/s41467-021-25496-5 | www.nature.com/naturecommunications
NATURE COMMUNICATIONS | https://doi.org/10.1038/s41467-021-25496-5                                                                             ARTICLE

Fig. 2 Architecture of the deep neural network peak picker (DEEP Picker), which is composed of seven 1D convolutional layers with rectified linear
(ReLU) unit activation functions (C1–C7), one max-pooling layer (P1), one convolutional layer with a SoftMax activation function to classify every data
point, and one convolutional layer with linear activation function to predict the peak position at the sub-pixel resolution, peak amplitude, peak width,
and the Lorentzian fraction of its peak shape. The input of DEEP Picker is an N × 1 tensor (column vector), where N is the number of data points of the 1D
input spectrum. Hidden layers and output layers all have the same dimension N as input. The depths of the 8 hidden layers (from C1 to C7, P1) are 40, 20,
10, 20, 10, 30, 18, and 18. Their kernel sizes are 11, 1, 11, 1, 1, 11, 1, and 3 and they are 1 for both the classifier and regressor. As is common in machine
learning, all kernels are applied N times in a sliding window fashion with each layer having multiple kernels (note that in the figure for each layer only a
single kernel is indicated for a given position). The output classifier layer (top right) yields the prediction of whether a data point is a Class 2 peak, Class 1
peak, or Class 0 non-peak. The output regressor layer (bottom right) yields the predicted peak parameters for all peaks (Class 2 and 1).

cross-entropy for the classifier. The loss value (training target) is              been identified as a peak, the deconvoluted peak is generated at
the weighted average of the cross-entropies of the three classes of               sub-pixel position resolution along with its peak amplitude, peak
data points and MSE of the two classes of peaks with the weights                  width, and the fraction of Lorentzian vs. Gaussian components
provided in Table S3. DEEP Picker was trained using the Adam                      obtained from the output regressor layer. In Fig. 3B, red lines
optimizer with a learning rate of 0.002 for 4000 epochs37. All data               correspond to reconstructed individual Class 2 peaks from the
were used simultaneously in a single batch. The performance of                    prediction, including the peaks at 8.59 and 8.65 ppm. Magenta
the validation set was monitored in this process to prevent                       lines correspond to reconstructed individual Class 1 peaks
potential overfitting. However, since the relatively small size of                 (shoulder peaks) by the same method and the sum of the red
our neural network compared to the size of our training set,                      and magenta spectra corresponds to the input spectrum.
overfitting is not an issue. The output classifier layer (top-right)                   Because DEEP Picker is a local feature-based predictor, it also
assigns to every spectral data point output in the form of either a               assigns Class 2 or 1 peaks to noise features that are close to the
Class 2 peak, Class 1 peak, or a Class 0 non-peak. The output                     baseline in regions without signal. Such noise peaks are
regressor layer (bottom-right) predicts peak parameters (ampli-                   subsequently removed if they are below a peak amplitude cutoff
tude, linewidth, etc.) for any Class 2 or 1 peak. Because we label 3              based on an automated global noise level estimator (see
data points to be a peak for each true peak in the training set,                  Supporting Information for details). Similarly, DEEP Picker
DEEP Picker will usually predict three consecutive data points as                 may also predict a point with a small deviation from an otherwise
peak for well-defined peaks. However, for a peak with large                        smooth profile to be a separate peak. Because the predicted
positional uncertainty, such as a strongly overlapped peak, DEEP                  amplitude of such a peak will be small, it can be filtered out using
Picker might assign peaks to regions with fewer or more than                      the same type of peak amplitude cutoff.
three data points. In either case, the application of a non-
maximum suppression algorithm34,38 for post-processing only                       Generalization to 2D spectra. Because 2D NMR cross-peaks can
keeps a (single) data point that has the highest score for each                   have a much larger number of different peak shapes and overlap
region as further explained below.                                                patterns than 1D spectra, the training set would need to be
   The 1D DEEP Picker was then tested for a 1D 1H cross-section                   extremely large to achieve a robust neural network-based peak
(along ω2) of an experimental 2D 15N–1H HSQC spectrum of K-                       picker. Instead, we apply the DEEP Picker separately to all rows
Ras, which is a globular protein with 169 residues. Figure 3A                     and columns of a 2D spectrum and combine the scores for 2D
shows the point-by-point prediction of the output classifier layer                 cross-peak identification. In order for a 2D data point to be
where the red, magenta and black lines are scores for the Class 2                 identified as a cross-peak, the data point must be assigned by
peaks, Class 1 peaks, and Class 0 non-peaks, respectively. For                    DEEP Picker to a 1D peak in both its cross-sections along ω1
each data point, the class with the highest score is taken as the                 (column) and ω2 (row) (exceptions will be discussed below). Peak
predicted class. The sum of scores for Class 2 peaks and for Class                width, sub-pixel position resolution, and percentage of Lorentzian
1 peaks is taken as a confidence level score of the picked peaks                   vs. Gaussian components to the Voigt profile along the two
(see Fig. S8). This helps focus subsequent visual inspection on                   dimensions are taken directly from the corresponding 1D pre-
low-scoring peaks for their potential removal from further                        diction whereas the peak amplitude is obtained as the average of
analysis. For example, Class 2 has the highest score for three                    the two 1D predictions and the peak confidence level score is
consecutive data points around 8.59 ppm (indicated by a red                       calculated as the lower of the two 1D confidence level scores.
arrow) and, hence, all three data points are predicted to be Class 2                 2D spectral peak picking is illustrated in Fig. 4 using a synthetic
peaks. Application of the non-maximum suppression algorithm                       spectrum consisting of two overlapping cross-peaks where the
will then suppress low-confidence predicted peaks that are direct                  true peak positions are indicated by blue circles. Figure 4A shows
neighbors of predicted peaks and only the middle data point with                  how the two cross-peaks at locations (40,40) and (48,48) are
a score around 1.0 is kept since the scores of the two neighboring                picked correctly. In addition, the row-based 1D peaks (bold black
data points are only around 0.6. Once this middle data point has                  lines) identified by DEEP Picker also intersect with the column-

NATURE COMMUNICATIONS | (2021)12:5229 | https://doi.org/10.1038/s41467-021-25496-5 | www.nature.com/naturecommunications                                       5
ARTICLE NATURE COMMUNICATIONS | https://doi.org/10.1038/s41467-021-25496-5
Fig. 3 Peak prediction by DEEP Picker for K-Ras 15N–1H HSQC for part of a cross-section along the direct 1H dimension. A Prediction score of Class 2
peaks (red), Class 1 peaks (magenta), and Class 0 non-peaks (black) from the output classifier layer after a 3-point moving average. The class with the
highest score is the class assigned to a given data point after non-maximal suppression (see text). B Input spectrum (blue) together with reconstructed
individual Class 2 peaks (red) and Class 1 peaks (magenta).
based 1D peaks (bold red lines) at the locations (40,48) and 15N–1H HSQC spectra of proteins whereby all NMR spectra
(48,40), which would cause the prediction of these two additional were processed using NMRPipe39 with manual phase correction
cross-peaks (red crosses) that are however false. The 2D peak- and automatic polynomial baseline removal. 2D HSQC spectra
picking algorithm is able to identify and remove these types of belong to the most widely used spectra in biomolecular NMR,
false-positive cross-peaks based on the fact that along both their for example, for fingerprinting, chemical shift perturbation in
rows and columns they behave as 1D shoulder peaks (Class 1 titration studies, or pseudo-3D NMR experiments for quanti-
peaks). Figure 4B illustrates another instructive case where two tative dynamics studies (R1, R2, R1ρ, CPMG, etc.)1. Hence, the
true cross-peaks (solid blue squares) are close along both the accurate computer-assisted analysis of HSQC spectra, including
direct and indirect dimension and only one 1D peak will be strongly overlapped regions, is important for many different
predicted for any column (bold black line) and any row (bold red types of NMR applications. We first applied DEEP Picker to α-
line), despite that the cross-peak shape suggests the presence of synuclein, which is an intrinsically disordered 140-residue
two strongly overlapping peaks. In this case, the black and red protein. The 15N–1H HSQC spectrum was originally measured
lines reflecting column-based and row-based 1D peaks, respec- with 1024 complex data points along the direct dimension and
tively, are tilted deviating significantly from straight vertical and 256 complex data points along the indirect dimension. In order
horizontal directions. The 2D peak-picking algorithm searches to assess DEEP Picker’s power to recover accurate cross-peak
for this type of pattern by calculating the angle between the most information at high resolution from lower resolution data, we
tilted segment of the black and red lines. If both angles are larger reprocessed the time-domain data by artificially reducing the
than a cutoff of 14°, the peak at the intersection will be replaced spectral resolution along the indirect dimension: by removing
by two new peaks, whose positions are defined by the midpoints the t1 increments 129–256 the spectral resolution was reduced
of the end positions of the two segments. The most tilted by a factor two. DEEP Picker was then applied to both the
segments of the black and red lines are plotted as dotted lines in original high-resolution and the reduced resolution spectra for
Fig. 4B and the new cross-peaks as open blue circles. The comparison. The results for selected regions are shown for the
predicted peaks slightly deviate from the exact locations of the original spectrum in Fig. 5A–C (left panels) and for the reduced
true peaks (filled blue circles), which shows that in the case of resolution spectrum in Fig. 5D–F (right panels). DEEP Picker
such strong peak overlap, the extracted 2D cross-peaks can have successfully identified all cross-peaks including those belonging
some small positional errors. to strongly overlapped regions with the exception of a very low-
Our method can be extended from 2D to 3D NMR spectra by intensity peak (Fig. 5D) approaching the noise level in the
analyzing 1D cross-sections along all three dimensions in a spectrum that used only half of the experimental data. This
manner that is analogous to the extension of DEEP Picker from demonstrates that the peak picker is able to accurately decon-
1D to 2D. Since DEEP Picker was specifically trained on 1D volute such a complex spectrum, even if the resolution is lim-
spectra that are representative for cross-sections of 2D spectra in ited, provided that the signal-to-noise of the signals of interest is
terms of a number of points per peak, lineshapes, etc., adaptation sufficiently high.
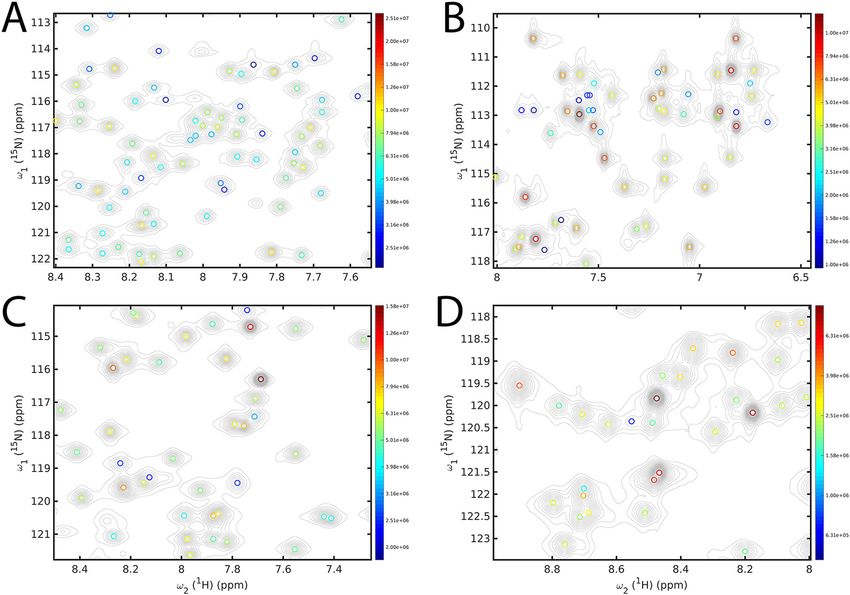
to 3D spectra, which tend to have much lower digital resolution DEEP Picker works well also for globular proteins as is
while suffering from fewer cross-peak overlaps due to the 3rd demonstrated in Fig. 6 for 15N–1H HSQC spectra of four different
dimension, poses new challenges. We plan to extend DEEP Picker proteins, namely Gankyrin40 (24.4 kDa), PLA241 (13.8 kDa),
to 3D (and possibly even higher dimensional spectra) in the future ARID42 (10.9 kDa), and Rop43 (14.2 kDa). All four spectral regions
by training a neural network that uses fewer points per peak. depicted have significant amounts of cross-peak overlap, which are
handled by DEEP Picker remarkably well (for additional informa-
Application to 15N–1H HSQC spectra of proteins. After training tion, see Supporting Information). Figure S6 shows a comparison
on synthetic data, we applied DEEP Picker to experimental 2D of the peak picking results of NMRPipe, Sparky, NMRViewJ
6 NATURE COMMUNICATIONS | (2021)12:5229 | https://doi.org/10.1038/s41467-021-25496-5 | www.nature.com/naturecommunications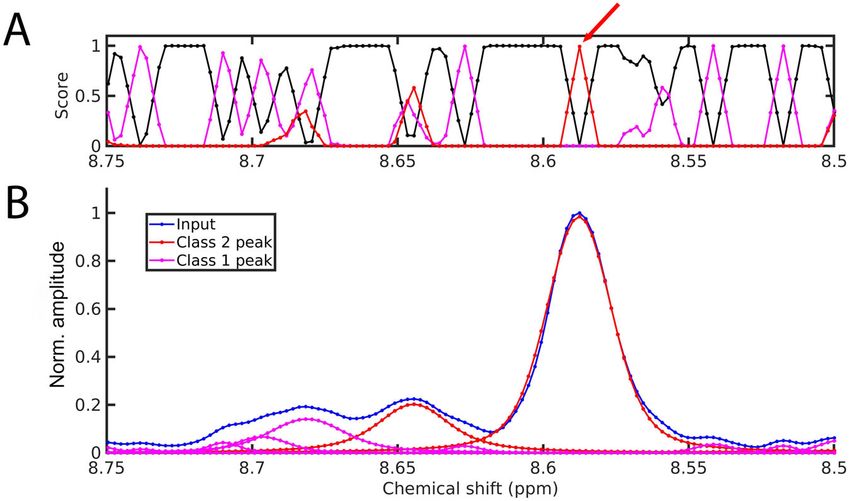
NATURE COMMUNICATIONS | https://doi.org/10.1038/s41467-021-25496-5 ARTICLE
transverse relaxation times and sharp cross-peaks with small
linewidths, but the number of cross-peaks can be very large
depending on the complexity of the sample. We demonstrate the
application of DEEP Picker for a 2D 13C–1H HSQC spectrum of
mouse urine, which may contain hundreds of different metabo-
lites with various concentrations. Selected spectral regions of the
spectrum together with the picked cross-peaks are shown in
Fig. 7A–D. The aliphatic regions shown belong to some of the
most crowded regions of urine spectra that include numerous
carbohydrates. Because a dominant fraction of the cross-peaks of
mouse urine belongs to unknown metabolites, the ground truth is
largely unknown. Hence, Fig. 7 primarily serves as an illustration
of the performance of DEEP Picker. Nonetheless, visual inspec-
tion shows how DEEP Picker is able to identify and distinguish
between strongly overlapping cross-peaks that pose significant
challenges for their analysis from standard 2D 13C–1H HSQC
experiments44. More accurate spectral analysis directly benefits
the identification of metabolites in urine and other complex
metabolomics mixtures, which is a key step toward their
quantitative profiling2.
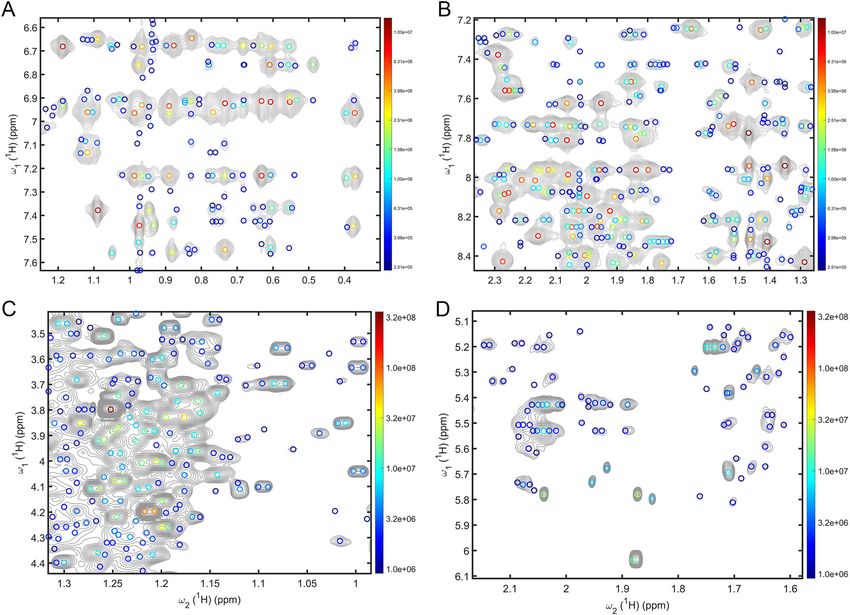
Application to NOESY and TOCSY spectra. When applied to
other common 2D NMR experiments, such as NOESY and
TOCSY, which tend to possess a larger dynamic range along with
larger numbers of challenging peaks than HSQC spectra, DEEP
Picker does a remarkable job too. This is demonstrated in Fig. 8,
which shows regions of a NOESY spectrum of protein Im7 and a
TOCSY spectrum of urine. DEEP Picker is able to identify also
individual multiplet components due to J-splittings, which can be
challenging for traditional peak pickers. DEEP Picker has generally
a higher confidence score for major cross-peaks and lower con-
fidence in low amplitude cross-peaks or multiplet components.
Selected regions of the NOESY spectrum with picked peaks that are
color-coded according to their confidence level score are shown in
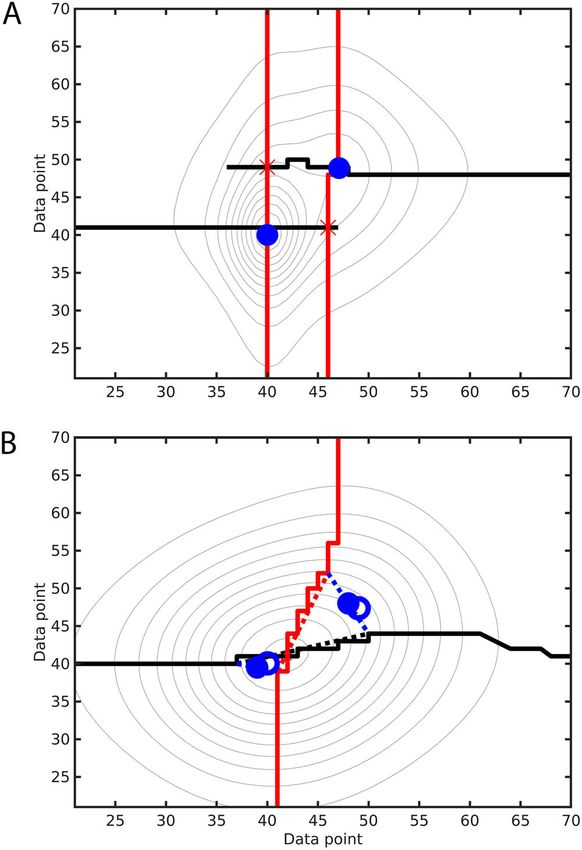
Fig. 4 Contour plot of the synthetic 2D spectrum representing two Fig. S8. Similar to Fig. 7, since the ground truth of NOESY and
overlapping cross-peaks (blue circles). First, DEEP Picker predicts 1D peak TOCSY spectra with their very large number of cross-peaks is only
positions for each column (row) labeled in black (red). A Next, the 2D partially known, Fig. 8 serves primarily as an illustration of what
peak-picking algorithm uses intersections of black and red lines to define can be expected of DEEP Picker for such kind of complex spectra.
2D cross-peaks, while removing false positive peaks (red crosses) using the
approach described in the text. B If both black and red lines deviate from
perfect vertical and horizontal lines, respectively, the 2D peak-picking
Quantitative performance and effect of noise and other arti-
algorithm will replace the intersection peak with two cross-peaks (blue
facts. A quantitative and objective assessment of a peak picker is
filled circles) near the true positions (blue open circles) using the approach
desirable. However, unlike other common machine learning
described in the text.
applications, there is no large, carefully curated NMR spectral
test database available for an objective assessment of NMR peak-
picking performance. Here, we used previously determined or
and DEEP Picker for challenging regions of protein 15N–1H HSQC published cross-peak assignments that were obtained with the
spectra, whereby only DEEP Picker successfully identified all help of complete sets of 3D assignment experiments. We assessed
shoulder peaks. the picked 15N–1H HSQC cross-peaks in terms of the number of
false negatives and false positives, whereby “false” positives were
visually inspected as they may correspond to true cross-peaks
Application to 13C–1H HSQC of metabolomics sample. NMR belonging to impurities, chemically modified, or aggregated
spectra of metabolomics samples represent another important proteins. In Table S2, quantitative statistics and performance
class of samples where strong peak overlaps can occur in some metrics of DEEP Picker are compiled for two of the most chal-
regions of 2D 13C–1H HSQC spectra, which are usually measured lenging proteins described here. The results suggest that the
at 13C natural abundance, because of the often large number of accuracy of DEEP Picker is very high with the only false negative
different metabolites present in such samples. In contrast to peaks corresponding either to peaks that almost perfectly overlap
protein NMR spectra, the large dynamic range of peak amplitudes with other peaks in the 2D 15N–1H HSQC and could only be
and amplitudes due to large differences in metabolite con- identified with the help of additional 3D triple-resonance (1H,
centrations pose an additional challenge. A key objective of 13C, 15N) NMR experiments or because they were weak falling
metabolomics studies is “fingerprinting”, which is the unique well below a given amplitude cutoff (see Supporting Informa-
identification and analysis of as many cross-peaks as possible, tion). Five peaks with high amplitudes were identified by DEEP
even for ones that barely exceed the noise level, toward a com- Picker in both protein spectra that upon visual inspection look
prehensive and quantitative analysis of these types of biological like real peaks, but had not been assigned. A large number of
samples. Because of their small size compared to proteins, weak peaks were identified by DEEP Picker with amplitudes
metabolites undergo rapid overall tumbling leading to long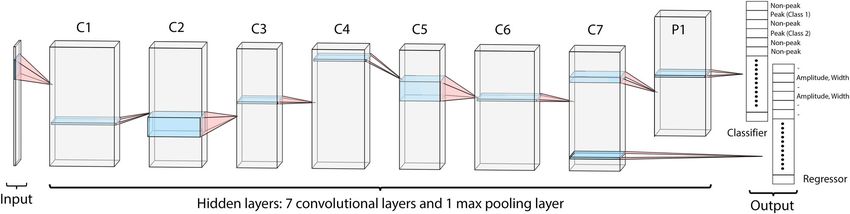
ARTICLE                                                                    NATURE COMMUNICATIONS | https://doi.org/10.1038/s41467-021-25496-5

Fig. 5 Performance of DEEP Picker for selected regions of 2D 15N–1H HSQC spectrum of α-synuclein. A–C HSQC spectrum processed with original
resolution and D–F with reduced resolution along indirect dimension. Three pairs of panels (A, D), (B, E), (C, F) show the same 2D regions for comparison.
Picked cross-peaks are indicated as circles and color-coded according to their amplitude on a logarithmic scale, whereas the contour line spacings are
linear. Despite the lower spectral resolution in D–F, DEEP correctly picked the peaks, including all strongly overlapped cross-peaks. Note that the spectra of
Panels D–F have reduced sensitivity since they used only half of the time-domain data.

assigned. Visual inspection, based on contour plots with the                    effectively filtered out during post-analysis using cutoff criteria
lowest contours drawn at a very low level, revealed that these                  based on amplitude.
cross-peaks are in all likelihood true peaks (Fig. S9). Their                      Although the HSQC spectra used in this work stem from “real-
unambiguous annotation as main peaks requires spin con-                         world” applications with signal-to-noise ratios (S/N) that are typical
nectivity information from additional multi-dimensional NMR                     for samples measured at our shared NMR facility, we measured
experiments, but due to their low amplitudes sensitivity could be               additional HSQC spectra on a K-Ras sample with a concentration
a significant challenge. It is possible that, in addition, certain               of only 130 μM. We collected a 30 m 15N–1H HSQC spectrum with
noise artifacts or peaks with small phase errors are computa-                   only four scans per increment and, for comparison, also with
tionally indistinguishable from true peaks. Since their amplitudes              108 scans per t1-increment improving S/N by over a factor of 5. As
are usually only a fraction of the major peaks that are of primary              shown in Fig. S7, the application of DEEP Picker reveals that even
interest for the vast majority of NMR applications, they can be                 for the low-sensitivity spectrum with S/N ≅ 25:1, DEEP picks all

8                  NATURE COMMUNICATIONS | (2021)12:5229 | https://doi.org/10.1038/s41467-021-25496-5 | www.nature.com/naturecommunications
NATURE COMMUNICATIONS | https://doi.org/10.1038/s41467-021-25496-5                                                                      ARTICLE

Fig. 6 Illustration of peak-picking performance of DEEP Picker for four different proteins. Selected regions of 2D 15N–1H HSQC spectrum of the four
different proteins A Gankyrin, B PLA2, C ARID, and D Rop. Picked cross-peaks by DEEP Picker are indicated as circles and color-coded according to their
amplitude on a logarithmic scale, whereas the contour line spacings are linear. Experimental information and enlarged plots of each spectrum are given in
the Supporting Information. Some of the weakest cross-peaks (small number of contours) were not picked because they are below the noise cutoff used by
DEEP Picker.

isolated peaks correctly and is able to identify the vast majority of           significant distortions or substantial amounts of truncation
shoulder peaks. Sometimes, however, multiple peaks are picked                   artifacts. A neural network could be trained to recognize
around a peak maximum because of the uneven peak shapes                         truncation artifacts but not for the discrimination between real
displayed by the noisy spectrum, and some low-amplitude peaks                   peaks and noise of similar amplitude.
close to the noise floor are lost.
   Because DEEP Picker uses local information only, artifacts or
noise that share the same local features with true peaks cannot be              Discussion
easily recognized. Such artifacts are best identified and removed in             In the past, Kernel filter methods have been widely used in image
a column-by-column post-analysis, including residual water                      classification long before machine learning entered the field. They
signals that have a well-defined 1H chemical shift or t1-noise                   include specialized filters, for example, for edge and corner
forming vertical signal streaks along the indirect dimension, and               detection, sharpening, and blurring45. Among these filters,
they were not counted as false positives. Similarly, phase errors of            Laplacian-type filters have been proposed for NMR applications
the input spectrum are best identified by inspection of the entire               as they amplify curvature and certain high-frequency features of a
spectrum rather than based on individual peaks. They are                        signal46. In this way, shoulder peaks can be transformed into local
manifested as minor peaks associated with main peaks in a                       maxima facilitating their identification. In practice, Laplacian
systematic uniform (0th order) or frequency-dependent (1st order)               filters are often combined with data smoothing to mitigate the
manner and they are best removed by reprocessing the original                   effect of noise amplification, which typically results in lower
spectrum. On the other hand, if only selected peaks possess such                resolution47. Laplacian filters might also introduce other artifacts
features, they correspond most likely to true overlapped peaks and              that are indistinguishable from true peaks. For their successful
should be kept in the final peak list. A residual smooth baseline                application to real-world spectra, the Laplacian and smoothing
artifact, a small phase error (
ARTICLE                                                                    NATURE COMMUNICATIONS | https://doi.org/10.1038/s41467-021-25496-5

Fig. 7 Illustration of performance of DEEP Picker for 2D 13C–1H HSQC of mouse urine. Selected spectral regions are depicted in Panels A–D, which
include the highly crowded carbohydrate region. DEEP Picker is able to identify and distinguish between cross-peaks that strongly overlap, which poses a
significant challenge for their analysis by traditional peak pickers. Picked cross-peaks are indicated as circles and color-coded according to their amplitude
on a logarithmic scale with logarithmic contour line spacings.

represent a host of different filters responsible for edge detection,            scenarios of strongly overlapped peaks are usually significantly
corner detection, Laplacian-type sharpening, and denoising.                     undersampled. In the case of 2D spectra, even when using syn-
Additional layers are trained to detect higher-level abstract fea-              thetic datasets, coverage of the many possible overlap scenarios
tures. All this information is then used to decide which data point             was still a challenge. To address this problem, we developed a
is a peak in order to reproduce the ground truth of the training                hybrid approach by applying the deep neural network peak picker
set without any human intervention.                                             to all 1D cross-sections of the 2D spectrum along both frequency
   Both the quantity and the quality of the training data are vital             dimensions ω1 and ω2 followed by the use of a traditional deci-
for the success of the development of a neural network. Unlike                  sion table to identify the 2D cross-peaks based on the 1D cross-
a previous ANN-based peak picker29 that was trained using real                  section results. This approach turned out to be remarkably
experimental datasets annotated by human experts, we exclu-                     accurate and robust for very different NMR samples, including
sively rely on synthetic datasets for two reasons. First, the syn-              folded proteins, intrinsically disordered proteins, and a highly
thetic data can be efficiently generated at almost arbitrary                     complex urine metabolomics sample.
amounts and diversity so that the optimal complexity of the                        For the development of a useful and versatile peak picker, a
neural network was not limited by the amount of available                       crucial task is to draw the decision boundary between single peaks
training data. Second, we could easily curate the training data to              and two (or more) overlapped peaks as illustrated in Fig. 1C–F.
ensure satisfactory class balance. For a suitable 1D peak training              Not surprisingly, such a decision boundary could be defined
set, we need a similar number of peaks in each of the following                 without ambiguity only when the spectrum is noise-free and all
categories independent of the actual frequency of these features in             peaks followed the Voigt profile without any artifacts (phasing or
experiments: standalone peaks, peaks with a shoulder peak on the                baseline errors). For real-world spectra, it is up to the spectro-
left-hand side of the main peak, peaks with a shoulder peak on                  scopist to define the decision boundary, by taking the quality of
the right-hand side of the main peak, peaks with two shoulder                   the input spectrum, the allowed line shapes of all peaks, etc., into
peaks on both sides, etc. In practice, a substantial number of                  consideration. During the peak deconvolution process, nonlinear
synthetic spectra were generated, followed by the trimming of                   peak fitting provides a quantitative metric for how well the input
overrepresented classes to satisfy the class balance. Such class                spectral region can be explained by a single peak, for example,
balance is much easier to achieve in synthetic datasets compared                using either the root-mean-square fitting errors or the maximal
to experimental sets. In the latter case, the many possible                     absolute error as a metric. We employed nonlinear peak fitting to

10                 NATURE COMMUNICATIONS | (2021)12:5229 | https://doi.org/10.1038/s41467-021-25496-5 | www.nature.com/naturecommunications
NATURE COMMUNICATIONS | https://doi.org/10.1038/s41467-021-25496-5                                                                     ARTICLE

Fig. 8 Application of DEEP Picker to 2D NOESY and TOCSY spectra. A, B Selected regions of 2D 1H–1H NOESY of Im7 and C, D 2D 1H–1H TOCSY of
mouse urine with picked cross-peaks indicated as circles that are color-coded according to their amplitude (logarithmic scale, see sidebar). DEEP Picker
identifies strong and weak cross-peaks, including ones that severely overlap or show multiplet structures due to J-splittings, whose analysis is often
challenging for traditional peak pickers.

provide the ground truth for spectral labeling using a mathe-                   that are overall similar to the datasets it has been trained for. A
matically defined decision boundary. We can achieve consistency                  requirement is that all peaks in the input spectra must have in
across all training samples, which is another distinction from                  good approximation a Voigt profile, which can be achieved in
previous methods that mostly relied on labeling by human                        practice quite easily, for example, by using the Kaiser window
experts. The threshold of 3% (see the “Results” section) was                    apodization function during Fourier transform processing.
selected in this work to best reproduce the consensus among a                   Finally, the spectral resolution must be sufficiently high so that
group of NMR experts in our lab. One can obtain a more sensitive                each peak is represented by 6–20 (or 4–12) points, which is
neural network by generating training samples with a smaller                    readily achievable by the application of a proper amount of zero-
threshold. Such a new peak picker might perform better for                      filling during processing.
spectra with very high signal-to-noise ratios and uniform peak                     DEEP Picker is a fast, versatile, and highly accurate peak picker
lineshapes. On the other hand, a less sensitive neural network                  as demonstrated here for HSQC spectra, which are among the most
might be more suitable for low signal-to-noise spectra or spectra               widely used 2D NMR spectra of proteins and metabolomics
with variable peak lineshapes.                                                  applications providing powerful spectral fingerprints of complex
   It is worth emphasizing that DEEP Picker predicts every peak                 molecular systems. The machine-learning-based DEEP spectral
locally without taking into account the behavior of spectral data               analyzer was developed solely based on synthetic data that closely
points that are further away. To further improve the consistency                mirror peak shapes and linewidths encountered in NMR experi-
of all the predicted peaks, especially for the overlapped peak                  ments but without any analytical mathematical guidance. DEEP
clusters, one can run a non-linear least-squares fit of all peaks                Picker is able to reproducibly deconvolute spectral regions with
simultaneously, using the results returned by DEEP Picker as a                  severe peak overlaps providing more complete access to the valuable
starting point. Because non-linear least-square peak fitting cannot              information contained in these types of NMR spectra. For this
guarantee that the identified χ2 minimum is the global minimum,                  reason, DEEP Picker is now the default peak picking and peak
the quality of the starting point is vital for the best results. Based          fitting engine of our COLMAR suite of metabolomics webservers49.
on our experience with DEEP Picker, we found that it provides                   DEEP Picker is expected to play a useful role toward increasing
under many different circumstances an excellent starting point                  automation and standardization of NMR data processing protocols
for the fully quantitative fitting of the peak parameters. Like any              to make the results both unequivocally and easily transferable
other neural network, DEEP Picker works best for applications                   between different spectrometers, projects, and research labs.

NATURE COMMUNICATIONS | (2021)12:5229 | https://doi.org/10.1038/s41467-021-25496-5 | www.nature.com/naturecommunications                             11
ARTICLE                                                                              NATURE COMMUNICATIONS | https://doi.org/10.1038/s41467-021-25496-5

                                                                                          23. Qu, X. et al. Accelerated nuclear magnetic resonance spectroscopy with deep
Reporting summary. Further information on research design is available in the Nature          learning. Angew. Chem. Int. Ed. Engl. 59, 10297–10300 (2020).
Research Reporting Summary linked to this article.                                        24. Lee, H. H. & Kim, H. Intact metabolite spectrum mining by deep learning in
                                                                                              proton magnetic resonance spectroscopy of the brain. Magn. Reson. Med. 82,
Data availability                                                                             33–48 (2019).
Spectra of α-synuclein, Im7, and urine along with peak annotation generated by DEEP       25. Shen, Y. & Bax, A. SPARTA+: a modest improvement in empirical NMR
Picker is available in the Zenodo database (https://zenodo.org/record/5155575#.YQlF6o5        chemical shift prediction by means of an artificial neural network. J. Biomol.
KgbU)50.                                                                                      NMR 48, 13–22 (2010).
                                                                                          26. Han, B., Liu, Y., Ginzinger, S. W. & Wishart, D. S. SHIFTX2: significantly
                                                                                              improved protein chemical shift prediction. J. Biomol. NMR 50, 43–57 (2011).
Code availability                                                                         27. Li, D. & Bruschweiler, R. PPM_One: a static protein structure based chemical
The training script based on TensorFlow v1.3 and The C/C++ implementation of DEEP             shift predictor. J. Biomol. NMR 62, 403–409 (2015).
Picker is freely available from our website http://spin.ccic.osu.edu/index.php/download   28. Liu, S. et al. Multiresolution 3D-DenseNet for chemical shift prediction in
and GitHub (https://github.com/lidawei1975/deep)51 under the GNU General Public               NMR crystallography. J. Phys. Chem. Lett. 10, 4558–4565 (2019).
License Agreement.                                                                        29. Klukowski, P. et al. NMRNet: a deep learning approach to automated peak
                                                                                              picking of protein NMR spectra. Bioinformatics 34, 2590–2597 (2018).
                                                                                          30. Zhang, Y. D. et al. Image based fruit category classification by 13-layer deep
Received: 13 February 2021; Accepted: 9 August 2021;                                          convolutional neural network and data augmentation. Multimed. Tools Appl.
                                                                                              78, 3613–3632 (2019).
                                                                                          31. Wei, Q. & Dunbrack, R. L. Jr. The role of balanced training and testing data
                                                                                              sets for binary classifiers in bioinformatics. PLoS ONE 8, e67863 (2013).
                                                                                          32. Larrazabal, A. J., Nieto, N., Peterson, V., Milone, D. H. & Ferrante, E. Gender
                                                                                              imbalance in medical imaging datasets produces biased classifiers for
References                                                                                    computer-aided diagnosis. Proc. Natl Acad. Sci. USA 117, 12592–12594
1.    Kovermann, M., Rogne, P. & Wolf-Watz, M. Protein dynamics and function                  (2020).
      from solution-state NMR spectroscopy. Q. Rev. Biophys. 49, e6 (2016).               33. Olivier, J., Kilani, S. & Poirier, R. Determination in low-energy electron loss
2.    Markley, J. L. et al. The future of NMR-based metabolomics. Curr. Opin.                 spectroscopy of the Gaussian and Lorentzian content of experimental line-
      Biotechnol. 43, 34–40 (2017).                                                           shapes. Appl. Surf. Sci. 8, 353–358 (1981).
3.    Pfandler, P., Bodenhausen, G., Meier, B. U. & Ernst, R. R. Toward automated         34. Redmon, J., Divvala, S., Girshick, R. & Farhadi, A. You only look once: unified,
      assignment of nuclear magnetic-resonance spectra—pattern-recognition in                 real-time object detection. In Proc. CVPR IEEE 779–788 (2016).
      two-dimensional correlation spectra. Anal. Chem. 57, 2510–2516 (1985).              35. LeCun, Y. et al. Backpropagation applied to handwritten zip code recognition.
4.    Meier, B. U., Madi, Z. L. & Ernst, R. R. Computer analysis of nuclear spin              Neural Comput. 1, 541–551 (1989).
      systems based on local symmetry in 2D spectra. J. Magn. Reson. 74, 565–573          36. Abadi, M. et al. TensorFlow: a system for large-scale machine learning. In
      (1987).                                                                                 Proc. OSDI'16: 12th Usenix Symposium on Operating Systems Design and
5.    Bartels, C., Xia, T. H., Billeter, M., Guntert, P. & Wuthrich, K. The program           Implementation, 265–283 (2016).
      XEASY for computer-supported NMR spectral analysis of biological                    37. Goodfellow, I., Bengio, Y. & Courville, A. Deep Learning (The MIT Press,
      macromolecules. J. Biomol. NMR 6, 1–10 (1995).                                          2016).
6.    Koradi, R., Billeter, M., Engeli, M., Guntert, P. & Wuthrich, K. Automated          38. Hosang, J., Benenson, R. & Schiele, B. Learning non-maximum suppression.
      peak picking and peak integration in macromolecular NMR spectra using                   In Proc. 30th IEEE Conference on Computer Vision and Pattern Recognition
      AUTOPSY. J. Magn. Reson. 135, 288–297 (1998).                                           (CVPR 2017), 6469–6477 (2017).
7.    Johnson, B. A. Using NMRView to visualize and analyze the NMR spectra of            39. Delaglio, F. et al. NMRPipe: a multidimensional spectral processing system
      macromolecules. Methods Mol. Biol. 278, 313–352 (2004).                                 based on UNIX pipes. J. Biomol. NMR 6, 277–293 (1995).
8.    Garrett, D. S., Powers, R., Gronenborn, A. M. & Clore, G. M. A common sense         40. Yuan, C. et al. Solution structure of the human oncogenic protein gankyrin
      approach to peak picking in two-, three-, and four-dimensional spectra using            containing seven ankyrin repeats and analysis of its structure–function
      automatic computer analysis of contour diagrams. J. Magn. Reson. 95,                    relationship. Biochemistry 43, 12152–12161 (2004).
      214–220 (1991).                                                                     41. Yuan, C., Byeon, I. J., Li, Y. & Tsai, M. D. Structural analysis of phospholipase
9.    Liu, Z., Abbas, A., Jing, B. Y. & Gao, X. WaVPeak: picking NMR peaks                    A2 from functional perspective. 1. Functionally relevant solution structure and
      through wavelet-based smoothing and volume-based filtering. Bioinformatics               roles of the hydrogen-bonding network. Biochemistry 38, 2909–2918 (1999).
      28, 914–920 (2012).                                                                 42. Tu, S. et al. The ARID domain of the H3K4 demethylase RBP2 binds to a
10.   Skinner, S. P. et al. CcpNmr AnalysisAssign: a flexible platform for integrated          DNA CCGCCC motif. Nat. Struct. Mol. Biol. 15, 419–421 (2008).
      NMR analysis. J. Biomol. NMR 66, 111–124 (2016).                                    43. Bowles, D. P. et al. Resonance assignments of wild-type and two cysteine-free
11.   Wurz, J. M. & Guntert, P. Peak picking multidimensional NMR spectra with                variants of the four-helix bundle protein, Rop. Biomol. NMR Assign. 12,
      the contour geometry based algorithm CYPICK. J. Biomol. NMR 67, 63–76                   345–350 (2018).
      (2017).                                                                             44. Timari, I. et al. Real-time pure shift HSQC NMR for untargeted
12.   Korzhneva, D. M., Ibraghimov, I. V., Billeter, M. & Orekhov, V. Y. MUNIN:               metabolomics. Anal. Chem. 91, 2304–2311 (2019).
      application of three-way decomposition to the analysis of heteronuclear NMR         45. Bovik, A. C. Handbook of Image and Video Processing. 2nd edn (Elsevier
      relaxation data. J. Biomol. NMR 21, 263–268 (2001).                                     Academic Press, 2005).
13.   Orekhov, V. Y., Ibraghimov, I. V. & Billeter, M. MUNIN: a new approach to           46. MestreNova V. 14.0 (2020).
      multi-dimensional NMR spectra interpretation. J. Biomol. NMR 20, 49–60 (2001).      47. Cobas, C., Aboutanios, E. & Sykora, S. Fast two-dimensional nuclear magnetic
14.   Tikole, S., Jaravine, V., Rogov, V., Dotsch, V. & Guntert, P. Peak picking NMR          resonance resolution enhancement by use of a Laplacian estimator. Spectrosc.
      spectral data using non-negative matrix factorization. BMC Bioinforma. 15, 46           Lett. 53, 529–535 (2020).
      (2014).                                                                             48. Dhillon, A. & Verma, G. K. Convolutional neural network: a review of models,
15.   Alipanahi, B., Gao, X., Karakoc, E., Donaldson, L. & Li, M. PICKY: a novel SVD-         methodologies and applications to object detection. Prog. Artif. Intell. 9,
      based NMR spectra peak picking method. Bioinformatics 25, i268–i275 (2009).             85–112 (2020).
16.   Antz, C., Neidig, K. P. & Kalbitzer, H. R. A general Bayesian method for an         49. Bingol, K., Li, D. W., Zhang, B. & Bruschweiler, R. Comprehensive metabolite
      automated signal class recognition in 2D NMR spectra combined with a                    identification strategy using multiple two-dimensional NMR spectra of a
      multivariate discriminant analysis. J. Biomol. NMR 5, 287–296 (1995).                   complex mixture implemented in the COLMARm Web Server. Anal. Chem.
17.   Rouh, A., Louis-Joseph, A. & Lallemand, J. Y. Bayesian signal extraction from           88, 12411–12418 (2016).
      noisy FT NMR spectra. J. Biomol. NMR 4, 505–518 (1994).                             50. Li, D.-W., Hansen, A. L., Yuan, C., Bruschweiler-Li, L. & Brüschweiler, R. 2D
18.   Cheng, Y., Gao, X. & Liang, F. Bayesian peak picking for NMR spectra.                   NMR HSQC Spectra of Proteins and Mouse Urine with Peaks Picked by DEEP
      Genom. Proteom. Bioinf. 12, 39–47 (2014).                                               Picker https://doi.org/10.5281/zenodo.5155575 (2021).
19.   LeCun, Y., Bengio, Y. & Hinton, G. Deep learning. Nature 521, 436–444 (2015).       51. Li, D.-W., Hansen, A. L., Yuan, C., Bruschweiler-Li, L. & Brüschweiler, R. DEEP
20.   Baraniuk, R., Donoho, D. & Gavish, M. The science of deep learning. Proc.               Picker is a Deep Neural Network for Accurate Deconvolution of Complex Two-
      Natl Acad. Sci. USA 117, 30029–30032 (2020).                                            dimensional NMR Spectra https://doi.org/10.5281/zenodo.5142740 (2021).
21.   Chen, D., Wang, Z., Guo, D., Orekhov, V. & Qu, X. Review and prospect: deep
      learning in nuclear magnetic resonance spectroscopy. Chemistry 26,
      10391–10401 (2020).                                                                 Acknowledgements
22.   Hansen, D. F. Using deep neural networks to reconstruct non-uniformly               We thank Xinyao Xiang for the NOESY spectrum of Im7. This work was supported by
      sampled NMR spectra. J. Biomol. NMR 73, 577–585 (2019).                             the U.S. National Science Foundation (grant nos. MCB-1715505, MCB-2103637) and the

12                    NATURE COMMUNICATIONS | (2021)12:5229 | https://doi.org/10.1038/s41467-021-25496-5 | www.nature.com/naturecommunications
NATURE COMMUNICATIONS | https://doi.org/10.1038/s41467-021-25496-5 ARTICLE
National Institutes of Health (grant nos. R01GM066041, R35GM139482). All NMR Reprints and permission information is available at http://www.nature.com/reprints
experiments were performed at the CCIC NMR facility at The Ohio State University.
Publisher’s note Springer Nature remains neutral with regard to jurisdictional claims in
published maps and institutional affiliations.
Author contributions
D.-W.L. and R.B. conceived and designed the project. D.-W.L. developed the machine
learning framework. A.L.H., C.Y. and L.B.-L. performed NMR experiments. L.B.-L.
prepared samples of K-Ras and urine. All authors contributed to model development and Open Access This article is licensed under a Creative Commons
data analysis. D.-W.L. and R.B. prepared the manuscript. Attribution 4.0 International License, which permits use, sharing,
adaptation, distribution and reproduction in any medium or format, as long as you give
appropriate credit to the original author(s) and the source, provide a link to the Creative
Competing interests Commons license, and indicate if changes were made. The images or other third party
The authors declare no competing interests.
material in this article are included in the article’s Creative Commons license, unless
indicated otherwise in a credit line to the material. If material is not included in the
Additional information article’s Creative Commons license and your intended use is not permitted by statutory
Supplementary information The online version contains supplementary material regulation or exceeds the permitted use, you will need to obtain permission directly from
available at https://doi.org/10.1038/s41467-021-25496-5. the copyright holder. To view a copy of this license, visit http://creativecommons.org/
licenses/by/4.0/.
Correspondence and requests for materials should be addressed to D.-W.L. or R.B.
Peer review information Nature Communications thanks Gogulan Karunanithy and the © The Author(s) 2021
other, anonymous, reviewer(s) for their contribution to the peer review of this work.
NATURE COMMUNICATIONS | (2021)12:5229 | https://doi.org/10.1038/s41467-021-25496-5 | www.nature.com/naturecommunications 13You can also read