Sierra Nevada Biosphere Reserve Assessment Report - Unesco
←
→
Page content transcription
If your browser does not render page correctly, please read the page content below

GLOBALCHANGEI
            N MOUNTAI
                    N SI
                       TES

              Si
               err
                 aNe
                   vadaBi
                        osphe
                            reRe
                               ser
                                 ve
              As
               ses
                 sme
                   ntRe
                      por
                        t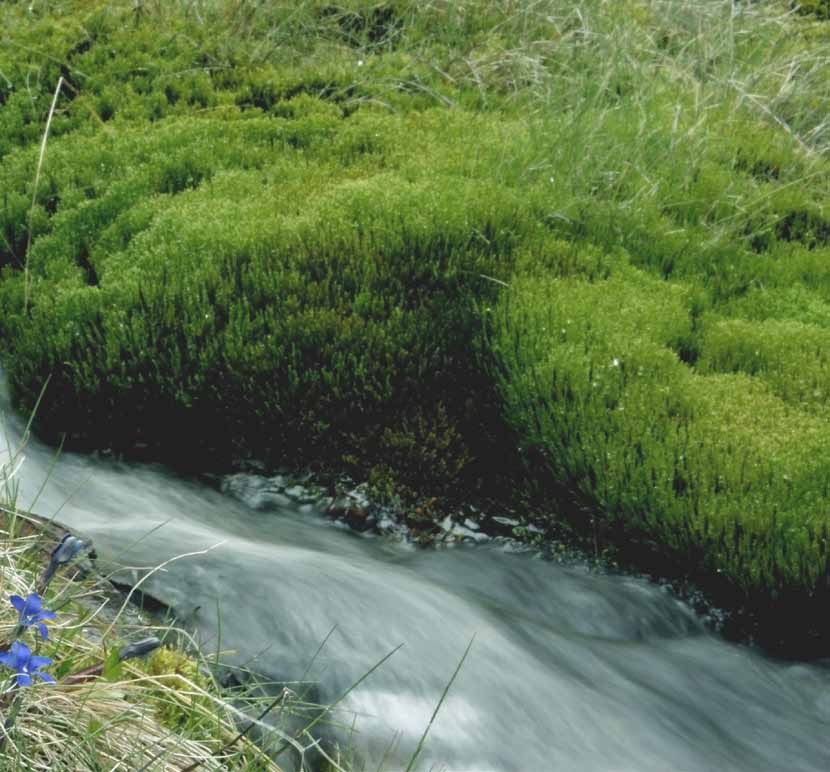
SIERRA NEVADA GLOBAL CHANGE OBSERVATORY
STRUCTURE AND BASIC DATA
AUTHORS
Francisco Javier Bonet García. (fjbonet@ugr.es). University of Granada
Antonio Jesús Pérez Luque. (ajperez@ugr.es). University of Granada
Ricardo A. Moreno Llorca. (ricuni@ugr.es). University of Granada
Regino Zamora Rodríguez. (rzamora@ugr.es). University of Granada
TEAM MEMBERS OF THE SIERRA NEVADA GLOBAL CHANGE OBSERVATORY
Managers of Sierra Nevada’s National Park and Nature Reserve involved in the project
Javier Sánchez Gutiérrez: Director of Sierra Nevada Natural Area. Environment Department. Andalusian Regional Government.
Ignacio Henares Civantos. Conservationist of Sierra Nevada Natural Area. Environment Department. Andalusian Regional Government.
Javier Cano-Manuel León. Director of Monitoring Program. Environment Department. Andalusian Regional Government.
Rangers working in Sierra Nevada protected area.
Monitoring Program (implemented by EGMASA, a state-owned company belonging to the Department of Environment of the Government of Andalusia)
Ignacio Maldonado Lozano. Manager of Monitoring Program. Egmasa.
Rut Aspizua Cantón. Technical Coordinator of Monitoring Program. Egmasa.
Snow monitoring: Javier Herrero Lantarón (CEAMA-University of Granada); Jose Antonio Algarra Ávila
(EGMASA).
Fauna monitoring: José Miguel Barea Azcón (Person responsible for flora monitoring, EGMASA); Juan M. Pleguezuelos (University of Granada); Maribel
Benítez Lechuga (University of Granada); Juan Ramón Fernández Cardenete (University of Granada); Jesús Caro Hidalgo (University of Granada). Jose
Enrique Granados Torres (EGMASA)
Flora monitoring: Jose Antonio Algarra Ávila (Person responsible, EGMASA); José Miguel Muñoz Díaz
(EGMASA); Cristina Patricia Sánchez Rojas (EGMASA); María López Onieva (EGMASA); Adrián Escudero
Alcántara (Rey Juan Carlos University); María Begona García González (Pyrenean Institute of Ecology,
CSIC).
Aquatic Systems monitoring: Javier Galindo Parrilla (Person in charge of aquatic systems monitoring, EGMASA); María del Carmen Fajardo Merlo
(EGMASA); José Enrique Larios López (EGMASA); Julio Luzón Ortega (Hydraena S.L.L.); Pablo Jaimez Cuéllar (Hydraena S.L.L.); José Antonio Palomino
Morales (Hydraena S.L.L.); José Manuel Tierno de Figueroa (University of Granada).
Land use changes monitoring: Irene Navarro González (EGMASA).
Forest monitoring: Jorge Castro Gutiérrez (University of Granada). Francisco M. Cabeza Arcas (University of Granada). Cristina Bollullos Sánchez
(EGMASA). José Antonio Hódar Correa (University of Granada)
Atmosphere and Carbon fluxes monitoring: José Miguel Muñoz Díaz (EGMASA); Andrew S. Kowalsky
(University of Granada); Penélope Serrano Ortiz (University of Granada).
Mª Jesús del Saz Salas. Person in charge of information management (EGMASA).
Staff involved in scientific coordination and information management (implemented by CEAMA-University of Granada).
Regino Zamora Rodríguez. Observatory scientific coordinator.
Francisco Javier Bonet García. Information system development.
Antonio Jesús Pérez Luque. Web 2.0 tools and metadata system development.
Ramón Pérez Pérez. Computer implementation system development.
Blas Benito de Pando. Species distribution system model.
Pablo González Moreno. Ecological indicators system development.
Ricardo A. Moreno Llorca. Socioeconomic indicators system development.
Pablo S. Reyes Muñoz. Climate information system management.
PHOTOS
Photos have been taken by Ernesto Sofos Navero, except on p. 9 taken by R. Moreno, pp. 21 and 23, taken by F. J. Bonet, and pp. 27 and 29,
taken by A. J. Pérez-Luque.
TRANSLATION
Josefa Rodríguez Infante (University of Granada)
Global Propaganda, S.L.
www.globalpropaganda.com
DESIGN AND LAYOUT
Creados Visual, S.L.
www.creados.com
To quote this document:
Bonet, F.J.; Pérez-Luque, A.J.; Moreno, R. & Zamora, R. (2010). Sierra Nevada Global Change Observatory. Structure and Basic Data.
Environment Department (Andalusian Regional Government) – University of Granada. 48 pages.

Legal Deposit: GR 4643-2010

This work is licensed under a Creative Commons.

The information contained in this report has been prepared by many professionals.
These works are cited appropriately in the references section.
Contents
1. INTRODUCTION

  06   Introduction and Objectives
  08   Site location and relationship with other networks
  12   Ecological context
  14   Socioeconomic context

2. ECOSYSTEMS

  16 Key to understanding cards description of each ecosystem type
  18 High mountain wet grasslands
  20 High mountain grasslands
  22 Natural forest
  24 High mountain shrubland
  26 Mid mountain shrubland
  28 Pine plantations
  30 Aquatic systems

3. DATA PROCESSING AND DISSEMINATION OF RESULTS

  34   Information System
  36   Outreach and Dissemination of results

4. METHODOLOGIES AND BIBLIOGRAPHIC REFERENCES

  40   Methodologies and Bibliographic References
Introduction
Introduction and Objectives
Site location and relationship
with other networks
Ecological context
Socioeconomic context
Introduction and Objectives
                                                                                                              The ultimate objective of the Sierra
                                                                                                              Nevada Global Change Observatory
                                                                                                                          is to gather the necessary
                                                                                                              information to identify the impacts
                                                                                                             of global change, in order to design
                                                                                                                 mechanisms that minimize those
                                                                                                             impacts and help adapt ecosystems
                                                                                                                to the new scenarios. This overall
                                                                                                                       aim requires the design and
                                                                                                                  implementation of a monitoring
                                                                                                                 program on the effects of global
                                                                                                                           change in Sierra Nevada.

                                                                                      OUTREACH

                                                                                      One of the main aspects regarding the success of a project like
                                                                                      this has to do with the way in which both targets and results
                                                                                      are reported. Therefore we consider very important all tasks
                                                                                      related to disseminating and reporting results. We would like to
                                                                                      emphasize the processes followed to make them available to the
                                                                                      general public. The main tools we use are the project's wiki and
    MONITORING PROGRAM                                                                publications in the mainstream press.

    The design of mechanisms of adaptation to tackle global change                    We have also made several documentaries about the Observatory’s
    requires the existence of relevant information on the structure and               work, which will be broadcast on Andalusian regional television.
    dynamics of both the elements and processes involved in our                       Furthermore, we have initiated a process of periodic training,
    study area's ecosystems. The first task, therefore, would be the                  through regular work group meetings, workshops, seminars, pilot
    design of a solid monitoring program.                                             tests, etc, in order to:

    We have been working on 20 monitoring methodologies, to assess                    1) Update the scientist-technical knowledge of people involved in
    both the status of the main ecological functions and structure                    the monitoring program.
    of the main ecosystems in Sierra Nevada. These methodologies
    have been validated by scientific experts and have already been                   2) Exchange knowledge and share experiences and problems on
    implemented in Sierra Nevada.                                                     project development between scientists, managers and technicians
                                                                                      involved in the project.

06 Sierra Nevada Observatory for Monitoring Global Change. Structure and basic data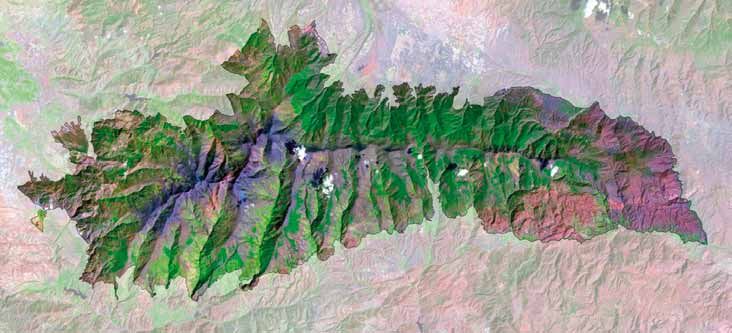
1. INTRODUCTION

The information generated by this set
of monitoring methodologies must be
transformed into useful knowledge for                                                                           outreach
the managers to carry out an active
                                                              adaptive management
and adaptive management of natural
resources. To do this, it is essential that
all data is integrated and analyzed in
an information system for the project.
Finally, the general public must be                                                                        monitoring program
informed of both the results obtained                       information management
and methodologies used, through
effective feedback.

   INFORMATION MANAGEMENT                                                  ADAPTIVE MANAGEMENT

   Developing an information system is in conjunction with                 Adaptive management seeks to learn from the results of
   collecting information on the status and structure of the natural       management actions on natural resources, improving management
   systems of Sierra Nevada. The ultimate goal of this tool is to offer    by adapting to change. Actions and objectives are further adjusted
   useful information -knowledge- to managers, to improve the way          based on new knowledge gained. Moreover decisions and
   natural resources are managed in Sierra Nevada. This knowledge          management results should be carefully documented to enable
   is obtained after processing and analyzing raw data obtained by         the dissemination of knowledge obtained through experience.
   the above-mentioned monitoring program.
                                                                           The Sierra Nevada Global Change Observatory has incorporated
   The raw data is stored in a relational database compatible with         adaptive management approaches to their theoretical and
   REDIAM (Environmental Information Network of Andalusia). The            practical management activities. The many examples of adaptive
   algorithms that analyze and process the data are documented and         management include the Sierra Nevada experimental treatments
   implemented in an automated way through the use of applications         to assess the suitability of different plant regeneration procedures
   for scientific workflow management. In addition to this data, it        after the Lanjarón fire in 2005. The conservation projects and
   generates large amounts of information difficult to standardize in      improvement of stands of oak, juniper, and maple to increase
   a database: text documents, slides, books, videos, pictures, etc.       the resilience of these ecosystems and promote regeneration in
   To store this information we are using Web 2.0 technology tools.        changing conditions are also very interesting.
   The project has a wiki (http://observatoriosierranevadaiecolab.
   es), where both the methodologies used and results obtained are
   shown. There is also a bibliography manager with over a thousand
   references of interest (http://refbase.iecolab.es).

                                                                                                       Sierra Nevada Global Change Observatory 07
Location of Sierra Nevada LTER-site

                                                                                      25 km

Sierra Nevada is a high mountain range
(reaching 3,482 m.a.s.l.) located in Southern
Spain (37ºN, 3º W) covering 2,000 km2.
It has several legal protections:

    Natural Biosphere Reserve (MaB. Unesco)
    Special Protection Area and Site of
    Community Importance (Natura 2000
    network)
    National Park and Nature Reserve

08 Sierra Nevada Observatory for Monitoring Global Change. Structure and basic data
1. INTRODUCTION

    RELATIONSHIP OF SIERRA NEVADA GLOBAL CHANGE OBSERVATORY WITH OTHER MONITORING NETWORKS

REGIONAL LEVEL                                         NATIONAL LEVEL                                         INTERNATIONAL LEVEL

  icts- doñana                                          autonomous organisation                                 glochamore
                                                        of national parks
http://icts.ebd.csic.es                                                                                       http://www.edinburgh.ceh.ac.uk/biota/
                                                       http://www.mma.es/portal/secciones/                    glochamore_page.htm
  network of observatories                             el_ministerio/organismos/oapn/
  for monitoring global                                                                                        glochamost
  change in andalusia                                   biodiversity foundation
                                                                                                              http://www.sl.ugr.es/glochamost
                                                       http://www.fundacion-biodiversidad.es
  glocharid                                                                                                    ilter
                                                        lter-spain
http://www.caescg.org/glocharid                                                                               http://www.lternet.edu
                                                       http://www.lter-spain.net

Sierra Nevada is also a key member of the LTER-Spain network. The Long Term Ecological Research (LTER) network is a global network of research
sites located in a wide array of ecosystems worldwide that can help understand environmental change across the globe. LTER’s focus is on long-term,
site-based research, involving scientists, managers and institutions, helping to investigate ecological processes over long temporal and broad spatial
scales.

Sierra Nevada has been a member of this network since 2008. Other locations such as the Doñana, Aigües Tortes and Ordesa National Parks are also
members of LTER-Spain and the International LTER Network.

                                                                                                             Sierra Nevada Global Change Observatory 09
Ecological context

                                                                                                                          20 km

                                                                                                                                                   01

                                                                                High mountain wet grasslands

                                                                                               Aquatic systems

                                                                                                   Urban areas

                                                                                              Agricultural areas

Types of Ecosystems                                                                              Natural forest

                                                                                      High mountain grasslands
Map showing the spatial distribution of ecosystems that have
been identified in Sierra Nevada. Vegetation is predominantly high                     Mid mountain shrubland
mountain shrublands and pine plantations. We also have natural                                 Pine plantations
forests (oaks, Pyrenean oaks, maples, etc.) that are regenerating
after decades of overexploitation.                                                    High mountain shrubland

                                                                                                                   0   10000 20000 30000 40000 50000
                                                                                                                              Area (ha)

     SPECIES RICHNESS OF VASCULAR PLANTS
                                                                                                                                                   03
The figure shows the species/mountain range area ratio on a logarithmic scale. The total number of species for each mountain range is shown
in parentheses.

                                    Scandes         Alps
                                     (1880)        (4530)
                                          Caucasus      Apennines   Pyrenees                              Sierra Nevada
                                            (6530)        (3091)     (3500)                                   (2100)

                                             Carpathians
                                               (3988)

                                        1                                10                                   100                           1000
Species/mountain area (Log scale)

10 Sierra Nevada Observatory for Monitoring Global Change. Structure and basic data
1. INTRODUCTION
PLANT DIVERSITY IN EUROPEAN MOUNTAINS
02
Figure showing mountain ranges of Europe and the altitude, size and plant diversity of each mountain. The width of each mountain in the
figure is proportional to its real size (in Km2). The size of each pie chart is proportional to the plant species number and the green sector
indicates the proportion of endemic species per mountain range.
Due to its strategic location as a refuge for many plant species during the glaciations, Sierra Nevada is one of the most important hotspots
of plant diversity in the Western Mediterranean Region. It has 80 endemic species in a total of 2,100 species of vascular plants.
6000 Caucasus
5000 Alps
Sierra
4000 Nevada
Pyrenees
3000 Apennines
Carpathians Scandes
2000
1000
0
Altitude (m.a.s.l.)
PLANT DIVERSITY OF SIERRA NEVADA SPECIES OF COMMUNITY INTEREST (HABITATS DIRECTIVE)
03 04
This mountain hosts 2100 vascular plant species, representing 25% of Sierra Nevada shows a particularly high number of endemic Species
Spanish flora and 20% of European flora. of Community Interest listed in Annexes II and IV of the EU Habitats
Directive.
Plant Species number / area rate
0,5 1 2 Balkan
Alps
SPAIN > SIERRA NEVADA >
8,400 species. 0.5 mill Km2 2,100 species. 2,000 Km2
Sierra Nevada
Pyrenees
Apennines
EUROPE > Carpathians
110,400 species. 11 mill Km2
Scandinavian
0 10 20 30 40
Number of endemic Species of Community Interest
Sierra Nevada Global Change Observatory 11Socioeconomic context
Evolution of several socioeconomic variables
Energy consumption
Emigration
Business Tax (I.A.E)
Ecosystem’s Ruralization Index
Rural Tourism (amount of accommodation)
Total population
[01]
1986 1989 1999
Biosphere Reserve Nature Reserve National Park
06 Declaration Declaration Declaration
1980 1985 1990 1995 2000 2005 2010
This graph shows the evolution of several socioeconomic variables from 1980 to 2008. It highlights the considerable increase of energy consumption
compared to other variables. Ever since the creation of both the Nature Reserve and National Park, the number of companies and professionals removed
from the IAE has been increasing. The accommodation index in rural tourism has increased noticeably, although it has fallen in relation to demand.
Growing migration in the area, while the population remains stable or even increases, suggests the influence of immigration together with the natural
movement of the population (births - deaths). On the other hand, the ruralization of ecosystems has been declining so they are increasingly less disturbed.
This may be because of a progressive abandonment of rural areas in recent decades.
TEMPORAL VARIATION OF SECTORS OF [01] LAND USE IN SIERRA NEVADA
ECONOMIC ACTIVITIES 08
07
Industry 25%
14% 24.0%
Others 27.5% Agriculture Land
Construction 6%
19%
69% 16.5%
Services
67% Forestry Grasslands
32.0%
1999-2005 Average 2008
12 Sierra Nevada Observatory for Monitoring Global Change. Structure and basic data1. INTRODUCTION
UNEMPLOYMENT PERCENTAGE PER SECTOR [01] SALES OF COMPANIES IN SIERRA NEVADA
09 10
28%
16-65 years Sales outside Sierra Nevada Nature Reserve
72%
Companies' sales in Sierra Nevada Nature Reserve
Female
LIVESTOCK IN SIERRA NEVADA
11
Youth
5,726 (30%)
Bovine animals number and percentage
13,515 (70%)
0 5 10 15 20 25 30 35 40 45 50 Goats and Sheep number and percentage
Sierra Nevada Andalusia
CLIMATE CHANGE AND LENGTH OF SKI SEASON
12
The figure shows the number of days skiing compared to duration of snow in the ski resort (obtained through remote sensing.
MODIS images). Although skiing days have increased, the duration of snow cover appears to have declined in the last 10 years. This means that
artificial snow will play a greater role in future
Skiing days / trend First day of snow per year / trend Last day of snow per year / trend
1200 250
1000 200
800 150
600 100
400 50
200 0
0
92 93 94 95 96 97 98 99 00 01 02 03 04 05 06 07 08
93 94 95 96 97 98 99 00 01 02 03 04 05 06 07 08 09
Skiing days (x1000) = visitors numbers Hydrological days
* length of ski season
Sierra Nevada Global Change Observatory 1314 Sierra Nevada Observatory for Monitoring Global Change. Structure and basic data
Ecosystems
High mountain wet grasslands
High mountain grasslands
Natural forest
High mountain shrubland
Mid mountain shrubland
Pine plantations
Aquatic systems

                               Sierra Nevada Global Change Observatory 15
Keys to understanding
ecosystem sheets
Ecosystem distribution map General features of each ecosystem
2. ECOSYSTEMS
Ecosystem's name
SAMPLING INTENSITY
20
Picture of Ecosystem 10
MAIN ECOSYSTEM SERVICES
Provisioning Regulation Cultural
MAIN BIOPHYSICAL VARIABLES
ADAPTIVE MANAGEMENT
NQ 90
NQ 122 NQ
119 15
13 16
14
10 24700 36000
8.7 19 19600
NQ 13
14 20
21
We are showing different biophysical variables considered important for defining the conservation status of each ecosystem. The
information is displayed according to three temporal scenarios: recent past (1950), present and future (2050)
16 Sierra Nevada Global
Observatory
Change
forObservatory.
Monitoring Structure
Global Change.
and basic
Structure
data and basic dataRelevant ecosystem services provided Ecosystem sampling intensity
Provisioning
Aromatic and Pollutants
Livestock Climate
medicinal plants Fish
20 stations
Rocks for traditional Biomass, wood
building and firewood Water Carbon
quality and flux
Fruit collection Mushroom quantity 10
production
Drinking and
Honey Invertebrates
irrigation water Pine
processionary
Energy
Birds
Naturalization
Regulation Cultural of pine plantations
Water regulation Recreational uses
Mammals
Conservation River
Angling
soil
Phenology Ibex
Carbon sink Hunting Plant
communities
Ecosystem sampling intensity. This diagram shows the number of sampling points in each ecosystem type which
correspond to the monitoring program's different methodologies. It shows the effort dedicated to characterising both the
structure and functioning of different ecosystems in Sierra Nevada.
Adaptive management case studies
PAST CURRENT FUTURE
Past value: The value of the variable in the early 20th century.
VALUE VALUE VALUE
Current value: The value of the variable in the late 20th
century.
NQ
Future value: The expected values of the variable in the first x y
half of this century. NQ: Not yet quantified.
Uncertainty is shown
2
Methods used to obtain the value. Red: the value is considered
negative for ecosystem
conservation status.
Sierra Nevada Global Change Observatory 17High mountain wet grasslands
25 km
1,125 ha
Edapho-hygrophilous vegetation, wet grassland, peatlands, water spring, etc.
Its distribution is determined by the accumulation of meltwater. High rate of plant endemicity.
MAIN BIOPHYSICAL VARIABLES
7.8 9.2 NQ
NQ 1350
1322 1298 NQ 14 NQ
13 19
13 14
It is expected that annual rainfall (l/m2) will It is expected that the average annual Occupation area (Ha).
fall in the coming decades from 1322 l/m2 temperature will increase in the coming The abandonment of transhumance activities
year recorded from 1960-1990, to 1298 l/m2 decades from 7.8ºC recorded during 1960- linked to the ecosystem may explain its
for 2011-2040. 1990, to 9.2ºC for 2011-2020. reduction. It is expected to decline due to
overgrazing.
2000 NQ
27 506 130
NQ NQ
27 15
16
Fodder production (kg dry matter/ha · year) Average snow cover duration (days).
The observed reduction is due to Although the trend is negative over the last
overgrazing. decade, we do not have a time series long
enough to quantify the long term trend.
18 Sierra Nevada Observatory for Monitoring Global Change. Structure and basic data2. ECOSYSTEMS
SAMPLING INTENSITY
MAIN ECOSYSTEM SERVICES
Provisioning Regulation Cultural
ADAPTIVE MANAGEMENT
Past Present Futures
This ecosystem supported a livestock load Increased livestock pressure, land use change and climate Management actions are intended to both
in consonance with traditional rural activities change are factors causing a reduction in this type of reduce livestock and improve the water
(transhumance). ecosystem's area, as well as a significant decrease in grass balance of this ecosystem.
production and degradation.
Reduction in surface of ecosystem Ecological degradation of ecosystem Restoration of vegetation
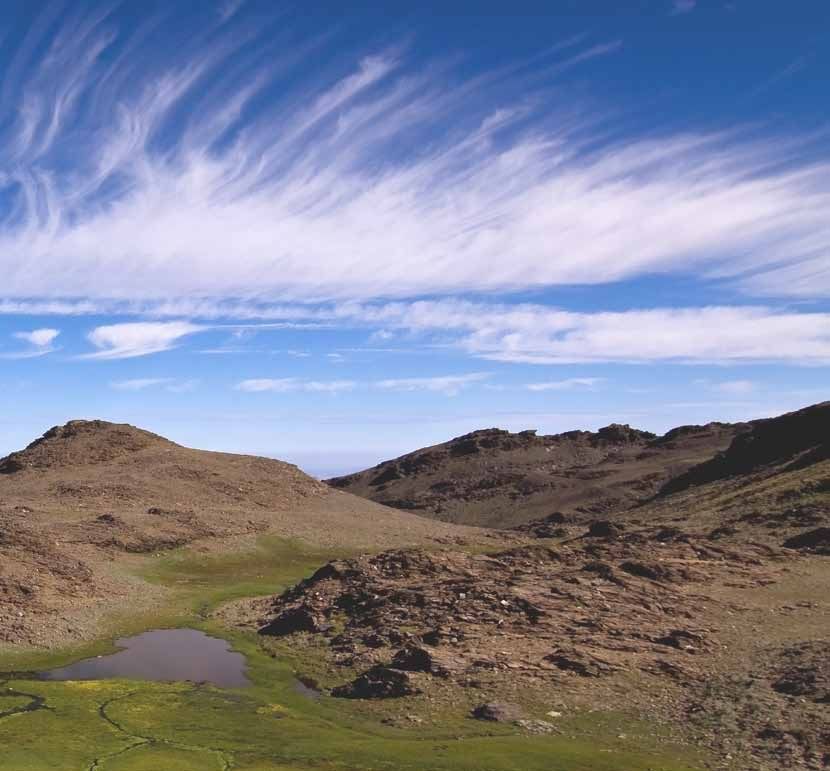
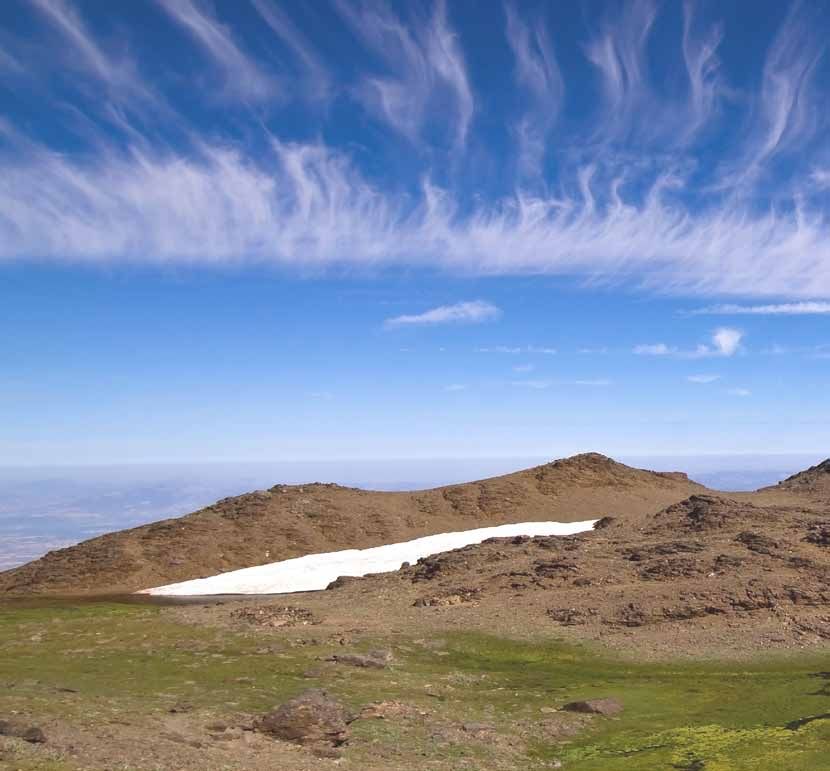
Sierra Nevada Global Change Observatory 19High mountain grasslands
25 km
15,200 Ha
High mountain grasses (Poaceae, Resedacea, etc.)
Snow cover, wind and other abiotic factors are the main drivers of its ecological dynamics.
MAIN BIOPHYSICAL VARIABLES
7.8 9.4 NQ
NQ 124
1312 1282 NQ 14 NQ
13
13 15
14 16
It is expected that annual rainfall (l/m2) It is expected that the average annual Average snow cover duration (days). When
will fall in the coming decades from 1,312 temperature will increase in the coming analyzing last decade, the trend is negative.
l/m2 year recorded from 1960-1990, to decades from 7.8ºC recorded during 1960- The reduction in snow cover duration has not
1,282 l/m2 for 2011-2040. 1990, to 9.4ºC for 2011-2020. been quantified yet.
45 NQ 2857
3 50 18 0
17
17 17 18
Demographic trend of Capra pyrenaica in Occupation area (Ha). Climate change is
Sierra Nevada (ibex number / Km2). expected to cause a reduction in the occupation
Due to scarcity of predators, a management area. Future simulations predict a total loss of
plan has been implemented for the species, the potential area of this formation.
with health controls and population
regulations.
20 Sierra Nevada Observatory for Monitoring Global Change. Structure and basic data2. ECOSYSTEMS
SAMPLING INTENSITY
MAIN ECOSYSTEM SERVICES
Provisioning Regulation Cultural
ADAPTIVE MANAGEMENT
One of the most important management tasks to improve the
conservation status of high mountain grasslands is restoration
at landscape level. These actions try to minimize the impact of
past human activities, such as building of infrastructures, waste
accumulations and plant cover destruction.
The aim is to remove some elements (asphalt, antennas,
buildings,) that reduce the quality and naturalness of the
landscape.
Current situation. Veleta’s summit before the Simulation of appearance after restoration Some restoration activities:
restoration activities. activities.
Topographic restoration of roads
The removal of solid waste in high mountain grasslands
Asphalt removal over more than 3,500 m
Plant cover restoration
To restrict monitored vehicle access to mountain peaks
Sierra Nevada Global Change Observatory 21Natural Forest
25 km
15,000 Ha
Mainly holm oaks (Quercus ilex), Pyrenean oak (Q. pyrenaica) and autochthonous Scot
pine (Pinus sylvestris subsp. nevadensis) forest. Marginal crops in 1956
(Dílar river valley)
Overexploitation and land use changes in the past are the most important drivers 400 m
nowadays.
MAIN BIOPHYSICAL VARIABLES
NQ It is expected that annual rainfall (l/m2) will fall in the coming
935 925 decades from 935 l/m2 a year recorded from 1960-1990, to 925 l/m2
13 14 for 2011-2040.
It is expected that the average annual temperature will increase Regeneration of Q.
11.6 13 pyrenaica forest in 2009
NQ 14 in the coming decades from 11.6ºC recorded during 1960-1990, to
13 13ºC for 2011-2020.
Occupation area (Ha). The observed increase is explained by the
12000 15000 abandonment of rural areas in the last decades. Future simulations
19 13700 predict a 5% and 25% reduction in potential area for holm oak and
20
18 Pyrenean forest respectively.
NQ Average density of tree cover (number of trees per Ha).
524 It is expected to increase due to the regeneration processes after
NQ
22 abandonment of rural areas.
22 Sierra Nevada Observatory for Monitoring Global Change. Structure and basic data2. ECOSYSTEMS
SAMPLING INTENSITY
30
20
10
MAIN ECOSYSTEM SERVICES
Provisioning Regulation Cultural
ADAPTIVE MANAGEMENT
Land use changes in the last decades are still affecting ecological dynamics and the structure of natural forests in Sierra Nevada. In the 1950s,
overgrazing and charcoal extraction resulted in degradation of soil and vegetation cover. After abandonment of these rural activities, oak forests began
a resprouting process up to the current situation (no understory vegetation, bush-like trees, etc.). Pruning forest actions will improve forest structure by
removing side shoots and promoting well-structured tree formation.
1950 Present Futures
Intense human activity. Charcoal extraction. Overgrazing Abandonment of rural activities Restoration of original forest structure
Trees with little foliage due to overgrazing. Trees with lots of side sprouts. Coppice system. No acorn Trees have good structure, after removal side sprouts.
No understory vegetation. Eroded gullies. production. Resprouting is the unique form of reproduction. Acorn production. Recolonisation by understory
Homogeneous age structure. Low structural diversity reduces vegetation. More ecosystem’s resilience
ecosystem’s resilience.
Sierra Nevada Global Change Observatory 23High mountain shrubland
25 km
36,000 Ha
Thorny shrubs, juniper-genista thickets.
Highest woody ecosystem of Sierra Nevada. Its distribution seems to be determined
by snow cover. POQUEIRA RIVER VALLEY
MAIN BIOPHYSICAL VARIABLES
NQ It is expected that annual rainfall (l/m2) will fall in the coming
1221 1195 decades from 1,221 l/m2 a year recorded from 1960-1990, to
13 14 1,195 l/m2 for 2011-2040.
It is expected that the average annual temperature will increase
8.7 10
in the coming decades from 10.4ºC recorded during 1960-1990,
NQ 14
13 to 11.7ºC for 2011-2020.
Present distribution
Average snow cover duration (days). The trend is negative Potential distribu-
NQ 90 if the past decade is analyzed. The reduction in snow cover tion regarding future
NQ duration has not been quantified yet.
climate (expansion
15
16
area)
Potential distribution
Occupation area (Ha). Decrease of wildfires and overgrazing regarding present and
explains how the area increased from 1956 to present day. future climate
24700 36000
19 19600 For juniper-thickets, climate change scenarios predict a 30% Potential distribu-
20 reduction in potential habitat. However, genista-thickets seem tion only with current
21
to suffer a surface expansion. climate (contraction
area)
24 Sierra Nevada Observatory for Monitoring Global Change. Structure and basic data2. ECOSYSTEMS
SAMPLING INTENSITY
20
10
MAIN ECOSYSTEM SERVICES
Provisioning Regulation Cultural
ADAPTIVE MANAGEMENT
Threatened ecosystem due to climate change and land use changes in the last decades. In order to both avoid loss in its distribution area and to
improve its conservation status, we are implementing active and adaptive management actions which are introducing new concepts (uncertainty, future
dynamic vision) in the traditional environmental management of Sierra Nevada. We are also trying to transfer the best scientific available knowledge
from ecological science to forestry management. Some examples are outlined below.
“Improve the water availability using Creation of dispersal foci that enable ecosystem regeneration Selection of suitable
traditional irrigation ditches in areas plantation sites for present
that will not be suitable for juniper in and future climatic scenarios.
Using thorny shrubs as Temporarily remove Plant a varied ecological
the future climate scenarios.
nurse plants when planting herbivores to protect mixed species pool.
junipers (facilitation process). seedlings and saplings.
Broom: Expansion area: Potential
Genista sp., Cytisus sp., Erinacea distribution with future climate.
Juniper:
Juniperus
Potential distribution area with both present and future climate Potential distribution area with both present and future climate
Sierra Nevada Global Change Observatory 25Mid mountain shrubland
25 km
30,000 Ha.
Mainly aromatic (Rosmarius, Thymus) and some pyrophytes (Ulex, Cistus,
Degraded shrublands in
etc) species. 1956
Its ecological dynamics are conditioned by factors such as grazing and 500 m
recurrent wildfires
MAIN BIOPHYSICAL VARIABLES
NQ It is expected that annual rainfall (l/m2) will fall in the coming
790 788
decades from 790 l/m2 a year recorded from 1960-1990, to 788
13 14
l/m2 for 2011-2040.
Pine plantations in 2009
Average annual temperature (ºC). The increase of temperature
13 14.3
in the coming decades may be one of the most important
NQ 14
13 stress factors for this ecosystem.
Occupation area (Ha). Pine forests were planted over highly
degraded shrublands. This explains the decline in occupation
42000 area. It is expected to increase due to the naturalization
NQ
20
30000 process of pine plantation and occupation of marginal areas.
19
26 Sierra Nevada Observatory for Monitoring Global Change. Structure and basic data2. ECOSYSTEMS
SAMPLING INTENSITY
40
30
20
10
MAIN ECOSYSTEM SERVICES
Provisioning Regulation Cultural
ADAPTIVE MANAGEMENT
Beekeeping is a good example of adaptive management. Environmental managers offer beekeepers some places to establish their apiaries. Land
assignment is free for beekeepers, since it is considered that this activity contributes to plant pollination. The map shows land suitability to host
apiaries. It is based on a model that takes into account some determining factors, such as: rainfall, temperature, accessibility, water availability and the
honey’s flora presence.
Green colours show high suitability areas. Red colours show
unsuitable areas. The black circles indicate distribution
of apiaries, with size proportional to number of hives per
apiary.
The most interesting result of this model is that there are
several places in Sierra Nevada that could be occupied by
apiaries under an adaptive management scenario.
Sierra Nevada Global Change Observatory 27Pine plantations
25 km
40,000 Ha
Planted between 1930-1980 to minimize soil loss in deforested areas.
Several pine species (Pinus sylvestris, P. pinaster, P. halepensis, P. nigra).
Currently being replaced by natural vegetation due to adaptive management actions (partial clear-cuts).
MAIN BIOPHYSICAL VARIABLES
11 12
NQ NQ
1005 992 NQ 14 53 NQ
13
13 14 15 16
It is expected that annual rainfall (l/ It is expected that the average annual Average snow cover duration (days). When
m2) will fall in the coming decades from temperature will increase in the coming analyzing the past decade, the trend is
1,005 l/m2 a year recorded from 1960- decades from 10.4ºC recorded during 1960- negative. The reduction in snow cover
1990, to 992 l/m2 for 2011-2040. 1990, to 11.7ºC for 2011-2020. duration has not been quantified yet, although
it seems less important here compared to
other ecosystems.
913 40000
NQ
19 0 22 19
NQ NQ 1000 NQ
22
Average number of plant species. Diversity Average density of tree cover (number of trees Occupation area (Ha). Increase due to
was lower in the past due to both the per Ha). It is expected to decrease due to plantations during the 1960s and 70s. Thanks
high rate of erosion and misuse of natural management actions (partial clear-cuts). to management actions the area will decrease
resources. It will be increased by adaptive in coming decades, becoming a mixed pine-oak
management. forest.
28 Sierra Nevada Observatory for Monitoring Global Change. Structure and basic data2. ECOSYSTEMS
SAMPLING INTENSITY
30
20
10
0
ADAPTIVE MANAGEMENT MAIN ECOSYSTEM SERVICES
This ecosystem is being replaced by natural vegetation, which is much Provisioning Regulation Cultural
more resilient and better adapted to the landscape's natural features.
Clear-cuts are the main management actions that are driving these
“artificial forests” to a more natural state.
The map shows the approximate date
(year) of each plantation. We also show
the location of the clear-cuts.
The graph shows the number of hectares
treated by clear-cuts per year.
2600
Plantation year Clear-cut area (Ha)
1935 1964-1965 1.6-20 1300
20-41
1936-1948 1966-1969
41-87 339 589
1949-1957 1970-1973 383 380
87-205 56
1958-1959 1974-1976
1960-1963 1977-1980 205-397 1990 1993 1996 1999 2002 2005 2008
Sierra Nevada Global Change Observatory 29Aquatic systems
25 km
1,700 Ha
Mountain rivers, glacial lakes, irrigation ditches, Riparian forest, etc. Degraded Riparian
forest in 1956
(Dílar river)
The spring and summer snowmelt contributes greatly to water flow.
MAIN BIOPHYSICAL VARIABLES
Riparian Quality Index average (RQI. From 0 to 100). The
NQ abandonment of rural areas and management actions have helped
80
NQ enhance the conservation status of the Riparian forest.
23
Biological Quality of Riparian environment (Iberian Biological
Monitoring Working Party. From 0 to 200). This index measuring
NQ water quality using species of macro invertebrates as biological
142
NQ indicators. It is expected to increase due to the adaptive Regenerated Riparian
24 forest in 2009
management of this ecosystem. (Dílar river)
River Habitat Index average (IHF. From 0 to 100). This index
NQ characterises the physical habitat of Mediterranean streams and
76
NQ shows the heterogeneity and structural diversity of rivers. It is
25
expected to increase due to improvements in river water flow.
Increase in total length (%) of trout populations (Salmo trutta).
NQ 100% Management actions will improve the conservation status of this
26 species in the coming decades.
Increase in density of Riparian forest probably due to the
NQ NQ abandonment of rural areas close to the rivers. Restoration activities
NQ 19
20
are helping to increase the occupation areas of aquatic systems in
Sierra Nevada.
30 Sierra Nevada Observatory for Monitoring Global Change. Structure and basic data2. ECOSYSTEMS
SAMPLING INTENSITY
20
10
MAIN ECOSYSTEM SERVICES
Provisioning Regulation Cultural
ADAPTIVE MANAGEMENT
Sierra Nevada rivers have a large population of brown trout (Salmo trutta). These populations represent the southern limit of this species in Europe,
which means that there are specific genetic patterns in Sierra Nevada. Several decades ago anglers introduced adult rainbow trout (Oncorhynchus
mykiss) specimens. This species (native in Northwest America) behave as an invasive species in Mediterranean rivers. Nowadays, it is the main threat
to native trout conservation. Management actions try to improve the conservation status of brown trout and the gradual eradication of rainbow trout
populations.
Alien species: Rainbow trout Disease transmission Management methodology to improve the conservation status of brown trout
(Oncorhynchus mykiss)
Predation of grilse Delimiting the extent of rainbow trout populations
Reducing the presence of refuges for rainbow trout in rivers
Habitat and food competition Raking spawning grounds to avoid the rainbow trout's reproduction success
Extraction by electrofishing of rainbow trout
Reproductive interference Population reinforcement of brown trout
Autocthonous species: Brown trout
(Salmo trutta)
Sierra Nevada Global Change Observatory 3132 Sierra Nevada Observatory for Monitoring Global Change. Structure and basic data
3. PROCESSING AND DISSEMINATION OF RESULTS

Data Processing
and Dissemination
of Results

                       Sierra Nevada Global Change Observatory 33
Information Management System
The information system associated with the Sierra Nevada Global Change Observatory is designed as a repository for storing both raw data gathered by
the monitoring program and knowledge generated through the processing of such data.
The aim is to provide all this information to managers, scientists and society in general. The main idea is to store the data in a standardised and
documented way to facilitate its integration and further analysis. This process generates useful knowledge for decision making.
The diagram on the left shows the evolution from raw data to that knowledge. The thickness of the central line represents the volume of information
in each of the phases. The standardised and documented raw data occupies more “volume” that the knowledge obtained on synthetic analysis. Further
information: http://sl.ugr.es/repositorio.
complex
reality
Through mobile devices such as PDAs,
3 1 data capture on environmental variables is
4 performed. CyberTracker software is used
8 for its easy handling.
7
Raw data
The data is stored in normalized databases
1 according to the relational database model,
3 which enables compatibility with other sites
4
and sharing this information with them.
8
7
Normalized data
Metadata enables data documentation
1 through its labelling. That way we can
4 3 establish who generated the data, how it
8 is ordered, when it was taken, etc. We use
7
several metadata international standards
Metadata (http://sl.ugr.es/metadatos).
Through various analytical techniques (data
7.5
density mining, multi-criteria evaluation, statistical
analysis, etc.) raw data is transformed into
Knowledge
useful knowledge to make decisions in the
territory.
simplified
reality
34 Sierra Nevada Observatory for Monitoring Global Change. Structure and basic data3. PROCESSING AND DISSEMINATION OF RESULTS
[A]
[C] [B]
[D]
The knowledge generated therefore is available to users through the use of different techniques. The maps are distributed through web
services. On the other hand, dynamic graphics (figure A) that show the temporal variation of the status indicators of Sierra Nevada are
generated. The web 2.0 tools allow collaborative editing of texts through a wiki (http://observatoriosierranevada.iecolab.es, figure B),
cooperative management of the bibliography (http://refbase.iecolab.es, figure C) and spreading of multimedia content (http://sl.ugr.es/
canal_sshare; http://sl.ugr.es/canal_scivee, figure D).
Sierra Nevada Global Change Observatory 35Outreach and Dissemination of results
The Sierra Nevada Global Change Observatory is principally committed to the dissemination of updated results. We consider essential the existence of
a central communication forum involving different players: scientists, managers and the general public. To carry out this task, a collaborative working
environment has been created which combines traditional methods of communication with the use of new technologies (Web 2.0 tools). They help
speed up the transfer of updated scientific knowledge to both managers and society and improve collaboration between different teams working on the
project. We therefore use different communication-dissemination channels that allow us:
To improve the acquisition and creation of useful knowledge for management
To improve collaboration amongst work teams
To increase the availability of updated project results
WIKI: http://observatoriosierranevada.iecolab.es
Website that enables both collaborative creation and the editing of Origin of visitors: Percentage of Visitors:
49 countries New (green)
content easily by many users. Our wiki supports both coordination Returning (brown)
469 cities
activities within the project and sharing files and documents, acting
as an information repository. It allows the dissemination of updated Highlights:
results to the managers of natural resources and to the general 46,000 visitors
public. 72 users
157 pages
609 shared files
Temporal variation of visits (numbers)
600
500
400
300
200
100
0
June 2009 September 2010
PUBLISHING DOCUMENTS THROUGH WEB 2.0 TOOLS
Use of dissemination of content channels in different web 2.0 platforms, in
which documents, presentations, videos, etc. are published on various training
activities and conferences organised by the Sierra Nevada Global Change
Observatory. This enterprise has got communication channels on the following
platforms:
SlideShare SOCIAL
http://sl.ugr.es/canal_sshare NETWORK
Slideboom Twitter
http://sl.ugr.es/canal_sboom http://sl.ugr.es/red_twitter
Scivee Science Videos Facebook
http://sl.ugr.es/canal_scivee http://sl.ugr.es/red_facebook
Youtube
Youtube channel of the Sierra Nevada Global Change Observatory. http://sl.ugr.es/canal_youtube
36 Sierra Nevada Observatory for Monitoring Global Change. Structure and basic data3. PROCESSING AND DISSEMINATION OF RESULTS
TRAINING ACTIVITIES, CONFERENCES, WORKSHOPS
29
We provide a training activities process through courses, workshops, conferences, with twin goals:
Updating the scientific-technical knowledge of the work team
Sharing and exchange of technical knowledge and project development problems between the scientist and manager of natural resources to generate synergies between them
and to improve the adaptive management of natural resources under an interdisciplinary view.
Sierra Nevada Global Change Observatory Coordination Workshop. The value of mountain protected areas in the global change scenario.
June 2010 Granada, May 2009
PUBLICATION OF SCIENTIFIC RESULTS IN DIFFERENT INTERNATIONAL FORUMS AND SPECIFIC JOURNALS
28
National
Dissemination of updated results to general public through
Regional
audiovisuals and news via several media channels (local, regional
and national).
Local
Articles in newspapers
Sierra Nevada Global Change Observatory 3738 Sierra Nevada Observatory for Monitoring Global Change. Structure and basic data
4. METHODOLOGIES AND BIBLIOGRAPHIC REFERENCES

Methodologies and
references

                         Sierra Nevada Global Change Observatory 39
Bibliography: methodologies and references
Interpretation of the colour code for reading this section:
Green> > Bibliography
Blue > Data Sources
01 Spatial distribution of ecosystems
• Mesa, J.; Pérez Raya, F.; López Nieto, J.M.; El Aallali, A. & Hita Fernández, J.A. (2001). Mapping and assessment of the vegetation of the Sierra
Nevada Nature Reserve. Department of the Environment. Regional Government of Andalusia.
http://sl.ugr.es/refbase_166
• Spain's Land Cover and Use Information System (SIOSE). Departments for the Environment, Agriculture and Fisheries and Public Works and
Transport. Andalusian Regional Government.
http://sl.ugr.es/siose
02 European mountain ranges: size, altitude, and total vascular plants, number and endemics.
• Blanca López, G.; López Onieva, M.R.; Lorite, J.; Martínez Lirola, M.J.; Molero Mesa, J.; Quintas, S.; Ruíz Girela, M.; Varo, M.A. & Vidal, S.
(2001). Threatened and endemic flora of Sierra Nevada. University of Granada. Department of the Environment. Regional Government of
Andalusia.
http://sl.ugr.es/refbase_934
• Blanca, G.; Cueto, M.; Martínez-Lirola, M.J. & Molero-Mesa, J. (1998). Threatened vascular flora of Sierra Nevada (Southern Spain). Biological
Conservation, 85 (3): 269–285.
http://sl.ugr.es/refbase_302
• CERI (Carpathian EcoRegion Initiative) (2001). The Status of the Carpathians. Vienna, Austria WWF Carpathian & Danube Programme.
http://sl.ugr.es/refbase_1446
• Gambino, R. & Romano, B. (2003). Territorial strategies and environmental continuity in mountain systems: The case of the Apennines (Italy).
In World Heritage Mountain Protected Area Field Workshop. Linking Protected Areas along the mountain range. Durban, South Africa, 5-8
September 2003.
http://sl.ugr.es/refbase_1450
• Nagy, L.; Grabherr, G.; Körner, C. & Thompson, D.B.A (eds). (2003). Alpine biodiversity in Europe. Ecological Studies, 167. Springer. 477 pp.
03 Plant Diversity in Sierra Nevada
• Blanca, G. (1991). Botanical Jewels of Sierra Nevada. La Madraza. Granada. 171 pp.
• Blanca López, G.; López Onieva, M.R.; Lorite, J.; Martínez Lirola, M.J.; Molero Mesa, J.; Quintas, S.; Ruíz Girela, M.; Varo, M.A. & Vidal, S.
(2001). Threatened and endemic flora of Sierra Nevada. University of Granada. Department of the Environment. Regional Government of
Andalusia.
http://sl.ugr.es/refbase_934
• Blanca, G.; Cueto, M.; Martínez-Lirola, M.J. & Molero-Mesa, J. (1998). Threatened vascular flora of Sierra Nevada (Southern Spain). Biological
Conservation, 85 (3): 269–285.
http://sl.ugr.es/refbase_302
• Moreno-Saiz, J.C.; Domínguez Lozano, F. & Sainz Ollero, H. (2003). Recent progress in conservation of threatened Spanish vascular flora: a
critical review. Biodiversity and Conservation, 113: 419–431.
http://sl.ugr.es/refbase_469
04 Number of mountain species of community interest (annex II and IV of the EU habitats directive) endemic
to mountain ranges
• EEA (2010). Mountain ecosystems. In Biodiversity – 10 messages for 2010. European Environment Agency.
http://sl.ugr.es/bio_messages
• Department of the Environment (2010). The Natura 2000 network in the province of Granada. Unpublished. Provincial Delegation of the
Environment, Department of the Environment. Regional Government of Andalusia. 166 pp.
http://sl.ugr.es/refbase_934
40 Sierra Nevada Observatory for Monitoring Global Change. Structure and basic data4. METHODOLOGIES AND BIBLIOGRAPHIC REFERENCES
• Natura 2000 data - the European network of protected sites. European Environment Agency.
http://sl.ugr.es/natura2000
05 Comparison of species richness in European mountain ranges
• Blanca López, G.; López Onieva, M.R.; Lorite, J.; Martínez Lirola, M.J.; Molero Mesa, J.; Quintas, S.; Ruíz Girela, M.; Varo, M.A. & Vidal, S.
(2001). Threatened and endemic flora of Sierra Nevada. University of Granada. Department of the Environment. Regional Government of
Andalusia.
http://sl.ugr.es/refbase_934
• Blanca, G.; Cueto, M.; Martínez-Lirola, M.J. & Molero-Mesa, J. (1998). Threatened vascular flora of Sierra Nevada (Southern Spain). Biological
Conservation, 85 (3): 269–285.
http://sl.ugr.es/refbase_302
• Nagy, L.; Grabherr, G.; Körner, C. & Thompson, D.B.A (eds). (2003). Alpine biodiversity in Europe. Ecological Studies, 167. Springer. 477 pp.
06 Temporal evolution of energy consumption, immigration, business tax (I.A.E.), ecosystem ruralization
index. Capacity of rural tourism and population in Sierra Nevada. Time series from 1980 to 2008. 100
index (100 = first value of each variable in the time series)
• Fernández, M.; Cuenca, E.; Salinas, J.A.; Campos, J.; Aragón, J.A.; García, V.J.; Martín, J.M.; Aranda, J. & Vallberg, V. (2007). Socioeconomic
impact on Sierra Nevada Nature Reserve: 1989-2005. Department of the Environment. Regional Government of Andalusia. Seville.
http://sl.ugr.es/refbase_1061
• System of Multi-territorial Information of Andalusia (SIMA). Institute of Statistics of Andalusia.
http://sl.ugr.es/SIMA_IEA
07 Percentage of companies from the services, construction and industry sectors. Time series: comparison
between 1995-2005 period and 2008.
• Fernández, M.; Cuenca, E.; Salinas, J.A.; Campos, J.; Aragón, J.A.; García, V.J.; Martín, J.M.; Aranda, J. & Vallberg, V. (2007). Socioeconomic
impact on Sierra Nevada Nature Reserve: 1989-2005. Department of the Environment. Regional Government of Andalusia. Seville.
http://sl.ugr.es/refbase_1061
• Andalusian Economy. Economic Analysts of Andalusia.
http://sl.ugr.es/datos_economia
08 Land use in Sierra Nevada municipalities, 2007.
• Andalusian Economy. Economic Analysts of Andalusia.
http://sl.ugr.es/datos_economia
09 Unemployment rate of social sector, 2008.
• Andalusian Economy. Economic Analysts of Andalusia.
http://sl.ugr.es/SIMA_IEA
10 Influence of National Park and Nature Reserve on turnover of companies in its area influence. Time series
from 1999 to 2005.
• Fernández, M.; Cuenca, E.; Salinas, J.A.; Campos, J.; Aragón, J.A.; García, V.J.; Martín, J.M.; Aranda, J. & Vallberg, V. (2007). Socioeconomic impact
on Sierra Nevada Nature Reserve: 1989-2005. Department of the Environment. Regional Government of Andalusia. Seville.
http://http://sl.ugr.es/refbase_1061
11 Number of livestock units (UGM) and percentage of each type for the 2007 census.
Livestock population in Sierra Nevada.
• Data from Regional Agricultural Offices provided by Sierra Nevada National Park
12 Days of snow vs. natural snow duration
• Bonet García, F.J. & Cayuela Delgado, L. (2009). Monitoring snow cover in Sierra Nevada: trends over the last decade and their possible
ecological implications. At 11th National Congress of the Spanish Association of Terrestrial Ecology: The ecological dimension of sustainable
development: Ecology, from knowledge to application. Úbeda, 18-22 October 2009.
http://sl.ugr.es/refbase_892
• Bonet García, F.J. (2009). Characterisation of snow cover in Sierra Nevada and temporal trends through the use of MODIS images (2000-2008).
http://sl.ugr.es/refbase_1032
Sierra Nevada Global Change Observatory 41• Hall, D.K.; Riggs, G.A.; Salomonson, V.V.; DiGirolamo, N.E. & Bayr, K.J. (2002). MODIS snow-cover products. Remote Sensing of Environment, 83
(1-2): 181–194.
http://sl.ugr.es/refbase_947
• Days of snow. Source: Cetursa. Sierra Nevada
http://sl.ugr.es/cetursa
13 Climate variables from the analysis of data from weather stations. Time series 1960-1990.
• Information Subsystem of Environmental Climatology (CLIMA). Environmental Information Network of Andalusia (REDIAM). Department of the
Environment. Andalusian Regional Government.
http://sl.ugr.es/clima
14 Predictions of climatic variables obtained from the regional climate scenarios (reduction techniques scale).
Time series from 2011 to 2040.
• Moreira, J.M. (2008). Climate change in Andalusia. Current and future climate scenarios. Environment Magazine, 59: 35–41.
http://sl.ugr.es/refbase_1132
• Regionalized climate change scenarios. Department of the Environment. Andalusian Regional Government.
http://sl.ugr.es/escenarios_clima
15 Snow data obtained by remote sensing. Analysis of snow cover products (MODA10A2) from the MODIS
(NASA). Time series from 2000 to 2010.
• Bonet García, F.J. & Cayuela Delgado, L. (2009). Monitoring snow cover in Sierra Nevada: trends over the last decade and their possible
ecological implications. At 11th National Congress of the Spanish Association of Terrestrial Ecology: The ecological dimension of sustainable
development: Ecology, from knowledge to application. Úbeda, 18-22 October 2009.
http://sl.ugr.es/refbase_892
• Bonet García, F.J. (2009). Characterisation of snow cover in Sierra Nevada and temporal trends through the use of MODIS images (2000-2008).
http://sl.ugr.es/refbase_1032
• Hall, D.K.; Riggs, G.A.; Salomonson, V.V.; DiGirolamo, N.E. & Bayr, K.J. (2002). MODIS snow-cover products. Remote Sensing of Environment, 83
(1-2): 181–194.
http://sl.ugr.es/refbase_947
16 Time series analysis of MODIS data using Mann-Kendall test.
• Bonet García, F.J. & Cayuela Delgado, L. (2009). Monitoring snow cover in Sierra Nevada: trends over the last decade and their possible
ecological implications. At 11th National Congress of the Spanish Association of Terrestrial Ecology: The ecological dimension of sustainable
development: Ecology, from knowledge to application. Úbeda, 18-22 October 2009.
http://sl.ugr.es/refbase_892
• Bonet García, F.J. (2009). Characterisation of snow cover in Sierra Nevada and temporal trends through the use of MODIS images (2000-2008).
http://sl.ugr.es/refbase_1032
• Hall, D.K.; Riggs, G.A.; Salomonson, V.V.; DiGirolamo, N.E. & Bayr, K.J. (2002). MODIS snow-cover products. Remote Sensing of Environment, 83
(1-2): 181–194.
http://sl.ugr.es/refbase_947
17 Sampling ibex (Capra pyrenaica) by transect. Time series 1960-2009.
• Pérez, J.M.; Granados, J.E. & Soriguer, R.C. (1994). Population dynamics of the Spanish ibex Capra pyrenaica in Sierra Nevada Nature Reserve
(southern Spain). Acta Theriologica, 39 (3): 289–294.
http://sl.ugr.es/refbase_994
• Granados, J.E.; Castillo, A.; Cano Manuel-León, F.J.; Serrano, E.; Pérez, J.M.: S., R.C. & Fandos, P. (2009). Ibex management. In M. Sáenz de
Buruaga & J. Carranza, (Eds.) Hunting management in Mediterranean ecosystems. Department of the Environment. Regional Government of
Andalusia, 452–485.
http://sl.ugr.es/refbase_1042
18 Predicting the potential distribution of vegetation in future climate scenarios.
• Benito de Pando, B. (2008). Global warming in Sierra Nevada. Models of potential distribution of vegetation on climate change scenarios.
Advanced Studies Diploma Report.
http://sl.ugr.es/refbase_149
42 Sierra Nevada Observatory for Monitoring Global Change. Structure and basic data4. METHODOLOGIES AND BIBLIOGRAPHIC REFERENCES
• Benito de Pando, B. (2009). Ecoinformatics applied to conservation: Simulation of effects of global change on the distribution of flora in
Andalusia. Doctoral thesis, University of Granada. 308 pp.
http://sl.ugr.es/refbase_915
19 Vegetation map of Sierra Nevada (1:10,000). Interpretation of aerial photography in 2005.
• Mesa, J.; Pérez Raya, F.; López Nieto, J.M.; El Aallali, A. & Hita Fernández, J.A. (2001). Mapping and assessment of the vegetation of the Sierra
Nevada Nature Reserve. Department of the Environment. Regional Government of Andalusia.
http://sl.ugr.es/refbase_166
• Spain's Land Cover and Use Information System (SIOSE). Departments for the Environment, Agriculture and Fisheries and Public Works and
Transport. Andalusian Regional Government.
http://sl.ugr.es/siose
20 Vegetation map of Sierra Nevada (1:10,000). Interpretation of aerial photography in 1956.
• Navarro González, I. & Bonet García, F.J. (2009). Characterization of the historical evolution of ground cover and land use in Sierra Nevada in
a global change scenario. At 11th National Congress of the Spanish Association of Terrestrial Ecology: The ecological dimension of sustainable
development: Ecology, from knowledge to application. Úbeda, 18-22 October 2009.
http://sl.ugr.es/refbase_893
21 Ecological niche modelling of high mountain shrublands using the MaxEnt algorithm
• Benito de Pando, B. (2009). Ecoinformatics applied to conservation: Simulation of effects of global change on the distribution of flora in
Andalusia. Doctoral thesis. University of Granada. 308 pp.
http://sl.ugr.es/refbase_915
22 Values of biodiversity, and understory tree density obtained from the forest inventory carried out in the
Sierra Nevada National Park in 2005.
• Department of the Environment (2005). Technical assistance for the assessment, planning and dissemination of actions aimed at the
diversification and naturalization of forests in the Sierra Nevada National Park. Ministry of the Environment. Tragsa.
23 Riparian forest quality measured by the QBR index. Time series from 2001 to 2010.
• Munné, A.; Prat, N.; Solà, C.; Bonada, N. & Rieradevall, M. (2003). A simple field method for assessing the ecological quality of the Riparian
habitat in rivers and streams: QBR index. Aquatic Conservation: Marine and Freshwater Ecosystems, 13 (2): 147–163.
http://sl.ugr.es/refbase_1065
• Suárez, M.L.; Vidal-Abarca, M.R.; Sánchez-Montoya, M.M.; Alba-Tercedor, J.; Álvarez, M.; Avilés, J.; Bonada, N.; Casas, J.; Jáimez-Cuéllar, P.;
Munné, A.; Pardo, I.; Prat, N.; Rieradevall, M.; Salinas, M.J.; Toro, M. & Vivas, S. (2002). The banks of Mediterranean rivers and their quality:
use of the QBR index. Limnetica, 21 (3-41): 135–148.
http://sl.ugr.es/refbase_1064
• Data source: SAUCE: Management of Information on River Ecosystems. Environment Department. Andalusian Regional Government.
http://sl.ugr.es/sauce
24 Biological quality of rivers measured with the IBMWP (Iberian Biological Monitoring Working Party). Time
series from 2005-2010.
• Alba-Tercedor, J.; Jáimez-Cuéllar, P.; Álvarez, M.; Avilés, J.; Bonada, N.; Casas, J.; Mellado, A.; Ortega, M.; Pardo, I.; Prat, N.; Rieradevall,
M.; Robles, S.; Sáinz-Cantero, C.E.; Sánchez-Ortega, A.; Suárez, M.L.; Toro, M.; Vidal-Abarca, M.R.; Vivas, S. & Zamora-Muñoz, C. (2002).
Characterization of the ecological status of Iberian Mediterranean rivers measured with the IBMWP index (previously BMWP). Limnetica, 21
(3-4): 175–185.
http://sl.ugr.es/refbase_1067
• Data source: SAUCE: Management of Information on River Ecosystems. Environment Department. Andalusian Regional Government.
http://sl.ugr.es/sauce
25 Fluvial Habitat Index (IHF). Time series from 2006 to 2010.
• Pardo, I.; Álvarez, M.; Casas, J.; Moreno, J.L.; Vivas, S.; Bonada, N.; Alba-Tercedor, J.; Jáimez-Cuéllar, P.; Moyá, G.; Prat, N.; Robles, S.; Suárez, M.L.;
Toro, M. & Vidal-Abarca, M.R. (2002). The habitat of Mediterranean rivers. Design of a habitat diversity index. Limnetica, 21 (3-4): 115–133.
http://sl.ugr.es/refbase_1066
• Data source: SAUCE: Management of Information on River Ecosystems. Environment Department. Andalusian Regional Government.
http://sl.ugr.es/sauce
Sierra Nevada Global Change Observatory 43You can also read