8 Blue shark in the North Atlantic (North of 5ºN) - ICES
←
→
Page content transcription
If your browser does not render page correctly, please read the page content below
232   |   ICES SCIENTIFIC REPORTS 2:77                                                                           |   ICES

      8 Blue shark in the North Atlantic (North of 5ºN)

          8.1         Stock distribution
          There is a discrete North Atlantic stock of blue shark Prionace glauca (Heessen, 2003; Fitzmaurice
          et al., 2005; ICCAT, 2008), with 5°N latitude the southern stock boundary, and a separate South
          Atlantic stock (ICCAT, 2008). This is based on mark-recapture data and oceanographic features,
          and it also facilitates comparison with fisheries statistics from tuna-like species, as other North
          Atlantic stocks have this southern stock boundary. Hence, the ICES area is only part of the stock
          area.
          Recent genetic studies on blue shark reveal genetic homogeneity across whole ocean basins in
          Atlantic (Verissimo et al., 2017) and Pacific oceans (Ovenden et al., 2009; Taguchi et al., 2015).
          These are at odds with the currently assumed distinction of northern and southern stocks within
          each ocean basin. The bulk of the evidence gathered thus far indicates that the blue shark exhibits
          dispersal with gene flow over very large spatial scales, and little to no philopatry to the sampled
          nursery areas or to distinct ocean basins. However, in cases as in blue sharks where effective
          populations sizes are ~1000s, the levels of genetic divergence associated with migration rates
          which could lead to demographic connectivity (~10%; Hastings, 1993) may be difficult to detect
          using traditional molecular markers. In these cases, the precautionary approach in conservation
          and fisheries management would be to consider each nursery area as independent, with poten-
          tially different demographic parameters and vulnerability to fishing pressure. If each nursery
          area currently exchanges only a few migrant individuals per generation with other nurseries, the
          replenishment of each stock would be mostly dependent on recruit survival rather than on im-
          migration from adjacent stocks.

          8.2         The fishery
          8.2.1       History of the fishery
          In recent years, more information has become available about fisheries taking blue shark in the
          North Atlantic. Although available data are incomplete, they offer information on the situation
          in fisheries and trends. There are no large-scale target fisheries for blue shark, it is a major by-
          catch in tuna and billfish fisheries, where it can comprise up to 70% of the total catches and even
          exceed the catch of target species (ICCAT, 2005). In the North Atlantic, the EU fleets (Portugal
          and Spain) are responsible for approximately 82% of the total landings (Anon., 2015).
          Observer data indicates that substantially more blue shark are caught as bycatch than reported
          in landings statistics. Blue sharks are also caught, in considerable numbers, in recreational fish-
          eries, including in the ICES area (Campana et al., 2005).
          Since 1998, there has been a Basque artisanal longline fishery targeting blue shark and other pe-
          lagic sharks in the Bay of Biscay from June to November (Díez et al., 2007). Initially 3–5 vessels
          were involved but, as a consequence of changes in local fishing regulations, the number of ves-
          sels has reduced to two since 2008.
          In the North Atlantic, thirteen fisheries (in descending order of volume: EU-Spain, EU-Portugal,
          Japan, Canada, USA_LL, Chinese Taipei, EU-France, Belize, Panama, USA_SP., China PR, Korea
          and, Venezuela) accounted for 99% of the total removals (1990–2014). The majority (except: USA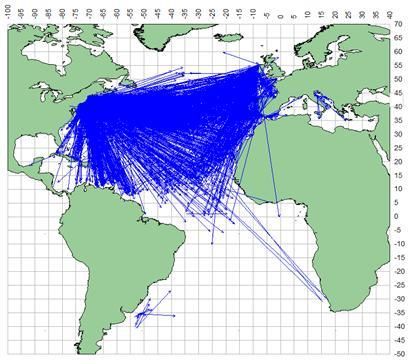
ICES   |   WGEF 2020                                                                                                  |   233

           sport fishery, EU-France unclassified gear) are longline fisheries (Anon., 2015). There are also
           blue shark landings in Mediterranean fisheries (Anon., 2015).

           8.2.2        The fishery in 2019
           In 2015, prior to their most recent stock assessment, ICCAT nominal catch statistics of blue shark
           (by stock, flag and gear) were reviewed. No major updates were made to the historical catch
           series, and only recent years of official catches were updated. Before 1997, there is a lack of official
           catches statistics for some of the main fishing nations operating in the stock area. No change in
           2019.

           8.2.3        Advice applicable
           ACOM has never provided advice for blue shark in the ICES area. Assessment of this stock is
           considered to be the responsibility of ICCAT. In July 2015, members of WGEF participated in the
           ICCAT blue shark stock assessment meeting that took place in Lisbon, Portugal (ICCAT, 2015).
           In 2015, ICCAT considered that the status of the North Atlantic stock is unlikely to be either
           overfished or subject to overfishing. However, due to the level of uncertainty in the assessment
           results no specific management recommendations were provided (ICCAT, 2015).
           ICCAT adopted Rec. 16-12, which in paragraph 2 establishes a catch limit for blue sharks in the
           North Atlantic (39,102 t as the average of two consecutive years). This measure came into being
           in 2017 and the Standing Committee on Research and Statistics (SCRS) has been in a position to
           assess the effect of this measure as yet. However, SCRS data show that preliminary catches in
           2017 and 2018 were 39 675 t and 33 853 t, respectively (SCRS, 2019).
           In 2019, these catch limits were further refined when ICCAT adopted Rec. 19-07. This states that:
           “An annual TAC of 39 102 t for North Atlantic blue shark is established. The annual TAC may
           be revised subject to a decision of the Commission based on the updated advice of the SCRS in
           2021, or at an earlier stage if enough information is provided by the SCRS.” Catch limits for the
           EU, Japan and Morocco have been set at 32 578 t, 4010 t and 1644 t, respectively.

           8.2.4        Management applicable
           There are no measures regulating the catches of blue shark in the North Atlantic. EC Regulation
           No. 1185/2003 (updated by EU Regulation No 605/2013) prohibits the removal of shark fins of
           these species, and subsequent discarding of the body. This regulation is binding on EC vessels
           in all waters and non-EC vessels in Community waters.

           8.3          Catch data
           8.3.1        Landings
           It is difficult to accurately quantify landings of blue shark in the North Atlantic. Data are incom-
           plete, and the generic reporting of shark catches has resulted in underestimations. Landing data
           from different sources (ICCAT, FAO and national statistics) can vary (figures 8.1–8.3). Table 8.1
           gives the catch data (total landings and discards by stock, flag and major gears) collated by IC-
           CAT, which appears to provide the most complete catch data for this stock. ICCAT considers
           that reported landings of blue shark were underestimated in the early part of the time-series
           (prior to 1997), with official landings and estimates of a comparable magnitude since 1997, when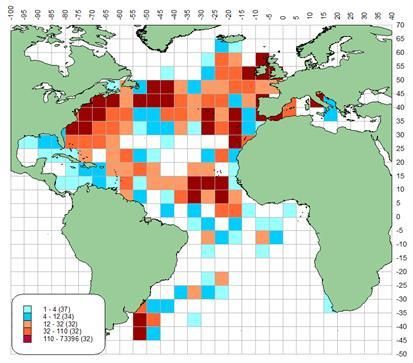
234   |   ICES SCIENTIFIC REPORTS 2:77                                                                            |   ICES

          annual landings have been ca. 20 000–40 000 t. In the North Atlantic, blue shark is reported pre-
          dominantly by Spain, Portugal, Japan, USA and Canada (Figure 8.1).
          In 2015, alternative approaches to estimate catch series were discussed by ICCAT (Anon., 2015),
          including (i) ratios between blue shark catches and species-specific catches derived from ICCAT
          Task I data; (ii) catch/effort and standardised CPUE; and (iii) shark fin trade data. Figure 8.4
          shows the catch series (1971–2013) for North Atlantic blue shark available for the 2015 stock as-
          sessment (SA2015), the 2008 stock assessment catches (SA2008), and the catch series obtained
          using shark-fin ratios (three different series, see for example Clarke et al., 2006). Both stock as-
          sessment series followed a similar trend (but with large differences in some years) with catches
          oscillating several times between 15 000 t and 55 000 t. The three shark-fin series show a com-
          pletely different tendency (continuous upward trend) with catches starting around 10 000 t in
          the 1980s and growing to nearly 60 000 t in 2011 (Anon., 2015). Generally, the overall data for
          blue shark (and sharks in general) reported to ICCAT has improved over time (more complete
          series by species, lesser quantities of unclassified sharks, less weight of unclassified gears in the
          shark series, etc.). However, many unclassified shark species, mostly grouped by family (e.g.
          Lamnidae, Carcharhinidae, Sphyrnidae) and genera (e.g. Rhizoprionodon, Carcharhinus, Sphyrna
          and Alopias spp.) were reported to ICCAT in the past. The largest portion of unclassified sharks
          (1982–2013) is concentrated in longline and gillnet fisheries (Anon., 2015).
          Japanese catches (landings and discards) from tuna longliners in the North Atlantic are estimated
          to have fluctuated between 1400–2400 t in 2006–2014, but a large increase to about 8200 t is ob-
          served in 2015. These are higher than reported landings of the target species (bluefin tuna) from
          Japanese longliners in this period (ICCAT, 2008). Another study of Japanese bluefin tuna long-
          line fisheries showed that the ratio of blue shark to the target species was about 1:1 (Boyd, 2008).
          Data from observations onboard a Chinese Taipei (Taiwanese) vessel targeting bluefin tuna in
          the southern North Atlantic showed that blue shark accounted for 76% of shark bycatch, though
          no information was presented on the percentage of blue shark in the total catch (Dai and Jang,
          2008). Together, blue shark and shortfin mako account for between 69% and 72% of catches from
          Spanish and Portuguese surface longliners in the North Atlantic (Oceana, 2008).

          8.3.2       Discards
          Historically, the relative low value of blue shark meant that it was not always retained for the
          market, with the fins the most valuable body part. In some fisheries the fins were retained and
          the carcasses discarded. In 2013, EU prohibited this practice (see Section 8.2.4).
          Accurate estimates of discarding are required to quantify total removals from the stock. Cur-
          rently no such estimates are available. Differences between estimated and reported catch in var-
          ious fisheries (ICCAT, 2008 and references cited therein) suggest that discarding is widespread
          in fisheries taking blue shark.
          Discard estimates are available for fisheries from Chinese Taipei, Korea Rep., USA, and UK (Ber-
          muda) in recent years and from 2000 onwards from USA. However, they represent a limited part
          of total discards. The full extent of blue shark bycatch cannot be assessed using the data available,
          but evidence suggests that longline operations can catch more blue shark than target species.
          There is considerable bycatch of blue sharks in Japanese and Taiwanese tuna longliners operat-
          ing in the Atlantic. However, it is not possible, to estimate discard rates from these fleets from
          the information available. Discards can be assumed to be far higher than reported (Campana et
          al., 2005), especially in high seas fisheries.
          Information on elasmobranchs discards in demersal otter trawl, deep-water set longlines, set
          gillnet and trammel net fisheries for ICES Division 9.a (2004–2013) showed that blue shark was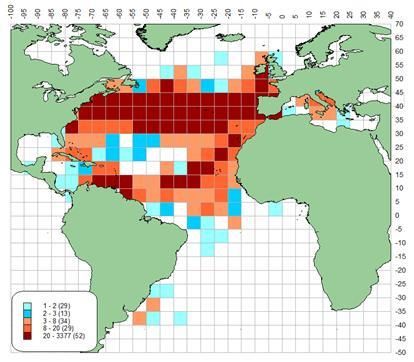
ICES   |   WGEF 2020                                                                                                     |   235

           caught infrequently and discarded in the longline fishery but not in the other fisheries (Prista et
           al., 2014).

           8.3.3        Discard survival
           Blue shark is one of the most frequent shark species captured in pelagic longline fisheries, and
           there are several estimates of survival (Boggs, 1992; Francis et al., 2001; Campana et al., 2005; Diez
           and Serafy, 2005). It is thought that most discards of whole sharks would be alive on return to
           the sea. For instance, discard survival rate is estimated to be about 60% in longline fisheries and
           80% in rod and reel fisheries (Campana et al., 2005). More generally, the at-vessel mortality of
           longline-caught blue shark ranges from about 5–35% (summarised in Ellis et al., 2014 WD). Dis-
           card survival in such fisheries can be influenced by several factors, including hook type, soak
           time and size of shark. However, discarding can increase overall mortality attributable to fisher-
           ies: a study conducted on Canadian pelagic longliners targeting swordfish in the Northwest At-
           lantic (Campana et al., 2009) showed that “overall blue shark bycatch mortality in the pelagic longline
           fishery was estimated at 35%, while the estimated discard mortality for sharks that were released alive was
           19%. The annual blue shark catch in the North Atlantic was estimated at about 84 000 t, of which 57 000 t
           is discarded. A preliminary estimate of 20 000 t of annual dead discards for North Atlantic blue sharks is
           similar to that of the reported nominal catch, and could substantially change the perception of population
           health if incorporated into a population-level stock assessment”. The survival rate at hauling for blue
           shark was estimated to be 49% for the French pelagic longliners targeting swordfish in the south-
           west Indian Ocean. Experiments conducted with gear equipped with hook timers indicated that
           29% were alive 8 h after their capture (Poisson et al., 2010). The survival rate of blue shark (at
           haul back) after a nighttime soak may be lower than that during day-time soaks.

           8.3.4        Quality of catch data
           Catch data are incomplete, and the extent of finning in high seas fisheries is unclear. The histor-
           ical use of generic shark categories is also problematic, although European countries now report
           more species-specific data.
           In 2012, the ICCAT secretariat noted some large discrepancies between the data in the EURO-
           STAT database and that of the ICCAT database, with EUROSTAT records showing captures al-
           most double those of ICCAT in recent years.
           Methods developed to identify shark species from fins (Sebastian et al., 2008; Holmes et al., 2009)
           could help to gather data on species targeted by illegal fishers, this information will greatly assist
           in management and conservation.
           The variability of blue shark mortality estimates, relating to the proportion of live discards, ham-
           pers the estimation of total removals, although there are improving approaches to reporting of
           live discards to the ICCAT SCRS (Anon., 2015).
           Given the uncertainty on the 2015 assessment of blue shark North Atlantic stock, ICCAT recom-
           mended continued monitoring of the fisheries by observer and port sampling programmes (IC-
           CAT, 2015).

           8.4          Commercial catch composition
           No new information.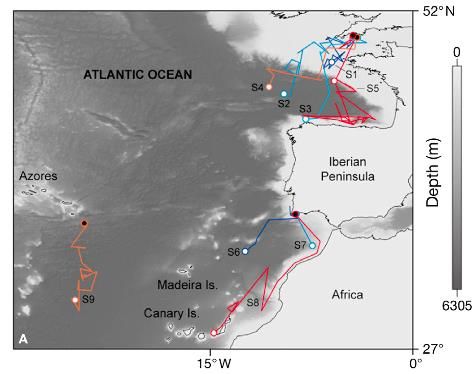
236   |   ICES SCIENTIFIC REPORTS 2:77                                                                            |   ICES

          8.4.1       Conversion factors
          Information on the length–weight relationship is available from several scientific studies (Table
          8.2), as are the relationships between various length measurements (Table 8.3a and 8.3b). Cam-
          pana et al., 2005 calculated the conversion relationships between dressed weight (W D) and live
          weight or round weight (WR) for NW Atlantic blue shark (n = 17) to be WR = 0.4 + 1.22 WD and
          WD = 0.2 + 0.81 WR.
          For French fisheries, the proportion of gutted fish to round weight is 75.19%. There is also a factor
          for landed round weight to live weight (96.15%), meaning that there is a 4% reduction in weight
          because of lost moisture (Hareide et al., 2007). Various estimates of fin weight to body weight are
          available (Mejuto and García-Cortés, 2004; Santos and Garcia, 2005; Hareide et al., 2007; Santana-
          Garcon et al., 2012; Biery and Pauly, 2012).

          8.5         Commercial catch and effort data
          For the North Atlantic stock, catches show a peak in 1997, a decline until 2002 and then an in-
          crease (Figure 8.3).
          The CPUE input data available are comprehensively described and presented in the 2015 blue
          shark data preparatory meeting report (Anon., 2015). Following the work conducted for the 2008
          SCRS blue shark stock assessment, CPUE were combined through a GLM with two choices of
          weighting: by the catch of the flag represented by each index and by the area of the flag repre-
          sented by each index. Additionally, a hierarchical index of abundance that combines all available
          indices into a single series was also developed. However, it was noted that the process of com-
          bining CPUE indices was discouraged as they tend to mask the individual trends of the series
          and the underlying reasons as to why the series are different. It also indicated that some models
          can stochastically make use of the different series without need to combine these indices. It was
          suggested that it may be more useful to group CPUEs according to similar trends, and to include
          these as separate scenarios as was discussed during the 2015 bigeye tuna assessment.
          Table 8.4 shows the various CPUE indices currently available (EU-Portugal, EU-Spain, USA, Ja-
          pan, Chinese Taipei, and Venezuela), which have been considered for use in the assessment.
          These CPUE indices show a relatively flat trend throughout the time-series, but with high vari-
          ance (Table 8.4 and 8.5; Figure 8.5).

          8.6         Fishery-independent surveys
          No fishery-independent data are available for the NE Atlantic, although such data exist for parts
          of the NW Atlantic (Hueter et al., 2008). A survey from 1977–1994 conducted by the US NMFS
          documented a decline among juvenile male blue sharks by 80%, but not among juvenile females,
          which also occur in fewer numbers in the area, the western North Atlantic off the coast of Mas-
          sachusetts (Hueter et al., 2008). The authors concluded that vulnerability to overfishing in blue
          sharks is present despite their enhanced levels of fecundity relative to other carcharhinid sharks.

          8.7         Life-history information
          The blue shark is common in pelagic oceanic waters throughout the tropical and temperate
          oceans worldwide. It has one of the widest ranges of all the shark species. It may also be found
          close inshore.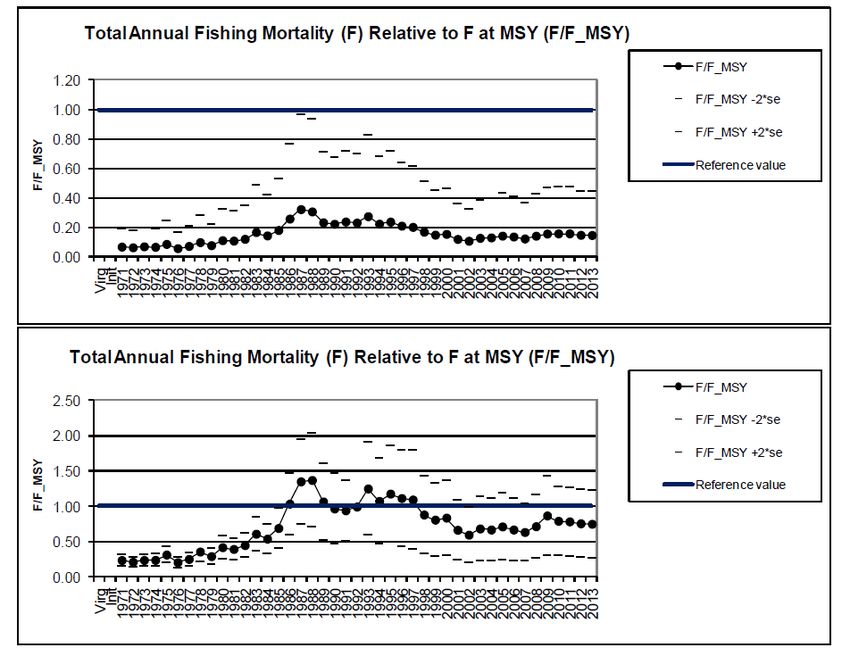
ICES   |   WGEF 2020                                                                                             |   237

           In a satellite telemetry study, Queiroz et al. (2010) described complex and diverse types of behav-
           iour depending on water stratification and/or depth (Figure 8.6). Females tagged in the Western
           channel were able to spend up to 70 days in this shelf edge area in the Bay of Biscay; whereas
           tagged juveniles showed relatively extensive vertical movements away from the southern
           nursery areas. Results indicated that the species inhabits waters with a wide temperature range
           from 10–20°C.
           The US National Marine Fisheries Service also conducts a Cooperative Shark Tagging Pro-
           gramme (CSTP; Kohler et al., 1998; NMFS, 2006), with tagging in the NE Atlantic also being un-
           dertaken under the auspices of the Inshore Fisheries Ireland (formerly the Irish Central Fishing
           Board) Tagging Programme (Green, 2007 WD) and UK Shark Tagging Programme, and there
           have been other earlier European tagging studies (e.g. Stevens, 1976). Figure 8.7 shows the tag
           and release results presented by ICCAT (2012), highlighting the large number tagged to date,
           and the vast horizontal movements undertaken by blue shark in the Atlantic.
           In Australian waters, blue sharks exhibit oscillatory dive behaviour between the surface layers
           to as deep as 560–1000 m. Blue sharks mainly occupied waters of 17.5–20.0°C and spent 35–58%
           of their time in < 50 m depths and 10–16% of their time in > 300 m (Stevens et al., 2010). The dis-
           tribution and movements of blue shark are strongly influenced by seasonal variations in water
           temperature, reproductive condition, and availability of prey. The blue shark is often found in
           large single-sex schools containing individuals of similar size.
           Adult blue sharks have no known predators, although sub-adults and juveniles are eaten by both
           shortfin mako and white shark as well as by sea lions. Fishing is likely to be a major contributor
           to adult mortality. A recent first estimation of fishing mortality rate via satellite tagged sharks
           being recaptured by fishing vessels ranged from 9 to 33% (Queiroz et al., 2010).
           Various studies have compiled data on biological information on this species in the North At-
           lantic and other areas. Some of these data are summarized in Tables 8.2, 8.3a and 8.3b (length–
           weight relationships), Table 8.6 (growth parameters) and Table 8.7 (other life-history parame-
           ters). Based on life-history information, the blue shark is considered to be among the most pro-
           ductive shark species (ICCAT, 2008).
           New life history inputs were obtained from data first assembled at the ICCAT 2014 Intersessional
           Meeting of the Shark Species Group (SCRS/2014/012) and additional information provided dur-
           ing the 2015 blue shark data preparatory meeting (SCRS/2015/142). These included maximum
           population growth rates (rmax) and steepness (h) values of the Beverton–Holt stock–recruitment
           relationship for North and South Atlantic stocks of blue shark, based on the latest biological
           information available gathered at the 2015 blue shark data preparatory meeting. To encompass
           a plausible range of values, uncertainty in the estimates of life history inputs (reproductive age,
           lifespan, fecundity, von Bertalanffy growth parameters, and natural mortality) was incorporated
           through Monte Carlo simulation by assigning statistical distributions to those biological traits in
           a Leslie matrix approach. Estimated productivity was high (rmax = 0.31–0.44 yr–1 for the North
           Atlantic stock), similar to other stocks of this species. Consequently, analytically derived values
           of steepness were also high (h = 0.73–0.93 for the North Atlantic stock).
           The influence of different biological parameters (e.g. growth coefficients, reproductive periodic-
           ity, first maturation age, natural mortality and longevity) on estimated blue shark productivity
           was assessed. Age at first maturity and growth coefficient substantially influenced the produc-
           tivity of species (e.g. a low age at first maturity and high growth coefficient results in high
           productivity). Breeding periodicity also affected productivity (i.e. a longer breeding period de-
           creased productivity). Biological parameters should be carefully considered when they are used
           in the stock analysis, especially when estimated productivity is inconsistent with trends in abun-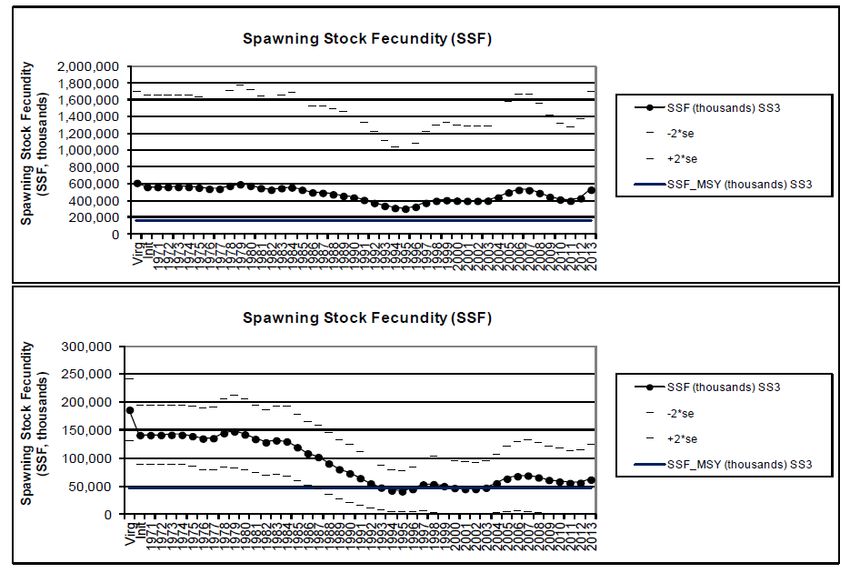
238   |   ICES SCIENTIFIC REPORTS 2:77                                                                            |   ICES

          dance indices. The level of depletion experienced by blue shark stocks may affect the productiv-
          ity or population growth through density dependence, and differences in environmental water
          temperature may also affect growth rates (Anon., 2015).

          8.8         Exploratory assessment models
          8.8.1       Previous assessments
          In 2004, ICCAT completed a preliminary stock assessment (ICCAT, 2005). Although results sug-
          gested that the North Atlantic stock were above biomass in support of MSY, the assessment re-
          mained conditional on the assumptions made. These assumptions included (i) estimates of his-
          torical shark catch, (ii) the relationship between catch rates and abundance, (iii) the initial state
          of the stock in 1971, and (iv) various life-history parameters. It was pointed out that the data used
          for the assessment did not meet the requirements for proper assessment (ICCAT, 2006), and fur-
          ther research and better-resolved data collection was highly recommended.
          In 2008, three models were used in stock assessment conducted by ICCAT (ICCAT, 2008 and
          references cited therein): a Bayesian surplus production model, an age-structured model that did
          not require catch data (catch-free model), and an age-structured production model. Results with
          the Bayesian surplus production model produced estimates of stock size well above MSY levels
          (1.5–2* BMSY), and estimated F to be very low (at FMSY or well below it). The carrying capacity of
          the stock was estimated so high that the increasing estimated catches (25–62 000 t over the time-
          series) generated very low F estimates. Sensitivity analyses showed that the stock size estimate
          was dependent on the weighting assigned to the Irish CPUE series. Equal weighting of this and
          the other series produced a stock size at around BMSY. Other sensitivity analyses indicated similar
          results to the base case run, with the stock well above MSY levels.
          The age-structured biomass model displayed different results with either a strong decrease in
          biomass throughout the series to about 30% of virgin levels, or a less pronounced decline. The
          prior for the virgin biomass assigned high values to a very small number of biomass values but
          also indicated that the range of plausible values of this parameter has a heavy tail. This is prob-
          ably because there is not enough information in the data to update the model and thus provide
          a narrower range of plausible values and thus provide a more precise estimate of the biomass of
          the stock.
          The age-structured model not requiring catch information estimated that F was higher than FMSY,
          but still low and that the current SSB estimated at around 83% of virgin levels.
          As a consequence of the results in 2008, ICCAT concluded that biomass was estimated to be
          above the level that would support MSY (ICCAT, 2008). These results agreed with earlier work
          (ICCAT, 2005). Stock status appeared to be close to unfished biomass levels and fishing mortality
          rates were well below those corresponding to the level at which MSY is reached. However, IC-
          CAT (2008) pointed out that the results were heavily dependent on the underlying assumptions.
          In particular, the choice of catch data to be used, the weighting of CPUE series and various life-
          history parameters used as input in the model. ICCAT was unable to conduct sensitivity analyses
          of the input data and assumptions (ICCAT, 2008).
          Owing to those weaknesses, no firm conclusions were drawn from the preliminary assessments
          conducted by ICCAT. ICCAT, 2008 stated that most models used predicted that this stock was
          not overfished but did not use these results to infer stock status and to provide management
          advice.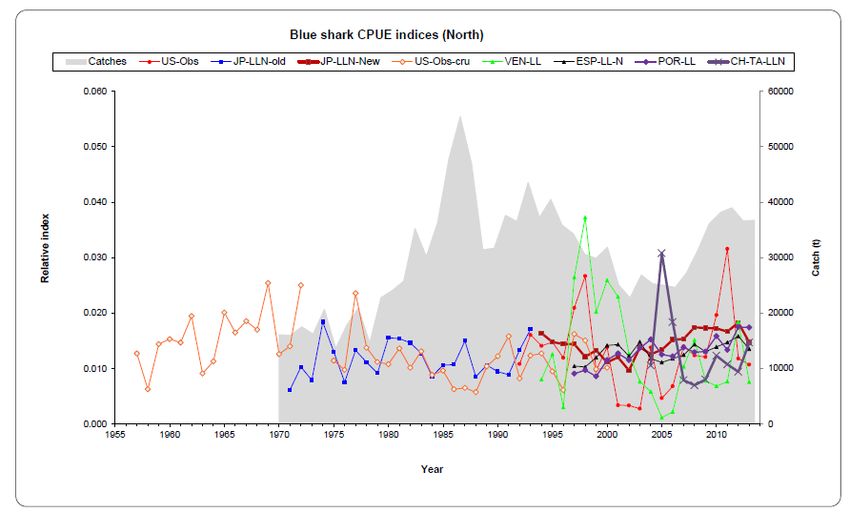
ICES   |   WGEF 2020                                                                                               |   239

           8.9         Stock assessment
           The North Atlantic Blue shark stock was assessed by ICCAT in 2015 using two different ap-
           proaches (see ICCAT, 2015 for more details): Bayesian Surplus Production Model (BSPM) and
           length-based age-structured models - Stock Synthesis (SS3).
           The Bayesian Surplus Production Models adjusted consistently estimated a posterior distribu-
           tion for r that was similar to the prior, and a posterior for K with a long right tail with high mean
           and CV (ICCAT, 2015). The estimated biomass trajectory stayed close to K for most runs, and the
           harvest rate estimate was low (Figure 8.8). The inclusion of a process error in the model did not
           improve the results. When each CPUE index was fitted separately, the posterior mean of K varied
           and the CVs were large, implying that none of the indices were particularly informative about
           the value of K.
           Several SS3 runs were undertaken. Run 4 and 6 (see details below) which utilized multiplication
           factors to reduce the input sample size assigned to length composition data in the model likeli-
           hood resulted in reasonable convergence diagnostics (described below).

           Model fits to CPUE and length composition data were similar for both runs. The fitting to abun-
           dance tracked trends well and were within most annual 95% confidence intervals for many abun-
           dance indices, including S3 (JPLL-N-e), S4 (JPLL-N-l), S6 (US-Obs-cru), S7 (POR-LL), and S9
           (ESP-LL-N) (Figures 8.9–8.10). Model fits tracked trends reasonably well for abundance index S2
           (US-Obs), but were often outside annual 95% confidence intervals. Predicted abundance was flat
           for abundance indices S8 (VEN-LL) and S10 (CTP-LL-N), probably because of large 95% confi-
           dence intervals for S8 and high inter-annual fluctuations in the early years for S10. Indices S1
           (US-Log) and S5 (IRL-Rec) were only included in the model for exploratory purposes, were not
           fit in the model likelihood (lambda = 0), and had no influence on model results or predicted val-
           ues. Model fits to length composition were reasonable for aggregate data (Figure 8.11).
           Both run 4 and run 6 resulted in sustainable spawning stock size and fishing mortality rates
           relative to maximum sustainable yield (figures 8.12–8.14). However, run 6 (the model run with
           relatively less weight applied to the length composition data in the model likelihood) resulted in
           a relatively more depleted stock size, compared to run 4.
           Both models suggested sustainable spawning stock size and fishing mortality rates relative to
           maximum sustainable yield. The model with a relatively lower sample size assigned to the length
           composition data resulted in a relatively more depleted stock size. However, model fits to length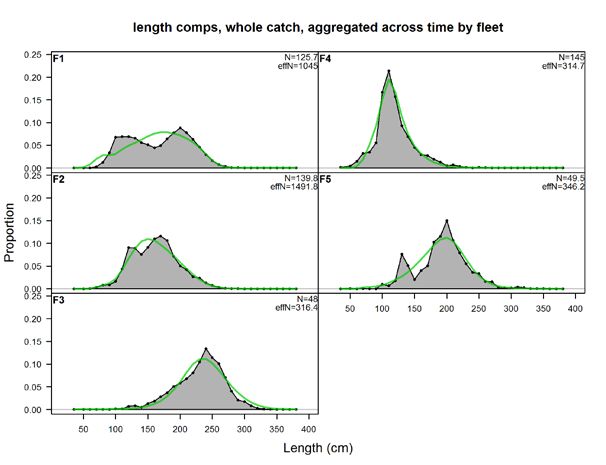
240   |   ICES SCIENTIFIC REPORTS 2:77                                                                             |   ICES

          composition were insufficient for annual length composition data, for which a bimodal pattern
          was evident. This is related to spatial segregation of the population. It was suggested that more
          work should be done to improve the fits to length composition data before using the model to
          provide management advice.

          8.10         Quality of assessments
          At the 2015 ICCAT assessment meeting, considerable progress was made on the integration of
          new data sources (in particular size data) and modelling approaches (in particular model struc-
          ture). Uncertainty in data inputs and model configuration was explored through sensitivity anal-
          yses, which revealed that results were sensitive to structural assumptions of the models. The
          production models showed a poor fit to the flat or increasing trends in the CPUE series combined
          with increasing catches. Overall, assessment results are uncertain (e.g. level of absolute abun-
          dance varied by an order of magnitude between models with different structures) and should be
          interpreted with caution.
          For the North Atlantic stock, scenarios with the BSPM estimated that the stock was not over-
          fished (B2013/BMSY = 1.50–1.96) and that overfishing was not occurring (F2013/FMSY = 0.04–0.50). Esti-
          mates obtained with SS3 varied more widely, but still predicted that the stock was not overfished
          (SSF2013/SSFMSY = 1.35–3.45) and that overfishing was not occurring (F 2013/FMSY = 0.15–0.75). Com-
          parison of results obtained in the assessment conducted in 2008 and the current assessment re-
          vealed that, despite significant differences between inputs and models used, stock status results
          did not change drastically (B2007/BMSY = 1.87–2.74 and F2007/FMSY = 0.13–0.17 for the 2008 base runs
          using the BSP and a catch-free age-structured production model).

          8.11         Reference points
          ICCAT uses F/FMSY and B/BMSY as reference points for stock status of this stock. These reference
          points are relative metrics rather than absolute values. The absolute values of B MSY and FMSY de-
          pend on model assumptions and results and are not presented by ICCAT for advisory purposes.

          8.12         Conservation considerations
          Within Europe the blue shark is listed as ‘Near Threatened’ by the IUCN (2014), whereas within
          the Mediterranean they are listed as ‘Critically endangered’ (2016).

          8.13         Management considerations
          Based on the scenarios and models explored, ICCAT considered the status of the North Atlantic
          stock as unlikely to be overfished nor subject to overfishing. However, due to the level of uncer-
          tainty, no specific management recommendations have been developed until 2017. Since 2017
          Recommendation 16–12 is in place which states: “If the average total catch of the North Atlantic
          blue shark in any consecutive two years from 2017 onward exceeds the average level observed
          during the period 2011–2015 (i.e. 39 102 t), the Commission shall review the implementation and
          effectiveness of these measures. Based on the review and the results of the next stock assessment
          scheduled for 2021 or at an earlier stage if enough information is provided to SCRS, the Com-
          mission shall consider introduction of additional measures.”
          A further update in 2019 in Recommendation 19-07 is a follows: “If in any year the total catches
          of the North Atlantic blue shark exceed the TAC, the Commission shall review the implementa-
ICES   |   WGEF 2020                                                                                                       |   241

           tion of these measures. Based on the review and the results of the next stock assessment sched-
           uled for 2021 or at an earlier stage if enough information is provided to the SCRS, the Commis-
           sion shall consider introduction of additional measures.” In this same Recommendation (19-07)
           catch limits for the EU, Japan and Morocco were set.
           Catch data are highly unreliable. Some CPUE series exist, and where data are available, show a
           relatively flat trend throughout the time-series, but with high variance. Further work is required
           to explain the trends and to better quantify removals from the stock.
           Catch data are considered incomplete, and underestimated. There have been unaccounted dis-
           cards and a substantial occurrence of finning over parts of the time series. Data reported to ICES,
           ICCAT and FAO can vary.
           For accurate stock assessments of pelagic sharks, better fishery data are required. In addition,
           reporting procedures must be strengthened so that all landings are reported, and that landings
           are reported to species level, rather than generic “shark nei” categories. In the absence of reliable
           landings and catch data, catch ratios and market information derived from observers can provide
           useful information for understanding blue shark fishery dynamics.
           For the North Atlantic stock, smaller sized blue sharks have been observed to dominate north of
           30ºN, while larger sized blue sharks dominated south of 30ºN. In order to be able to account for
           the differences in size composition of fish in different areas, future implementations of SS3
           should consider this spatial structure in the fleets. This will require estimating fleet and area
           specific CPUE indices, catch and size distributions. Ideally the model could also be separated by
           sex.
           Blue shark is considered to be one of the most productive sharks in the North Atlantic. As such,
           it can be expected to be more resilient to fishing pressure than other pelagic sharks. However,
           the high degree of susceptibility to longline fishing and the poor quality of the information avail-
           able to assess the stock is a cause for concern. Given the uncertainty of the results and that this
           species is a significant bycatch, especially in tuna and billfish fisheries, there is a need for contin-
           ued monitoring of the fisheries by observer and port sampling programmes. There are currently
           no fishery-independent data available for that part of the stock in the ICES area.

           8.14         References
           Aasen, O. 1966. Blahaien, Prionace glauca (Linnaeus, 1758). Fisken og Havet 1:1–15.

           Anon. 2015. Report of the 2015 blue shark data preparatory meeting. Tenerife, Spain, March 23 to 27: 33 p.

           Biery, L., and Pauly, D. 2012. A global review of species-specific shark fin to body mass ratios and relevant
               legislations. Journal of Fish Biology, 80: 1643–1677.

           Boggs, C. H. 1992. Depth, capture time and hooked longevity of longline-caught pelagic fish. Timing bites
               of fish with chips. Fishery Bulletin, 90:642−658.

           Boyd, J.M. 2008. The Japanese bluefin tuna longline fishery in the Northeast Atlantic: Report of an Irish
              observer. Irish Fisheries Investigations No.20/2008.

           Buencuerpo, V., Ríos, S., and Morón, J. 1998. Pelagic sharks associated with the swordfish, Xiphias gladius,
               fishery in the eastern North Atlantic Ocean and the Strait of Gibraltar. Fishery Bulletin, 96: 667–685.

           Campana, S. E., Joyce, W., and Manning, M. J. 2009. Bycatch and discard mortality in commercially caught
              blue sharks Prionace glauca assessed using archival satellite pop-up tags. Marine Ecology Progress Series,
              387: 241–253.

           Campana, S. E., Marks, L., Joyce, W. Kohler, N. 2005. Catch, by-catch, and indices of population status of
              blue shark (Prionace glauca) in the Canadian Atlantic. ICCAT Collective Volume of Scientific Papers,
              58(3): 891–934.
242 | ICES SCIENTIFIC REPORTS 2:77 | ICES
Campana, S., Gonzalez, P., Joyce, W. And Marks, L. 2002. Catch, bycatch and landings of blue shark (Pri-
onace glauca) in the Canadian Atlantic. Canadian Stock Assessment, Research Document, 2002/101, Ot-
tawa.
Castro, J. I. 1983. The sharks of North American waters. Texas A&M Univ. Press, College Station, TX, 180
pp.
Castro, J.A. and J. Mejuto. 1995. Reproductive parameters of blue shark, Prionace glauca, and other sharks
in the Gulf of Guinea. Marine Freshwater Research, 46: 967–973.
Clarke S. C., McAllister M. K., Milner-Gulland E. J., Kirkwood G. P., Michielsens C. G. J., Agnew D.J., Pikitch
E.K., Nakano H. And Shivji M.S. 2006. Global estimates of shark catches using trade records from com-
mercial markets. Ecology Letters, 9: 1115–1126.
Cortés, E. 1999. Standardized diet compositions and trophic levels of sharks. ICES Journal of Marine Science
56: 707–717.
Dai, X.J and Jiang, R.L. 2008. Shark bycatch observation in the ICCAT waters by Chinese longline observer
in 2007. ICCAT SCRS/2008156.
Díez G., Santurtún, M., Ruiz, J., Iriondo, A., Gonzalez. I. And Artetxe, I. 2007. The long line Basque fishery
on blue shark (Prionace glauca) in the Bay of Biscay (1998–2006). Working Document for ICES Working
Group on Elasmobranch Fishes, Galway. 22–28 June, 2007, 9 pp.
Diez, G. A., and J. E. Serafy. 2005. Longline-caught blue shark (Prionace glauca): factors affecting the numbers
available for live release. Fishery Bulletin 103: 720−724.
Ellis, J. R., McCully, S. R. and Poisson, F. 2014. A global review of elasmobranch discard survival studies
and implications in relation to the EU ‘discard ban’. Working Document to the ICES Working Group
on Elasmobranch Fishes, Lisbon, Portugal. June 2014. 48 pp.
Fitzmaurice, P, Green, P., Keirse, G., Kenny, M. And Clarke, M. 2005. Stock discrimination of blue shark,
based on Irish tagging data. ICCAT Collective Volume of Scientific Papers, 58(3): 1171–1178.
Francis, M. P., and Duffy, C. 2005. Length at maturity in three pelagic sharks (Lamna nasus, Isurus oxyrinchus,
and Prionace glauca) from New Zealand. Fishery Bulletin 103: 489–500.
Francis, M. P., L. H. Griggs and S. J. Baird. 2001. Pelagic shark bycatch in the New Zealand tuna longline
fishery. Mar. Freshwat. Res. 52:165−178.Francis, M. P. And Duffy, C. 2005. Length at maturity in three
pelagic sharks (Lamna nasus, Isurus oxyrinchus and Prionace glauca) from New Zealand. Fishery Bulletin,
103: 489–500.
García-Cortés, B. and J. Mejuto. 2002. Size–weight relationships of the swordfish (Xiphias gladius) and sev-
eral pelagic shark species caught in the Spanish surface longline fishery in the Atlantic, Indian and
Pacific Oceans. ICCAT Collective Volume of Scientific Papers, 54 (4): 1132–1149.
Green, P. 2007. Central Fisheries Board Tagging Programme 1970 to 2006. Working document to WGEF
2007 (PowerPoint display).
Hareide, N.R., J. Carlson, M. Clarke, S. Clarke, J. Ellis, S. Fordham, S. Fowler, M. Pinho, C. Raymakers, F.
Serena, B. Seret, and S. Polti. 2007. European Shark Fisheries: a preliminary investigation into fisheries,
conversion factors, trade products, markets and management measures. European Elasmobranch As-
sociation EEA 2007, 71 pp.
Hastings, A. (1993). Complex interactions between dispersal and dynamics: Lessons from coupled logistic
equations. Ecology, 74, 1362–1372.
Heessen, H. J. L. (Ed.) 2003. Development of elasmobranch assessments DELASS. Final report of DG Fish
Study Contract 99/055, 605 pp.
Henderson, A. C., Flannery, K. And Dunne, J. 2001. Observations on the biology and ecology of the blue
shark in the North-east Atlantic. Journal of Fish Biology, 58: 1347–1358.
Holmes, B. H., Steinke D. and Ward R. D. 2009. Identification of shark and ray fins using DNA barcoding.
Fisheries Research, 95: 280–288.ICES | WGEF 2020 | 243
Hueter, R. E. and. Simpfendorfer, C. 2008. Case study: Trends in blue shark abundance in the western North
Atlantic as determined by a fishery-independent survey. In: Sharks of the Open Ocean; M. D. Chami,
E. K. Pikitch and E. Babcock (eds.) 236–241.
ICCAT. 2005. Report of the 2004 Inter-sessional Meeting of the ICCAT Subcommittee on Bycatches: Shark
Stock Assessment. SCRS/2004/014.
ICCAT. 2006. Chapter 8.12 SHK-Sharks Report of the Standing Committee on Research and Statistics
(SCRS) ICCAT. PLE-014/2006 Madrid, Spain, October 2–6, 2006. 106–113.
ICCAT. 2008. Report of the 2008 shark stock assessments meeting. Madrid, Spain, 1–5 September, 2008.
SCRS/2008/017–SHK Assessment, 89 pp.
ICCAT. 2012. Chapter 4.1 Shortfin Mako Stock Assessment and Ecological Risk Assessment Meeting. Olhao,
Portugal June 11–18, 2012.
ICCAT. 2014. Inter-sessional meeting of the sharks species group. Piriapolis, Uruguay, March 10–14 2014;
72 pp. (www.iccat.int/Documents/Meetings/Docs/2014_SHK_INTER-SESS_REP.pdf).
ICCAT. 2015. Report of the 2015 ICCAT blue shark stock assessment session Oceanário de Lisboa, Lisboa,
Portugal July 27 to 31, 2015, 115 pp. (https://www.iccat.int/Documents/Meet-
ings/Docs/2015_BSH%20ASSESS_original.pdf).
Kohler N. E., Casey J. G. and Turner P. A. 1995. Length–weight relationships for 13 species of sharks from
the western North Atlantic. Fishery Bulletin, 93: 412–418.
Kohler N. E., Turner P. A., Hoey, J. J., Natanson, L. J., and Briggs, R. 2002. Tag and recapture data for three
pelagic shark species: blue shark (Prionace glauca), shortfin mako (Isurus oxyrinchus), and porbeagle
(Lamna nasus) in the North Atlantic Ocean. ICCAT Collective Volume of Scientific Papers, 54 (4): 1231–
1260.
Kohler, N. E., Casey, J. G. and Turner, P. A. 1998. NMFS cooperative shark tagging programme, 1962–1993:
An atlas of shark tag and recapture data. Marine Fisheries Review, 60: 86 pp.
MacNeil, M. A. and Campana, S. E. 2002. Comparison of whole and sectioned vertebrae for determining
the age of young blue shark (Prionace glauca). Journal of Northwest Atlantic Fishery Science, 30: 77–82.
Mejuto J. and García-Cortés B. 2004. Preliminary relationships between the wet fin weight and body weight
of some large pelagic sharks caught by the Spanish surface longline fleet. ICCAT, Collective Volume
of Scientific Papers, 56(1): 243–253.
Mejuto J. and García-Cortés B. 2005. Reproductive and distribution parameters of the blue shark Prionace
glauca, on the basis of on-board observations at sea in the Atlantic, Indian and Pacific Oceans. ICCAT
Collective Volume of Scientific Papers, 58(3): 951–973.
NMFS. 2006. Final Consolidated Atlantic Highly Migratory Species Fishery Management Plan. National
Oceanic and Atmospheric Administration, National Marine Fisheries Service, Office of Sustainable
Fisheries, Highly Migratory Species Management Division, Silver Spring, MD. Public Document. 1600
pp.
Oceana. 2008. Description of European Union surface longline fleet operating in the Atlantic Ocean and
compilation of detailed EuroStat data on shark catches by EU fleets in the Atlantic shark catches. IC-
CAT SCRS 2008/158.
Ovenden, J. R., Kashiwagi, T., Broderick, D., Giles, J., and Salini, J. 2009. The extent of population genetic
subdivision differs among four co-distributed shark species in the Indo-Australian archipelago. BMC
Evolutionary Biology, 9.
Palma, C., Ortiz, M., de Bruyn, P., Kell, L. and Pallares, P. 2012. Building a consolidated database to cross-
check ICCAT Task-I nominal catch, against EUROSTAT and FAO equivalent statisticS. ICCAT SCRS
2012/078.
Poisson, F., Gaertner, J.C., Taquet, M., Durbec, J.P., and Bigelow, K. 2010. Effects of lunar cycle and fishing
operations on longline-caught pelagic fish: fishing performance, capture time, and survival of fish.
Fishery Bulletin, 108:268–281.244 | ICES SCIENTIFIC REPORTS 2:77 | ICES
Pratt, H. L. 1979. Reproduction in the blue shark, Prionace glauca. Fishery Bulletin, 77: 445–470.
Prista, N., Fernandes, A.C., Maia, C., Moura, T. and Figuerido, I. 2014. Discards of elasmobranchs in the
Portuguese fisheries operating in ICES Division XIa: Bottom otter trawl, deep-water set longlines, set
gillnet and trammel net fisheries (2004–2013). Working document to ICES WGEF 2014.
Queiroz N, Humphries N.E., Noble L.R., Santos A. M, Sims D. W. 2010. Short-term movements and diving
behaviour of satellite-tracked blue sharks Prionace glauca in the northeastern Atlantic Ocean. Marine
Ecology Progress Series, 406: 265–279.
Santana-Garcon, J., Fordham, S. and Fowler, S. 2012. Blue shark Prionace glauca fin-to-carcass-mass ratios in
Spain and implications for finning ban enforcement. Journal of Fish Biology, 80: 1895–1903.
Santos, M. N., and Garcia, A. 2005. Factors for conversion of fin weight into round weight for the blue shark
(Prionace glauca). ICCAT Collective Volume of Scientific Papers, 58(3): 935–941.
SCRS, 2019. Report of the Standing Committee on Research and Statistics (SCRS), Madrid 30 September – 4
October 2019, ICCAT Commission, 459 pp.
Sebastian, H., Haye P. A. and Shivji M. S. 2008. Characterization of the pelagic shark-fin trade in north-
central Chile by genetic identification and trader surveys. Journal of Fish Biology, 73: 2293–2304.
Skomal, G. B. and L.J. Natanson. 2002. Age and growth of the blue shark (Prionace glauca) in the North
Atlantic Ocean. ICCAT Collective Volume of Scientific Papers, 54 (4): 1212–1230.
Skomal, G. B. and L.J. Natanson. 2003. Age and growth of the blue shark (Prionace glauca) in the North
Atlantic Ocean. Fishery Bulletin, 101:627–639.
Skomal, G.B. 1990. Age and growth of the blue shark, Prionace glauca, in the North Atlantic. Master’s Thesis.
University of Rhode Island, Kingston, RI. 82 pp.
Smith, S. E., Au, D. W. and Show, C. 1998. Intrinsic rebound potentials of 26 species of Pacific sharks. Marine
and Freshwater Research, 49: 663–78.
Stevens J.D., Bradford R.W., West, G.J. 2010. Satellite tagging of blue sharks (Prionace glauca) and other
pelagic sharks of eastern Australia: depth behaviour, temperature experience and movements. Marine
Biology, 157: 575–591.
Stevens, J. D. 1975. Vertebral rings as a means of age determination in the blue shark (Prionace glauca). Jour-
nal of the Marine Biological Association of the United Kingdom, 55: 657–665.
Stevens, J. D. 1976. First results of shark tagging in the North-east Atlantic, 1972–1975. Journal of the Marine
Biological Association of the United Kingdom, 56: 929–937.
Taguchi, M., King, J. R., Wetklo, M., Withler, R. E., and Yokawa, K. 2015. Population genetic structure and
demographic history of Pacific blue sharks (Prionace glauca) inferred from mitochondrial DNA anal-
ysis. Marine and Freshwater Research, 66, 267–275-
Veríssimo, A., Sampaio, Í., McDowell, J. R., Alexandrino, P., Mucientes, G., Queiroz, N., Silva, C., Jones,C.
S., and Noble, L. R., 2017. World without borders—genetic population structure of a highly migratory
marine predator, the blue shark (Prionace glauca). Ecology and Evolution. 1–14.ICES | WGEF 2020 | 245
Table 8.1. Blue shark in the North Atlantic. Landings (t) by country 1978–2018 from ICCAT Task I catch data (accessed June 2019). These are considered underestimates, especially prior to 1997.
Stock Country 1978 1979 1981 1982 1983 1984 1985 1986 1987 1988 1989 1990 1991 1992 1993 1994 1995 1996 1997 1998 1999
North Atlantic Belize
Brazil
Canada 320 147 968 978 680 774 1277 1702 1260 1494 528 831 612 547
Cape Verde +
China P.R.
Chinese Taipei
EU.Denmark 2 2 1 1 1 2 3 1 1
EU.España 24497 22504 21811
EU.France 4 12 9 8 14 39 50 67 91 79 130 187 276 322 350 266 278 213 163 399
EU.Ireland 66
EU.Netherlands
EU.Portugal 1387 2257 1583 5726 4669 4722 4843 2630 2440 2227
EU.United
1 + 12 1 +
Kingdom
FR.St Pierre et
Miquelon
Japan 1203 1145 618 489 340 357
Mexico +
Panama 9
Senegal
Trinidad and
Tobago
U.S.A. 204 605 107 341 1112 1400 776 751 829 1080 399 1816 601 641 987 391 447 317
UK.Bermuda 3 1 1 2 8
Korea Rep.
Namibia246 | ICES SCIENTIFIC REPORTS 2:77 | ICES
Stock Country 1978 1979 1981 1982 1983 1984 1985 1986 1987 1988 1989 1990 1991 1992 1993 1994 1995 1996 1997 1998 1999
South Africa
Uruguay
Venezuela
N.Atlantic
4 12 204 9 613 121 380 1482 1614 1835 1810 3028 4299 3536 9566 8084 8285 7258 29053 26510 25741
TotalTotal
Mediterranean EU.Cyprus
EU.España 146 59 20
EU.France
EU.Italy
EU.Malta 1 1 1 + + +
EU.Portugal 2
Japan 5 7 1 1
Med TOTAL + + + + + + + + + + + + + + + 5.581 8.376 1.768 147.95 60.856 20.445
N.ATL AND
4 12 204 9 613 121 380 1482 1614 1835 1810 3028 4299 3536 9566 8090 8293 7260 29201 26571 25761
MED TOTALICES | WGEF 2020 | 247
Table 8.1. Cont. Blue shark in the North Atlantic.
2000 2001 2002 2003 2004 2005 2006 2007 2008 2009 2010 2011 2012 2013 2014 2015 2016
TOTAL 40664 35800 32765 37928 36305 43072 43888 50464 53901 58842 65193 73050 63174 56848 69408 62012 66273
ATN 28174 21709 20066 22951 21742 22359 23217 26927 30723 35198 37178 38084 36786 37202 39881 39502 42029
ATS 12444 14043 12682 14967 14438 20642 20493 23487 23097 23459 27799 34926 26347 19545 29292 22172 23938
MED 45 47 17 11 125 72 178 50 81 185 216 40 42 100 235 85 79
Landings ATN Longline 27305 20699 19290 22880 21297 22167 23067 26810 30514 35031 36952 37777 36549 36882 39677 38777 41772
Other surf. 732 905 708 70 380 126 104 63 80 63 59 100 109 74 205 725 257
ATS Longline 12444 14042 12678 14961 14339 20638 20434 23417 22708 23453 27785 34531 25878 19375 27457 21355 23309
Other surf. 0 1 4 6 99 3 59 10 375 6 14 391 264 0 1835 818 629
MED Longline 44 47 17 10 43 71 83 48 81 18 50 40 41 68 190 84 78
Other surf. 1 1 1 0 81 0 95 2 1 167 165 0 0 32 45 1 2
Discards ATN Longline 137 105 68 0 63 66 45 53 129 102 167 205 127 246 122 124 87
Other surf. 0 0 0 0 1 0 0 0 1 1 1 2 1 0 + 0
ATS Longline 0 0 0 0 0 0 0 60 14 0 0 4 206 169 114 122 139
Other surf. 0 0 0 0 0 0 0 0 0 0 0 0 0 0 6 0
Landings ATN Barbados 9 6
Belize 0 0 0 0 0 0 0 0 0 114 461 1039 903 1216 4 6
Brazil 7 0 0 0 0 0 0 0 0 0 0 0 0 0 0 0
Canada 624 1162 836 346 965 1134 977 843 0 0 0 0 1 0 0 0
Cape Verde 0 0 0 0 0 0 0 0 0 0 0 0 0 0 0 0
China PR 0 185 104 148 0 0 0 367 109 88 53 109 98 327 1 27
Chinese Taipei 165 59 0 171 206 240 588 292 110 73 99 148 94 121 81 220 266
EU.Denmark 2 1 13 5 1 0 0 0 0 0 0 0 0 0 0 0
EU.Spain 24112 17362 15666 15975 17314 15006 15464 17038 20788 24465 26094 27988 28666 28562 25202 30078 29019
EU.France 395 207 221 57 106 120 99 167 119 84 122 115 31 216 129 259 352
EU.Ireland 31 66 11 2 0 0 0 0 0 0 0 1 3 2 1 0 0248 | ICES SCIENTIFIC REPORTS 2:77 | ICES
2000 2001 2002 2003 2004 2005 2006 2007 2008 2009 2010 2011 2012 2013 2014 2015 2016
EU.Netherlands 0 0 0 0 0 0 0 0 0 1 0 0 0 0 0 0
EU.Portugal 2081 2110 2265 5643 2025 4027 4338 5283 6167 6252 8261 6509 3768 3694 2913 3859 7819
EU.United Kingdom 12 9 6 4 6 5 3 6 6 96 8 10 8 10 10 12 17
FR.St Pierre et Miquelon 0 0 0 0 0 0 0 0 0 1 0 0 0 0 0 0
Japan 273 350 386 558 1035 1729 1434 1921 2531 2007 1763 1227 2437 1808 2034 4011 4239
Korea Rep. 0 0 0 0 0 0 0 0 0 0 0 537 299 327 0 10
Marocco 873 0
Mexico 0 6 0 0 0 0 0 0 0 0 0 0 0 0 0 0
Panama 0 0 0 0 0 0 254 892 613 1575 0 0 0 289 0 0
Senegal 0 0 456 0 0 0 0 43 134 255 56 0 5 12 13 3
St.Vincent and Grenadines 0 119
Suriname 0 0 0 0 0 0 0 0 0 0 0 0 181 281 0 0
Trinidad and Tobago 0 0 6 3 2 1 1 0 2 8 9 11 11 8 4 2
U.S.A. 291 39 0 0 7 2 2 1 8 4 9 65 56 32 31 30
UK.Bermuda 0 0 0 0 0 0 0 0 0 0 0 0 0 0 0 0
Venezuela 43 47 29 40 10 28 12 19 8 73 75 118 98 52 129 116
Discards ATN Candada 0 0
Chinese Taipei 0 0 0 0 0 0 0 0 0 0 0 0 21 14 9 5 16
Korea Rep. 0 0 0 0 0 0 0 0 0 0 0 0 0 0 19 27
U.S.A. 137 106 68 0 65 66 45 54 130 103 167 206 106 231 18 1
UK.Bermuda 0 0 0 0 0 0 0 0 0 0 0 0 0 0 82 43ICES | WGEF 2020 | 249
Table 8.1. Cont. Blue shark in the North Atlantic. Update for 2018 from SCRS (2019).
2017 2018
TOTAL 68011 68220
ATN 39675 33853
ATS 28232 34309
MED 105 58
Landings ATN Longline 38509 32654
Other surf. 1033 1086
ATS Longline 27522 33546
Other surf. 487 664
MED Longline 92 54
Other surf. 13 4
Discards ATN Longline 133 112
Other surf. 0 0
ATS Longline 218 99
Other surf. 5 0
Landings ATN Barbados 7 4
Belize 201 317
Brazil 0 0
Canada 0 0
Cape Verde 0 0
China PR 2 6
Chinese Taipei
EU.Denmark 0 0
EU.Spain 27316 21685
EU.France 124 94
EU.Ireland 0 0
EU.Netherlands 0
EU.Portugal 5664 5195
EU.United Kingdom 11 6
FR.St Pierre et Mi- 0
0
quelon
Japan 4460 4111
Korea Rep. 103 92
Marocco 1475 1644
Mexico 0 0
Panama 0 437
Senegal 4 1
St.Vincent and Gren- 0
adines
Suriname -
Trinidad and Tobago 2 0
U.S.A. 24 19250 | ICES SCIENTIFIC REPORTS 2:77 | ICES
2017 2018
UK.Bermuda 0 0
Venezuela 104
Discards ATN Candada 32 71
Chinese Taipei 34 31
Korea Rep. 29
U.S.A. 38 11
UK.Bermuda
Table 8.2. Blue shark in the North Atlantic. Length–weight relationships for blue shark from different populations.
Lengths in cm, and weights in kg unless specified in equation. WR = round weight; WD = dressed weight.
L (cm) W (kg) relationship Sex n Length range (cm) Source
WD = (8.04021 x 10⁻⁷) LF ^ 3.23189 C 354 75–250 (LF) García-Cortés and Mejuto, 2002
WR = (3.1841 x 10⁻⁶) LF ^ 3.1313 C 4529 Castro, 1983
WR = (3.92 x 10⁻⁶) LT ^ 3.41 Male 17 Stevens, 1975
WR = (3.184 x 10⁻⁷) LT ^ 3.20 Female 450 Stevens, 1975
WR = (3.2 x 10⁻⁶) LF ^ 3.128 C 720 Campana et al., 2005
WD = (1.7 x 10⁻⁶) LF ^ 3.205 C 382 Campana et al., 2005
Table 8.3(a). Blue shark in the North Atlantic. Length–length relationships for male, female blue shark and both sexes
combined from the NE Atlantic and Straits of Gibraltar (Buencuerpo et al., 1998). LS = standard length; LF = fork length; LT
= total length; LUC = upper caudal lobe length.
Females Males Combined
LF = 1.076 LS + 1.862 (n = 1043) LF = 1.080 LS + 1.552 (n = 1276) LF = 1.079 LS + 1.668 (n = 2319)
LT = 1.249 LS + 7.476 (n = 1043) LT = 1.272 LS + 4.466 (n = 1272) LT = 1.262 LS + 5.746 (n = 2315)
LUC = 0.219 LS + 4.861 (n = 1038) LUC = 0.316 LS + 2.191 (n = 1264) LUC = 0.306 LS + 3.288 (n = 2302)
LT = 1.158 LF + 5.678 (n = 1043) LT = 1.117 LF + 2.958 (n = 1272) LT = 1.167 LF + 4.133 (n = 2315)
Table 8.3(b). Blue shark in the North Atlantic. Length–length relationships for both sexes combined of blue shark from
various populations and sources.
Stock Relationship n Source
NW Atlantic LF = (0.8313) LT + 1.3908 572 Kohler et al., 1995
NE Atlantic LF = 0.8203 LT –1.061 Castro and Mejuto, 1995
NW Atlantic LF = –1.2 +0.842 LT 792 Campana et al., 2005
NW Atlantic LT = 3.8 + 1.17 LF 792 Campana et al., 2005
NW Atlantic LCF = 2.1 + 1.0 LSF 782 Campana et al., 2005
NW Atlantic LSF = –0.8 + 0.98 LCF 782 Campana et al., 2005
NW Atlantic LF = 23.4 + 3.50 LID 894 Campana et al., 2005
NW Atlantic LID = –4.3 + 0.273 LF 894 Campana et al., 2005ICES | WGEF 2020 | 251
Table 8.4. Blue shark in the North Atlantic. Indices of abundance for North and South Atlantic blue shark stocks. Source:
ICCAT (2015).252 | ICES SCIENTIFIC REPORTS 2:77 | ICES
Table 8.5. Blue shark in the North Atlantic. Coefficients of variation (CVs) for North and South Atlantic blue shark stocks.
Source: ICCAT (2015).ICES | WGEF 2020 | 253
Table 8.6. Blue shark in the North Atlantic. Von Bertalanffy growth parameters (L∞ in cm (L T), k in years–1, t0 in years)
from published studies.
Area L∞ k t0 Sex Study
North Atlantic 394 0.133 –0.801 Combined Aasen, 1966
North Atlantic 423 0,11 –1.035 Combined Stevens, 1975
NW Atlantic 343 0.16 –0.89 Males Skomal, 1990
NW Atlantic 375 0.15 –0.87 Females Skomal, 1990
NE Atlantic 377 0.12 –1.33 Combined Henderson et al., 2001
North Atlantic 282 0.18 –1.35 Males Skomal and Natanson, 2002
North Atlantic 310 0.13 –177 Females Skomal and Natanson, 2002
North Atlantic 287 0.17 –1.43 Combined Skomal and Natanson, 2003
MacNeil and Campana, 2002
NW Atlantic 300 0.68 –0.25 Combined
(whole ages)
MacNeil and Campana, 2002
NW Atlantic 302 0.58 –0.24 Combined
(section ages)
Table 8.7. Blue shark in the North Atlantic. Biological parameters for blue shark.
Parameter Values Sample Size Area Reference
Reproduction Placental viviparity various
Litter size 25–50 (30 average) various
Size-at-birth 30–50 cm LT various
Sex ratio (males: females) NE Atlantic García-Cortés and
1.5:1
Mejuto, 2002
1:1.44 NE Atlantic Henderson et al., 2001
1.33:1 NW Atlantic Kohler et al., 2002
1:2.13 NE Atlantic Kohler et al., 2002
NE Atlantic Mejuto and García-
1:1.07 801
(N. coast Spain) Cortés, 2005
NE Atlantic
1:0.9 158
(S. coast Spain)
1:0.38 2187 N central Atlantic
1:0.53 4550 NW Atlantic
Gestation period 9–12 months Campana et al., 2002
% of females revealing fe- NE Atlantic Mejuto and García-
0.74 415
cundation signs (N. coast Spain) Cortés, 2005
NE Atlantic
0 76
(S. coast Spain)
36.27 601 N central Atlantic
18.15 1573 NW Atlantic
% of pregnant females NE Atlantic Mejuto and García-
0 415
(N. coast Spain) Cortés, 2005
NE Atlantic
0 76
(S. coast Spain)
14.6 601 N central Atlantic254 | ICES SCIENTIFIC REPORTS 2:77 | ICES
Parameter Values Sample Size Area Reference
9.8 1573 NW Atlantic
Male age-at-maturity (years) 4–6 various
Female age-at-maturity various
5–7
(years)
Male length-at-maturity 180–280 cm (LF) NW Atlantic Campana et al., 2002
Francis and Duffy,
190–195 cm (LF)
2005
201 cm NW Atlantic Campana et al., 2005
(LF; 50% maturity)
Female length-at-maturity 220–320 cm (LF) Campana et al., 2002
Francis and Duffy,
170–190 cm (LF)
2005
> 185 cm (LF) Pratt, 1979
Longevity (years) Skomal and Natanson,
16–20
2003
Natural mortality (M) Worldwide Campana et al., 2005
0.23 (mean of various stud-
ies)
Productivity (R2m) estimate: 0.061 Pacific Smith et al., 1998
intrinsic rebound (assuming
no fecundity in-
crease)
Potential rate of increase per NW Atlantic Campana et al., 2005
43% (unfished)
year
Population doubling time TD 11.4 Pacific Smith et al., 1998
(years) (assuming
no fecundity in-
crease)
Trophic level 4.1 14 Cortés, 1999ICES | WGEF 2020 | 255
Figure 8.1. Blue shark in the North Atlantic. Preliminary estimates of landings of blue shark in the Atlantic for the four
main countries (Source: ICCAT Task I data, Accessed June 2018).
40000 FAO Blue shark catches in the North Atlantic
35000
30000
25000
20000
15000
10000
5000
0
1990
1991
1992
1993
1994
1995
1996
1997
1998
1999
2000
2001
2002
2003
2004
2005
2006
2007
2008
2009
2010
2011
2012
Atlantic, Eastern Central Atlantic, Northeast
Atlantic, Northwest Atlantic, Western Central
Mediterranean and Black Sea
Figure 8.2. Blue shark in the North Atlantic. Preliminary estimates of landings of blue shark in the Atlantic Ocean for the
different areas (Source: FAO, 2014).You can also read