The IMG/M data management and analysis system v.6.0: new tools and advanced capabilities
←
→
Page content transcription
If your browser does not render page correctly, please read the page content below
Published online 29 October 2020                                       Nucleic Acids Research, 2021, Vol. 49, Database issue D751–D763
                                                                                                                 doi: 10.1093/nar/gkaa939

The IMG/M data management and analysis system
v.6.0: new tools and advanced capabilities
I-Min A. Chen * , Ken Chu, Krishnaveni Palaniappan, Anna Ratner, Jinghua Huang,
Marcel Huntemann, Patrick Hajek, Stephan Ritter, Neha Varghese, Rekha Seshadri,
Simon Roux , Tanja Woyke, Emiley A. Eloe-Fadrosh, Natalia N. Ivanova* and
Nikos C. Kyrpides*
Department of Energy Joint Genome Institute, Lawrence Berkeley National Laboratory, 1 Cyclotron Road, Berkeley,

                                                                                                                                                 Downloaded from https://academic.oup.com/nar/article/49/D1/D751/5943189 by guest on 27 March 2021
CA 94720, USA

Received September 09, 2020; Revised October 04, 2020; Editorial Decision October 05, 2020; Accepted October 07, 2020

ABSTRACT                                                                          and analysis of sequence data in IMG. After the required
                                                                                  metadata is collected, the sequence data, which can come
The Integrated Microbial Genomes & Microbiomes                                    from one of the three main sources described below are
system (IMG/M: https://img.jgi.doe.gov/m/) contains                               processed by the IMG annotation pipeline v.5 (3). The
annotated isolate genome and metagenome datasets                                  status of the processing is tracked through the IMG
sequenced at the DOE’s Joint Genome Institute (JGI),                              submission system (https://img.jgi.doe.gov/submit/).
submitted by external users, or imported from public                                 The bulk of the sequence data included in IMG is gener-
sources such as NCBI. IMG v 6.0 includes advanced                                 ated by the JGI, including isolate and single-cell genomes,
search functions and a new tool for statistical analy-                            and microbiomes. NCBI is another major source of data
sis of mixed sets of genomes and metagenome bins.                                 for IMG, either from GenBank (4) which remains the main
The new IMG web user interface also has a new Help                                source of reference isolate genomes, prioritized based on
page with additional documentation and webinar tu-                                phylogenetic diversity, or from the Sequence Read Archive
                                                                                  (SRA) (5) for selected microbiomes, which are then as-
torials to help users better understand how to use
                                                                                  sembled and annotated by the JGI processing pipelines.
various IMG functions and tools for their research.                               The third source of IMG data is through external user
New datasets have been processed with the prokary-                                submissions of assembled sequences, including genomes,
otic annotation pipeline v.5, which includes extended                             metagenomes and metatranscriptomes generated by any
protein family assignments.                                                       sequencing technology. On a case-by-case basis, error-
                                                                                  corrected unassembled data generated by long-read se-
                                                                                  quencing technologies, such as PacBio (6) and ONT (7) can
INTRODUCTION                                                                      be also supported. Currently only assembled but unanno-
The Integrated Microbial Genomes & Microbiomes                                    tated prokaryotic genome and metagenome submissions are
(IMG/M: https://img.jgi.doe.gov/m/) is a user driven                              accepted through external submissions to IMG, with se-
data management resource that enables users worldwide                             quence data provided in FASTA format.
to analyze microbial genomes and metagenomes in a                                    De novo annotation of sequences submitted in FASTA
comparative context. IMG includes genomes of cultivated                           format starts with identification of encoded structural fea-
and uncultivated archaea, bacteria, eukarya, plasmids,                            tures such as protein-coding genes (CDSs) and non-coding
viruses, as well as genome fragments (genomic regions of                          RNAs, regulatory RNA features and binding motifs, as well
interest generated by targeted sequencing), metagenomes                           as CRISPR elements. Briefly, CRISPR elements are de-
and metatranscriptomes. First, sample, sequencing and                             tected using a modified CRT (8), tRNAs are predicted us-
analysis project information is registered in the Genomes                         ing tRNAscan-SE 2.0.6 (9), ribosomal RNAs, non-coding
OnLine Database (GOLD) (1), including environmental                               RNAs and RNA regulatory features are predicted using
metadata, sampling and sequencing technology, as well                             Rfam covariance models and Infernal tools (10–12), and
as data processing protocols. GOLD metadata follow the                            protein-coding genes are called by Prodigal v2.6.2 (13)
standards defined by the Genomics Standards Consortium                            and GeneMark (14). CDSs undergo functional annotation,
(2), and provide valuable context for downstream search                           which involves protein assignment to various protein and

* To
   whom correspondence should be addressed. Tel: +1 510 495 8437; Email: IMAChen@lbl.gov
Correspondence may also be addressed to Natalia N. Ivanova. Email: NNIvanova@lbl.gov
Correspondence may also be addressed to Nikos C. Kyrpides. Email: nckyrpides@lbl.gov

Published by Oxford University Press on behalf of Nucleic Acids Research 2020.
This work is written by (a) US Government employee(s) and is in the public domain in the US.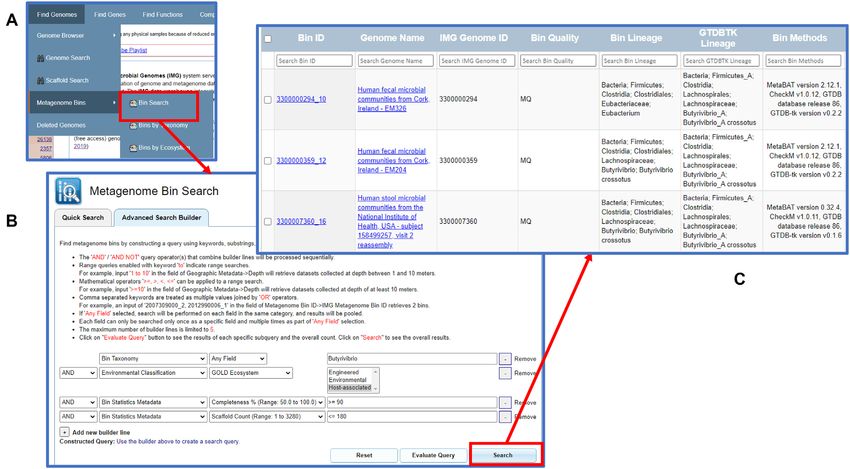
D752 Nucleic Acids Research, 2021, Vol. 49, Database issue

domain classifications, such as an updated 2014 version        on the JGI website (https://jgi.doe.gov/user-program-info/
of COGs (15), version 30 of Pfam-A (16), version 15.0          pmo-overview/policies/). The visibility settings for exter-
of TIGRFAM (17), version 1.75 of SUPERFAMILY (18),             nally submitted datasets follow the IMG Data Release pol-
version 01 06 2016 of SMART (19) and version 4.2.0 of          icy, which is described on the IMG submission website
CATH-FunFam (20). All these assignments are performed          (https://img.jgi.doe.gov/submit).
using a thread-optimized hmmsearch from the HMMER                 IMG has two specialized data marts, which include addi-
v3.1b2 package (21,22). Proteomes are also associated with     tional data and analysis tools: IMG/ABC (https://img.jgi.
KEGG Orthology (KO) terms (23) using LAST v1066 (24),          doe.gov/abc/) for biosynthetic gene clusters (BGCs) and sec-
with KEGG pathways based on KO term assignments and            ondary metabolites (29,30), and IMG/VR (https://img.jgi.
with MetaCyc pathways (25) based on gene annotations           doe.gov/vr/) for viral genomes (33). IMG/ABC v.5.0 was re-
with Enzyme Commission (EC) numbers derived from KO            leased in 2019 (29) to include new biosynthetic gene clusters
terms. Best LAST hits between CDSs and IMG reference           predicted by a new version of antiSMASH (antibiotics and
proteomes derived from high quality public genomes are         Secondary Metabolite Analysis SHell) v.5. This IMG/ABC

                                                                                                                                 Downloaded from https://academic.oup.com/nar/article/49/D1/D751/5943189 by guest on 27 March 2021
computed for placing the sequences in phylogenetic context     version also includes new analysis tools for BGCs and a new
through Phylogenetic Distribution of Best Hits tool.           viewer for users to browse antiSMASH results. IMG/VR
   In addition, CDSs encoded in isolate genomes undergo        has also been updated to include new viral data (33). The
prediction of signal peptides and transmembrane regions        two data marts provide access and custom analysis tools
using SignalP v4.1 (26) and TMHMM 2.0c (27) and Bidi-          for additional features (biosynthetic clusters and viruses, re-
rectional Best Hits (BBH) between newly loaded proteomes       spectively). They share the content of Analysis Carts and
and IMG reference proteomes are computed using LAST            Workspace with core IMG enabling navigation between
(24). Other computations available for genome sequences        data marts, so that the data of interest (genomes, genes,
include Average Nucleotide Identity (ANI) (28) distance        contigs) are found in the core IMG, the results are saved
matrix computations, and biosynthetic clusters (29,30), as     to the Carts and/or Workspace, and then additional analy-
previously described. The detailed descriptions of IMG         ses are performed in a specialized data mart. For instance,
processing of genomes and metagenomes or metatranscrip-        a user can compare groups of genomes, such as Butyrivib-
tomes is provided elsewhere (31).                              rio and Pseudobutyrivibrio spp. described below, in terms
   Due to the size of IMG data (currently over 65 bil-         of their biosynthetic gene cluster (BGC) profiles. These
lion genes), it is impossible to upgrade all genome and        Workspace sets created in IMG/MER can be loaded into
metagenome annotations to the latest version of the an-        the IMG/ABC Genome Cart and ‘Browse BCs by BGC
notation pipeline. Since pipeline differences can lead to      Type’ menu option can be used to view a heat map or tab-
annotation discrepancies, which may confound down-             ular display of the counts of various BGC types in these
stream analysis, users can find the detailed information       genomes.
about the pipeline used to annotate particular datasets on
the Genome/Metagenome Details pages of the respective          DATA ANALYSIS
datasets in the ‘IMG Release/Pipeline Version’ field. In ad-
                                                               IMG allows users to query and browse the data, and per-
dition, a user can request reannotation of a specific set of
                                                               form many analyses through the IMG User Interface (UI)
genomes or metagenomes, in which case they will be pro-
                                                               (https://img.jgi.doe.gov/m/), which continues to be aug-
cessed using the most recent version of the pipeline. The
                                                               mented and improved to support the increasing growth and
reannotated versions can replace older datasets or alterna-
                                                               new types of data. IMG’s data and analysis capabilities
tively both versions can be kept for comparison.
                                                               for microbial genomes were recently contrasted with other
                                                               analogous publicly available portals pointing to IMG’s
DATA CONTENT
                                                               unique strengths in terms of genomic tools, metadata-
Genomics data and microbiome samples                           driven search capabilities, large number and breadth of
                                                               genome data (34). Several improvements of the IMG UI
As of August 2020, IMG included 364.3 million genes
                                                               and additional new tools are discussed below.
from isolate genomes, which represents about 34% data
growth since July 2018 (32). There were also 64.66 billion
                                                               An updated Find Genes menu
metagenome genes, which represents a 19.7% growth over
the past 2 years. Table 1 shows the current IMG database       Find Genes menu, which was available since IMG’s incep-
content compared with the same database 2 years ago.           tion has been redeveloped to help users find genes and pro-
   The number of IMG submissions from external users           teins of interest based on their attributes and sequence simi-
also enjoys a healthy growth. As of August 2020, there         larity. Find Genes menu now includes a new Gene Search in-
are 20 940 external isolate genome submissions and 13          terface, which is similar to the previously developed Genome
708 external metagenome submissions. Among these, 22%          Search framework (32). The new Gene Search interface has
(4203 isolate genomes and 3471 microbiomes) were sub-          a tab for Quick Gene Search, which allows users to perform
mitted during the last two years. These numbers exclude        a simple keyword search with a limited set of parameters,
JGI-generated data, as well as public genomes and micro-       and an Advanced Search Builder tab, which enables con-
biomes imported from NCBI. All datasets imported from          struction of complicated queries using a variety of gene and
NCBI are publicly available to all IMG users as soon as        protein attributes.
they are loaded into IMG. JGI-generated data follow the           The Quick Search option allows users to find genes and
JGI Data Release and Usage policy, which is described          proteins of interest based on numerical identifiers, external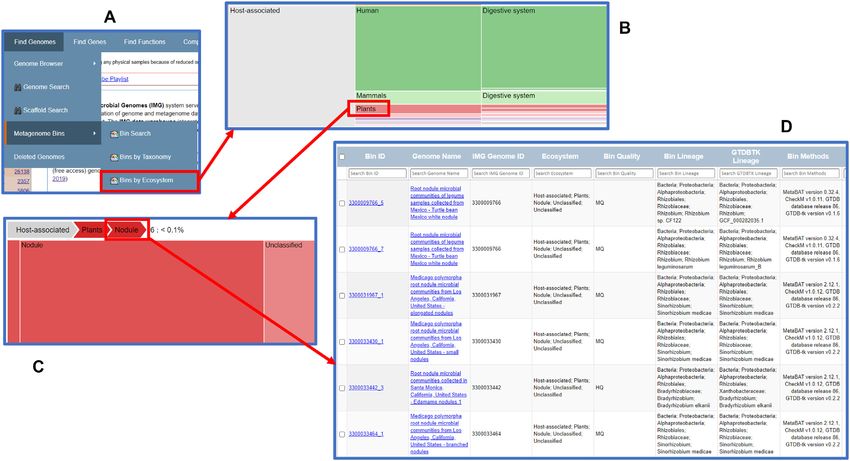
Nucleic Acids Research, 2021, Vol. 49, Database issue D753

Table 1. IMG dataset content comparison
                                  Total (8/2020)             Public (8/2020)               Total (7/2018)              Public (7/2018)
Archaea                                3011                         1967                       2453                         1762
Bacteria                              99 004                       83 768                     75 130                       63 736
Eukaryota                              746                           710                        733                         697
Virus                                 9 804                         8 392                      9 674                       8 388
Plasmid                                1208                         1188                       1215                         1190
Metagenome                            26 488                       21 813                     18 907                       13 232
Metatranscriptome                      6371                         6174                       4605                         2423
Cell enrichment                        2357                         2110                       1333                          801
Single particle sort                   5806                         5378                       3954                         3486
Metagenome bin                        85 565                       83 287                     78 253                       76 337

                                                                                                                                         Downloaded from https://academic.oup.com/nar/article/49/D1/D751/5943189 by guest on 27 March 2021
accessions or keywords in isolate genomes only (Figure 1A).            vanced Search Builder in the Gene Search interface and add
A user can provide one or more of IMG gene IDs, Gen-                   the following query conditions (Figure 2A):
bank accessions, or any of the protein family identifiers sup-
ported by IMG such as COG, Pfam ID, or Enzyme Com-                     • Gene Model Attributes – Locus Type: rRNA 16S
mission number. For example, typing in ‘pfam00698’ with                • Gene Statistics – Gene Amino Acid Length: > 500
the ‘Search by ID’ option will retrieve all proteins assigned
PF00698 (Acl trans 1) in isolate genomes (Figure 1B, C).                  and add all metagenomes in the Genome Cart to the set
‘Search by Name’ option enables keyword search on a vari-              of ‘Selected Genomes.’ The query retrieves 131 16S rRNA
ety of protein family names as well as gene symbols. For               genes (Figure 2B), which can be selected and added to Gene
instance, to find all proteins with a potential function of            Cart for further analysis. Gene Cart also allows export-
‘enolase’ in isolate genomes, a user can type ‘enolase’ and            ing selected gene sequences in a FASTA format. Similar to
select the ‘All Name fields.’ The results show all protein fam-        the Genome Search interface, Gene Search also records all
ilies that have ‘enolase’ in their names or definitions. Specif-       search history to allow users to view and to reuse their pre-
ically, there are three Pfams including two domains of eno-            vious queries (Figure 2C).
lase enzyme, pfam00113 (Enolase C - Enolase, C-terminal                   An updated sequence similarity search interface within
TIM barrel domain) and pfam03952 (Enolase N - Eno-                     the Find Genes menu is available under BLAST section (Fig-
lase, N-terminal domain), as well as an enolase-like protein           ure 1A). BLAST options now include genomes (all iso-
family described by pfam13378 (MR MLE C - Enolase C-                   lates or selected datasets, including metagenomes and meta-
terminal domain-like). After clicking on the count of pro-             transcriptomes), RNA, viruses and CRISPR spacers. The
tein families with the keywords a user can view the counts             options for BLAST against RNA collections have been
of proteins assigned to these families and navigate further            expanded to all types of rRNAs including 5S, 16S, 18S,
to individual proteins or select protein families of interest          23S, 28S, as well as other RNA genes. There are separate
to add them to Function Cart.                                          databases for isolate and metagenomic/metatranscriptomic
   As discussed above, the Quick Search runs on all iso-               RNA sequences. The display options of BLAST results have
late genomes, but not on metagenomes or metatranscrip-                 been expanded to include both raw results and a table with
tomes due to the large data size. Even though it is limited to         alignment details and selection capabilities. In addition, reg-
genomes only, for ubiquitous protein families it may still re-         istered IMG users have an option of submitting a computa-
trieve very large counts. To enable search in a specific set of        tion job from the Expert Review IMG site (https://img.jgi.
isolate genomes and/or metagenomes/metatranscriptomes,                 doe.gov/mer/), which allows them to search against larger
users can go to the Advanced Search Builder. This option               collections of IMG sequences (up to 500 genomes and/or
also enables search on a wide range of gene and protein at-            metagenomes in one search).
tributes and their combinations. As an example, consider
a query to retrieve all 16S rRNA genes longer than 500nt
in the freshwater sediment metagenomes in IMG. First a                 Metagenome bin browse and search
user would identify all freshwater sediment metagenomes in             Starting in 2018, IMG incorporates the results of auto-
IMG, which can be done using the Advanced Search Builder               mated metagenome binning using MetaBAT (35) along
in Genome Search and the following query conditions:                   with CheckM (36) and other quality assessment metrics for
                                                                       ensuring bin data quality (32). As of August 2020, IMG has
• Taxonomy – Domain: *Microbiome                                       a total of 85 565 (83 287 public) high-quality and medium-
• Study Dataset Names – Genome Name / Sample Name:                     quality metagenome bins. IMG’s v.5.0 UI had very few op-
  Freshwater                                                           tions for querying and analyzing metagenome bins, mainly
• Environmental Classification – GOLD Ecosystem Type:                  limited to browsing the Metagenome Statistics section of the
  Sediment                                                             Microbiome Details page, where Metagenome Bins counts
                                                                       for the bins found in this metagenome were displayed. IMG
  This Genome Search query retrieves a total of 22                     v.6.0 has additional visualization, searching and analysis
metagenomes, which can be selected and added to the                    tools for the bins.
Genome Cart. In order to find all 16S rRNA genes longer                   The new menu item Metagenome Bins under Find
than 500nt in these metagenomes a user would go to the Ad-             Genomes provides an option to search metagenome bins to-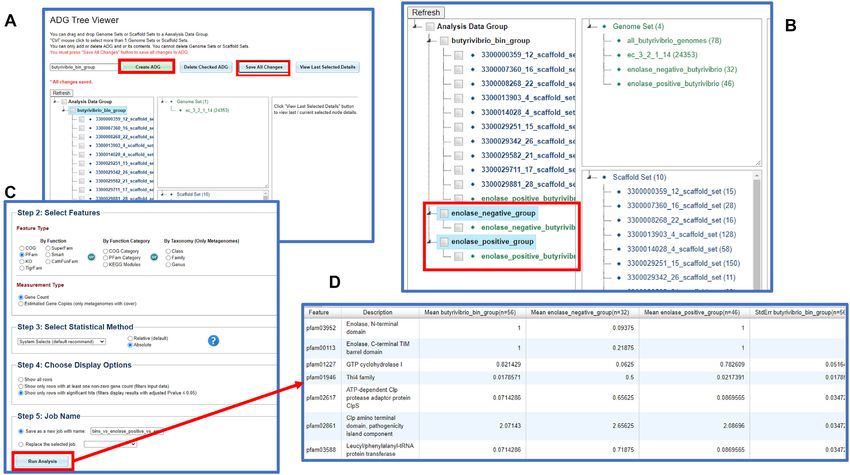
D754 Nucleic Acids Research, 2021, Vol. 49, Database issue
Downloaded from https://academic.oup.com/nar/article/49/D1/D751/5943189 by guest on 27 March 2021
Figure 1. Gene Search. (A) The Find Genes menu includes the new Gene Search function and BLAST. (B) Quick search allows users to search genes using
function IDs such as pfam00698 or using names. (C) Quick search result of pfam00698 shows the numbers of genes and genomes with this particular
function.
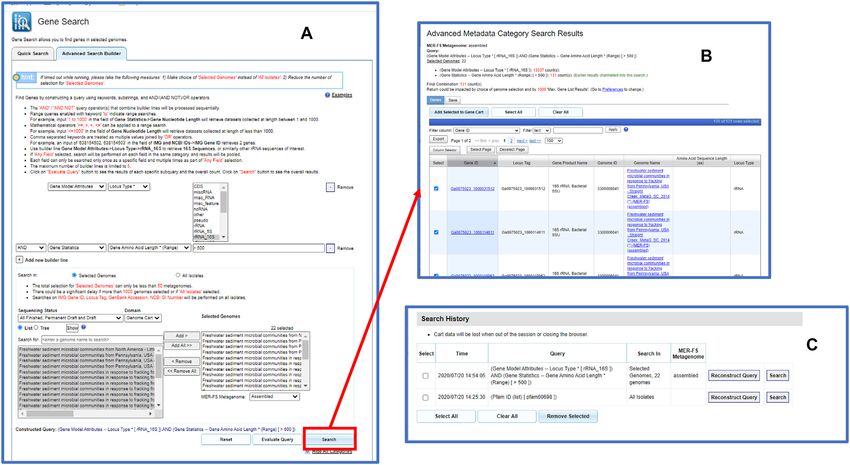
Figure 2. Advanced Search Builder option for the new Gene Search feature. (A) The advanced search option allows users to search all 16s rRNA genes
with length greater than 500nt in the freshwater sediment metagenomes previously saved in the Genome Cart. (B) The search result shows that there are
131 genes satisfying the search criteria. (C) Users can view and reuse previously constructed query conditions.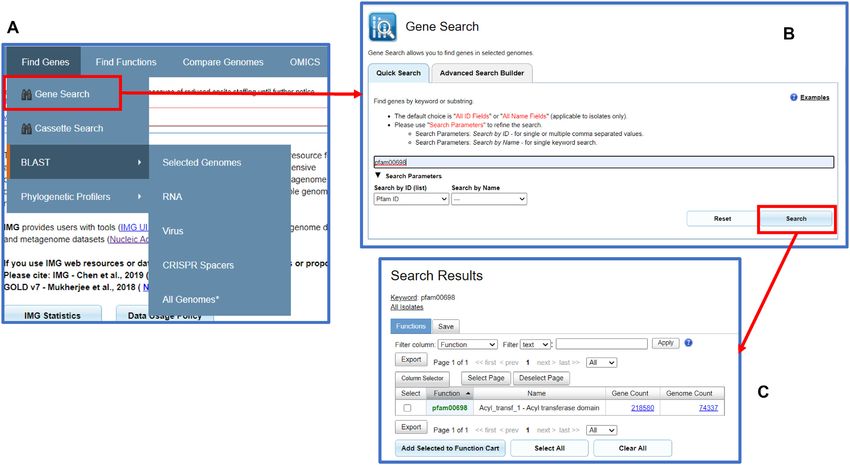
Nucleic Acids Research, 2021, Vol. 49, Database issue D755

gether with two browsing options to view the bins by taxon-        with the predicted lineage of Eubacteriaceae/Eubacterium.
omy or by ecosystem. Users can select the Bins by Ecosys-          Their combined length exceeds 10% of the total bin size,
tem option to view all metagenome bins organized by the            suggesting that CheckM may have underestimated the con-
GOLD ecosystem hierarchy (see Figure 3A). Users can ex-            tamination of this bin. Bins retrieved by the query can
pand the graphic display by clicking on any of the cells. For      be selected and saved to the Scaffold Cart as a combined
example, clicking on Plants ecosystem category will expand         set of scaffolds or to Workspace as copies of individual
the display to show all types and subtypes under this cate-        bins. Similar to other search interfaces Metagenome Bin
gory (Figure 3B). Clicking on a ‘breadcrumb’ (Figure 3C)           Search also saves query history to be reused in the future
opens a list of metagenome bins in this particular ecosys-         searches.
tem type or subtype. Figure 3D shows all metagenome bins
in the Nodule ecosystem type. Users can select any or all of
the six bins to add to the scaffold analysis cart. Registered      New analysis tool for comparison of mixed sets of genomes
IMG users can also save copies of the bins as Workspace            and metagenome bins

                                                                                                                                      Downloaded from https://academic.oup.com/nar/article/49/D1/D751/5943189 by guest on 27 March 2021
Scaffold Sets for further analysis and editing. The Bins by        Since each metagenome bin can be considered as an equiv-
Taxonomy option is similar to the Bins by Ecosystem op-            alent of a population genome (with the caveats of possi-
tion except that bins are organized based on the predicted         ble contamination and lower levels of completeness), a nat-
bin lineage based on the scaffold NCBI lineage assigned by         ural extension of IMG genome analysis tools is to allow
IMG.                                                               users to analyze metagenome bins against isolates (com-
   The Bin Search interface in the Metagenome Bins menu            paring ‘uncultivated’ versus ‘cultivated’) or together with
allows users to search bins based on a variety of attributes       isolate genomes (e.g., to potentially expand the phyloge-
across all or specific sets of metagenomes (Figure 4A). Sim-       netic diversity of available genomes to include uncultivated
ilar to the Genome Search and Gene Search interfaces, Bin          ones). Similarly, users may wish to compare the sets of scaf-
Search also has a Quick Search option and an Advanced              folds that they have created and saved in the Workspace to
Search Builder option. Quick Search allows users to search         metagenome bins or genomes. Some possible use cases in-
bins by entering metagenome bin IDs, IMG metagenome                clude comparison of bins from the same lineage, but from
IDs, or GOLD IDs. It also allows users to search bins based        different environments to find possible environment-driven
on their predicted NCBI or GTDB-Tk (37) lineages. For ex-          functional adaptations or comparison of bins from the same
ample, one can search all metagenome bins that are classi-         environment but from different lineages to identify poten-
fied as Cyanobacteria by entering the term in the keyword          tial functional complementarities.
search and selecting ‘NCBI Phylum’ in the Search by Name              For this purpose, a new Analysis Data Group (ADG) op-
dropdown list.                                                     tion under Workspace has been implemented. It allows reg-
   The Advanced Search Builder option allows users to find         istered IMG users to create analysis data groups, which may
bins based on a combination of environmental parameters,           include any or all of the following: (i) metagenome bins
their quality, predicted lineage, and other characteristics.       (scaffold sets created by selecting IMG metagenome bins
This capability is illustrated by an example of finding Bu-        and saved to Workspace as Scaffold Sets), (ii) user-created
tyrivibrio and Pseudobutyrivibrio bins with completeness of        scaffold sets (e.g., generated by searching metagenomes
at least 90% and in no more than 180 contigs or scaffolds,         of interest for scaffolds with specific lineage assignment,
which were found in host-associated metagenomes, such as           GC content or read depth), (iii) isolate genomes, (iv)
human fecal samples or animal rumen. Such query can be             metagenomes. Two viewers for analysis data groups are
constructed by a combination of the following four builder         available: simple list allows dataset selection for group cre-
lines (Figure 4B):                                                 ation, editing and deletion, while a graphical viewer pro-
                                                                   vides a tree view of various sets within each group. Af-
• Bin Taxonomy – All Field: Butyrivibrio                           ter creating two or more of such groups, users can then
• Environmental Classification – GOLD Ecosystem: Host-             perform statistical analysis of feature abundance using one
  associated                                                       of the five statistical methods provided. Features that can
• Bin Statistics Metadata – Completeness: > = 90                   be used in this comparison include protein families (COG,
• Bin Statistics Metadata – Scaffold Count: < = 180                Pfam, KEGG Orthology Terms, etc.) as well as func-
                                                                   tional groupings of protein families (COG Functional Cat-
   Eleven bins satisfying this search condition (Figure 4C)        egories, KEGG Modules) and taxonomic categories. Sta-
can be reviewed in the results table, which lists the predicted    tistical tests include Fisher’s Exact (38), Mann–Whitney
lineage of the bins, as well as other statistics, such as to-      (39) and Welch’s T-test (40) to compare two analysis data
tal size and number of scaffolds. In our example, predicted        groups, while Analysis of Variance or ANOVA (41) and
NCBI and GTDB-tk taxonomy for the majority of bins is              Kruskal-Wallis (42) can be used to compare 3–10 analysis
in agreement up to the family level (Lachnospiraceae). How-        data groups. In general, since the groups are heterogeneous,
ever, one bin (3300000294 10) has different family assign-         collecting the data to perform statistical analysis on feature
ments according to NCBI and GTDB-tk taxonomy (Eu-                  counts, as well as performing statistical testing itself, is too
bacteriaceae and Lachnospiraceae, respectively). Users can         computationally intensive to finish in real time. Therefore,
click on the bin ID to view the Bin Details page and inves-        this new analysis tool is only available as an on-demand
tigate the reason for this discrepancy, which turns out to         computation to the registered IMG users of the Expert Re-
be because of a large number of relatively short scaffolds         view IMG site (https://img.jgi.doe.gov/mer/).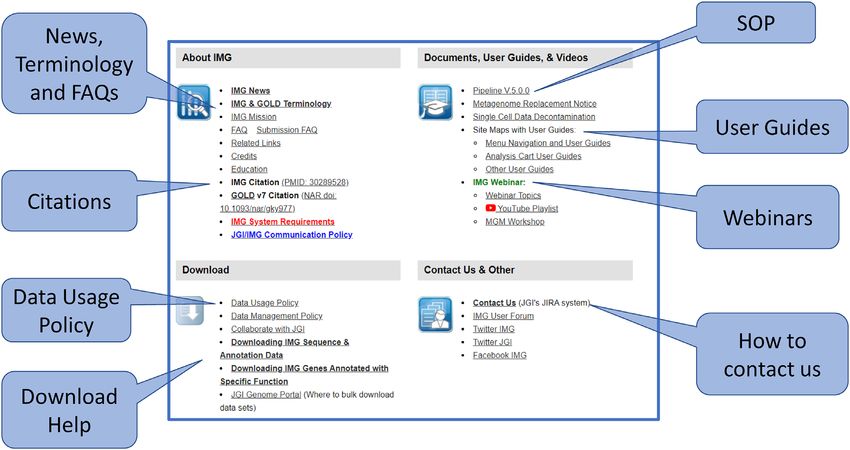
D756 Nucleic Acids Research, 2021, Vol. 49, Database issue

                                                                                                                                                              Downloaded from https://academic.oup.com/nar/article/49/D1/D751/5943189 by guest on 27 March 2021
Figure 3. Browse metagenome bins by Ecosystem. (A) From the Find Genomes menu item, users can select Metagenome Bins to find Bins by Ecosystem
browse option. (B) Users can click on any cell to expand. This example shows the expansion of Plants ecosystem category under Host-associated ecosystem.
(C) Users can click on the ‘breadcrumb’ to view the detailed list. (D) The list shows all metagenome bins in the Nodule ecosystem type. Users can select
any or all of the six bins to add to the scaffold analysis cart or workspace scaffold dataset.

Figure 4. Advanced Search Builder option of the new Metagenome Bin Search feature. (A) The Bin Search option in metagenome bin search allows users
to search all metagenome bins in the IMG database using quick search or advanced search. (B) Users can build a complex query to find Butyrivibrio and
Pseudobutyrivibrio bins with completeness of at least 90% and in no more than 180 contigs or scaffolds. Users can click the Search button to run the query.
(C) Result shows that 11 bins satisfying this query condition. (Only 3 rows are displayed here.)
Nucleic Acids Research, 2021, Vol. 49, Database issue D757
Running a functional comparison of isolate genomes and bins domain) and pfam03952 (Enolase N - Enolase, N-terminal
using the ADG tool domain); these can be found by running a Quick Search
query for protein families with ‘enolase’ in the name or def-
We illustrate how users can apply the new analysis feature
inition, as described in the section about Gene Search in-
by building upon the functional analysis of rumen micro-
terface. As reported in Seshadri et al. (43), some enolase-
biome members described in Seshadri et al. (43). This study,
negative genomes have enolase pseudogenes (shortened
which included only isolate genomes, found that many ru-
and/or fragmented genes). Therefore, we can find enolase-
minal isolates from the genera Butyrivibrio and Pseudobu-
positive genomes by searching for proteins that have both
tyrivibrio have lost an enolase gene, which encodes a ubiq-
Pfam domains and are nearly full length (400 amino acids
uitous glycolytic enzyme conserved in all domains of life.
or longer). We use Advanced Search Builder in Gene Search
In the example below, we attempt to identify the functional
interface selecting the genomes in our Genome Cart and the
signatures of enolase-positive and enolase-negative Butyriv-
following query conditions:
ibrio and Pseudobutyrivibrio strains by comparing these two
sets of isolate genomes to the taxonomically equivalent bins
Downloaded from https://academic.oup.com/nar/article/49/D1/D751/5943189 by guest on 27 March 2021
of comparable sequence quality. • Function IDs – Pfam ID: pfam00113, pfam03952
First, an analysis group is created consisting of Butyrivib- • Gene Statistics – Gene Amino Acid Length: > = 400
rio bins from host-associated metagenomes with complete-
ness of at least 90% and no more than 180 contigs. These
This query returns 46 genes in 46 genomes; there are
can be found by a query described in the section about Ad-
seven more genes with query Pfams that do not satisfy our
vanced Search Builder in Metagenome Bin Search (Figure
length criteria and are likely pseudogenes. We can create a
4). We will exclude the bin 3300000294 10 with discordant
set of enolase-positive genomes by selecting the genes in the
assignments by NCBI and GTDB-Tk taxonomy from the
results table, adding them to Gene Cart, then emptying the
analysis. All bins in the resulting set of ten are coming from
Genome Cart and adding the genomes of genes in the Gene
human stool samples; we can select them and save to the
Cart to Genome Cart. Of the two strains isolated from hu-
Workspace. The default names of scaffold sets consist of bin
man feces, only Butyrivibrio crossotus DSM 2876 falls into
ID with an added extension ‘scaffold set’. Next, we create
the enolase-positive group.
an Analysis Data Group by going to Workspace → Analysis
We can select the 46 genomes of enolase-positive strains
Data Group menu, clicking on ‘Create Group’ tab, selecting
in the Genome Cart and save them as a Workspace Genome
the bins in the list under ‘Step 2: Select Scaffold Sets’ menu
set ‘enolase positive butyrivibrio.’ To construct the set of
and saving the set under the name ‘butyrivibrio bin group.’
enolase-negative Butyrivibrio and Pseudobutyrivibrio spp.
Alternatively, users can also click the ADG Tree Viewer but-
we go to the ‘Set Operations’ tab in the Genome Set
ton to use drag and drop to create a new group. To use the
Workspace, which allows users to create new sets by finding
latter option, first enter the name ‘butyrivibrio bin group’ in
a union or intersection of sets or subtracting one set from
the blank text field, and then click the Create ADG button.
another. Subtracting ‘enolase positive butyrivibrio’ from
Then drag and drop all 10 bins to this newly created group
‘all butyrivibrio genomes’ results in a set of 32 genomes,
and finally click the Save All Changes button to save the
which we will save as ‘enolase negative butyrivibrio.’ In or-
change (Figure 5A).
der to perform a three-way statistical analysis of differen-
The isolate genomes of Butyrivibrio and Pseudobutyriv-
tial abundance of protein families, we construct two more
ibrio spp. are retrieved using an Advanced Search Builder in
analysis data groups by going to the Workspace → Analysis
Genome Search interface with the following query condi-
Data Group menu. Following a procedure described above
tions:
for bins, we create a new group ‘enolase positive group’
to include the genome set ‘enolase positive butyrivibrio’
• Taxonomy – Genus: butyrivibrio and another group ‘enolase negative group’ to include the
• Sequencing Assembly Annotation – Is Public: Yes genome set ‘enolase negative butyrivibrio’ (Figure 5B).
• Sequencing Assembly Annotation – GOLD Analysis After creating three analysis data groups, we click on
Project Type: Genome Analysis (Isolate) the ‘ADG Statistical Analysis Tool’ button, select the
• Sequencing Assembly Annotation – GOLD Sequencing groups butyrivibrio bin group, enolase positive group, and
Strategy: Whole Genome Sequencing enolase negative group, choose ‘Pfam’ as a feature type in
‘Function’ category, ‘Gene Count’ as measurement type,
This query returns 78 genomes (as of July 2020), which and ‘Absolute’ for the count type, and ‘Show only rows with
can be selected and added to Genome Cart. In ad- significant hits’ as display option. We will keep the default of
dition, we save them to Workspace as a Genome set ‘System select’ as a statistical method. After providing the
‘all butyrivibrio genomes.’ Users can review their metadata job name ‘bins vs enolase positive vs enolase negative,’ we
using Table Configuration options in Genome Cart and se- submit the job by clicking on the Run Analysis button (Fig-
lecting fields such as ‘Host name’ and ‘Isolation.’ Notably, ure 5C). In this analysis, bins are treated the same way as
only two strains with known host or isolation source (Bu- isolate genomes: the per-genome or per-bin counts of genes
tyrivibrio fibrisolvens 16/4 and Butyrivibrio crossotus DSM assigned to each Pfam are retrieved and the mean counts
2876) originate from human stool samples, while the re- of Pfams for each analysis data group are computed to-
mainder are from the forestomach of different ruminants. gether with their standard deviations. The statistical signif-
In order to identify enolase-positive genomes, we use icance is tested using the Kruskal–Wallis test, which is a
pfam00113 (Enolase C - Enolase, C-terminal TIM barrel non-parametric test for three or more groups. Benjamini–D758 Nucleic Acids Research, 2021, Vol. 49, Database issue
Downloaded from https://academic.oup.com/nar/article/49/D1/D751/5943189 by guest on 27 March 2021
Figure 5. New analysis tool for users to analyze genomes together with metagenome bins. (A) In the Workspace, a user can create new Analysis Data
Groups (ADGs) by dragging and dropping genome sets and scaffold sets. A new ADG butyrivibrio bin group is created to include all the 10 bu-
tyrivibrio metagenome bins. (B) Two additional ADGs enolase positive group and enolase negative group can be created to include genome sets eno-
lase positive butyrivibrio and enolase negative butyrivibrio, respectively. (C) The user can then select the three ADGs to analyze Pfam distribution using
the suggested analysis method, and submit the statistical analysis to be a computation job. (D) The user will receive an email notification when the job has
been completed. The result can be viewed following the link included in the email or from a corresponding link in the Workspace My Jobs list.
Hochberg method is used to control false discovery rate represented in ruminal genomes, while sporulation-specific
(FDR) control at 1%. Pfams are overrepresented in human isolates. Closer exam-
ination of the full results of statistical analysis shows that
the only isolate genome with sporulation Pfams is Butyriv-
Interpreting the results of a functional comparison of isolate
ibrio crossotus DSM 2876 originating from human stool.
genomes and bins
The presence of sporulation genes in this genome has been
The users receive an email notification upon the completion reported previously. Notably, Butyrivibrio crossotus DSM
of the analysis. They can also monitor the progress of their 2876 is also the only strain in the enolase-positive group
jobs by going to the Workspace → My Jobs menu. In the lacking cobalamin biosynthesis Pfams. This suggests that
IMG UI users can view the results limited to the top 1000 the presence of sporulation genes and the absence of cobal-
rows, subject to web browser limitations (Figure 5D). Users amin biosynthesis in metagenomic bins is not an artifact of
can also download the complete results for further analysis metagenome assembly or binning, but a feature of Butyriv-
including raw counts for all features in each genome, scaf- ibrio crossotus-like populations inhabiting the human gut.
fold set or metagenome in the analysis data groups. In our In addition, statistical analysis with the IMG ADG
three-way comparison, 1,084 Pfams have statistically signif- tool reveals statistically significant differences between
icant differences of mean counts between at least two anal- the enolase-positive and enolase-negative groups of iso-
ysis groups, examples of which are provided in Tables 2 and late genomes. They corroborate the findings of Seshadri
3. et al. (43) suggesting genome evolution via gene loss in
Some of the statistically significant differences between enolase-negative group. Enolase-negative genomes appear
Butyrivibrio bins on one side and isolate genomes on the to be in the process of losing enzymes participating in
other side include protein families involved in sporulation biosynthesis of coenzymes including NAD, thiamin and
(Table 2), which are present in Butyrivibrio bins, generated CoA (Table 3). However, these genomes show no signs of
from human stool metagenomes, but largely absent in iso- general genome reduction, such as accumulation of pseudo-
late genomes, which mostly originate from ruminal samples. genes, reduced average genome size or GC content. Further-
On the other hand, the enzymes from cobalamin biosynthe- more, there are Pfams that are significantly more abundant
sis pathway show the opposite distribution. These results re- in the enolase-negative group to the exclusion of enolase-
capitulate the findings of Seshadri et al. (43), which reported positive genomes and metagenome bins. While many of
that Pfams involved in cobalamin biosynthesis are over- these are proteins and domains of unknown function (Ta-Nucleic Acids Research, 2021, Vol. 49, Database issue D759
Table 2. Pfams with statistically significant differences between butyrivibrio bin group and two groups of isolate Butyrivibrio and Pseudobutyrivibrio
genomes. Adjusted P-value is Kruskal-Wallis test P-value with FDR controlled at 1% using Benjamini-Hochberg method
Mean count, butyriv- Mean count eno- Mean count, eno-
Pfam functional ibrio bin group lase positive group lase negative group Adjusted
Pfam ID Pfam definition category (n = 10) (n = 46) (n = 32) P-value
PF03418 Germination Sporulation 1 0.021739 0 6.91E-16
protease
PF03419 Sporulation factor Sporulation 1 0.021739 0 6.91E-16
SpoIIGA
PF05580 SpoIVB peptidase Sporulation 1 0.021739 0 6.91E-16
S55
PF06686 Stage III Sporulation 2 0.043478 0 6.91E-16
sporulation protein
AC/AD protein
family
Downloaded from https://academic.oup.com/nar/article/49/D1/D751/5943189 by guest on 27 March 2021
PF06898 Putative stage IV Sporulation 1.1 0.021739 0 6.91E-16
sporulation protein
YqfD
PF07451 Stage V sporulation Sporulation 1 0.021739 0 6.91E-16
protein AD
(SpoVAD)
PF07454 Stage II sporulation Sporulation 1 0.021739 0 6.91E-16
protein P (SpoIIP)
PF09547 Stage IV Sporulation 1.1 0.021739 0 6.91E-16
sporulation protein
A (spore IV A)
PF09548 Stage III Sporulation 1 0.021739 0 6.91E-16
sporulation protein
AB (spore III AB)
PF09551 Stage II sporulation Sporulation 1.2 0.021739 0 6.91E-16
protein R
(spore II R)
PF09578 Spore cortex Sporulation 1 0.021739 0 6.91E-16
protein YabQ
(Spore YabQ)
PF12116 Stage III Sporulation 1 0.021739 0 6.91E-16
sporulation protein
D
PF12685 SpoIIIAH-like Sporulation 1 0.021739 0 6.91E-16
protein
PF03862 SpoVA protein Sporulation 2 0.043478 0 7.68E-16
PF08486 Stage II sporulation Sporulation 1.9 0.043478 0 7.68E-16
protein
PF08769 Sporulation Sporulation 1.8 0.043478 0 8.61E-16
initiation factor
Spo0A C terminal
PF03323 Sporulation 0.9 0.021739 0 4.69E-14
Bacillus/Clostridium
GerA spore
germination protein
PF09581 Stage III Sporulation 1 0.021739 0 4.69E-14
sporulation protein
AF (Spore III AF)
PF11007 Spore coat Sporulation 0.9 0.021739 0 4.69E-14
associated protein
JA (CotJA)
PF12652 CotJB protein Sporulation 0.9 0.021739 0 4.69E-14
PF15714 Stage V sporulation Sporulation 0.9 0.021739 0 4.69E-14
protein T
C-terminal,
transcription factor
PF12164 Stage V sporulation Sporulation 0.8 0.021739 0 4.20E-12
protein AA
PF13782 Stage V sporulation Sporulation 0.8 0.021739 0 4.20E-12
protein AB
PF00269 Small, acid-soluble Sporulation 0.7 0.021739 0 3.13E-10
spore proteins,
alpha/beta type
PF02654 Cobalamin-5- Cobalamin 0 0.978261 0.90625 3.48E-12
phosphate biosynthesis
synthaseD760 Nucleic Acids Research, 2021, Vol. 49, Database issue
Table 2. Continued
Mean count, butyriv- Mean count eno- Mean count, eno-
Pfam functional ibrio bin group lase positive group lase negative group Adjusted
Pfam ID Pfam definition category (n = 10) (n = 46) (n = 32) P-value
PF07685 CobB/CobQ-like Cobalamin 0 1.913043 1.75 6.14E-10
glutamine biosynthesis
amidotransferase
domain
PF01890 Cobalamin Cobalamin 0 0.934783 0.84375 4.67E-09
synthesis G biosynthesis
C-terminus
PF02570 Precorrin-8X Cobalamin 0 0.934783 0.84375 4.67E-09
methylmutase biosynthesis
PF02571 Precorrin-6x Cobalamin 0 0.934783 0.84375 4.67E-09
Downloaded from https://academic.oup.com/nar/article/49/D1/D751/5943189 by guest on 27 March 2021
reductase biosynthesis
CbiJ/CobK
PF06180 Cobalt chelatase Cobalamin 0 0.934783 0.84375 4.67E-09
(CbiK) biosynthesis
PF11760 Cobalamin Cobalamin 0 0.934783 0.84375 4.67E-09
synthesis G biosynthesis
N-terminal
Table 3. Pfams with statistically significant differences between enolase-positive group and enolase-negative group. Adjusted P-value is Kruskal–Wallis
test P-value with FDR controlled at 1% using Benjamini-Hochberg method
Mean count,
Pfam butyrivib- Mean count eno- Mean count, eno-
functional rio bin group lase positive group lase negative group Adjusted
Pfam ID Pfam definition category (n = 10) (n = 46) (n = 32) P-value
PF03952 Enolase, N-terminal domain Glycolysis 1 1 0.09375 3.16E-15
PF00113 Enolase, C-terminal TIM barrel Glycolysis 1 1 0.21875 9.74E-12
domain
PF01227 GTP cyclohydrolase I Coenzyme 1 0.782609 0.0625 7.10E-10
biosynthesis
PF01729 Quinolinate phosphoribosyl Coenzyme 0 0.782609 0.125 1.38E-08
transferase, C-terminal domain biosynthesis
PF02445 Quinolinate synthetase A protein Coenzyme 0 0.782609 0.125 1.38E-08
biosynthesis
PF02749 Quinolinate phosphoribosyl Coenzyme 0 0.782609 0.125 1.38E-08
transferase, N-terminal domain biosynthesis
PF05690 Thiazole biosynthesis protein ThiG Coenzyme 0.4 0.76087 0.0625 1.37E-07
biosynthesis
PF06968 Biotin and Thiamin Synthesis Coenzyme 0.6 1.5 0.28125 2.27E-06
associated domain biosynthesis
PF02548 Ketopantoate Coenzyme 0.4 0.695652 0.125 2.71E-05
hydroxymethyltransferase biosynthesis
PF02569 Pantoate-beta-alanine ligase Coenzyme 0.4 0.695652 0.125 2.71E-05
biosynthesis
PF08818 Domain of unknown function Unknown 0 0.195652 0.9375 7.83E-07
(DU1801)
PF10670 Domain of unknown function Unknown 0 0.130435 0.6875 9.89E-06
(DUF4198)
PF04402 Protein of unknown function Unknown 0 0.217391 0.90625 3.29E-05
(DUF541)
PF03588 Leucyl/phenylalanyl-tRNA N-degron 0 0.086957 0.71875 4.18E-07
protein transferase proteolytic
pathway
PF02617 ATP-dependent Clp protease N-degron 0 0.086957 0.65625 4.61E-07
adaptor protein ClpS proteolytic
pathway
PF02861 Clp amino terminal domain, N-degron 2 2.086957 2.65625 4.61E-07
pathogenicity island component proteolytic
pathway
PF10431 C-terminal, D2-small domain, of N-degron 4.2 4.108696 4.65625 1.23E-05
ClpB protein proteolytic
pathwayNucleic Acids Research, 2021, Vol. 49, Database issue D761
Downloaded from https://academic.oup.com/nar/article/49/D1/D751/5943189 by guest on 27 March 2021
Figure 6. New Help Page: We have redesigned the IMG Help page to help users to better understand the system.
ble 3), one unexpected finding is higher abundance of the are two frequently asked questions (FAQ) links for general
componentry of an N-end rule pathway for degradation of information and for specific questions to data submission.
proteins with specific N-terminal amino acids (44) including Users of the IMG system are encouraged to cite IMG (32)
leucyl,phenylalanyl-tRNA-protein transferase, an adaptor and GOLD (1) in their publications.
protein ClpS and domains of ClpA chaperone (Table 3). The Documents, User Guides & Videos section includes
The functional significance of this observation is unclear, links to IMG user guides and our standard operating pro-
since bacteria have other proteolytic pathways (see (45) for cedure (SOP) for the annotation pipeline. We have recently
a review). conducted two IMG Webinar series from April to June
To summarize, the results of statistical analysis using the 2020, with a total of eight lectures. Links to the webinar
ADG tool highlight the differences between ruminal and recordings and relevant documents are available in this sec-
human populations and isolates of Butyrivibrio and Pseu- tion too.
dobutyrivibrio spp., point to their diverging evolutionary Many users are interested in downloading data from
trajectories and suggest possible avenues for experimental IMG to perform their own studies or analysis. The Down-
studies. Combined with other IMG tools it provides a pow- load section includes the JGI data usage policy that needs to
erful framework for genomic and metagenomic data ex- be followed by all users. We have also added a couple of new
ploration. A webinar recording featuring the IMG statis- user guides to show how users can download certain data
tical analysis tool is available in the Youtube playlist with a from IMG. The ‘Downloading IMG Sequence & Annota-
link from the IMG Help page (https://img.jgi.doe.gov/help. tion Data’ guide shows how to download a large amount
html). of genomes and metagenomes from the JGI Genome Por-
tal. The ‘Downloading IMG Genes Annotated with Specific
IMG help and tutorials Function’ guide shows how to download all IMG isolate
and metagenome genes annotated with a specific function
IMG currently has over 22 000 registered users from 109 (e.g., Enzyme EC:3.2.1.14).
countries. Many users are from academic institutions all IMG users can submit bug reports or questions to the
over the world, which are also using IMG in their curricu- JGI tracking system through the Contacts Us link in the
lum. Beginner users who need to learn how to perform com- Contact Us & Other section. This section also includes ad-
parative analysis on genome and metagenomes, often strug- ditional IMG social media links.
gle to learn how to use the IMG system due to the complex-
ity of data types and the tools we have provided. To fur-
CONCLUDING REMARKS AND FUTURE PLANS
ther support these users, we have redesigned the IMG Help
page to add more user guides and webinar recordings. The IMG continues to experience exponential data growth over
new Help page is divided into four sections: (i) About IMG, the years. The growth is sustained both with regard to the
(ii) Documents, User Guides & Videos, (iii) Download, (iv) number of datasets being added into IMG and the types of
Contact Us & Other (see Figure 6). new data (e.g., metagenome bins) being supported. As a re-
The About IMG section lists our mission, policy and sys- sult, IMG constantly faces a challenge of processing, stor-
tem requirements. We have added a new IMG & GOLD ing and querying a large amount of diverse data to serve
Terminology guide to help users understand the special ter- the users with various research interests, analysis needs, and
minologies and keywords used in IMG and GOLD. There level of bioinformatics experience. In order to support thisD762 Nucleic Acids Research, 2021, Vol. 49, Database issue
growth, we will continue improving the annotation pipeline 3. Clum,A., Huntemann,M., Foster,B., Foster,B., Roux,R., Hajek,P.,
(including the update of the reference databases), and ex- Varghese,N., Mukherjee,S., Reddy,T.B.K., Daum,C. et al. (2020) The
DOE-JGI metagenome analysis Workflow. bioRxiv doi:
panding the data model and UI for analysis of metatran- https://doi.org/10.1101/2020.09.30.320929, 02 October 2020, preprint:
scriptomic datasets in IMG. not peer reviewed.
With the rapid data growth, there is also a need to pro- 4. Benson,D.A., Cavanaugh,M., Clark,K., Karsch-Mizrachi,I., Ostell,J.,
vide more efficient and more diverse analysis tools in IMG. Pruitt,K.D. and Sayers,E.W. (2018) GenBank. Nucleic Acids Res., 46,
Users also request better visualization tools for data analy- D41–D47.
5. Leinonen,R., Sugawara,H. and Shumway,M. (2010) The Sequence
sis. Even though we have released a new analysis tool that Read Archive. Nucleic Acids Res., 39, D19–D21.
allows users to analyze genomes together with metagenome 6. Rhoads,A. and Au,K.F. (2015) PacBio sequencing and its
bins, many other tools in IMG (such as synteny viewer and applications. Genomics Proteomics Bioinformatics, 13, 278–289.
other tools in the Compare Genomes) are still limited to 7. Nobuaki,K. and Kazuharu,A. (2019). Nanopore sequencing: review
of potential applications in functional genomics. Dev. Growth Differ.,
genomes and metagenomes only. We are currently in the 61, 316–326.
process of systematically reviewing all existing comparative 8. Bland,C., Ramsey,T.L., Sabree,F., Lowe,M., Brown,K.,
Downloaded from https://academic.oup.com/nar/article/49/D1/D751/5943189 by guest on 27 March 2021
analysis tools in IMG to determine how we can provide Kyrpides,N.C. and Hugenholtz,P. (2007) CRISPR Recognition Tool
the necessary improvements. IMG is also forming collab- (CRT): a tool for automatic detection of clustered regularly
orations with KBase (46) and National Microbiome Data interspaced palindromic repeats. BMC Bioinformatics, 8, 209.
9. Chan,P.P., Lin,B., Mak,A.J. and Lowe,T.M. (2019) tRNAscan-SE
Collaborative (NMDC) (47) for co-development of analy- 2.0: improved detection and functional classification of transfer RNA
sis tools and user interface. genes. bioRxiv doi: https://doi.org/10.1101/614032, 30 April 2019,
IMG is currently accepting genome submissions in preprint: not peer reviewed.
FASTA format only. An extension of the IMG annotation 10. Nawrocki,E.P. and Eddy,S.R. (2013) Infernal 1.1: 100-fold Faster
RNA Homology Searches. Bioinformatics, 29, 2933–2935
pipeline to enable submission of annotated genomes in gff 11. Griffiths-Jones,S., Moxon,S., Marshall,M., Khanna,A., Eddy,S.R.
(General Feature Format) format is under development. and Bateman,A. (2015) Rfam: annotating non-coding RNAs in
This will allow loading of annotated eukaryotic genomes, complete genomes. Nucleic Acids Res., 33, D121–D124.
as well as prokaryotic genomes with manual user annota- 12. Nawrocki,E.P., Kolbe,D.L. and Eddy,S.R. (2009) Infernal 1.0:
tions, such as corrected coordinates for the frameshifted inference of RNA alignments. Bioinformatics, 25, 1335–1337.
13. Hyatt,D., Chen,G.L., Locascio,P.F., Land,M.L., Larimer,F.W. and
genes and potentially other predicted and experimentally Hauser,L.J. (2010) Prodigal: prokaryotic gene recognition and
identified features. The IMG functional annotations in this translation initiation site identification. BMC Bioinformatics, 11, 119.
case will still be generated in addition to the ones available 14. Lomsadze,A., Gemayel,K., Tang,S. and Borodovsky,M. (2018)
externally. Modeling leaderless transcription and atypical genes results in more
accurate gene prediction in prokaryotes. Genome Res., 28, 1079–1089.
Due to the complexity of the IMG system, we are also 15. Galperin,M.Y., Makarova,K.S., Wolf,Y.I. and Koonin,E.V. (2015)
paying more attention to the usability issues. We have con- Expanded microbial genome coverage and improved protein family
ducted a few studies through user surveys and solicited feed- annotation in the COG database. Nucleic Acids Res., 43, D261–D269.
back to improve the help page and the user guides. The IMG 16. El-Gebali,S., Mistry,J., Bateman,A., Eddy,S.R., Luciani,A.,
webinar series we conducted from April to June 2020 have Potter,S.C., Qureshi,M., Richardson,L.J., Salazar,G.A., Smart,A.
et al. (2018) The Pfam protein families database in 2019. Nucleic
enjoyed great success with our users. This will remain an Acids Res., 47, D427–D432.
area for improvements in the foreseeable future. 17. Haft,D.H., Selengut,J.D., Richter,R.A., Harkins,D., Basu,M.K. and
Beck,E. (2013) TIGRFAMs and genome properties in 2013. Nucleic
Acids Res., 41, D387–D395.
FUNDING 18. Pandurangan,A.O., Stahlhacke,J., Oates,M.E., Smithers,B. and
U.S. Department of Energy Joint Genome Institute, a DOE Gough,J. (2019) The SUPERFAMILY 2.0 database: a significant
proteome update and a new webserver. Nucleic Acids Res., 47,
Office of Science User Facility, is supported by the Office D490–D494.
of Science of the U.S. Department of Energy [DE-AC02- 19. Letunic,I. and Bork,P. (2018) 20 years of the SMART protein domain
05CH11231]; National Energy Research Scientific Comput- annotation resource, Nucleic Acids Res., 46, D493–D496.
ing Center, which is supported by the Office of Science of 20. Sillitoe,I., Dawson,N., Lewis,T.E., Das,S., Lees,J.G., Ashford,P.,
the U.S. Department of Energy. Funding for open access Tolulope,A., Scholes,H.M., Senatorov,I., Bujan,A. et al. (2019)
CATH: expanding the horizons of structure-based functional
charge: U.S. Department of Energy Joint Genome Insti- annotations for genome sequences. Nucleic Acids Res., 47,
tute, a DOE Office of Science User Facility, is supported D280–D284.
by the Office of Science of the U.S. Department of Energy 21. Potter,S.C., Luciani,A., Eddy,S.R., Park,Y., Lopez,R. and Finn,R.D.
[DE-AC02-05CH11231]; National Energy Research Scien- (2018) HMMER web server: 2018 update. Nucleic Acids Res., 46,
W200–W204.
tific Computing Center, which is supported by the Office of 22. Arndt,W. (2018) Modifying HMMER3 to run efficiently on the Cori
Science of the U.S. Department of Energy. supercomputer using OpenMP tasking. In: IEEE International
Conflict of interest statement. None declared. Parallel and Distributed Processing Symposium Workshops
(IPDPSW). pp. 239–246.
23. Kanehisa,M., Furumichi,M., Tanabe,M., Sato,Y. and Morishima,K.
REFERENCES (2017) KEGG: new perspectives on genomes, pathways, diseases and
1. Mukherjee,S., Stamatis,D., Bertsch,J., Ovchinnikova,G., Katta,H.Y., drugs. Nucleic Acids Res., 45, D353–D361.
Mojica,A., Chen,I.A., Kyrpides,N.C. and Reddy,T.B.K. (2018) 24. Kielbasa,S.M., Wan,R., Sato,K., Horton,P. and Frith,M.C. (2011)
Genomes OnLine Database (GOLD) v.7: updates and new features. Adaptive seeds tame genomic sequence comparison. Genome Res., 21,
Nucleic Acids Res., 47, D649–D659. 487–493.
2. Field,D., Sterk,P., Kottmann,R., Wim De Smet,J., Amaral-Zettler,L., 25. Caspi,R., Billington,R., Ferrer,L., Foerster,H., Fulcher,C.A.,
Cochrane,G., Cole,J.R., Davies,N., Dawyndt,P., Garrity,GM. et al. Keseler,I.M., Kothari,A., Krummenacker,M., Latendresse,M.,
(2014) Genomic standards consortium projects. Stand Genomic Sci., Mueller,L.A. et al. (2016) The MetaCyc database of metabolic
9, 599–601.Nucleic Acids Research, 2021, Vol. 49, Database issue D763
pathways and enzymes and the BioCyc collection of 35. Kang,D.D., Froula,J., Egan,R. and Wang,Z. (2015) MetaBAT, an
pathway/genome databases. Nucleic Acids Res., 44, D471–D480. efficient tool for accurately reconstructing single genomes from
26. Emanuelsson,O., Brunak,S., von Heijne,G. and Nielsen,H. (2007) complex microbial communities. PeerJ, 3, e1165.
Locating proteins in the cell using TargetP, SignalP, and related tools. 36. Parks,D.H., Imelfort,M., Skennerton,C.T., Hugenholtz,P. and
Nat. Protoc., 2, 953–971. Tyson,G.W. (2015) CheckM: assessing the quality of microbial
27. Moller,S., Croning,M.D.R. and Apweiler,R. (2001) Evaluation of genomes recovered from isolates, single cells, and metagenomes.
methods for the prediction of membrane spanning regions. Genome Res., 25, 1043–1055.
Bioinformatics, 17, 646–653. 37. Chaumeil,P.A., Mussig,A.J., Hugenholtz,P. and Parks,D.H. (2020)
28. Varghese,N.J., Mukherjee,S., Ivanova,N., Konstantinidis,K.T., GTDB-Tk: a tool kit to classify genomes with the Genome
Mavrommatis,K., Kyrpides,N.C. and Pati,A. (2015) Microbial species Taxonomy Database. Bioinformatics, 36, 1925–1927.
delineation using whole genome sequences, Nucleic Acids Res., 43, 38. Fisher,R.A. (1956) Mathematics of a Lady Tasting Tea. In:
6761–6771. Newman,J.R. (ed). The World of Mathematics. Vol. 3. Courier Dover
29. Palaniappan,K., Chen,I.A., Chu,K., Ratner,A., Seshadri,R., Publications.
Kyrpides,N.C., Ivanova,N.N. and Mouncey,N.J. (2020) IMG-ABC 39. Mann,H.B. and Whitney,D.R. (1947) On a test of whether one of two
v.5.0: an update to the IMG/Atlas of Biosynthetic Gene Clusters random variables is stochastically larger than the other. Ann. Math.
Knowledgebase. Nucleic Acids Res., 48, D422–D430. Stat., 18, 50–60.
Downloaded from https://academic.oup.com/nar/article/49/D1/D751/5943189 by guest on 27 March 2021
30. Hadjithomas,M., Chen,I.A., Chu,K., Huang,J., Ratner,A., 40. Welch,B.L. (1947) The generalization of Student’s problem when
Palaniappan,K., Andersen,E., Markowitz,V., Kyrpides,N.C. and several different population variances are involved. Biometrika, 34,
Ivanova,N.N. (2017) IMG-ABC: new features for bacterial secondary 28–35.
metabolism analysis and targeted biosynthetic gene cluster discovery 41. Fisher,R.A. (1921) On the probable error of a coefficient of
in thousands of microbial genomes. Nucleic Acids Res., 45, correlation deduced from a small sample. Metron, 1, 3–32.
D560–D565. 42. Field,A. (2009) In: Discovering Statistics using SPSS. Sage
31. Huntemann,M., Ivanova,N.N., Mavromatis,K., Tripp,H.J., Publications, Inc.
Paez-Espino,D., Palaniappan,K., Szeto,E., Pillay,M., Chen,I.A., 43. Seshadri,R., Leahy,S.C., Attwood,G.T., Teh,K.H., Lambie,S.C.,
Pati,A. et al. (2015) The standard operating procedure of the Cookson,A.L., Eloe-Fadrosh,E.A., Pavlopoulos,G.A.,
DOE-JGI microbial genome annotation pipeline (MGAP v. 4). Hadjithomas,M., Varghese,N.J. et al. (2018) Cultivation and
Stand. Genomic Sci., 10, 86. sequencing of rumen microbiome members from the Hungate1000
32. Chen,I.A., Chu,K., Palaniappan,K., Pillay,M., Ratner,A., Huang,J., Collection. Nat. Biotechnol., 36, 359–367.
Huntemann,M., Varghese,N., White,J.R., Seshadri,R. et al. (2019) 44. Tobias,J.W., Shrader,T.E., Rocap,G. and Varshavsky,A. (1991) The
IMG/M v.5.0: an integrated data management and comparative N-end rule in bacteria. Science, 254, 1374–1377.
analysis system for microbial genomes and metagenomes. Nucleic 45. Varshavsky,A. (2019) N-degron and C-degron pathways of protein
Acids Res., 47, D666–D677. degradation. Proc. Natl. Acad. Sci. U.S.A., 116, 358–366.
33. Paez-Espino,D., Roux,S., Chen,I.A., Palaniappan,K., Ratner,A., 46. Arkin,A.P., Cottingham,R.W., Henry,C.S., Harris,N.L.,
Chu,K., Huntemann,M., Reddy,T.B.K., Pons,J.C. and Llabres,M. Stevens,R.L., Maslov,S., Dehal,P., Ware,D., Perez,F., Canon,S. et al.
(2016). IMG/VR v.2.0: an integrated data management and analysis (2018) KBase: the United States department of energy systems
system for cultured and environmental viral genomes. Nucleic Acids biology knowledgebase. Nat. Biotechnol., 36, 566–569.
Res., 47, D678–D686. 47. Wood-Charlson,E.M., Anubhav, Auberry,D., Blanco,H.,
34. Karp,P.D., Ivanova,N., Krummenacker,M., Kyrpides,N., Borkum,M.I., Corilo,Y.E., Davenport,K.W., Deshpande,S. et al.
Latendresse,M., Midford,P., Ong,W.K., Paley,S. and Seshadri,R. (2020) The National Microbiome Data Collaborative: enabling
(2019) A comparison of microbial genome web portals. Front. microbiome science. Nat. Rev. Microbiol., 18, 313–314.
Microbiol., 10, 208.You can also read