Key Factors for a Better Understanding of Mobile Java Games Customers1
←
→
Page content transcription
If your browser does not render page correctly, please read the page content below
7. Internationale Tagung Wirtschaftsinformatik (WI2005)
23.-25. Februar 2005 in Bamberg

            Key Factors for a Better Understanding of
            Mobile Java Games Customers1

            Mitra Arami, David Meyer, Antje Sester
            Vienna University of Economics and Business Administration

            Abstract: This paper presents first results of a research project conducted at the
            Vienna University of Economics and Business Administration. The focus of the
            project is to analyze customer perceptions towards Mobile Java Games and to
            identify gaps in Mobile Java Games research. A major finding is that transaction
            data typically collected by Mobile Service Providers can deliver only limited ex-
            planations on customer behavior. Thus, the existing information should be en-
            riched by additional data such as consumer surveys and market research. This
            would enable firms to improve their market strategies.

            Keywords: M-Commerce,Mobile Java Games, Mobile Entertainment, Marketing

            1    Introduction
            Content-based mobile services are already making an important contribution to the
            revenue of mobile service providers, and mobile games will be the biggest con-
            tributor to the growth of mobile content within the next years [Ande02]. Because
            of these future prospects for mobile content and entertainment services, it is likely
            that a large number of companies will be attracted to this market.
            Without doubt mobile games based on Java 2 Micro Edition (Mobile Java Games)
            represent an important sub-segment as they offer a unique span of performance
            characteristics [Gele04, Datc02, Datm01]. Mobile Java Games (MJG) have been
            introduced to the European market in 2002 [Abou04].
            The main research goal of the project presented in this paper is to analyze critical
            factors that have a positive effect on users’ attitudes towards usage of MJG. The
            use of these factors lies in providing a fundament on which focused marketing
            strategies can be developed. This includes the question for customer preferences
            and the existence of specific customer segments with their own special prefer-

            1
                 We would like to thank Benjamin Spiss and Roland Zechmeister for their
                 collaboraton in this project. Also, we are particularly grateful to the referees for their
                 useful suggestions and comments.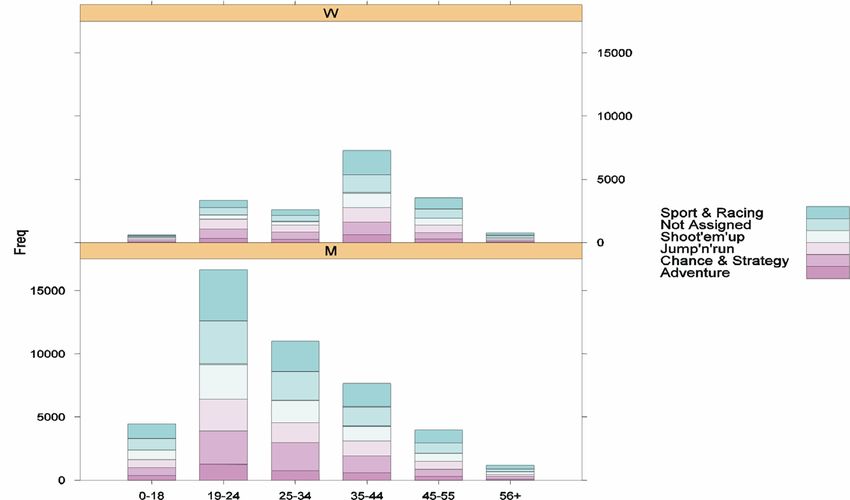
7. Internationale Tagung Wirtschaftsinformatik (WI2005)
23.-25. Februar 2005 in Bamberg

            352                                                     M. Arami, D. Meyer, A. Sester

            ences. Finding out about customers’ preferences should ideally lead to a deeper
            understanding of what kind of picture of the product customers have in their mind,
            comprising, e.g., the game’s complexity and the type of content. Important ques-
            tions to understand how revenue streams of providers will develop are the inten-
            sity of use and potential limitations from the customer side (technological barriers,
            pricing of service, etc.).
            This project is scheduled in four phases: 1) Literature study, 2) Explorative Analy-
            sis of customer data, 3) Qualitative analysis, and 4) Quantitative online survey.
            The first phase is surveying: after analyzing the information gathered, we identify
            areas of controversy and formulate hypotheses for further research steps. The sec-
            ond phase is an explorative analysis of customer data, provided by an Austrian
            mobile service provider, which includes a cluster analysis. Again, hypotheses for
            the further research are derived from the findings. In the third phase, we apply a
            qualitative analysis to get deeper information about different aspects of mobile
            Java gaming. On the one hand, user focus groups with different socio-
            demographic characteristics will be asked to download and play Java Games, and
            be questioned about their experiences. Second, experts from the supply side of
            Java Games will be interviewed about their market view. Finally, both positions
            will be compared, and synthesized in a quality workshop. The results of phases 1–
            3 will be the basis of a customer survey conducted in the fourth phase. The results
            of this survey will be used to formally test our hypotheses within the framework of
            a standard customer acceptance model.
            The paper at hand reports the results of phases 1 and 2 (Literature Review and Ex-
            plorative Data Analysis), and concludes on the next project phases.

            2     Literature Review
            Mobile Gaming provides entertaining services via wireless technology to mobile
            devices. Even though Mobile Games are a recent phenomenon there is a variety
            available in most developed markets [Voda04]. Different existing Mobile Games
            Business Models such as SMS Games, Browser Games, Native Operating System
            Games, and MJG can be distinguished [Noki03]. The focus of this paper is on
            MJG.
            Sun Microsystems' Java 2 Micro Edition (J2ME) technology has become the de
            facto standard in the interpreted mobile gaming field. J2ME based games have
            changed the users’ gaming experience not only by providing enhanced graphical
            features. Due to the fact that java applications reside on the handsets themselves
            instead of the network they are more robust, quicker to load than WAP applica-
            tions and at the same time able to store user preferences [Gele04]. After the users
            have downloaded a game they can play anytime they wish either on-line in a mul-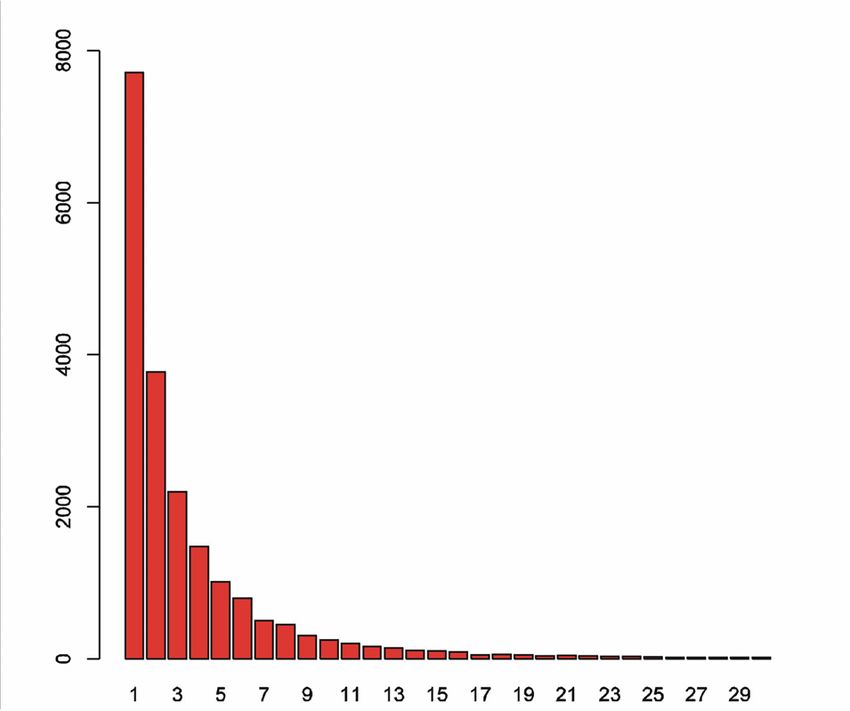
7. Internationale Tagung Wirtschaftsinformatik (WI2005)
23.-25. Februar 2005 in Bamberg
Key Factors for a Better Understanding of Mobile Java Games Customers 353
tiplayer mode or off-line in a single-player mode [e.g. Mobi04]. Games can be or-
dered either over the Internet or the mobile device.
By the beginning of 2003, tens of operators and a high number of service provid-
ers/aggregators all over the world had already successfully trialed or launched
MJG [Noki04]. The early results from many of these wireless Java service
launches have been very encouraging. Many operators in Asia, Europe and the US
have reported rapid user adoption and significant traffic increases from Java ser-
vices. Here some corporate reports about early Java launches:
• 25 carriers in 34 markets have deployed or trialed wireless Java Games and the
number is growing rapidly [Source: Sun Microsystems, February 2003]
• US operator Nextel reported 660.000 Java downloads in 2002 [MMAN]
• German Mobile Portal Provider Jamba! Reports 140.000 Java downloads /
month in November 2002 [Jamb03]
Note, however, that these statements have to be taken with care as they might be
biased.
According to [Noki04] the key success factors of MJG are:
• User acceptance:
Attractive content and ease of use
1st download is the crucial moment of truth (most providers offer MJG as
try and buy products so the first download is the most important part of the
sales process since consumers typically adopt their attitude after the first
try)
▪ Best content at launch
▪ Active educational point of sales (POS) marketing (since MJG are not self-
explanatory, demonstration of the functionality becomes part of the sales
process)
▪ Ensure out of box readiness/service activation (no need for complicated in-
stallation and initial configuration)
▪ Easy service discovery by WAP, SMS, Web (functioning of MJG should
not depend on specific communication protocols)
• Business model
Work with content partners and create win/win business models
Need for industry wide quality assurance processes
Corresponding to the key learnings on MJG and their success factors from a mar-
keting perspective, essential considerations for the success MJG will be demon-
strated in this section. A brief overview on existing literature and academic re-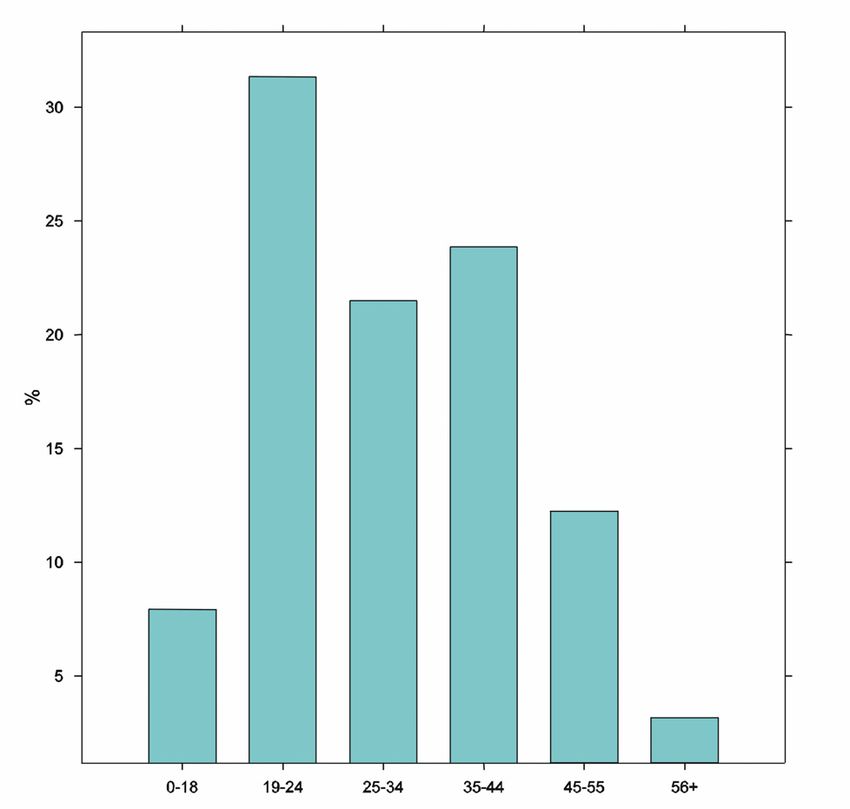
7. Internationale Tagung Wirtschaftsinformatik (WI2005)
23.-25. Februar 2005 in Bamberg

            354                                                    M. Arami, D. Meyer, A. Sester

            search regarding MJG characteristics, game classifications, pricing and payment,
            branding, and the customer groups will be given. Due to the apparent lack of
            documented research on MJG, we occasionally had to resort to more general lit-
            erature.

            2.1    Characteristics of Mobile Java Games

            Mobile Commerce applications show distinctive characteristics, which represent a
            qualitative differentiation from fixed-line applications. As Mobile Gaming in gen-
            eral and MJG in specific can be seen as a sub-group of Mobile Commerce Appli-
            cations it is likely that these characteristics can be applied to MJG as well. These
            characteristics can be summarized as follows:
            • Ubiquity: The ubiquity of the services permits the enjoyment of them wherever
              the user feels the need, for example, while waiting in the train-station.
              [Müll99]
            • Accessibility: The services are available at any time and immediately. It has
              been observed that many users access wireless services in niche time and have
              different usage patterns than people who go online through PCs [Mizu+01].
            • Reachability: From a push-perspective, mobile services allow connection with
              a user, with his permission, anywhere and anytime. This allows immediate in-
              teraction in communication applications and enhances the possibilities to con-
              tact possible partners for multiplayer games. The entertainment services can be
              customized to the user’s location. This allows better-targeted entertaining ser-
              vices [Müll99].
            • Personalization: Wireless devices are regarded as very personal items. Person-
              alized services create strong customer relationships, thus encouraging transac-
              tions while preventing users from switching to different services [GrHu00].
            On the other hand there are some limitations of Mobile Commerce compared with
            wired Internet services. The most emphasized aspects are limited user interface
            capabilities and connection speed [WAP99]. A recent Giga Information Group re-
            port pointed out that phones that use Java might not be ready for the market. “Java
            is still very immature on small devices,” the report says. Recent recalls “are more
            proof that Java phones are not ready for prime time with the mass-market con-
            sumer or the enterprise” [Giga00]. In addition, due to technological restrictions,
            MJG currently are limited to off-line and single user-gaming [Wire04]. According
            to the literature review, we formulate following hypothesis:
            H1: a) Currently, the availability of Java Games enabled mobile devices is insuf-
            ficient. b) The cost of acquiring these devices is still too high.
            H2: Developing applications for intelligent, automatic personalization on mobile
            devices, is a success factor for MJG.
7. Internationale Tagung Wirtschaftsinformatik (WI2005)
23.-25. Februar 2005 in Bamberg
Key Factors for a Better Understanding of Mobile Java Games Customers 355
2.2 Classification of MJG
In general there is no defined pattern for the classification of MJG.
In their studies, Frost and Sullivan describe the following play categories: Ac-
tion/Combat, Adventure, Casino/Gambling, Sport, Parlor/Arcade (society plays),
Puzzle, and Trivia (Quiz plays) [FrSu02, p. 2–7]. John Romero, the inventor of PC
games such as Doom and founder of Monkeystone Games, believes in the oppor-
tunity for puzzle games such as Tetris [Rome03]. Jussi Pekka Partanen’s opinion
is that the most popular games will be simple games such as Bingo, card-games
and quizzes [Part01]. Games from these categories require more training and–due
to their complexity–are not suitable for mobile devices. He calls this principle "5
minute fun", mobile games must be simple and fast downloadable. According to
the literature review, we formulate following hypotheses:
H3: Simpler games are more successful than complex ones.
2.3 Pricing and Payment
Clear and simple pricing models are essential to achieve user acceptance. Pay per
download and bill to phone2 is maybe the easiest for the user to gasp. Also simple
monthly subscription based charging models have been used successfully and in
innovative way. Too high prices will kill market growth whereas too low prices
mean leaving value on the table. Several of the successful Java launches by opera-
tors so far have applied low pricing to stimulate service mass-market uptake. A
fixed monthly fee could be an easy solution, but is not very attractive to custom-
ers. The market is young and developing and customers want to be able to change
service providers rapidly. In this model the content providers could also be paid a
fixed amount for a game that the service provider is offering. Download-based
charging model will most likely be the mostly used revenue model. Content pro-
viders are paid a certain provision of each transaction. This way the content pro-
vider’s income is directly related to the success of the game among the end users,
which would give the content providers the pressure of making higher quality
games all the time. Service providers themselves would have to take the risk of
developing games. [Part01]
The feasible billing methods should be developed in very early stage of offering
services. The situation will be the same as for early Internet business models: if
many free services are available before the service providers start charging for
2
Bill to phone is a payment method. Normally there are different payment options such
as Credit Card or Bill to Phone.7. Internationale Tagung Wirtschaftsinformatik (WI2005)
23.-25. Februar 2005 in Bamberg
356 M. Arami, D. Meyer, A. Sester
their services, people will not start paying for them since they got used getting
them for free.
At the time being, most of mobile service providers offer a uniform pricing model
for MJG (see Table 1). However, it remains mostly unclear to customers whether
these prices include Airtime charge. These hidden costs might be a factor prevent-
ing customers from purchasing MJG.
Attribute T-Mobile3 One4 A15 Telering6
Black & White 1,50-3,50 € - 2,99 € -
Color 2,50-3,50 € 3-5 € 4,99 € 3,90 €
Non-Branded 2,50-4,50 € 3-5 € 4,99 € 3,90 €
Branded 3,50-4,50 € 3-5 € 4,99 € 3,90 €
Table 1: Austrian Mobile Provider Pricing Model for MJG [own work, T-Zones, One
Game, A1Games, Telering Handyfun, July 2004].
According to the literature review, we formulate following hypothesis:
H4:"Pay by Download" without Airtime charge is the most accepted charging
mode for MJG.
2.4 Branding
As branded MJG we consider games based on existing brands such as popular
console or computer games, latest events such as movies, TV-shows and sports-
events, and even people like pop-idols or soccer teams [Kell03]. Developers real-
ize that branded games have a high user penetration [FrSu02, 2-28]. The actual
brands, which are preferred by users, are likely to differ among different cultures
[Kang04]. The functions brands take over from the consumers’ perspective remain
mostly uninvestigated. Hence, it is hard to say what importance brands have vis-à-
vis other factors such as social elements of games or games’ prices.
Coming from “classical branding”, Keller identifies seven possible roles a brand
can play from a consumer’s perspective [Kell03]:
• Identification of source of product
3
cf. http://www.t-zones.at/at/09t_games/
4
cf. http://www.one.at
5
cf. http://games.aon.at
6
cf. http://www.telering.at/Content.Node/fun/3446.php7. Internationale Tagung Wirtschaftsinformatik (WI2005)
23.-25. Februar 2005 in Bamberg
Key Factors for a Better Understanding of Mobile Java Games Customers 357
• Assignment of responsibility to product maker
• Risk reducer
• Search cost reducer
• Promise, bond, or pact with maker of product
• Symbolic device
• Signal of quality
As consumers have only limited possibilities to test games in advance it is likely
that the brand can be seen as a risk reducer and a promise. Furthermore, the name
of the actual maker of the game itself is in many cases not displayed.7 The brand
of the game can therefore not be regarded as an assignment of responsibility to the
product maker or the identification of source of product unless customers transfer
these roles to the provider of the games. Another function of branding that is pos-
sibly delegated to the provider is risk reduction.
Although these assumptions remain only very vague and clearly further investiga-
tions are required, it can be seen that branding can play a role on two levels: The
first level is the product itself as defined above. The second level can be providers
themselves which can benefit from their corporate brand. Conversely, providers
can obtain a positive effect on their corporate brand by selling new innovative
products such as Java Games [Kell03].
H5: a) Branded Java Games are preferred to non-branded Java Games. b) This
effect is amplified for corporate brands that stand for a high technological compe-
tence.
H6: Selling Java Games has a positive effect on the corporate brand of the service
provider.
2.5 Consumer Groups
As with many new services or products, market awareness is low at the beginning.
The key barrier to overcome is to get the users to do the first critical download.
Mobile Service Provider that have achieved rapid uptake of new services have in-
vested significantly in easy to understand marketing, educating the mobile users
on what benefits Java services can offer and how they can discover and download
Java applications.
Regarding to Literature, following three users groups of mobile games can be dis-
tinguished:
7
During our website analysis of game prices we have also noticed that in most cases
the productmaker of MJG is not displayed.7. Internationale Tagung Wirtschaftsinformatik (WI2005)
23.-25. Februar 2005 in Bamberg
358 M. Arami, D. Meyer, A. Sester
• Kids and Teenagers: They are growing up in the wireless environment and in
the world of the Internet. Although their parents are the actual subscribers to
the mobile services, many kids are already regular users of mobile devices.
Kids and teenagers are also heavy users of game consoles. It is likely that these
users will be among the first to link their consoles to wireless phones to play
games against their friends [Brio01]. The socializing aspect has a particularly
important value to kids, as they have a lot of free time [Hall01]. Thus they will
undeniably be among the most dedicated users of mobile entertainment.
• Young adults: Across the world, there are currently numerous young adults
with large budgets. They generally share a strong demand for brand products,
and are likely to turn to wireless phones for daily entertainment services. The
span of the group is fairly wide, beginning with European high school and uni-
versity students with minimal expenses, as they are still supported by their par-
ents. The other end of the span consists of users in their mid-to-late 20s, who
often already have salary incomes and are often single. If already married, dual
incomes are common in this age group. They therefore have plenty of money
to spend on their life-style. They are tech savvy and perceptive to new trends.
[Inst01].
• Business Users: European business users will not be as strong as the aforemen-
tioned users. Using the devices primarily for infotainment and communication,
popular content will include news & weather [Noki 00].
A more detailed categorization is provided by [Ande02], which advises that un-
derstanding peculiarities of user demographics is important (see ). A consistent
feature among the segments described by Andersen Research is the young age of
mobile game players. Another finding is that most mobile gamers have console
gaming background. According to the literature review, we formulate following
hypotheses:
H7: The market for mobile java games is likely segmented as the market for mo-
bile games.
H8: The usage of MJG will be moderated by gender and age, such that the effect
will be stronger for men and particularly for younger men.7. Internationale Tagung Wirtschaftsinformatik (WI2005)
23.-25. Februar 2005 in Bamberg
Key Factors for a Better Understanding of Mobile Java Games Customers 359
Mobile From mobile casual From traditional
gaming hard-core gaming
casual gamers
Demography Young, both sexes Young, both sexes Young, males
and all ages
Console gaming Some Most All
background
Reasons for mobile Time-killing Hobby Hobby
gaming
Type of game Simple Simple & Complex Complex
Success factor Game play Game play and Minority
Graphics
Mobile gaming user Majority Minority Minority
population
Uptake Now Casual An introduction in
relevant handsets
Table 2: Mobile Gaming Customer Segmentation [Ande02]
3 Data Analysis
In this section, we summarize the results of our analysis of the mobile providers’
transactional data. We first introduce the methodology employed, followed by a
description of the data set. Then, we have a closer look at some explanatory vari-
ables potentially influencing the number of downloads, and present the results of a
cluster analysis. The section concludes with a discussion of the results and on im-
plications for the next two phases of the project.
3.1 Methodology
Analyzing the transaction data of Java Games collected by mobile service provid-
ers appeals as the logical starting point for marketing measures. This data has two
advantages: First, as most data collections of this kind, they combine (at least
some) socio-demographic data of customers with transactional data. As such, they
are predestined to be used as a basis for clustering [Ults02]. Second, they are col-
lected automatically by the download and billing processes, and can be accessed7. Internationale Tagung Wirtschaftsinformatik (WI2005)
23.-25. Februar 2005 in Bamberg
360 M. Arami, D. Meyer, A. Sester
by the service providers “ad hoc”, in contrast to external survey data which neces-
sitates additional investments of time and money.
In our analysis, we first employ explorative data analysis to extract the main char-
acteristics of the data set. We try to find influencing factors of the number of
downloads mostly by exploring conditional bar charts to see how the distribution
of the number of downloads varies in subpopulations of interest (e.g. male/female
users, etc.). Second, we try to find a segmentation of the customers with respect to
explanatory variables, hoping to find groups with a profiled download behavior
(e.g., clusters of heavy users, or clusters with very low downloads). As segmenta-
tion technique, we use Self-Organizing Maps (SOM) introduced by [Koho95], a
data mining method for simultaneous dimension reduction, clustering, and visuali-
zation of high-dimensional data sets [Kask95, KaKo97]. SOMs have successfully
been employed in the field of marketing (e.g. [Curry+03] and [Ults02] for an ap-
plication in the mobile phone market).
3.2 Description of the Data Set
The data provided by the Austrian mobile phone provider was taken from the
company's data warehouse and basically consists of transaction data of game
downloads from February, 2003, to February, 2004 (74.703 entries in total), gen-
erated by 19.838 customers (Post-paid users only). Besides information on the
game (title, genre) and the customers’ contract (rate, average turnover), the data
includes socio-demographic variables such as age, gender, location, and profes-
sional background. The rates have been grouped into categories. The summary
statistics of these variables are shown in Table 3: we indicate the level proportions
for categorical variables and a 5-number-summary for the continuous one (turn-
over).
A few remarks are appropriate. First, the high proportion of male customers
(68,17%) seems surprising. Second, the proportion of customers from Lower Aus-
tria (28,8%) is much higher than might be expected from the official population
figures (19,3%––see [Stat04]). Conversely, the proportions are lower for Vorarl-
berg (data set: 1,81% / population figure: 6,7%) and Salzburg (data set: 2,87% /
population figure: 6,4%), so we clearly have regional effects. Third, customers ba-
sically focus on two groups of rate categories: the economy rates mean lower
ground fees and higher connection fees, the heavy usage rates higher ground fees
and lower connection fees. Finally, the genres compare well to the game catego-
ries found in the literature, but are grouped differently: e.g., “Parlor/Arcade” and
“Casino/Gambling” correspond to “Chance & Strategy” in our data set, whereas
we find “Jump’n’run” as a category on its own. Clearly, “Shoot’em’up” games
correspond to the “Action/Combat” category. Interestingly, no puzzle and quiz
games are offered by this Mobile Service Provider.7. Internationale Tagung Wirtschaftsinformatik (WI2005)
23.-25. Februar 2005 in Bamberg
Key Factors for a Better Understanding of Mobile Java Games Customers 361
Genre Adventure 8,07 %
Chance & Strategy 16,23 %
Jump’n’run 15,74 %
Shoot’em’up 15,28 %
Sport & Racing 23,89 %
Not Assigned 20,79 %
Average Min 0,00
Turnover (EUR) 1Q 22,12
Median 37,97
3Q 62,79
Max 2.298,00
Age 0–18 7,01 %
19–24 30,12 %
25–34 22,46 %
35–44 24,47 %
45–55 13,06 %
56+ 2,88 %
Gender Male 68,17 %
Female 31,83 %
Family Status Married 34,06 %
Non-married 65,94 %
Location Vienna 17,00 %
Lower Austria 28,05 %
Upper Austria 16,56 %
Styria 13,30 %
Carinthia 8,96 %
Tyrolia 8,13 %
Burgenland 3,32 %
Salzburg 2,87 %
Vorarlberg 1,81 %
Professional Services 16,24 %
Background Metalworking Industry 13,21 %
Retailing 12,96 %
Building Industry 10,29 %
Manufacturing 8,15 %
Tourism 7,44 %
[Others, not listed] 31,71 %
Rate Economy 62,65 %
Heavy-Usage 35,18 %
Other 2,17 %
Table 3: Summary Statistics of Transaction Data7. Internationale Tagung Wirtschaftsinformatik (WI2005)
23.-25. Februar 2005 in Bamberg
362 M. Arami, D. Meyer, A. Sester
3.3 Download Analysis
The count distribution of customers downloading games repeatedly is shown in
Figure 1 (74.708 downloads, 19.838 transactions):
Figure 1: Counts of Repeated Downloads 2003
This Figure illustrates the fact that a major part of the customers (7.708 / 40,1%)
downloaded only once, only half as much (3.773 / 19,2%) twice, 2.196 customers
(11,3%) made three downloads and so on, yielding an exponential-like, fast-
decreasing distribution. Obviously, the rate of recurrent users is very low, and this
first finding calls for more investigation. Exploring the download distribution in
different sub-populations for different combinations of age, gender, and location
combinations yields the same fast-decreasing structure. Conversely, the customer
groups defined by the different number of downloads exhibit the same socio-
demographic profile.
A major concern is posed by the data quality. Consider Figure 2 depicting the
number of downloads by age breaks:7. Internationale Tagung Wirtschaftsinformatik (WI2005)
23.-25. Februar 2005 in Bamberg
Key Factors for a Better Understanding of Mobile Java Games Customers 363
Figure 2: Downloads 2003, grouped by Age, (N=74.703)
Given the fact that most Austrian children own a mobile phone [Mobi03], the low
rate for under-aged customers cannot reflect the real usage figures. When we add a
further split by gender (see Figure 3), we similarly find that most female custom-
ers seem to be middle-aged, in contrast to their mostly younger male counterparts:
Figure 3: Downloads 2003, grouped by Gender, Age, and Genre (N=74.703).
W=women, M=men.7. Internationale Tagung Wirtschaftsinformatik (WI2005)
23.-25. Februar 2005 in Bamberg
364 M. Arami, D. Meyer, A. Sester
Later findings regarding the genre distribution (see below) let us suspect that this
might be an artifact created by children using the mobile phone of their mothers
for game playing. This traceability problem is an indicator for the poor quality of
our data, typical for transaction data (cf. [Treib03]). In addition, children typically
use prepaid phone cards (see, e.g., [Stan03]), and therefore are underrepresented in
the data at hand. However, it is clear that most gamers are young people: even in
this probably biased data, almost 60% are under 35 of age, which is consistent
with our findings from the literature (cf. the group of “young adults” in Section
2.5)
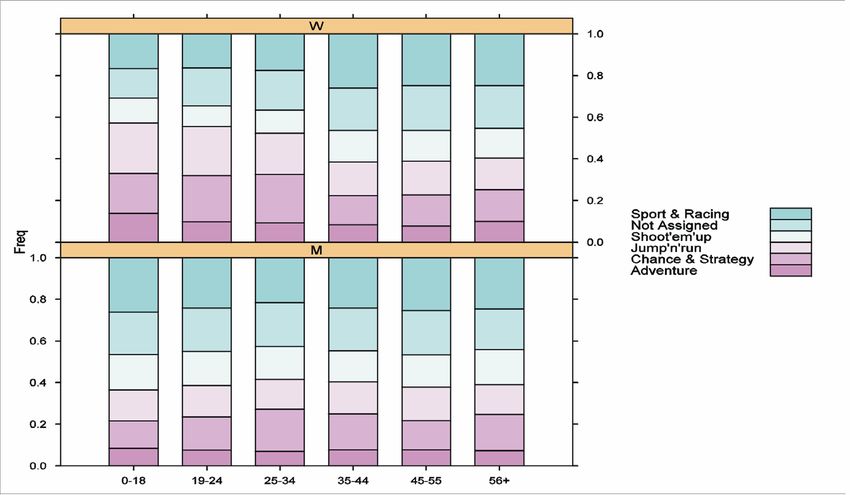
In order to get a better impression of the customers’ preferences, we now explore
the proportion of genres in the downloads, again grouped by age and gender (see
Figure 4):
Figure 4: Proportion of Download-Genres, grouped by Age and Gender
(N=74.703)
For male customers, the proportion of “Chance & Strategy” games varies over the
age groups, increasing for the first three age groups, and then decreasing. This
category removed, the groups seem relatively homogeneous. Therefore, a market-
ing campaign for “Chance & Strategy” games should take into account the age of
(male) target customers. For female customers, we first note that the bar plot con-
veys the counter-intuitive impression that middle-aged and elderly women (age
groups 4–6) would prefer sport and racing games––it is more likely that much
younger and partly male customers (children borrowing the mobile phone from
their mother, contracts officially concluded for children, etc.) are the real players
here. Therefore, these data have to be interpreted with care. Assuming that the
data for younger female customers (age groups 1–3) are reliable, we note that7. Internationale Tagung Wirtschaftsinformatik (WI2005)
23.-25. Februar 2005 in Bamberg
Key Factors for a Better Understanding of Mobile Java Games Customers 365
here, the proportions of “Sport & Racing” and “Shoot’em up” games are lower
than for male customers, in contrast to the percentages of “Chance & Strategy”
games.
A more substantial finding concerns the influence of branding: although only 22%
of all offered games are branded games, they represent 40% of all downloads.
This positive branding effect is in accordance with the findings from the literature
review in the previous section.
3.4 Customer Segmentation
Since our primal goal was the segmentation of customers, we conducted a cluster
analysis using Self Organizing Maps (see, e.g., [OnAb99] and [Kask95]), a widely
used technique for clustering and visualization of multidimensional data. We
chose the “Viscovery Profiler” implementation by Eudaptics (see
http://www.eudaptics.com). We included all socio-demographic data (age, loca-
tion, professional background, gender, family status, and rate) for determining the
clusters. Note that we did not include the number of downloads, since our aim is
to recover homogeneous download characteristics in the clusters. The optimal
number of clusters was determined using the cluster index for the SOM-Ward
clustering method offered by the software. Three clusters turned out to be the best
solution (see Figure 5).
Figure 5: Three-Cluster-Solution using Ward-Clustering.
The grey nodes represent frequent downloaders (more than three games in 2003).
Inspecting the cluster profiles, it appears that two smaller clusters are dominated
by married people (and probably could be merged into one cluster). Using the7. Internationale Tagung Wirtschaftsinformatik (WI2005)
23.-25. Februar 2005 in Bamberg
366 M. Arami, D. Meyer, A. Sester
“profiling” function of the software, we then in vestigated the importance of the
“number of downloads” variable within the cluster solution found in the previous
step (shaded areas in Figure 5). Clearly, no cluster exhibits an important “concen-
tration” of downloads, i.e., the socio-demographic variables do not seem to con-
tribute to the explanation of the number of downloads. We therefore believe that
other (or at least complementing) variables would be needed to accomplish a suc-
cessful segmentation.
3.5 Discussion of Findings
The results of the data analysis can be summarized as follows:
1. Only few customers are frequent downloaders: Many customers download one
or two games, but just a few are regular users.
2. Java-Games players are young people. This is in accordance with our findings
from the literature. In our data, we find that at least 60% of the customers are
under 35 (probably more taking into account the “mismatch” of underaged
people––see point 5 below).
3. Genre preferences are different for male and female users: Not surprising,
male gamers seem to prefer “Shoot’em’up” and “Sport & Racing” games,
whereas female players tend more to the “Jump’and Run” and “Chance &
Strategy” categories. In addition, the preference of male customers for “Fun &
Strategy” games seems to vary over the age groups.
4. Branding has a positive effect on download rates. Again, this result can be re-
covered in the literature.
5. Transaction data are of limited reliability: Most probably, age and gender bias
is present in the data. Underage customers are not well represented, since their
bills are officially paid by adult people. A study by the Austrian mobile-phone
provider Mobilkom underlines this assumption, showing that 49% of the 6 to
10year old and over 90 % of the 11 to 14 year old children have their own mo-
bile phone, and that a major part (82%) of the bills is paid by parents
[Mobi03].
Apart from the apparent necessity of validity checking, the data raise several ques-
tions regarding the explanation of the download rates:
1. No profiled download patterns could be recovered from customer segments:
We did expect to find clusters associated with high (low) download rates, but
given the cluster solution described, there is no evidence in our data that
downloads can be explained by socio-demographic variables. We believe that
additional data, coming from classical consumer surveys and market data, are
needed for recovering useful consumer segmentations.7. Internationale Tagung Wirtschaftsinformatik (WI2005)
23.-25. Februar 2005 in Bamberg
Key Factors for a Better Understanding of Mobile Java Games Customers 367
H9: Coupling transactional data with survey data on consumer preferences
regarding Java Games enables finding a sensible segmentation using cluster-
ing methods.
2. Download data do not describe actual use of java games: Java games can be
downloaded once but played as often as the customer wishes. The number of
downloads can only give us a clue how many games a customer has on his
mobile phone, but we do not know how often the users do play, for how long,
in which situation. But especially this context of usage is indispensable infor-
mation to create the right games for the right people [MoRu04].
H10: Consumers do not need a huge variety of games. They regularly play se-
lected games.
H11: The choice of the game is situation-dependent.
3. Download data cannot explain low by-user-downloads. Nothing is known
about non-customers: Apart from the users who are satisfied with one or two
games, there are probably non-satisfied users as well who discontinue purchas-
ing. This distinction cannot be made from our data. Also, we do not know why
potential customers do not purchase java games at all. The motives remain un-
clear: are the products not fulfilling the consumers’ expectations? Are they too
expensive? Are the consumers’ mobile phones not java-enabled? Are potential
customers aware of java games after all? Such questions can only be answered
by a consumer survey (phase 4 of our project).
H12: The games available do not meet the consumers’ preferences.
H13: The games are currently too expensive.
H14: Java games are unknown to customers. Promotional activities have not
been noticed.
4 Conclusion and Outlook
Despite of apparent gaps in the specific MJG literature, there is evidence that ease-
of-use product design, pricing, and branding are the key instruments for the mar-
keting of Java Games. Technological barriers such as limitations of mobile de-
vices and band width possibly have negative impact on customer acceptance.
Transaction data typically available to mobile service providers have limited reli-
ability, and furthermore cannot provide answers to the most relevant questions re-
garding customer behavior. In particular, they do not lead to sensible customer
segmentations explaining purchases.7. Internationale Tagung Wirtschaftsinformatik (WI2005)
23.-25. Februar 2005 in Bamberg
368 M. Arami, D. Meyer, A. Sester
The following project steps as illustrated in Figure 6 will be the qualitative study
with two focus customer groups and one expert group in phase 3 and a customer
survey in phase 4. The focus groups (Phase 3) will be selected according to their
experience with the internet, mobile phones, MJG, and Computer Console games.
The participants will be asked to download games and answer a questionnaire
about their experience and factors, which have an impact on their attitude towards
downloading MJG. In the next step, the participants will be requested to play
games on mobile phones. All participants will receive a unique device and the in-
struction to operate them. Afterwards they will answer a questionnaire about their
experiences using the devices. Interviews with experts will be conducted in paral-
lel. The collected data will be analyzed and used to modify the hypotheses created
so far. In the final phase, we will conduct a consumer survey to test the hypotheses
derived from the previous phases. As MJG are a relatively young technology, the
survey will be constructed on the basis of a standard technology acceptance model
such as the UTAUT (Unified Theory of Acceptance and Use of Technology)
model [Vank03].
Analysis
Phase 3:
Group A Group B Experts
Qualitative
Participant
Selection
Downloading Downloading
Java Games Java Games
Answering the Answering the
Questionnaire Questionnaire Expert
Interviews
Data Collection
Playing Games Playing Games
Answering the Answering the
Questionnaire Questionnaire
Qualitative Analysis
Phase: 4
Survey
Developing
Conducting Data
Survey Results
Survey Analysis
Instrument
Figure 6: Proposed Design for next project phases7. Internationale Tagung Wirtschaftsinformatik (WI2005)
23.-25. Februar 2005 in Bamberg
Key Factors for a Better Understanding of Mobile Java Games Customers 369
References
[Ande02]: Andersen Consulting: ‘Mobile Multimedia Study’. European Commission. Di-
rectorate-General Information Society, 2002.
[Abou04]: About IT: Jamba! startet als Erster Java-Spiele zum Downloaden für das Handy,
http://www.aboutit.de/view.php?ziel=/02/01/04.html (Accessed 2004-06-01).
[Brio01] Briody, D.: The Kids are Alright, Red Herring 2001,
http://www.redherring.com/Article.aspx?a=5119&hed=The+kids+are+alright,
(Accessed 2004-07-11).
+
[Curry 03] Curry, B., Davis,F., Evans, M., Moutinho,L., Phillips,P.: The Kohonen self-
organising map as an alternative to cluster analysis: An application to direct marketing.
International Journal of Market Research. Henley-on-Thames: Second Quarter 2003.
Vol. 45; p. 191ff.
[Datc02] Datacomm Research: Winning Business Strategies for Mobile Games, market re-
port, 2002.
[Datm01] Datamonitor: Best Practice in Asia-Pacific Mobile Gaming, Report, , 2001.
[FrSu02] Frost & Sullivan: Global Mobile Gaming Markets. San Jose 2002.
[Gele04] Gelenbe, P.: Java is…. the new black, http://www.flytxt.com/cgi-
bin/template.pl?t=nrpd&ID=28, 2004 (Accessed 2004-04-01).
[GrHu00] Granger, V., Huggins, K.: Wireless Internet – More than Voice: The Opportunity
and the Issues. Report, Merrill Lynch Global Securities Research & Economic Group,
June 2000.
[Giga02] What Does the Future Hold for Handheld Devices? Giga Information Group, Inc.
March 1, 2000.
[Hall01] Hall, J.: Chatty Teens Seen As Growth Market for Wireless, Reuters Technology
News, 17 February.Harvard Business School Press, 2001.
[Jamb03]: Public sources, Sun Microsystems, Gartner, ARC Group; Yankee Group; Nokia;
Jamba.de.), 2003.
[Kang04] Kangas, S.: International Comparison of Mobile Entertainment, in: Proceedings
of Mobile Entertainment: User-centred Perspectives, Manchester 2004.
[Kaski95] Kaski, S., Kohonen, T.: Exploratory Data Analysis by the Self-Organizing Map:
Structures of Welfare and Poverty in the World, Proceedings of the Third International
Conference on Neural Networks in the Capital Markets, World Scientific, Singapore,
1995, 498-507.
[Kask97] Kaski, S.: Data Exploration Using Self-Organizing Maps. Doctorate Thesis, Neu-
ral Networks Research Centre, Helsinki University of Technology, 1997.
[Koho95] Kohonen, T.: Self-Organizing Maps, Springer, 1995.
[Kell03] Keller; K. L.: Strategic Brand Management – Building, Measuring, and Managing
Brand Equity, Prentice Hall: Upper Saddle River, 2003.7. Internationale Tagung Wirtschaftsinformatik (WI2005)
23.-25. Februar 2005 in Bamberg
370 M. Arami, D. Meyer, A. Sester
[MMAN] Mobile Media Analyse, February 2003.
[Mobi03] Mobilkom Austria, “Netzwerkkinder-Studie”, http://www.telekom-
presse.at/channel_electronics/background_10071.html (Accessed 2004-06-11).
[Mobi04] Mobilkom Austria, Download Games: 1 x zahlen - ewig spielen,
http://www.a1.net/CDA/article/art_display/0,2564,31-1057-42546-html-de,00.html,
(Accessed: 2004-07-11).
[MoRu04] Rutter, J.; Moore, K.: Understanding Consumers’ Understanding of Mobile En-
tertainmentin: Proceedings of Mobile Entertainment: User-centred Perspectives, Man-
chester 2004.
[Müll99] Müller-Veerse, Falk: Mobile Commerce Report. Durlacher Research Ltd. 1999.
[Noki03] Nokia Corporation. 2003. Introduction to Mobile Java Games,
http://nds1.forum.nokia.com/nnds/ForumDownloadServlet?id=2896&name=Introductio
n_to_Mobile_Games_Business_v1_0.pdf (Accessed: 2004-06-11).
[Noki04] White paper Java ™technology enables exciting downloading services for mobile
users, 2004.
[Obri03] Stuart, O.: Lack of data means mobile games market size remains a mystery. In:
Mobile Games Analyst Volume 1, Number 1, 13. November 2003, p. 2.
[OnAb99] Ong, Jason, and Abidi, Syed Sibte Raza: Data Mining Using Self-Organizing
Kohonen maps: A Technique for Effective Data Clustering & Visualisation. In: Interna-
tional Conference on Artificial Intelligence (IC-AI'99), June 28-July 1 1999, Las Ve-
gas, 1999.
[Part01]: Partanen, J.P.: Mobile Gaming: A Framework for Evaluating the Industry 2000-
2005, Gaptime Century, Ltd., 2001.
[Rome03] Q&A with John Romero of Monkeystone Games, Version 1.0; October 13,
2003.
[Stan03] Der Standard, „Kommunikation per Knopfdruck“ (18.11.2003)
http://derstandard.at/?url=/?id=1470694%26_range=5 (Accessed 2004-10-12).
[Stat04] Statistik Austria, Statistisches Jahrbuch Österreichs 2004.
[Treibl03] Treiblmeyer, H.: Die Bedeutung der Qualität elektronisch gewonnener Daten für
die individualisierte Kommunikation, der markt: Zeitschrift für Absatzwirtschaft und
Marketing, (166/167), 3+4, 2003, pp. 162-174.
[Ults02] Ultsch, A.: Emergent self-organising feature maps used for prediction and preven-
tion of churn in mobile phone markets, Journal of Targeting, Measurement and Analy-
sis for Marketing;10,4; June 2002, pp 314–324.
[WAP99] WAP White Paper AU-System Radio AB, AU System Thailand Liberalization,
Telecom Journal,February 2002, pp.8-9.
[Wire04] Nokia and Sun to Drive Multiplayer Mobile Java Gaming, Wireless Business
Technology, July 2004. http://www.sys-con.com/story/?storyid=45488 (Accessed
2004-10-14)You can also read