The enrolment gap: who is not enrolling with primary health organizations in Aotearoa New Zealand and what are the implications? An exploration of ...
←
→
Page content transcription
If your browser does not render page correctly, please read the page content below
Irurzun-Lopez et al. International Journal for Equity in Health             (2021) 20:93
https://doi.org/10.1186/s12939-021-01423-4

 RESEARCH                                                                                                                                           Open Access

The enrolment gap: who is not enrolling
with primary health organizations in
Aotearoa New Zealand and what are the
implications? An exploration of 2015–2019
administrative data
Maite Irurzun-Lopez* , Mona Jeffreys and Jacqueline Cumming

  Abstract
  Background: Primary Health Care (PHC) is the entry point to accessing health services in many countries. Having a
  high proportion of the population enrolled with a PHC provider is key to ensuring PHC fulfils this role and that it
  contributes to achieving better equity in health. We aimed to understand the extent to which people in Aotearoa
  New Zealand are enrolling with Primary Health Organizations (PHOs), how enrolment rates have evolved over time,
  and variations across District Health Boards (DHBs) and socio-demographic groups.
  Methods: We analysed administrative data on the proportion of people enrolled in PHOs and breakdowns across
  DHBs, and by age, ethnicity and deprivation, for the years 2015–2019.
  Results: About 6% of the population was not enrolled in 2019. There are persistent differences across socio-
  demographic groups as well as geographically. Māori have lower enrolment rates than New Zealand European/
  Other groups. Young people (15–24 years) are the least likely to be enrolled. The most affluent areas have the
  highest enrolment rates. Auckland DHB shows the lowest enrolment rates.
  Conclusions: Enrolments remain below full population coverage and inequities exist between socio-demographic
  and geographic groups. Potential reasons explaining these trends include methodological limitations as well as real
  issues in accessing services. We recommend (a) work towards minimising data issues in relation to this indicator to
  improve its accuracy and value in signalling trends in access to PHC services, and (b) investigating the reasons for
  the potential widening of the inequities identified, in particular issues preventing Māori and younger people from
  enrolling. This study deepens our understanding of enrolment rates as an indicator for tracking equity in PHC.
  Other countries can learn from the Aotearoa New Zealand case to draw lessons for improving equity in health care.
  Keywords: Primary health care, Patient enrolment, Health equity, Primary health organization, New Zealand

* Correspondence: maite.irurzunlopez@vuw.ac.nz
Health Services Research Centre, Faculty of Health l Te Wāhanga Tātai
Hauora, Te Herenga Waka- Victoria University of Wellington, PO Box 600,
Wellington 6140, New Zealand

                                        © The Author(s). 2021 Open Access This article is licensed under a Creative Commons Attribution 4.0 International License,
                                        which permits use, sharing, adaptation, distribution and reproduction in any medium or format, as long as you give
                                        appropriate credit to the original author(s) and the source, provide a link to the Creative Commons licence, and indicate if
                                        changes were made. The images or other third party material in this article are included in the article's Creative Commons
                                        licence, unless indicated otherwise in a credit line to the material. If material is not included in the article's Creative Commons
                                        licence and your intended use is not permitted by statutory regulation or exceeds the permitted use, you will need to obtain
                                        permission directly from the copyright holder. To view a copy of this licence, visit http://creativecommons.org/licenses/by/4.0/.
                                        The Creative Commons Public Domain Dedication waiver (http://creativecommons.org/publicdomain/zero/1.0/) applies to the
                                        data made available in this article, unless otherwise stated in a credit line to the data.
Irurzun-Lopez et al. International Journal for Equity in Health (2021) 20:93 Page 2 of 11
Background incentives for both providers and users (e.g. lower con-
Primary Health Care (PHC) is the entry point to sultation fees for patients and capitation payments for
accessing health services in many countries. PHC practices) it promotes early access. Third, enrolment en-
embraces essential services, is typically embedded in hances continuity of care with the same provider by for-
local communities, and should be provided at an af- mally linking up patients to a specific provider and
fordable cost [1]. Not only does PHC help improve establishing a provider’s responsibilities to be pro-active
population health, better access to and use of PHC is with respect to health promotion (e.g., for regular
also associated with improved health equity [2]. PHC screening). Enrolment can further enhance continuity of
also plays a gatekeeper role in preventing and redu- care by formalising the PHC provider’s role in coordin-
cing the need for more costly specialized care and ating information and care for the enrolled population
hospitalizations, thus having the potential to lower (e.g., with GPs taking responsibility for referral processes
overall health expenditures [3]. and follow-up). Fourth, because the enrolment system
Some countries like Italy, Netherlands, Aotearoa New designates one place - the main provider - where a pa-
Zealand, Norway, Portugal, Spain, and the United King- tient’s information is stored and managed, it promotes
dom have chosen to formalise the relationship between information coordination. This synchronization serves to
the PHC provider and the population through an enrol- provide an overview of all that is happening with a pa-
ment system, also called registration or patient list. Reg- tient’s health, supporting better diagnosis and care. Fifth,
istering with a primary care provider where the provider enrolment supports health planning by allowing health
serves as the focal point for co-ordinating care, is providers to target health services to meet the enrolled
mandatory in 14 countries of the Organisation for Eco- population’s health needs. Sixth, enrolment brings gains
nomic Co-operation and Development (OECD)1 and en- in value-for-money across a health system, as it en-
couraged in 10 others,2 out of 26 surveyed [3]. The hances access to and continuity of PHC, and supports
design of the enrolment system differs across countries. the PHC gatekeeping role, thus reducing the need for
For example, patient enrolment can take place with a more costly specialized care [5]. It also brings economic
General Practitioner (GP), practice, primary care gains through the efficiencies associated with coordin-
organization, local government or insurance company ation of information, and by encouraging cost-effective
[4]. Enrolment can also be voluntary with patients prevention and health promotion. Seventh, regarding
choosing their own GP (e.g. Aotearoa New Zealand and equity, enrolment may support equal access by reaching
Norway), or compulsory where a patient is assigned to a marginal groups and supporting economically disadvan-
GP or practice, usually by geographic area (e.g. the taged users through economic incentives such as lower
Netherlands) with some possibility of changing the allo- costs of services for those enrolled compared to those
cated affiliation [4, 5]. For the patient, formal enrolment not enrolled. An enrolment system may also be benefi-
might mean an obligation or commitment to use the cial for equity when it includes complementary measures
provider with whom they are enrolled as their preferred to promote public trust and reaching out to those usu-
service. Benefits for patients who enrol vary by country ally left out of the system. On the other hand, it may de-
and can include, for example, lower costs of consulta- crease equity when providers may want to avoid
tions (Aotearoa New Zealand), guaranteed access to GPs registering high need patients if they are not sufficiently
and access to afterhours services (Ontario, Canada), and compensated for meeting their needs. Finally, enrolment
priority access to GPs (Norway). The registration system is likely to bring about accountability gains. With an en-
often sits alongside and has synergies with a capitation rolment system, the contracts between PHC providers
scheme that funds providers according to the number and the funding agency define the nature and extent of
and characteristics of their enrolled population [5]. the responsibility of providers towards their enrolled
It is internationally recognised that having the popula- population regarding health promotion, ongoing care,
tion enrolled with PHC providers has many benefits information management, etc. Without this formal rela-
favourable towards PHC values [4–7]. First, enrolments, tionship, the basis for accountability of providers to-
along with capitation funding, allow a shift in provider wards enrolees may not be transparent. In fact, the
responsibility from just treating sick patients to being re- literature suggests that the clearer the responsibilities of
sponsible for and actively promoting health for a well- providers towards their enrolled population, the more
defined population. Second, through its associated there are gains in health outcomes induced by enrol-
ment system [5]. It is also important to acknowledge
1
Australia, Canada, Chile, Estonia, Finland, Hungary, Ireland, Israel, that the features and potential benefits of an enrolment
Italy, the Netherlands, New Zealand, Norway, Poland, Portugal,
system are mutually reinforced by a capitation funding
Slovenia, Spain Sweden, the United Kingdom
2
, Belgium, Denmark, France, Iceland, Mexico, Latvia, Lithuania, the mechanism and the formal gatekeeping role of PHC, as
Slovak Republic, Switzerland, the United States well as dependant on the specific country context [5].Irurzun-Lopez et al. International Journal for Equity in Health (2021) 20:93 Page 3 of 11
In Aotearoa New Zealand, the 2001 PHC Strategy populations [18]. Consequently, the authors recommend
(PHCS) [8] established Primary Health Organisations ensuring enrolment by all population groups, taking into
(PHOs)3 to provide essential PHC services to their en- consideration social diversity, inequality and disadvan-
rolled populations. Having the full eligible population tage to overcome low enrolment challenges by immi-
enrolled is essential for the PHCS to succeed, as stated grant populations, such as outreach or drawing support
at its inception [8], and reiterated in a later evaluation from social networks [5]. In the case of Aotearoa New
report [9]. This means that the desirable enrolment rate Zealand, data suggests that not all those eligible are en-
for the country is 100% of the eligible population. People rolled, and that there are significant differences depend-
usually enrol with a PHO through their usual GP. PHO ing on population characteristics [19]. By analysing who
enrolment is voluntary but encouraged by incentives for is not enrolled with PHOs in Aotearoa New Zealand and
both practices and users. Enrolling allows people to how this has changed over time, we aim to achieve a
benefit from lower consultation co-payments and re- better understanding of the equity implications of the
duced costs of prescription medicines [10]. For example, enrolment system in PHC. Other countries employing
a GP consultation may cost around $50 for an enrolled patient registration systems in PHC may benefit from
adult, but around $100 if they are not enrolled [11–13]. learning from the Aotearoa New Zealand case by draw-
Enrolled population also benefit from health promotion ing lessons that could be applied to improve their own
programmes via reminders for vaccination and cervical enrolment systems and its monitoring.
cancer testing, for example. In Aotearoa New Zealand, Consequently, we investigate the extent and compos-
GP consultations are only free for the 0–14-year-old age ition of populations enrolled in PHOs, addressing the
group (since 2016) [14, 15]. GP consultations are fi- following questions:
nanced mainly by a combination of out-of-pocket pay-
ments and capitation funding transfers [16]. Accurate 1. What proportion of people in Aotearoa New
enrolments are important for funding PHOs through the Zealand are enrolled in a PHO?
capitation formula, which pays a per capita rate for the 2. How did this change between 2015 and 2019?
enrolled population and relative need based on a PHO’s 3. What do we know about the socio-demographic
socio-demographic profile. This, in turn, supports equity profile of the population not enrolled?
in that funding is then available to support all of those
who are enrolled, in contrast to a fee-for-service pay-
ment system that provides funding only for those using Methods
services. Providers then become responsible for the PHC There are twenty DHBs in Aotearoa New Zealand, re-
of the population enrolled, and accountable through sponsible for providing or funding health services in
contracts. The contracts between PHOs and their Dis- their geographical districts. Figure 1 shows the map of
trict Health Boards (DHBs) detail both funding and spe- Aotearoa New Zealand with all 20 DHBs and their en-
cific targets for PHOs. rolled population numbers, depicting the very different
However, when not all the population is enrolled, the sizes of DHBs both in terms of enrolees as well as
system may place some groups at a disadvantage, per- territory.
petuating inequities in health. International literature We analyse annual data on the proportion of people
warns of the challenge of existing low and late enrol- enrolled in a PHO. Data aggregated by District Health
ment coverage together with poor acceptability of ser- Boards (DHB) are updated quarterly at the Ministry of
vices, particularly among specific population groups [5]. Health (MoH) website. Data are labelled ‘Access to Pri-
mary Care’ [21] and defined as per the formula:
For example, if the capitation payments to practices for !
high need patients are perceived to be lower than the ac- No: o f people enrolled
Enrolment rate ¼ T otal population *100.
tual costs of delivering services to them, capitation may
lead to ‘cream skimming’ of patients with higher needs, The complexity associated with this indicator is that
i.e. discouraging practices from enrolling high needs pa- there are two different sources of data for the numerator
tients [4, 17]. A recent study in Ontario (Canada) found and denominator. The numerator comes from adminis-
that enrolment rates in new comprehensive PHC models trative data passed from PHOs to the Ministry of Health
were consistently lower amongst immigrant groups than (MoH) through the National Enrolment Service (NES).4
long-term residents, making it difficult to achieve equit-
able access to integrated PHC services for immigrant 4
The ENS is an IT enhanced system that enables real-time patient en-
rolment status data from all GPs and centralised It allows calculations
for capitation funding based on updated enrolled users. It also contains
3
PHOs are local, non-governmental, not-for- profit organisations, National Health Index (NHI) and patient demographics, which allows
funded by their local District Health Boards to manage primary health research into how demographic groups portray in different practices/
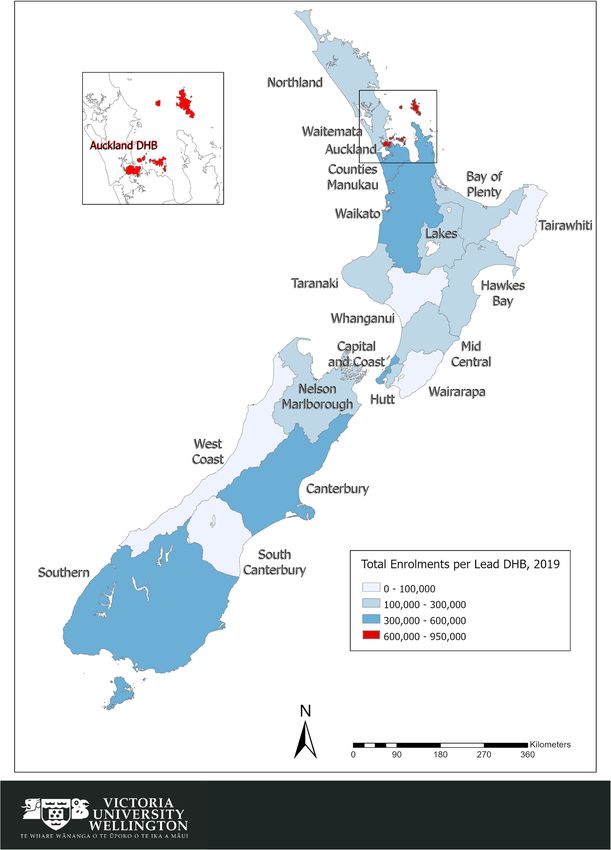
services for their enrolled populations [8]. PHOs/DHBs that inform equity analysis [23].Irurzun-Lopez et al. International Journal for Equity in Health (2021) 20:93 Page 4 of 11 Fig. 1 Aotearoa New Zealand Map - total PHO enrolments per DHB, January 2019. Source: Health Services Research Centre, Victoria University of Wellington (2019) from enrolment data from MoH (2019) [20]
Irurzun-Lopez et al. International Journal for Equity in Health   (2021) 20:93                                           Page 5 of 11

The launch of a real-time NES system in 2015 served to                    the NZ European/Other population is, more accurately,
better harmonize national data, although still there may                  the non-Māori non-Pacific NZ European/Other popula-
be differences associated with progressive adoption of                    tion. As Pacific population enrolment rates often exceed
the NES5 and data collection by PHOs. There are limita-                   100% [21], due probably to inaccurate population projec-
tions also from using the DHB of domicile, as an indi-                    tions, we present but do not discuss Pacific data in
vidual may choose to enrol with a PHO outside his/her                     detail.
DHB area [22], leading to a mismatch between numer-                         Deprivation classification is based on the New Zealand
ator and denominator at DHB level. A person can only                      Deprivation Index 2013 (NZDep). It classifies each small
be enrolled in one PHO at a time; the system de-enrols                    geographical area according to its level of socioeconomic
patients when they enrol in a different PHO or three                      deprivation based on nine variables measured in the
years following their last visit [23]. Each of these factors              2013 census. The resulting scores are ranked, then cate-
would affect reported enrolment rates.                                    gorized into quintiles, where quintile 1 represents the
  The denominator is based on population projections                      least deprived areas and quintile 5 the most deprived
from Statistics New Zealand [24] based on the 2013                        ones [31]. Due to incomplete NZDep data, we adjust en-
Census, and provided in November 2017 for 2018 data,                      rolment rates, when stratified by deprivation, by redu-
and in November 2018 for 2019 data.6 Although a new                       cing the population numbers by an equal proportion
Census took place in 2018, delays with analysis and con-                  across the five deprivation groups. The original and ad-
cerns around data quality [25, 26] have hindered its use.                 justed data are reported.
The potential misalignment between the two sources af-
fects the accuracy of the indicator; for example, under-                  Results
estimation of population growth would lead to ‘false’                     About 6% of the population was not enrolled in a PHO
high enrolment rates, as has been identified as a concern                 in 2019. Enrolment rates for the total population de-
in Counties Manukau DHB, a district with significant                      creased from 95% in 2015 to 93% in 2018, recovering
populations with low socioeconomic status [27].                           partially to 94% in 2019.
  We use annual enrolment rate aggregated data for all
DHBs by ethnicity, age and deprivation for all available
years at the time, 2015–2019, using fourth quarter data.                  PHO enrolment rates by ethnicity
The current presentation of data precludes analysis of                    Māori have lower enrolment rates than the NZ Euro-
different variables at the same time. The Aotearoa New                    pean/Other group (91% compared to 94% in 2019)
Zealand population is made up of multiple ethnic                          (Fig. 2). There is a slight closing of this gap during the
groups, including: Māori, the indigenous populations of                   period, due to improvements for Māori as well as de-
Aotearoa New Zealand, arriving in around the four-                        creasing rates for NZ European/Other. Pacific enrolment
teenth Century from East Polynesia; those of European                     rates over 100% cannot be usefully interpreted due to
origin (New Zealand European), first settling in the                      data limitations.
country around the seventeenth Century; Pacific popula-                     The breakdown by DHBs reinforces that Māori have
tions, whose origin is from the Pacific island nations;                   lower enrolment rates than the NZ European/Other
Asian groups (including Chinese and Indian), whose                        population, as it is the case in all DHBs except for
presence continues to grow and is expected to surpass                     Hawkes Bay and Northland DHBs (see Table 1 in Online
Māori population by late 2020 [28]; and other groups.                     Appendix). The enrolment rate for Māori is particularly
The data analysed classify ethnicity into three major                     low in Auckland DHB (74%).
groups: Māori, Pacific and New Zealand (NZ) European/
Other, representing around 17, 8 and 75% of population                    PHO enrolment rates by age
respectively [29]. There is a likely mismatch in the ethni-               It is young people (15–24 years old) followed by younger
city composition, between the prioritized ethnicity from                  adults (25–44 years old) that experience the lowest en-
the NES for the numerator, and from census prioritized                    rolment rates (85 and 91% respectively in July 2019).
data for the denominator [30]. The prioritization of eth-                 These groups also have had the largest decrease between
nicity for analytical purposes (Māori, then Pacific, then                 2015 and 2019 (− 2 and − 3 percentage points respect-
NZ European/Other) means that those who identify as                       ively). The highest rates of enrolment are for children
Māori and another ethnicity are categorized as Māori, so                  aged 5–14 years (100% in 2019). The differences across
                                                                          age groups widened over the study period (Fig. 3).
5
  Personal communication with Ministry of Health, Primary Care               The differences between age groups are echoed in the
Department, 28 February 2020
6                                                                         results stratified by DHB. Most DHBs have the lowest
  This suggests that population projections are updated annually from
Statistic New Zealand, though there are no notations for 2015–2017        rates of enrolment for the 15–24 years old group (see
data to confirm this.                                                     Table 2 in Online Appendix). Auckland DHB has the
Irurzun-Lopez et al. International Journal for Equity in Health (2021) 20:93 Page 6 of 11
Fig. 2 Evolution of percentage of population enrolled in a PHO, per ethnicity group, 2015–2019. Note: Y axis starts at 80%. Data source: Data
compiled from MoH 2019 [21]
lowest rates for most age groups; one in three people PHO enrolment rates by DHB
aged 15–24 years in Auckland DHB is not enrolled. The proportion of people enrolled in a PHO varies sig-
nificantly across DHBs, ranging from 83% in Auckland
PHO enrolment rates by deprivation DHB to 100% in Wairarapa and Northland DHBs (2019)
The most affluent areas have the highest enrolment rates (Table 1). Auckland DHB persistently has the lowest
(97% for quintile NZDep 1) (Fig. 4) and enrolment rates rates as well as the greatest decrease from 2015 to 2019
have increased over time. Interestingly, national enrol- (− 8 percentage points), quite different from the majority
ment rates are lowest not for people living in the most of DHBs, as enrolment rates increased or remained simi-
deprived areas (NZDep 5), but for those in the middle- lar for 14 DHBs over time.
lower end (NZDep 4) (90 and 88% respectively in 2019).
Data suggests that the differences in enrolment levels Discussion
across deprivation quintiles have widened over time. A Our results show that a significant proportion of the
similar pattern was seen when enrolment rates were ad- population is not enrolled in any PHO, and this has
justed to account for missing NZDep data (those with slightly worsened since 2015. We observe striking in-
no quintile assigned) (see Fig. 1 in Online Appendix). equities in PHC enrolment across sociodemographic
The analysis by DHBs (Table 3 in Online Appendix) groups and DHBs. Here we discuss potential explana-
shows that enrolment rates for NZDep 1 exceed 100% tions behind these trends.
for 14 DHBs in 2019, which suggests some problems First, data limitations emanate from using registered
with the data quality, most likely due to population pro- enrolments in the numerator and population projections
jections from the census at a DHB level. in the denominator. Consequently, a 100% enrolment
Fig. 3 Evolution of percentage of population enrolled in a PHO, by age group, 2015–2019. Note: Y axis starts at 80%. The line for 45–65 years old
group does not depict clearly as it largely overlaps with that of 65+ group. Data source: Data compiled from MoH 2019 [21]Irurzun-Lopez et al. International Journal for Equity in Health (2021) 20:93 Page 7 of 11
Fig. 4 Evolution of percentage of population enrolled in a PHO, per deprivation quintile, 2015–2019. Note: Y axis starts at 80%. Data source: Data
compiled from MoH 2019 [21]
rate is unlikely to be achievable, as some people included the country (i.e. counted in the numerator but not the
in the ‘usually resident population’ are not eligible for denominator).
publicly funded health services and therefore cannot Second, as Auckland DHB comprises around 21% of
enrol with PHOs [32]. Also, there may be people who national enrolments, it highly influences national rates.
are enrolled with a PHO but are not currently living in Enrolment rates in Auckland DHB are particularly
Table 1 Variation of PHO enrolment rates across DHBs, 2015–2019
DHB of Domicile 2015 2016 2017 2018 2019 Change 2015–2019
(% points)
Auckland 91% 86% 84% 82% 83% −8
Bay of Plenty 97% 99% 98% 99% 100% 2
Canterbury 94% 93% 93% 93% 93% −1
Capital & Coast 94% 94% 94% 93% 93% −2
Counties Manukau 99% 97% 97% 97% 97% −1
Hawkes Bay 96% 97% 97% 97% 98% 2
Hutt Valley 97% 98% 98% 98% 98% 1
Lakes 99% 99% 98% 97% 98% −1
Midcentral 93% 92% 93% 93% 94% 1
Nelson Marlborough 96% 96% 97% 97% 99% 3
Northland 98% 100% 100% 99% 99% 1
South Canterbury 98% 98% 97% 97% 98% 0
Southern 93% 92% 92% 92% 95% 2
Tairawhiti 97% 98% 98% 98% 98% 1
Taranaki 92% 93% 94% 94% 96% 3
Waikato 95% 95% 95% 94% 95% 0
Wairarapa 97% 99% 100% 101% 100% 3
Waitemata 94% 93% 92% 91% 92% −1
West Coast 84% 92% 93% 94% 95% 11
Whanganui 97% 98% 99% 99% 99% 2
NATIONAL 95% 94% 94% 93% 94% −1
Data source: Data compiled from MoH 2019 [21].Irurzun-Lopez et al. International Journal for Equity in Health (2021) 20:93 Page 8 of 11
susceptible to methodological issues given differences in population mobility for the 15–24 years group may be
enrolments when considering different definitions of another factor, but the low rate for young people in
DHB used in the data: DHB of domicile or lead DHB7: Auckland DHB does not seem to be substantiated by
457,278 vs 894,147 enrolees respectively in 2019 [19]. over-enrolments in other DHBs. Another explanation
Some families may attend a GP in a location different to is that young people tend to have lower incomes and
their domicile, resulting into enrolling in a different consultation fees may deter them from visiting a GP,
DHB; however, this does not seem to fully explain the even with the lower fees for those aged 14–17. The
low rates in Auckland DHB, as the other two neighbour- low enrolment rates of young people suggest the need
ing DHBs serving Auckland area - Counties Manukau to monitor that their needs are being met. Promoting
and Waitemata DHBs - have rates below 100% and that young people’s enrolment in PHOs may be a way to
are decreasing. Other factors for the low enrolment rates support their connection with health services. World-
may relate to Auckland having a higher proportion of wide, it is recognised [40] that adolescents and youth
young people, a growing population through internal face specific challenges in accessing health services
migration8 and a potential higher proportion of residents around issues of staff attitudes, age-appropriate
not qualifying for New Zealand public funding for health environment, etc., and that promoting youth and
care. These factors may contribute to underestimation of adolescents-friendly health services is key to enhance
real enrolment rates. their utilization by young populations. In addition,
Beyond data and socio-demographic factors, there Zeratsion [41] advocates raising the age threshold for
seem to be issues suggesting worsening in PHC ac- zero PHC fees based on the experience in Norway of
cess. Some practices are not taking new enrolees as increases in PHC use among adolescents following
they reach their full capacity, in what is called ‘closed co-payment exemptions, and that late adolescents
books’. About 11% of GPs reported that their prac- would have more health needs that younger ones.
tices did not accept new enrolments in 2018, up from We would expect newly born children be enrolled
10% in 2017, and it is even higher (17%) for practices and remain so in their early years given that standard
identified as not clearly urban or rural (2018) [33], consultations are free for young children, their needs
which suggests we need to identify the profile of for a greater intensity of visits for follow ups and vac-
population served by these practices. This relates to cinations, and because providers can pre-enrol new-
the recognised decreasing rate of GPs per population, borns before their full enrolment process is completed
and further shortages of GPs are expected as GPs [42]. Enrolment rates like 88% in West Coast DHB or
reach retirement age [34]. Current and expected fu- 92% in Capital Coast DHB suggest potential data is-
ture GP shortages are a global issue, also reported in sues such as a potential higher birth rate projected in
Australia [35, 36] and the UK [37] for example. The these two DHBs that would lead to underestimation
issue of closed books would suggest that people are of real enrolment rates. Children aged 5–14 years
willing but unable to enrol. Another factor may be have the highest enrolment rates attained for any age
the possibility of people not enrolling because of legal group, above 97% for nearly all DHBs. This backs up
or immigration concerns, as these are one of the the positive effect of zero fees on enhancing access to
recognised barriers to accessing care by migrant pop- health services for children. Moreover, if it is possible
ulations worldwide [38]. to achieve such high rates for those aged 5–14, it
The lower enrolment rates for youth and younger may be possible for other age groups also. A sugges-
adults may seem reasonable given that people aged tion would be using these highest enrolment rates for
15–24 are generally healthy and have a lower level of children aged 5–14 as the benchmark for the rest of
need for medical care. Yet, the New Zealand Health age groups to achieve, perhaps a more realistic target
Survey (NZHS) reveals that about 24% of the 15–24 than 100%.
years old and 26% of the 25–44 years old groups rec- In relation to ethnicity, not only are Māori less
ognise unmet need for PHC, compared to 18% by likely to be enrolled than NZ European/Other popula-
those 65+ years (pooled 2014–2017 data) [39]. Higher tion nationally (91% vs 94% in 2019), but this dispar-
ity persists throughout the period and it is reflected
7 by all but two DHBs in 2019. This difference may be
There are two categories of DHB used in health statistics in Aotearoa
New Zealand: ‘DHB of domicile’ - based on the address of the enrolee, partly explained by the Māori population being youn-
and ‘lead DHB’ - used for capitation funding transfers. A PHO can ger. Other factors include barriers to accessing PHC
have agreements with several DHBs but receives all its funding from services, such as financial, transport and child care
the lead DHB.
8 costs; Māori children and adults are more likely than
Assuming population projections account for these population
movements and with a time lag in enrolling with a GP in a new non-Māori to have unmet need and unfilled prescrip-
location. tions [43]; in 2016/17, the prevalence of one or moreIrurzun-Lopez et al. International Journal for Equity in Health (2021) 20:93 Page 9 of 11
types of unmet need9 reported by Māori adults was health outcomes between those enrolled and not en-
38%, compared to 28% for non-Māori [43]; and about rolled, which could be guided by similar analysis in On-
22% of Māori aged 15+ years had unmet need for GP tario, Canada [18, 46] and related research in New
services due to cost in the last year, compared to 13% Zealand [47]. We also suggest examining the relation-
for NZ European/Other [44, 45]. Nonetheless, the ship between enrolment data with other variables such
ethnicity breakdown is particularly susceptible to in- as continuity of care and other health care usage (emer-
consistencies given that the percentage of people gency department, hospitalization), to identify more ac-
identified as Māori is likely to be higher in the nu- curately the population who is or not ‘attached’ to their
merator than the denominator, as argued by Chan primary care provider, as done in Canada [46]. Further
et al. [30] analysis could also include understanding how promot-
The deprivation analysis points at the widening gap ing PHO enrolment may enhance continuity of care.
between deprivation quintiles. We have identified a data Individual-level enrolment data would render more de-
caveat here,, the contradictory trends between specific tail and allow to control for the effects of multiple vari-
quintiles and the overall national picture (Fig. 4). These ables. A multi-country comparison of enrolment rates
may be due to the exclusion from the quintile break- could render a better understanding of for example tar-
down of those not having a deprivation level assigned, gets for specific age or deprivation groups. Finally, our
but who are included in the national rate and population understanding of how an enrolment system may serve to
estimations10; this problem may be more accentuated promote equity in health care would benefit from con-
for year 2019 when automatic NES enrolment was fully sidering a wider understanding of equity in health that
functional and the proportion of people with missing takes into account acceptability [48], including the per-
NZDep scores went from 1.22% (2018) to 2.94% (2019). ceptions of potential users around equity and access as
Our attempt to align enrolments with national figures recommended by Mooney [49]. This could be particu-
helps to understand the time trends, though it remains larly relevant for Māori and young and adolescent po-
imprecise in itself; missing data is probably not random, tential users [48].
so applying it equally to the five groups introduces a
bias, just as missing data does. Further work is required Conclusion
to better understand the relationship between PHO Having as many people as possible enrolled with a PHC
enrolments and deprivation levels. All in all, the fact that provider is instrumental to maximising the full potential
enrolment rates are higher for the most deprived deciles of PHC for all, and to enhancing equitable access to ser-
than for those in the middle-lower end suggests the vices. In Aotearoa New Zealand, not all eligible people
positive impact of targeted schemes in enhancing access are enrolled with a PHO and inequities exist between
of the most deprived areas. Still, NZHS suggests that un- socio-demographic and geographic groups. We have dis-
met need for PHC remains highest for the most deprived cussed potential reasons behind the enrolment gap, both
quintile (34%) and fairly constant between 2011 and methodological inconsistencies as well as reasons point-
2017, compared to 23% for the least deprived quintile. ing at worsening access to health care and inequities.
The results and implications discussed point at the We need to better understand why people are not enrol-
need to consider additional ways to ensure specific ling with a PHO and its implications. We suggest using
groups of people do enrol, such as outreach or drawing more intensively PHO enrolment rates as a proxy to
support from social networks [5]. Our findings are con- monitor PHC access and equity and to track progress
sistent with international literature [4, 5, 18] in that towards achieving the goals of the PHCS. In particular,
PHC enrolment rates serve to identify inequities in reducing disparities across population groups could be
health care access. Efforts should be made to reduce used to track equity in health access. We need to under-
methodological flaws of the indicator as recommended stand the reasons behind the potential enrolment gap
in our deprivation analysis and more broadly by Chan and widening of inequities identified, in particular the
et al. [30] We recommend investigating differences in lower enrolments of Māori and young populations and
widening gaps across deprivation areas.
9
The research deepens our understanding of the enrol-
Unmet need for primary health care indicates whether people
ment rates and its potential pitfalls specially in relation
experience any of the following barriers to accessing primary health
care in the past 12 months: Unmet need for a GP due to cost; Unmet to equity in the case of Aotearoa New Zealand. These
need for an after-hours medical centre due to cost; Unmet need for a recommendations apply not only for Aotearoa New Zea-
GP due to lack of transport; Unmet need for an after-hours medical land but for all countries using patient enrolment sys-
centre due to lack of transport; Inability to get an appointment at their
usual medical centre within 24 h [39].
tems. These countries can learn from Aotearoa New
10
Personal communication with Ministry of Health, Primary Care Zealand’s differences in enrolments across districts, age,
Department, 28 February 2020. ethnicity and deprivation levels to draw lessons forIrurzun-Lopez et al. International Journal for Equity in Health (2021) 20:93 Page 10 of 11
improving equity in health care. It is important to tease Declarations
out and monitor over time the extent and composition
Ethics approval and consent to participate
of the populations not being enrolled and the reasons Not applicable.
and implications for health access and outcomes in
order to keep track of equity. These equity concerns Consent for publication
need to be considered when adapting PHC enrolment Not applicable.
systems and associated funding models across countries.
The underlying motivation of this study is that we Competing interests
The authors declare that they have no competing interests
need good proxies to monitor the performance of PHC
services; having the highest possible proportion of the Received: 7 August 2020 Accepted: 12 March 2021
population enrolled is the starting point to examine both
performance and equity in a system using patient enrol-
ments. For countries with this system, having more ro- References
1. World Health Organization (WHO). 1978. Declaration of Alma-Ata:
bust indicators and data around the enrolment gap will International Conference on Primary Health Care, Alma-Ata, USSR, 6–12
provide more precise and evidence-based understanding September 1978. Geneva. https://www.who.int/publications/almaata_decla
of the equity challenges in PHC. This in turn will enable ration_en.pdf. Accessed 2 May 2020.
2. Starfield B, Shi L, and Macinko J. 2005. Contribution of primary care to
prioritizing the redress of inequities in health policy. health systems and health. The Milbank Quarterly, Vol. 83, No. 3, 2005 (pp.
PHC advocates need to promote improving these indica- 457–502).
tors and their use as a starting point to monitor and 3. Organization for Economic Co-operation and Development (OECD). 2020.
Realising the potential of primary health care. OECD Health Policy Studies,
prioritize equity in health care. OECD Publishing, Paris, https://doi.org/https://doi.org/10.1787/a92adee4-en.
4. Kalucy L, Katterl R, Jackson-Bowers E, Hordacre A-L. Models of patient
Abbreviations enrolment. PHC RIS. Policy Issue Review. Adelaide: Primary Health Care
DHB: District Health Board; GP: General Practitioner; MoH: Ministry of Health Research & Information Service; 2009.
(New Zealand); NES: National Enrolment System; NZ: New Zealand; 5. Loewenson R, Simpson S with Nolen A and country case study teams. 2014.
NZDep: New Zealand Deprivation Index; NZHS: New Zealand Health Survey; ‘Strengthening primary care to improve health: learning for the USA from
OECD: Organisation for Economic Co-operation and Development; high- and middle-income countries’, Training and Research Support Centre,
PHC: Primary Health Care; PHCS: Primary Health Care Strategy (New Zealand, August 2014.
2001); PHO: Primary Health Organization 6. World Health Organization (WHO). 2008. The World Health Report 2008:
primary health care now more than ever. Geneva: WHO.
7. Training and Research Support Centre (TARSC). 2014. Strengthening primary
Supplementary Information care in the USA to improve health: learning from high- and middle-income
The online version contains supplementary material available at https://doi. countries. TARSC, November 2014.
org/10.1186/s12939-021-01423-4. 8. Ministry of Health (New Zealand). The primary health Care strategy.
Wellington: Ministry of Health; 2001.
Additional file 1 Table S1. Percentage of population enrolled in a 9. Barnett P., Smith J., and Cumming J. 2009. The roles and functions of
PHO, per ethnicity groups and DHBs, 2019. Table S2. Percentage of primary health organisations. Wellington: health services Research Centre.
population enrolled in a PHO for age groups and DHBs, 2019. Table S3. https://www.wgtn.ac.nz/health/centres/health-services-research-centre/docs/
Percentage of population enrolled in a PHO, per deprivation group reports/Roles-and-Functions-of-PHOs.pdf. Accessed 20 June 2020.
(NZDep) and DHBs, 2019. Figure S1. Evolution of percentage of 10. Ministry of Health (New Zealand). 2019. Enrolment in a primary health
population enrolled in a PHO, per adjusted* deprivation quintiles, 2015- organisation. https://www.health.govt.nz/our-work/primary-health-care/a
2019. bout-primary-health-organisations/enrolment-primary-health-organisation.
Accessed 6 Aug 2019.
11. Cornwall Medical Centre. 2021. Health Care Service – Fees. https://www.hea
Acknowledgements lthpoint.co.nz/gps-accident-urgent-medical-care/gp/cornwall-medical-
With thanks to Megan Pledger for her insights on early analysis and centre/#fees.
contribution to NZDep analysis, to Karen McBride-Henry for her revision, and 12. Ellerslie Medical Centre. 2021. Consultation Fees 1 November 2020. https://
to Emory Beck for the mapping work . www.ellersliemedical.co.nz/fees/.
13. Silverstream Health Care. 2021. Patient fees and forms- Standard GP
consultation. https://sshc.co.nz/patient-forms/.
Authors’ contributions
14. New Zealand Council of Trade Unions – Te Kauae Kaimahi. 2019.
MIL: conceptualization, data analysis; writing first draft. MJ: conceptualization,
Submission of the new Zealand Council of Trade Unions Te Kauae Kaimahi
review, writing- review & editing. JC: conceptualization, writing- review &
on the review of the New Zealand health and disability sector. https://
editing, funding acquisition. The author(s) read and approved the final
wwwunionorgnz/wp-content/uploads/2019/12/Review-of-the-Health-and-
manuscript.
Disability-Systempdf. Accessed 25 Feb 2021.
15. Health and Disability System Review. 2019. Health and disability system
Funding review - interim report. Hauora Manaaki ki Aotearoa Whānui – Pūrongo mō
Funded through the Health Research Council (HRC) - “Enhancing Primary Tēnei Wā.Wellington: HDSR.
Health Care Services to Improve Health in Aotearoa/New Zealand” grant. The 16. Jeffreys M, Irurzun Lopez M, Russell L, Smiler K, Ellison-Loschmann L,
HRC had no role in the design, analysis or writing of this study. Thomson M, Cumming J. 2020. Equity in access to zero-fees and low-cost
Primary Health Care in Aotearoa New Zealand: Results from repeated waves
Availability of data and materials of the New Zealand Health Survey, 1996–2016. Health Policy, Volume 124,
the datasets analysed in the current study are publicly available from New Issue 11, 2020, Pages 1272–1279, https://doi.org/https://doi.org/10.1016/j.
Zealand Ministry of Health (https://www.health.govt.nz/our-work/primary- healthpol.2020.08.009.
health-care/about-primary-health-organisations/enrolment-primary-health- 17. Van Barneveld EM, Lamers LM, van Vliet RCJA, van de Ven WPMM. Ignoring
organisation). small predictable profits and losses: a new approach for measuringIrurzun-Lopez et al. International Journal for Equity in Health (2021) 20:93 Page 11 of 11
incentives for cream skimming. Health Care Manage Sci. 2000;3(2000):131– 38. International Organization for Migration (IOM). Social Determinants of
40. https://doi.org/10.1023/A:1019029004807. Migrant Health. https://www.iom.int/social-determinants-migrant-health.
18. Batista R, Pottie KC, Dahrouge S, Manuel DG, Tanuseputro P, Mark AE, Ng E. Accessed 22 Feb 2021.
Impact of health care reform on enrolment of immigrants in primary care in 39. Ministry of Health (New Zealand). 2020. New Zealand Health Survey Data
Ontario, Canada. Fam Pract. 2019;2019:445–51. https://doi.org/10.1093/fa Explorer. Indicator: Experienced one or more types of unmet need for
mpra/cmy082. primary health care in the past 12 months. https://minhealthnz.shinyapps.
19. Ministry of Health (New Zealand). Enrolment in a primary health io/nz-health-survey-2014-17-regional-update/_w_43a52afa/_w_431f5e21/
organisation. 2019. https://www.health.govt.nz/our-work/primary-health-ca #!/subgroup-results. Accessed 2 Mar 2020.
re/about-primary-health-organisations/enrolment-primary-health-organisa 40. Ambresin AE, Bennett K, Patton GC, Sanci LS, Sawyer SM. Assessment of
tion. Accessed 6 Aug 2019. youth-friendly health care: a systematic review of indicators drawn from
20. Ministry of Health (New Zealand). 2019. Enrolment in a primary health young people’s perspectives. J Adolesc Health. 2013;52(2013):670–81.
organisation - enrolment demographics. https://wwwhealthgovtnz/our- https://doi.org/10.1016/j.jadohealth.2012.12.014.
work/primary-health-care/about-primary-health-organisations/enrolment- 41. Zeratsion H T. 2013. The effect of exemption from co-payment on
primary-health-organisation. Accessed 9 Nov 2019. adolescent utilisation of primary health care - the case of Norway. Master
21. Ministry of Health (New Zealand). 2019. Access to primary care. https:// thesis Department of Health Management and Health Economics University
www.health.govt.nz/our-work/primary-health-care/about-primary-health- of Oslo may 15, 2013. https://www.duo.uio.no/bitstream/handle/10852/3
organisations/enrolment-primary-health-organisation. Accessed 6 Aug 2019. 5909/Zeratsion_master.pdf?sequence=1&isAllowed=y. Accessed 5 Aug 2020.
22. Ministry of Health (New Zealand). 2011. Primary health organisation- data 42. Ministry of Health (New Zealand). Newborn pre-enrolment toolkit.
Mart- data dictionary. Version 12 September 2011 https://wwwhea Wellington: Ministry of Health; 2012.
lthgovtnz/system/files/documents/publications/pho-data-dictionary-v1-2pdf. 43. Ministry of Health (New Zealand). Wai 2575 Māori health report trends.
Accessed 6 May 2020. Wellington: Ministry of Health; 2019.
23. Ministry of Health (New Zealand). 2019. National Enrolment Service – 44. Ministry of Health (New Zealand). 2020. New Zealand Health Survey Data
frequently asked questions. Question and Answers. https://www.health.govt. Explorer – Indicator: Unmet need for GP services due to cost for adults
nz/our-work/primary-health-care/primary-health-care-subsidies-and-services/ (aged 15+ years). https://minhealthnz.shinyapps.io/nz-health-survey-2014-1
national-enrolment-service. 7-regional-update/_w_43a52afa/_w_431f5e21/#!/subgroup-results. Accessed
24. StatsNZ. 2020. Home page. https://www.stats.govt.nz/. Accessed 9 May 2 Mar 2020.
2020. 45. Ministry of Health (New Zealand). 2020. New Zealand Health Survey Data
25. StatsNZ. 2020. Data quality for 2018 Census. Available at https://www.stats. Explorer – Indicator: self-rated health. https://minhealthnz.shinyapps.io/nz-
govt.nz/2018-census/data-quality-for-2018-census. health-survey-2018-19-annual-data-explorer/_w_f1203246/_w_d22568ba/
26. Kukutai T, Cormack D. Census 2018 and implications for Māori. New Zealand #!/explore-indicators.
Popul Rev. 2018;44:131–51. 46. Green, M E. 2019. Patient attachment to their primary care provider: Primary
27. Jackson G., Cheuk Chan W., 2020. “Population count issues affecting care reform in Ontario in 2019. Presented at the 11th Health Services and
equitable health funding allocations”. Counties Manukau DHB report, Policy Research Conference, Auckland December 2019.
unpublished. 47. Raj Silwal P, Tenbensel T and Exeter D. 2019. Health system performance
28. Kanengoni B, Andajani-Sutjahjo S, Holroyd E. Setting the stage: reviewing variation in New Zealand. How important are population characteristics?
current knowledge on the health of New Zealand immigrants—an Presentation at 11th Health Services and Policy Research Conference,
integrative review. PeerJ. 2018;6:e5184. https://doi.org/10.7717/peerj.5184. Auckland, December 2019.
29. StatsNZ. 2019. New Zealand’s population reflects growing diversity. https:// 48. Thiede M, Akweongo P, McIntyre D. ‘Exploring the dimensions of equity’, in
wwwstatsgovtnz/news/new-zealands-population-reflects-growing-diversity McIntyre D and Mooney G (eds), the economics of health equity.
Accessed 9 May 2020. Cambridge: Cambridge University Press; 2007.
49. Mooney G. 2009. Is it not time for health economists to rethink equity and
30. Chan W C, Papaconstantinou D, Winnard D. 2015. Service planning
access? Health economics, policy and law (2009), 4: 209–221. Cambridge
implications of estimating Primary Health Organisation enrolment rate
University Press. https://doi.org/10.1017/S1744133109004848, Is it not time
based on a Health Service Utilisation population rather than a census-
for health economists to rethink equity and access?.
derived population. NZMJ 24 July 2015, Vol 128 No 1418. ISSN 1175-8716.
31. Otago University. 2014. NZDep2013 index of deprivation. https://wwwhea
lthgovtnz/publication/nzdep2013-index-deprivation. Accessed 10 Nove Publisher’s Note
2019. Springer Nature remains neutral with regard to jurisdictional claims in
32. Ministry of Health (New Zealand). 2018. Guide to eligibility for publicly published maps and institutional affiliations.
funded health services. https://www.health.govt.nz/new-zealand-health-
system/eligibility-publicly-funded-health-services/guide-eligibility-publicly-
funded-health-services.
33. The Royal New Zealand Colleague of General Practitioners (RNCGP). 2019.
2018 general practice workforce survey – demographics, working
arrangements, vacancies, retirement intentions, Wellbeing, GP income.
34. The Royal New Zealand Colleague of General Practitioners (RNCGP). 2016.
Rural general practice in 2015. Education, recruitment, retention and
standards.
35. Scott J, Larson A, Jefferies F, Veendendaal B. Small-area estimates of general
practice workforce shortage in rural and remote Western Australia. Aust J
Rural Health. 2006;14(5):209–13. https://doi.org/10.1111/j.1440-1584.2006.
00811.x.
36. Deloitte. 2019. General practitioner workforce report 2019. https://www2
deloittecom/content/dam/Deloitte/au/Documents/Economics/deloitte-au-
economics-general-practitioners-workforce-2019-021219pdf. Accessed 5 Aug
2020.
37. Baird B, Charles A, Honeyman M, Maguire D and Das P. 2016.
Understanding pressures in general practice. London: The King’s Fund
https://wwwkingsfundorguk/sites/default/files/field/field_publication_file/
Understanding-GP-pressures-Kings-Fund-May-2016pdf. Accessed 5 Aug
2020.You can also read