Overcoming barriers to the registration of new plant varieties under the DUS system - Nature
←
→
Page content transcription
If your browser does not render page correctly, please read the page content below
ARTICLE
                   https://doi.org/10.1038/s42003-021-01840-9                OPEN

                  Overcoming barriers to the registration of new
                  plant varieties under the DUS system
                  Chin Jian Yang            1,   Joanne Russell2, Luke Ramsay2, William Thomas2, Wayne Powell1 & Ian Mackay                                       1,3 ✉

                  Distinctness, Uniformity and Stability (DUS) is an intellectual property system introduced in
                  1961 by the International Union for the Protection of New Varieties of Plants (UPOV) for
                  safeguarding the investment and rewarding innovation in developing new plant varieties.
                  Despite the rapid advancement in our understanding of crop biology over the past 60 years,
                  the DUS system has changed little and is still largely dependent upon a set of morphological
1234567890():,;

                  traits for testing candidate varieties. As the demand for more plant varieties increases, the
                  barriers to registration of new varieties become more acute and thus require urgent review to
                  the system. To highlight the challenges and remedies in the current system, we evaluated a
                  comprehensive panel of 805 UK barley varieties that span the entire history of DUS testing.
                  Our findings reveal the system deficiencies such as inconsistencies in DUS traits across
                  environments, limitations in DUS trait combinatorial space, and inadequacies in currently
                  available DUS markers. We advocate the concept of genomic DUS and provide evidence for a
                  shift towards a robust genomics-enabled registration system for new crop varieties.

                  1 Scotland’s Rural College (SRUC), Kings Buildings, West Mains Road, Edinburgh EH9 3JG, UK. 2 The James Hutton Institute, Invergowrie, Dundee DD2 5DA, UK.
                  3 IMplant   Consultancy Ltd., Chelmsford, UK. ✉email: i.j.mackay@gmail.com

                  COMMUNICATIONS BIOLOGY | (2021)4:302 | https://doi.org/10.1038/s42003-021-01840-9 | www.nature.com/commsbio                                             1
ARTICLE COMMUNICATIONS BIOLOGY | https://doi.org/10.1038/s42003-021-01840-9
C
rop breeding involves a considerable investment of time, leaves, ears, and spikelets (Table 1). Currently, within the UK,
resources, and money by seed companies to produce barley DUS trait data are publicly available from the National
improved varieties of plants. Plant Variety Rights (PVR) is Institute of Agricultural Botany (NIAB) in England and the Sci-
a form of intellectual property introduced in 1961 by the Inter- ence and Advice for Scottish Agriculture (SASA) in Scotland. We
national Union for the Protection of New Varieties of Plants obtained the data from these two sources and supplemented it
(UPOV) to protect the breeders’ investment in creating new with additional data from Cockram et al.7. The NIAB data serves
varieties, support innovation, and serve market demand1. For as our primary data as it is more complete than the SASA data,
almost 60 years, the protection of new plant varieties through the which was only used for comparative analysis. 21 DUS traits are
award of PVR relied on passing two tests: Distinctness, Uni- scored on a scale of 1 to 9 or a smaller subset of the scale, and
formity, and Stability (DUS), and Value for Cultivation and Use seven traits are scored on a binary scale, all of which were based
(VCU). DUS requires the new variety to be distinct from the on criteria defined in Supplementary Data 1. Of the 27 traits
common knowledge varieties, uniform across seeds that con- excluding seasonal type, two traits are not segregating in spring
stitute the variety, and stable across environments2. DUS is barley and one in winter barley (Supplementary Fig. 1). The
usually defined by a set of morphological traits, although isozyme missing rate in the DUS trait data ranges from 0 to 78%, with
electrophoresis and molecular markers are occasionally used3. On only 5 traits above 10%. In addition, our analysis included marker
the other hand, VCU requires the new crop variety to demon- data for 805 varieties from the IMPROMALT collection (http://
strate improvement in yield, biotic or abiotic resistance, and www.barleyhub.org/projects/impromalt/), of which 710 had DUS
quality characteristics4. Unlike VCU traits such as yield and trait data.
disease resistance that have been the center of attention in crop
breeding5, the DUS system has received relatively little attention
despite its pivotal role in the registration of new varieties6,7. DUS trait inconsistencies across environments. Comparison
The pressure on the current DUS system stems from multiple across DUS trait scoring organizations (NIAB vs. SASA) showed
issues. As more new varieties arise, the DUS trait combinatorial an overall consistency in two-thirds of the DUS trait scores
space becomes more limited and requires additional effort in (Fig. 1a and b). For each variety, the consistency was measured as
breeding unique DUS trait combinations. Many DUS traits have the proportion of DUS traits that are exact matches between the
low heritabilities7 which means more trait variability due to two organizations, and the overall consistency was derived from
environmental fluctuations and limited reliability of DUS trait the means of all variety consistencies. In most cases, the trait
scores outside of the trial environment. While the current system is score differences within each variety are small (mean = 0.55, sd
well established for major crops, it is hard to implement in minor or = 0.28, n = 395, two-sided t-test p < 0.05) (Fig. 1a, Supplementary
orphan crops since the traits for DUS are hard to determine8,9. Fig. 2). These differences are expected given that the DUS traits
Furthermore, the current DUS system is largely designed for inbred were scored in different environments by different DUS inspec-
species or varieties which is hardly practical in outbreeding species tors. There is little to no bias in trait score differences between
or hybrid varieties10. Lastly, the current definitions of new varieties2 NIAB and SASA (Supplementary Fig. 2) except for trait 6 (flag
and essentially derived varieties11 rely on a fine line concerning leaf: glaucosity of the sheath) and trait 25 (grain: spiculation of
which characteristics are considered essential, which complicates an inner lateral nerves of the dorsal side of lemma). On average, trait
objective evaluation of a candidate variety12,13. 6 is about 1 score higher in NIAB compared to SASA while trait
Over the years, many attempts at improving the DUS system 25 is about 1 score lower in NIAB, which may reflect the envir-
have met with little success. Suggestion for the use of molecular onmental effects on these traits. Regardless, with the reduction in
markers in DUS traces back to at least 1990 using minisatellites in DUS trait combinatorial space as measured by shrinkage in DUS
soft fruits14. Since then, more molecular markers have been trait Manhattan distances over time (Fig. 1c & d), especially in
proposed for DUS, for example, 28 SSR markers in maize15, 25 spring barley, small trait score differences can easily complicate
SNP markers in barley16, and 5 SSR markers in rice17. However, variety identification. Manhattan distances are the sums of
the number of available DUS markers that have been proposed absolute differences between any two variables and lower dis-
thus far is too few and low throughput. More recently, larger tances imply reduced variation in DUS traits among the com-
marker sets using SNP arrays have been suggested, including pared varieties. This may risk some barley varieties failing DUS
3,072 SNP markers in maize18 and 6,000 SNP markers in soy- testing in one country but not another due to variations in DUS
bean19. As of now, none of these have been officially adopted by traits. Besides, the inconsistencies are present in the majority
the UPOV. Instead, UPOV currently requires the use of mole- (392/395) of the barley varieties compared, which suggests that
cular markers only when they correlate with the DUS traits the inconsistencies are common and excludes the possibility of
perfectly20, which does not reflect the advances in genotyping poor data handling by either organization. Given the roles of the
technologies and understanding of DUS trait genetics. DUS system in granting PVR, a two-third consistency across
Using the UK barley DUS system as a test case (panel of organizations is inadequate and risky.
805 spring, winter, and alternative barley varieties that have been Of all 28 barley DUS traits, 15 have low heritabilities (h2 < 0.50)
accepted into the UK national list (NL), as well as 28 DUS traits), (Table 1, Supplementary Table 1) and are thus contradictory for
we demonstrate both the challenges and opportunities for the DUS purposes. As previously defined by Falconer and Mackay21,
creation of a new DUS system. We show that the current DUS heritability is a measure of “degree of correspondence between
system is lacking in consistencies across the environment, limited phenotypic value and breeding value”. Therefore, for any given
in trait combinatorial space, and impaired by a non-optimal variety, traits with low heritabilities have little replicability in trait
marker system. We suggest the idea of genomic DUS for over- values obtained from different environments (e.g. year, location).
coming various issues in the current DUS system and demon- As expected, the DUS trait inconsistencies across scoring
strate its advantages in plant variety registration. organizations are negatively correlated (−0.67) with heritabilities
(Fig. 1e). Similar results were observed when the heritabilities
were calculated from spring and winter barley separately.
Results and discussion Consequently, instead of a fair evaluation of the genetic merits
DUS trait and marker data. The 28 barley DUS traits include the underlying new varieties, the current DUS system simply
seasonal type and 27 above-ground morphologies, including determines new varieties based on environmental stochasticity.
2 COMMUNICATIONS BIOLOGY | (2021)4:302 | https://doi.org/10.1038/s42003-021-01840-9 | www.nature.com/commsbioCOMMUNICATIONS BIOLOGY | https://doi.org/10.1038/s42003-021-01840-9 ARTICLE
Table 1 DUS trait names and heritabilities, standard errors in parentheses.
Trait Name h2
Combined Spring Winter
1 Kernel: colour of the aleurone layer 0.78 (0.04) 0.16 (0.06) 0.79 (0.06)
2 Plant: growth habit 0.25 (0.05) 0.17 (0.06) 0.24 (0.07)
3 Lowest leaves: hairiness of leaf sheaths 0.75 (0.04) NA 0.69 (0.07)
4 Flag leaf: intensity of anthocyanin colouration of auricles 0.74 (0.05) 0.19 (0.06) 0.84 (0.08)
5 Flag leaf: attitude 0.28 (0.13) 0.28 (0.19) 0.25 (0.16)
6 Flag leaf: glaucosity of sheath 0.12 (0.04) 0.05 (0.03) 0.10 (0.05)
7 Time of ear emergence (first spikelet visible on 50% of ears) 0.28 (0.05) 0.20 (0.06) 0.26 (0.07)
8 Awns: intensity of anthocyanin colouration of tips 0.67 (0.05) 0.09 (0.04) 0.83 (0.08)
9 Ear: glaucosity 0.42 (0.05) 0.45 (0.07) 0.33 (0.08)
10 Ear: attitude 0.25 (0.05) 0.26 (0.07) 0.17 (0.06)
11 Plant: length (stem, ear and awns) 0.17 (0.04) 0.13 (0.05) 0.14 (0.06)
12 Ear: number of rows 1.00 (0.01) NA 1.00 (0.03)
13 Ear: shape 0.10 (0.04) 0.04 (0.03) 0.09 (0.05)
14 Ear: density 0.23 (0.05) 0.14 (0.05) 0.24 (0.07)
15 Ear: length (excluding awns) 0.18 (0.05) 0.05 (0.04) 0.29 (0.08)
16 Awn: length (compared to ear) 0.18 (0.04) 0.15 (0.05) 0.11 (0.05)
17 Rachis: length of first segment 0.34 (0.05) 0.32 (0.07) 0.28 (0.07)
18 Rachis: curvature of first segment 0.26 (0.05) 0.25 (0.07) 0.20 (0.07)
19 Ear: development of sterile spikelets 1.00 (0.04) 1.00 (0.06) 1.00 (0.09)
20 Sterile spikelets: attitude (in mid-third of ear) 0.64 (0.06) 0.63 (0.08) 0.49 (0.10)
21 Median spikelet: length of glume and its awn relative to grain 0.15 (0.04) 0.07 (0.04) 0.18 (0.06)
22 Grain: rachilla hair type 1.00 (0.01) 1.00 (0.02) 0.84 (0.05)
23 Grain: husk 0.01 (0.02) 0.04 (0.03) 0.00 (0.02)
24 Grain: anthocyanin colouration of nerves of lemma 0.69 (0.05) 0.31 (0.07) 0.78 (0.07)
25 Grain: speculation of inner lateral nerves of dorsal side of lemma 0.74 (0.04) 0.49 (0.07) 0.78 (0.06)
26 Grain: hairiness of ventral furrow 0.96 (0.02) 0.65 (0.07) 0.94 (0.04)
27 Grain: disposition of lodicules 0.91 (0.02) 0.99 (0.03) NA
28 Seasonal type 1.00 (0.00) NA NA
Limitations to DUS trait combinatorial space due to genetic datasets having a smaller sample size and thus lower power.
gain in yield. 12 out of 21 barley DUS traits have non-zero Another reason is that some traits are not segregating or are rare
genetic correlations with yield in spring barley (Fig. 2), which risk in either spring or winter germplasm. Examples of these traits are:
undesirable correlated responses upon selecting for either DUS 3 (lowest leaves: hairiness of leaf sheaths), 12 (ear: number of
traits or yield. Non-zero genetic correlations are the hidden cost rows), 23 (grain: husk), 26 (grain: hairiness of ventral furrow),
in exchange for the genetic gain in yield. In traits with low and 27 (grain: disposition of lodicules). A major QTL for trait 3 is
phenotypic correlations, the unintended selection for DUS traits tightly linked to Vrn-H2, a major vernalization locus24 while
may not be immediately apparent to breeders. For instance, both traits 12, 23, and 27 are largely monomorphic in the UK barley
DUS traits 10 (ear: attitude) and 11 (plant: length) are negatively breeding pool due to preferences for two-rowed barley with
correlated with yield, which translates to semi-dwarf barley plants hulled grains and clasping (collar type) lodicules. In comparison
with erect ears having a higher yield than tall barley plants with with previous work on DUS traits GWAS7, the number of loci
recurved ears. Such correlations could help define ideal crop increased from 16 to 32 with 12 loci in common.
ideotypes22, however, they are not ideal for DUS purposes In accordance with the UPOV guidelines20, molecular markers
because high-yielding plants are more likely to be semi-dwarf can only be used in DUS if they confer a direct relationship with
with erect ears. As the genetic gain in yield increases over time23, the DUS traits. This might work well with those 14 traits with
it is inevitable that DUS trait combinatorial space gets more known major loci, although there is a risk of ignoring effects from
limited (Fig. 1c and d) due to correlated selection responses. On minor or exotic loci. One such example would be anthocyanin-
the other hand, selection away from DUS trait combinatorial related traits in flag leaf (trait 4) and awn (trait 8), where
space risks losing the genetic gain in yield. While we have only anthocyaninless 1 (ant1) and ant2 are segregating in winter but
considered correlations between DUS traits and yield, there are not spring barley varieties in the UK (Table 2). Unless the DUS
other VCU traits that may also constrict DUS trait combinatorial markers for ant1 and ant2 are in perfect linkage with the
space. causative polymorphisms, these markers would give misleading
results if used in spring barley. To complicate this issue further,
Flaws in the current DUS marker system in capturing complex we identified a locus at ant2 for an anthocyanin-related trait in
trait genetic architecture. GWAS results showed that 14 of 28 grain (trait 24) in spring barley, which may suggest an
barley DUS traits are likely regulated by few major loci and some additionally linked locus that is segregating in spring barley
of these loci are likely fixed in either spring or winter barley responsible for grain-only anthocyanin pigmentation. On the
populations (Table 2). Of the total 32 GWAS loci, 30 were other hand, it is improbable to create molecular markers that
identified in the combined dataset (Supplementary Table 2, would tag any of the other 14 traits without major loci.
Supplementary Fig. 3), 12 in the spring-only dataset (Supple- To extend beyond locus-specific markers, a small marker set
mentary Table 3, Supplementary Fig. 4), and 16 in the winter- for DUS has been proposed25 although our evaluation showed
only dataset (Supplementary Table 4, Supplementary Fig. 5). Part limited distinguishing power. By simulating F6 progeny from
of the explanation for the difference is due to the individual known parent pairs, we compared the marker set from these
COMMUNICATIONS BIOLOGY | (2021)4:302 | https://doi.org/10.1038/s42003-021-01840-9 | www.nature.com/commsbio 3ARTICLE COMMUNICATIONS BIOLOGY | https://doi.org/10.1038/s42003-021-01840-9 Fig. 1 DUS trait discrepancies and combinatorial space. a Boxplots of the proportion of DUS trait score differences between NIAB and SASA data. Center line indicates median, lower and upper hinges indicate first and third quartile, while lower and upper whisker indicates 1.5 times the interquartile range from the hinges. b Proportion of DUS trait score differences for each variety, with the oldest variety (1963) on the left and the newest variety (2007) on the right. c Rolling mean distances of 20 spring barley varieties calculated from DUS traits with an increment of one new variety at a time. The leftmost point on the “Time” axis indicates the mean from the 20 earliest varieties, while the rightmost point indicates the mean from the 20 latest varieties. d Rolling mean distances of 20 winter barley varieties calculated from DUS traits with an increment of one new variety at a time. e Relationships between the proportion of DUS trait score differences and heritabilities, separated by all (spring and winter combined), spring only and winter only groups. Each point is shown as its trait number, which is available in Table 1. simulated progeny to their parents, actual variety (progeny of the A small marker set for DUS is problematic in a crop in which parent pairs), and other simulated progeny. While most of these genomic diversity progressively gets narrower over time. Of the simulated progeny remained unique in older varieties, this is not total 39 markers25, only 4 to 22 markers are segregating between true for newer varieties (Fig. 3a and b, Supplementary Data 2), the parents analyzed. Besides, these markers are not randomly especially in spring barley. For example, LG Goddess matched distributed as there are some in strong linkage disequilibrium perfectly with 7.5% of the simulated progeny, and its parents (LD) which would not informative. Octavia and Shada matched perfectly with 8.0% and 7.8% of the As a follow-up, we investigated the number of markers simulated progeny, respectively (Supplementary Data 2). Further- required for proper separation of varieties in DUS and more, 88.4% of the simulated progeny have over 1% probability of determined that approximately 500–1000 markers are likely the matching with other simulated progeny (Supplementary Data 2). minimum (Fig. 4a). By comparing the Manhattan distances 4 COMMUNICATIONS BIOLOGY | (2021)4:302 | https://doi.org/10.1038/s42003-021-01840-9 | www.nature.com/commsbio
COMMUNICATIONS BIOLOGY | https://doi.org/10.1038/s42003-021-01840-9                                                                                                           ARTICLE

                       1
         Correlation

                       0

                       -1

                             1     2      3   4   5    6    7     8     9     10   11   12     13       14    15    16   17     18    19   20   21   22   23   24   25   26    27    28
                                                                                                         Trait

                                                                                        Type        Genetic        Phenotypic

Fig. 2 Genetic and phenotypic correlations between DUS traits and yield. Genetic and phenotypic correlations, along with their standard errors, are
shown for each DUS trait and yield. No correlation is available for traits 3, 5, 12, 19, 22, 26, and 28 because of either a high missing rate or lack of variation
in the DUS trait.

 Table 2 GWAS results.

 Trait                 GWAS peaka                                              Allele frequency               Known gene/locus

                       Chr       Pos (Mb)     Effect   −log10p        Popb     C        S           W         Name                                                                  Pos (Mb)
 1                     4H        525.07        0.74     96.02         C,S,W    0.19     0.02        0.37      MbHF35c      (Blx1)45                                                 534.04
 2                     3H        631.83       −0.69       6.40        C        0.49     0.05        0.98      HORVU3Hr1G090910d,46                                                  633.53
 3                     1H        473.27       −0.25       4.92        C        0.16     0.01        0.32      NA                                                                    NA
 3                     4H        631.68        3.32     116.93        C,W      0.44     0.00        0.91      HORVU4Hr1G085920d, HORVU4Hr1G085590d (Hsh1)24                         633.03
 4                     2H        676.76       −2.25     42.77         C,W      0.25     0.00        0.53      HORVU2Hr1G096810 (Ant2)7                                              676.85
 4                     7H        73.55        −0.80      10.67        C        0.10     0.02        0.19      HORVU7Hr1G034630 (Ant1)47                                             72.92
 8                     2H        675.76       −2.27      55.97        C,W      0.25     0.00        0.53      HORVU2Hr1G096810 (Ant2)7                                              676.85
 8                     6H        536.07        0.57       6.75        S        0.30     0.16        0.45      NA                                                                    NA
 8                     7H        73.55        −0.69       11.01       C,W      0.10     0.02        0.19      HORVU7Hr1G034630 (Ant1)47                                             72.92
 9                     1H        0.29         −0.52       6.23        C,S,W    0.07     0.07        0.06      EAR-G_148                                                             0.50e
 9                     2H        6.18         −0.33       6.98        C        0.43     0.52        0.34      NA                                                                    NA
 11                    4H        608.43       −0.30        5.93       C        0.45     0.49        0.41      NA                                                                    NA
 12                    2H        663.88        0.04       6.05        C,W      0.30     0.24        0.37      HORVU2Hr1G092290 (Vrs1)49                                             651.03
 12                    5H        579.73       −0.04       6.11        C        0.42     0.00        0.89      HORVU5Hr1G081450 (Vrs2)50                                             564.41
 13                    3H        437.24        0.63        5.56       C        0.05     0.00        0.11      NA                                                                    NA
 15                    4H        608.38       −0.22       4.76        S        0.45     0.49        0.41      4_551                                                                 618.00e
 19                    2H        652.42       −0.49    146.59         C,S,W    0.29     0.24        0.34      HORVU2Hr1G092290 (Vrs1)52                                             651.03
 20                    1H        404.92       −0.38       11.39       C,S,W    0.30     0.02        0.60      HORVU1Hr1G051010 (Vrs3)53                                             378.41
 20                    2H        655.81       −0.63      19.19        C,S,W    0.22     0.20        0.25      HORVU2Hr1G092290 (Vrs1)52                                             651.03
 20                    3H        659.54       −0.19       4.12        C        0.16     0.01        0.32      NA                                                                    NA
 20                    5H        488.46       −0.16       4.37        C        0.06     0.02        0.11      NA                                                                    NA
 21                    7H        47.56         0.17        7.93       C,W      0.08     0.07        0.08      NA                                                                    NA
 22                    5H        542.50       −0.16     24.72         C,S,W    0.36     0.52        0.18      Srh7                                                                  547.24e
 23                    7H        612.52       −0.31       6.71        C,S      0.06     0.10        0.02      HORVU7Hr1G089930 (Nud)54                                              546.59
 24                    2H        676.20       −1.45     44.08         C,S,W    0.34     0.14        0.56      HORVU2Hr1G096810 (Ant2)7                                              676.85
 24                    7H        72.97        −0.56       8.46        C,W      0.22     0.03        0.43      HORVU7Hr1G034630 (Ant1)47                                             72.92
 25                    2H        638.37        1.97      57.54        C,S,W    0.17     0.09        0.26      Gth17                                                                 647.46e
 26                    6H        0.33          3.85    152.61         C,W      0.14     0.00        0.29      11_208817                                                             5.20e
 27                    2H        724.71       −0.10     24.45         C,S      0.48     0.05        0.95      HORVU2Hr1G113880 (Cly1)55                                             730.03
 28                    1H        511.92       −0.51     47.74         C        0.48     0.00        1.00      HORVU1Hr1G076430 (Ppd-H2)56                                           514.1
 28                    4H        643.68       −0.63      63.95        C        0.48     0.00        1.00      Vrn-H257                                                              NA
 28                    5H        571.03       −0.34      38.29        C        0.46     0.00        0.98      HORVU5Hr1G095630 (Vrn-H1)58                                           599.09

 Significant GWAS peaks (FDR < 0.05) are summarized here along with their closest known gene or locus.
 aIf the GWAS peak is found in more than one population, only the results from the combined (C) analysis are shown here.
 bThis column indicates which populations (C: Combined, S: Spring, W: Winter) showed significance for any given GWAS peak.
 cMbHF35 is a cluster of 3 linked genes: HvMYB4H (HORVU4Hr1G063760), HvMYC4H (NA), and HvF35H (HORVU4Hr1G063780).
 dUnverified candidate genes.
 eApproximated physical positions based on genetic positions.

COMMUNICATIONS BIOLOGY | (2021)4:302 | https://doi.org/10.1038/s42003-021-01840-9 | www.nature.com/commsbio                                                                                   5
ARTICLE COMMUNICATIONS BIOLOGY | https://doi.org/10.1038/s42003-021-01840-9
a 8
Progeny
Parent
Match Percentage
6
4
2
0
Variety
b 8
Progeny
Parent
Match Percentage
6
4
2
0
Variety
Fig. 3 Usefulness of a small marker set for DUS. This small marker set is taken from 39 DUS markers in Owens et al.21. Percentage of exact matches in
marker data between simulated F6 progeny and their real sibling and parents. Grey vertical bars represent the spread of match percentage among the
simulated progeny. a 114 spring barley varieties sorted from oldest (left, 1982) to newest (right, 2016). b 97 winter barley varieties sorted from oldest (left,
1987) to newest (right, 2016).
calculated from all 28 DUS traits against a series of randomly parents. The second parent pair is Riviera and Cooper, which has
sampled markers, the correlation between these two distances a distance of 0.59 and thus represents the “high” distance parents.
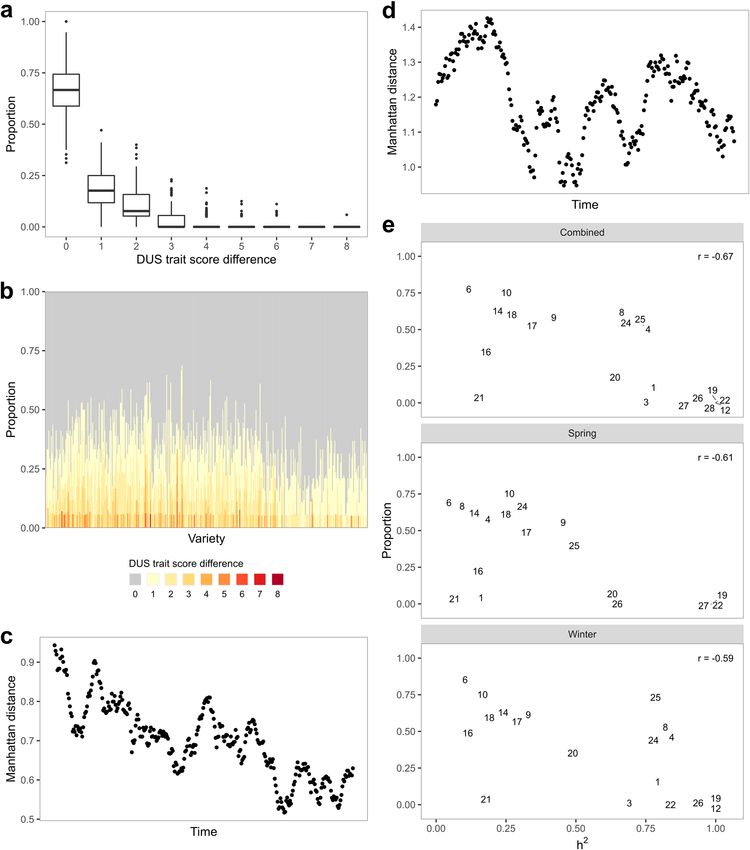
begins to plateau at about 500–1000 markers. The correlation Given an arbitrary minimum threshold of 0.05 for distinctness,
maxes out at about 0.60, which is similar to the value previously 13.0% of F6 progeny and 59.6% of BC1S4 progeny from the low
observed by Jones et al.10. This is not surprising given that the parents would be rejected for lack of distinctness, while none of
correlation depends on the DUS trait heritabilities. Manhattan the F6 progeny and 4.9% of the BC1S4 progeny from the high
distances determined from DUS traits with high heritabilities (h2 parents would be rejected (Fig. 4c).
> 0.50) showed a stronger correlation with Manhattan distances Another important consequence of using genomic markers in
from the marker data than DUS traits with low heritabilities (h2 < DUS is the regulation of essentially derived varieties (EDVs)11. As
0.50) (Fig. 4a). In addition, the distribution variances stabilize at a of the current standard, the definition of EDVs is unclear12 and it
similar range too (Supplementary Table 5), which affirms that often involves complicated and expensive court proceedings to
any marker set smaller than 500 markers is insufficient. determine EDVs13. Furthermore, the information on whether a
market variety is an EDV is not available in any of the current
Genomic DUS: concept and practices. Given the various issues literature, and it is possible that no EDV ever makes it into the
we have described in the DUS system so far, the remaining option market. With genomic markers, any varieties submitted for DUS
is to use genomic markers. There are multiple ways to implement evaluation that failed to pass the minimum distance threshold
genomic markers in DUS, and we will provide a simple example would be considered for EDVs. Curiously, among the varieties in
here using Manhattan distances, which is one of many measures our reference panel, four varieties did not pass our arbitrary
of dissimilarities among varieties. Under haploid marker coding minimum threshold of 0.05 (Fig. 4b). Spring barley Class, and
of 0 and 1, the Manhattan distance between any two varieties is winter barley KWS Joy, Mackie, and Angora all had distances of
equivalent to 2 × (1 − similarity) where similarity is measured as 0.04 with their previously submitted parents Prestige, Wintmalt
the proportion of exact marker matches between two varieties. and KWS Tower and full sib Melanie, respectively. Since only 4
Similar to the current DUS system, we will need a reference panel out of a total of 326,836 pairwise comparisons had a distance
(common knowledge varieties set) and the genomic marker data below the minimum threshold, it is not possible to visualize them
for the reference panel. As an example, we set all 805 barley in Fig. 4b. In addition, of these 4 pairs, Angora and Melanie were
varieties as our reference panel and computed the Manhattan previously deemed indistinguishable in their DUS traits and had
distances among these varieties. The distances are divided by to be separated by either microsatellite markers26 or electrophor-
within and across seasonal types, as the values ranged from 0.04 esis of hordein storage proteins27.
to 0.69 within spring barley, 0.04 to 0.87 within winter barley, and Ultimately, time and cost determine the feasibility of the current
0.44 to 0.97 between spring and winter barley (Fig. 4b). To and alternative DUS methods. Here, we evaluated four methods:
demonstrate how genomic markers work in DUS, we simulated (1) morphological trait DUS28, (2) speed DUS29, (3) trait-specific
1000 F6 and BC1S4 progeny from two pairs of parents in spring marker DUS16, and (4) genomic DUS. Among these methods, the
barley. The first parent pair is Propino and Quench, which has a current DUS system with morphological traits takes the longest
distance of 0.20 and thus represents the “low” distance between time as it usually requires one to two years of field or glasshouse
6 COMMUNICATIONS BIOLOGY | (2021)4:302 | https://doi.org/10.1038/s42003-021-01840-9 | www.nature.com/commsbioCOMMUNICATIONS BIOLOGY | https://doi.org/10.1038/s42003-021-01840-9 ARTICLE
a distinctness, uniformity, and stability of new varieties (Fig. 5).
Instead of relying on morphological trait differences from
0.6
common knowledge varieties in the reference panel, we can
Correlation
Traits
0.4
determine a distance threshold based on genomic markers that
All
Low h
2 would allow us to decide if a variety is sufficiently distinct. By
0.2 High h
2
sampling multiple seeds (or multiple pools of seeds), we can also
test for uniformity based on the distances among these seeds or
0.0 pools. For instance, uniformity could be defined such that the
1 10 100 1000 10000 distances among the seeds from a candidate variety cannot be
Marker Number more than its distances with common knowledge varieties. We
b can quantify stability by measuring the genomic heterogeneity of
the variety seed pool since a fully homogenous seed pool ensures
3 genomic stability in subsequent generations of seed production.
density
In an inbred species, this can be achieved by checking for
2
genomic heterogeneity between seeds in the initial DUS
1
application and final commercial seed lot. In an outcrossing
species, this could be done by evaluating the change in allele
0 frequencies between the initial and final seed lots after accounting
0.0 0.2 0.4 0.6 0.8 1.0 for possible genomic drift. Overall, genomic markers provide a
Manhattan distance
robust and effective option for improving DUS testing.
c
20 Genomic DUS as a solution to address shortcomings in the
Simulation current DUS system. Our analysis of the current DUS system
density
15 F6 (low) using UK barley as an example has shown that morphological
10
BC1S4 (low)
F6 (high)
traits are not fit for DUS purposes. The trait combinatorial space
BC1S4 (high) gets narrower over time and is likely worse in crop species with
5
limited genetic variation. DUS traits with low heritabilities are not
0 replicable outside the DUS trial and hence these traits have
0.0 0.1 0.2 0.3 limited meaning to variety fingerprinting. As a consequence,
Manhattan distance
there is no easy way for farmers to verify the identities of the
Fig. 4 Analyses of genomic markers for DUS. a Correlation in Manhattan varieties sown in their field. Genetic correlations between DUS
distances from DUS traits and a various number of randomly sampled and yield are detrimental to crop breeding due to the constraints
markers. b Distribution of Manhattan distances among 805 barley varieties. imposed on selecting for higher yield and away from the common
Within a seasonal type, distances dominate the first left peak while DUS trait combinatorial space. Besides, the current DUS process
between seasonal type distances dominate the two right peaks. An is time-consuming and costly, which is non-ideal for small
arbitrary distance threshold of 0.05 is marked with a red vertical line. breeding companies. Unfortunately, alternatives like trait-specific
c Distribution of minimum Manhattan distances from each simulated markers and small marker sets are inadequate for DUS.
progeny and reference panel (805 varieties). A similar arbitrary threshold It is evident that the current DUS system is due for an update
of 0.05 is marked. as we have shown that genomic markers are the best way forward.
Aside from being able to address various shortcomings in the
current system, it also opens up opportunities for incorporating
trials. Recently, Jamali et al.29 proposed a speed DUS system by molecular editing into breeding systems and clarifies the
combining the current system with speed breeding30. While this boundary between new and essentially derived varieties. Given
idea is novel and interesting in regards to its purposes in DUS, it the role of the DUS system in granting varietal rights, it is the
still requires experimental validation for every DUS trait since perfect setup for addressing the lack of genetic diversity in
speed breeding alters plant development and many of the DUS modern crops which threatens food security38. This, obviously, is
traits are indeed developmental features. Both trait-specific marker only possible with genomic markers. In addition, with the
and genomic marker methods require the least amount of time, impacts from Brexit (in the UK and EU) and Covid-19 looming
and it is possible to shorten the time to days provided there is a for an unforeseeable future, there may be heavy restrictions on
routine demand. From the monetary aspect, both trait-specific and seed movement that impede the process of getting varieties into
genomic marker methods cost only a small fraction of the current the market. Such limitations are non-ideal since only a small
DUS trait method. Trait-specific markers using Kompetitive fraction of the candidate varieties end up passing the DUS test
Allele-Specific PCR (KASP) cost approximately £11 for 100 while the rest end up as a waste of time and money. With
markers31 while genomic markers using the barley 50k iSelect SNP genomic markers for DUS, it is trivial for testing centers to either
array32 cost approximately £40 for over 40,000 markers33. While receive DNA samples from breeders or marker data from another
no cost information is available for speed DUS, it is unlikely to be testing center in a different country. Lastly, genomic DUS will
less than the current DUS trait evaluation which costs £1040 per unlock a new opportunity for an improved seed certification
candidate variety34. Given all considerations, genomic markers system to better protect breeders, farmers, and customers.
remain the best method forward for DUS.
Being in the genomic era, we have access to great genomic Methods
resources in major crops like the barley 50k SNP array32, wheat DUS trait and marker data. DUS trait data from the UK national list were
90k SNP array35, and maize 600k SNP array36 for application in downloaded from the National Institute of Agricultural Botany (NIAB) and Science
DUS. In crop species where SNP arrays are not readily available, and Advice for the Scottish Agriculture (SASA) websites on 30th April 2020. NIAB
data is available at https://www.niab.com/uploads/files/Spring_Barley_Descriptions_
one may consider using genotype-by-sequencing (GBS)37 or 2019_V1.pdf and https://www.niab.com/uploads/files/
similar methods as a starting point. As an example, we have Winter_Barley_Descriptions_2019_V1.pdf while SASA data is available at https://
illustrated how genomic markers can be used to evaluate the barley.agricrops.org/varieties. The NIAB data had a total of 287 barley varieties and
COMMUNICATIONS BIOLOGY | (2021)4:302 | https://doi.org/10.1038/s42003-021-01840-9 | www.nature.com/commsbio 7ARTICLE COMMUNICATIONS BIOLOGY | https://doi.org/10.1038/s42003-021-01840-9
Distinctness Uniformity Stability
Fail Fail Fail
DUS by
Year 1 Year 2
morphological
traits
Pass Pass Pass
Reference panel
Year 1 Year 2
Fail Pass
Fail Fail
DUS by
genomic Pass Pass
markers
0 1 0 1 0 1
Manhattan distance Manhattan distance Heterogeneity level
(Reference panel) (Variety seeds) (Variety seeds, pooled)
Fig. 5 Simplified illustrations of the current DUS system and its potential successor. In the current system, the distinctness, uniformity, and stability of a
candidate variety are determined by the comparison of 28 morphological traits to a reference panel of common knowledge varieties and itself. We propose
that an upgrade to the current system by using genomic markers instead of morphological traits. Here, distinctness is evaluated based on a minimum
distance threshold, and anything below the threshold could be considered EDVs. Uniformity and stability evaluations are straightforward, as they each
require the seeds to be close in distance to each other and low in genetic heterogeneity.
the SASA data had a total of 728 varieties. Additional DUS trait data from NIAB were variance into additive genetic and residual variances using mmer function in the
taken from Cockram et al.7, which had 577 varieties. After merging the different “sommer” package40 in R39. Briefly, the mixed model is described as:
sources of NIAB data, there were 827 varieties remaining. The original DUS trait data
were stored as text descriptions and had to be converted into numerical scales using y ¼ Xβ þ g þ e ð1Þ
the key provided by APHA28. Both NIAB and SASA data had all 28 DUS traits, For any DUS trait with n varieties, y is an n × 1 vector of DUS trait, X is an n ×
although some of the traits had a high missing rate, especially in the SASA data. n incidence matrix relating to fixed effects β, β is an n × m matrix of m fixed effects,
Therefore, we used the NIAB data for our primary analyses and the SASA data for g is an n × 1 vector of random additive genetic effect and e is an n × 1 vector of
only comparative analysis between the two. While we attempted to source as many residual effect. The m fixed effects included intercept, year of entry into the
varieties with DUS trait data as possible, we did not have an exhaustive list of all UK national listing, and seasonal type, although the last effect was dropped when
barley varieties to date as we were limited to those which are available publicly. spring and winter barley datasets were analyzed separately. The random additive
Marker data from the UK national list were obtained from the IMPROMALT genetic effect g was restricted to a normal distribution of mean 0 and variance σg2A,
project (http://www.barleyhub.org/projects/impromalt/). The original marker data where σg2 is the additive genetic variance and A is an n × n additive genetic
contained 809 varieties with 43,799 SNP markers genotyped on the barley 50k relationship matrix calculated using A.mat function in “sommer”. Similarly, the
iSelect SNP array32. This contrasts with a previous DUS study by Cockram et al.7 residual effect followed a normal distribution of mean 0 and variance σe2I, where
which had 500 varieties and 1536 SNP markers. Since a large proportion of the σe2 is the residual variance and I is an n × n identity matrix. For every DUS trait, we
markers did not have any missing data, we removed any marker with missing data fitted the model using data from the spring barley dataset (n = 370), winter barley
which left us with 40,078 SNP markers. In addition, we also obtained a year of dataset (n = 335), and combined dataset (n = 710). We then extracted the genetic
national listing and pedigree information of all varieties from the IMPROMALT (σ 2g ) and phenotypic (σ 2y ) variances and calculated heritabilities (h2 ) as follows:
project. Within these 809 varieties, 432 are spring barley, 372 are winter barley and
σ 2y ¼ σ 2g þ σ 2e ð2Þ
5 are alternative barley. We removed four varieties that did not have an Application
for Protection (AFP) number, which left us with 805 varieties. Since there are only
a few alternative barley varieties, we excluded them from any analysis that requires σ 2g
h2 ¼ ð3Þ
separation of the data by seasonal types. The trait and marker data were merged by σ 2g þ σ 2e
their AFP numbers. Unlike the various names that are occasionally recycled, the
AFP numbers are unique for each variety. They are also ordered by the date of
submission for DUS testing. Overall, we had 710 varieties that are in common Calculating best linear unbiased estimates (BLUEs) for yield. We obtained the
between the DUS trait and marker data, which serves as our primary data for raw dry matter yield data for spring barley from Mackay et al.23 and the Agri-
analysis. culture and Horticulture Development Board (AHDB) website for 509 varieties
that were included in the VCU trials from 1948 to 2019. These varieties were trialed
in multiple environments and years. The dry matter yield data from 1983 and
DUS trait comparative analysis. We calculated the DUS trait discrepancies onwards were taken from fungicide-treated trials, and the data prior to that were
between NIAB and SASA by taking the absolute values of the trait score differ- taken from “best local practice” trials which meant that fungicide usage was left to
ences. A total of 395 varieties were in common between the NIAB and SASA the discretion of managers at each trial. To account for this difference, we created a
datasets. Most of the traits were scored on a scale with an increment of 1, except for “management” variable. Varieties from 1983 and onwards were scored as 1 and the
traits 3, 23, and 26 which were scored as either 1 or 9. To maintain a fair com- varieties prior to that were scored as 0 for this variable.
parison across all traits, we converted those trait scores from 1 or 9 to 1 or 2. All The raw dry matter yield data were fitted into a mixed linear model using lmer
DUS trait comparisons were performed only when there is complete pairwise data function in the “lme4” package41 in R39. Briefly, the raw dry matter yield was set as
between NIAB and SASA. the response variable, with variety as fixed effects, and management, management-
In addition, we subset the DUS trait data into spring and winter barley, by-year, management-by-year-by-variety, and management-by-year-by-location as
respectively, to calculate the change in trait combinatorial space over time. This random effects. Next, we calculated the best linear unbiased estimates (BLUEs) for
analysis was done by first sorting the barley varieties by their AFP number. Next, yield using the emmeans function in “emmeans” package42 in R39.
we computed the rolling mean of 20 varieties’ Manhattan distances using the dist
function in R39 with an increment of one variety at a time. The lower the mean
distance, the narrower the trait combinatorial space. Bivariate mixed linear model analyses of DUS traits and yield. We merged the
DUS traits and yield data by the variety AFP numbers, which left us with
192 spring barley varieties in common. Unfortunately, we did not have access to
Univariate mixed linear model analyses of DUS traits. By leveraging the older winter barley dry matter yield data, so the analysis here is limited to spring
genomic relationship among the varieties, we partitioned the DUS phenotypic barley. Similar to the univariate analyses, we fitted each DUS trait and dry matter
8 COMMUNICATIONS BIOLOGY | (2021)4:302 | https://doi.org/10.1038/s42003-021-01840-9 | www.nature.com/commsbioCOMMUNICATIONS BIOLOGY | https://doi.org/10.1038/s42003-021-01840-9 ARTICLE
yield BLUE into a mixed linear model using mmer function in “sommer” package40 Demonstrating the use of genomic markers in DUS via simulation. To test how
in R39. Briefly, the bivariate models can be written as the following: genomic markers can be used in DUS, we chose two known spring barley parent
pairs with low and high genomic distances. Acumen’s parents, Propino and
y1 ¼ Xβ þ g1 þ e1 ð4Þ Quench with a distance of 0.20 represents the low distance option, while Berwick’s
parents, Riviera and Cooper with a distance of 0.59 represent the high distance
option. From each of these parent pairs, we simulated 1000 F6 and BC1S4 progeny
y2 ¼ Xβ þ g2 þ e2 ð5Þ using the “AlphaSimR” package44 in R39. We then computed the Manhattan dis-
tances from each simulated progeny group using dist function in R39.
For any pair of DUS trait and yield with n varieties, y1 is an n × 1 vector of DUS
trait, y2 is an n × 1 vector of yield, X is an n × n incidence matrix relating to fixed
effects β, β is an n × m matrix of m fixed effects, g1 is an n × 1 vector of random Reporting summary. Further information on research design is available in the Nature
additive genetic effect for DUS trait, g2 is an n × 1 vector of random additive Research Reporting Summary linked to this article.
genetic effect for yield, e1 is an n × 1 vector of residual effect for DUS trait and e2 is
an n × 1 vector of residual effect for yield. The m fixed effects included intercept
and year of entry into the national listing. Unlike the univariate analyses, here the
Data availability
The compiled DUS trait data from NIAB and SASA and BLUEs for dry matter yield are
random additive genetic effect g1 and g2 were restricted to a multivariate normal
σ2 available in Supplementary Data 3, 4, and 5, respectively. The IMPROMALT marker data
g1 ρg σ g1 σ g2 is available at http://www.barleyhub.org/projects/impromalt/ subject to permission from
distribution of mean 0 and variance A, where σ 2g1 is the
ρg σ g1 σ g2 σ 2g2 the James Hutton Institute. All source file website links have been archived at https://web.
additive genetic variance for DUS trait, σ 2g2 is the additive genetic variance for yield, archive.org/.
ρg is the additive genetic correlation between DUS trait and yield, ⊗ is a Kronecker
product and A is an n × n additive genetic relationship matrix calculated using A. Code availability
mat function in “sommer”. Similarly, the residual effect followed a multivariate The custom R scripts for all analyses are available at https://github.com/cjyang-sruc/
σ2 ρe σ e1 σ e2
normal distribution of mean 0 and variance e1
I, where σ e1 is
2 DUS. R version 4.0.2 was used and the associated R packages include reshape2_1.4.4,
ρσ σ σ2
e e1 e2 e2 ggplot2_3.3.2, ggrepel_0.8.2, lme4_1.1-23, emmeans_1.5.2-1, sommer_4.1.1,
the residual variance for DUS trait, σ 2e2 is the residual variance for yield, ρe is the AlphaSimR_0.12.2 and qvalue_2.20.0.
residual correlation between DUS trait and yield and I is an n×n identity matrix.
From the bivariate mixed models, we extracted the genetic correlation as ρg and
Received: 22 October 2020; Accepted: 8 February 2021;
phenotypic correlation as ρy where:
ρg σ g1 σ g2 þ ρe σ e1 σ e2
ρy ¼ rffiffiffiffiffiffiffiffiffiffiffiffiffiffiffiffiffiffiffiffiffiffiffiffiffiffiffiffiffiffiffiffiffiffiffiffiffiffiffiffiffiffiffiffiffiffiffi
ð6Þ
σ 2g1 þ σ 2e1 σ 2g2 þ σ 2e2
References
1. Helfer, L. R. Intellectual property rights in plant varieties. International legal
GWAS on DUS traits. We performed GWAS on each DUS trait using data from
the spring barley dataset (n = 370), winter barley dataset (n = 335), and combined regimes and policy options for national governments. FAO Legisl. Study 85,
dataset (n = 710). We used a similar model as the univariate mixed linear model 1–113 (2004).
for GWAS as provided by the GWAS function in “sommer” package40 in R39. 2. UPOV. General introduction to the examination of distinctness, uniformity
Briefly, the GWAS model is described as below: and stability and the development of harmonized descriptions of new varieties
of plants, TG/1/3. https://www.upov.int/en/publications/tg-rom/tg001/tg_1_3.
y ¼ Xβ þ mi ki þ g þ e ð7Þ pdf (2002).
3. Jamali, S. H., Cockram, J. & Hickey, L. T. Insights into deployment of DNA
For any trait y, mi is an n × 1 vector of marker genotype, ki is the marker effect markers in plant variety protection and registration. Theor. Appl. Genet. 132,
and i is the marker index from one to the total number of markers. The other terms 1911–1929 (2019).
are the same as previously described in Eq. 1. We evaluated the GWAS results for 4. Council of the European Union. Council directive 2002/53/EC of 13 June 2002
significant markers by using a threshold of false discovery rate (FDR) of 0.05, as on the common catalogue of varieties of agricultural plant species. https://eur-
determined from qvalue function in “qvalue” package43 in R39. Since barley is an lex.europa.eu/legal-content/EN/ALL/?uri=celex:32002L0053 (2002).
inbreeding species, linkage disequilibrium (LD) can complicate GWAS results 5. Bailey-Serres, J., Parker, J. E., Ainsworth, E. A., Oldroyd, G. E. D. & Shroeder,
especially when there is a highly significant marker. Therefore, for any trait where J. I. Genetic strategies for improving crop yield. Nature 575, 109–118 (2019).
the marker significance exceeded −log10p of 10, we performed a follow-up GWAS 6. Cooke, R. J. & Reeves, J. C. Plant genetic resources and molecular markers:
with the most significant marker as a fixed effect. The re-evaluation threshold was variety registration in a new era. Plant Genet. Res. 1, 81–87 (2003).
chosen as 10 to minimize the number of GWAS runs as we were only interested in 7. Cockram, J. et al. Genome-wide association mapping to candidate
identifying any potential peaks that are masked due to major segregating loci. If polymorphism resolution in the unsequenced barley genome. Proc. Natl Acad.
any of the markers on other chromosomes were initially significant due to LD with Sci. USA 107, 21611–21616 (2010).
the causative locus, then these markers should drop below the significance
8. Muthoni, J. & Nyamongo, D. O. Seed systems in Kenya and their relationship
threshold in the second GWAS.
to on-farm conservation of food crops. J. N. Seeds 9, 330–342 (2008).
9. Jamnadass, R. et al. Enhancing African orphan crops with genomics. Nat.
Evaluation on the usefulness of small marker set in DUS via simulation. To Genet. 52, 356–360 (2020).
evaluate the 45 DUS markers in Owen et al.25, we simulated these markers in the 10. Jones et al. Evaluation of the use of high-density SNP genotyping to
progeny of known parent pairs. We used 39 out of the 45 markers for simulation as implement UPOV Model 2 for DUS testing in barley. Theor. Appl. Genet. 126,
six of the markers were either absent or low quality in our dataset. Based on the 901–911 (2013).
pedigree information, there were 212 varieties with marker data available for their 11. UPOV. Explanatory notes on essentially derived varieties under the 1991 act
parents and these varieties were generated from an intercross between the parents. of the UPOV convention, EXN/EDV/2. https://www.upov.int/edocs/
For each variety and its parents, we simulated 10,000 F6 progeny using “Alpha- expndocs/en/upov_exn_edv.pdf (2017).
SimR” package44 in R39. We then compared the simulated progeny to the known 12. Bostyn, S. J. R. Plant variety rights protection and essentially derived varieties:
progeny (variety) and its two parents and counted the number of exact matches in a fresh proposal to untie the gordian knot. GRUR Int. 69, 785–802 (2020).
the DUS markers. In addition, we bootstrapped the comparisons 1000 times to get 13. Lawson, C. Plant breeder’s rights and essentially derived varieties: still
a better estimate of the mean count of exact matches. For comparison within the searching for workable solutions. In 32 European intellectual property review
simulated progeny, we tabulated the number of occurrences of each progeny with a 499, Griffith University Law School research paper no. 16-17. Griffith
unique DUS marker haplotype.
University, Queensland, Australia (2016).
14. Nybom, H., Rogstad, S. H. & Schaal, B. A. Genetic variation detected by use of
Comparing Manhattan distances from DUS traits against different number of the M13 “DNA fingerprint” probe in Malus, Prunus, and Rubus (Rosaceae).
markers. To evaluate the number of markers needed for DUS, we randomly Theor. Appl. Genet. 79, 153–156 (1990).
sampled one to the maximum number of markers with an increment of log10 of 0.1. 15. Gunjaca, J. et al. Discriminating maize inbred lines using molecular and DUS
We then calculated the Manhattan distances from DUS traits and markers using data. Euphytica 161, 165–172 (2008).
dist function in R39. For each set of markers, we computed the correlation between 16. Cockram, J., Jones, H., Norris, C. & O’Sullivan, D. M. Evaluation of diagnostic
the Manhattan distances from DUS traits and marker data. In addition, we also molecular markers for DUS phenotypic assessment in the cereal crop, barley
separated the DUS traits into a high heritability group (h2 > 0.5) and low herit- (Hordeum vulgare ssp. vulgare L.). Theor. Appl. Genet. 125, 1735–1749 (2012).
ability group (h2 < 0.5), and computed the correlations similarly.
COMMUNICATIONS BIOLOGY | (2021)4:302 | https://doi.org/10.1038/s42003-021-01840-9 | www.nature.com/commsbio 9ARTICLE COMMUNICATIONS BIOLOGY | https://doi.org/10.1038/s42003-021-01840-9
17. Pourabed, E. et al. Identification and DUS testing of rice varieties through 47. Himi, E. & Taketa, S. Isolation of candidate genes for the barley Ant1 and
microsatellite markers. Int. J. Plant Genom. 6, 965073 (2015). wheat Rc genes controlling anthocyanin pigmentation in different vegetative
18. Tian, H.-L. et al. Development of maizeSNP3072, a high-throughput tissues. Mol. Genet. Genom. 290, 1287–1298 (2015).
compatible SNP array, for DNA fingerprinting identification of Chinese maize 48. Barral-Baron, G. Investigation and validation of QTL for yield and yield
varieties. Mol. Breed. 35, 136 (2015). components in winter barley. PhD thesis, Newcastle University, Newcastle
19. Achard, F. & Nelson, B. Evaluation of soybean molecular marker public (2016).
resources for potential application in plant variety protection, BMT/15/13. 49. Komatsuda, T. et al. Six-rowed barley originated from a mutation in a
https://www.upov.int/edocs/mdocs/upov/en/bmt_15/bmt_15_13.pdf (2016). homeodomain-leucine zipper I-class homeobox gene. Proc. Natl Acad. Sci.
20. UPOV. Guidance on the use of biochemical and molecular markers in the USA 104, 1424–1429 (2007).
examination of distinctness, uniformity and stability (DUS), TGP/15. https:// 50. Youssef, H. M. et al. VRS2 regulates hormone-mediated inflorescence
www.upov.int/edocs/tgpdocs/en/tgp_15.pdf (2019). patterning in barley. Nat. Genet. 49, 157–161 (2017).
21. Falconer, D. S. & Mackay, T. F. C. Introduction to Quantitative Genetics. 4th 51. Xu, X. et al. Genome-wide association analysis of grain yield-associated traits
edn. (Prentice Hall, Harlow, England, 1996). in a pan-European barley cultivar collection. Plant Genom. 11, 170073 (2018).
22. Donald, C. M. The breeding of crop ideotypes. Euphytica 17, 385–403 (1968). 52. Sakuma, S. et al. Extreme suppression of lateral floret development by a single
23. Mackay, I. et al. Reanalyses of the historical series of UK variety trials to amino acid change in the VRS1 transcription factor. Plant Physiol. 175,
quantify the contributions of genetic and environmental factors to 1720–1731 (2017).
trends and variability in yield over time. Theor. Appl. Genet. 122, 225–238 53. Bull, H. et al. Barley SIX-ROWED SPIKE3 encodes a putative Jumonji C-type
(2011). H3K9me2/me3 demethylase that represses lateral spikelet fertility. Nat.
24. Saade, S. et al. A donor-specific QTL, exhibiting allelic variation for leaf sheath Commun. 8, 936 (2017).
hairiness in a nested association mapping population, is located on barley 54. Taketa, S. et al. Barley grain with adhering hulls is controlled by an ERF family
chromosome 4H. PLoS ONE 12, e0189446 (2017). transcription factor gene regulating a lipid biosynthesis pathway. Proc. Natl
25. Owens, H., Pearson, K., Roberts, A. M. I., Reid, A. & Russell, J. Single Acad. Sci. USA 105, 4062–4067 (2008).
nucleotide polymorphism assay to distinguish barley (Hordeum vulgare L.) 55. Nair, S. K. et al. Cleistogamous flowering in barley arises from the suppression
varieties in support of seed certification. Genet. Res. Crop Evol. 66, 1243–1256 of microRNA-guided HvAP2 mRNA cleavage. Proc. Natl Acad. Sci. USA 107,
(2019). 490–495 (2010).
26. Russell, J. et al. Discriminating between barley genotypes using microsatellite 56. Faure, S., Higgins, J., Turner, A. & Laurie, D. A. The FLOWERING LOCUS T-
markers. Genome 40, 442–450 (1997). like gene family in barley (Hordeum vulgare). Genetics 176, 599–609 (2007).
27. Thomas, W. et al. Project report no. 528: Association genetics of UK elite 57. Dubcovsky, J., Chen, C. & Yan, L. Molecular characterization of the allelic
barley (AGOUEB). HGCA (2014). variation at the VRN-H2 vernalization locus in barley. Mol. Breed. 15, 395–407
28. APHA. United Kingdom national list technical protocol for official (2005).
examination of distinctness, uniformity and stability (DUS), barley, Hordeum 58. von Zitzewitz, J. et al. Molecular and structural characterization of barley
vulgare L. sensu lato. https://assets.publishing.service.gov.uk/government/ vernalization genes. Plant Mol. Biol. 59, 449–467 (2005).
uploads/system/uploads/attachment_data/file/906760/dus-protocol-barley.pdf
(2020).
29. Jamali, S. H., Cockram, J. & Hickey, L. T. Is plant variety registration keeping Acknowledgements
pace with speed breeding techniques? Euphytica 216, 131 (2020). We thank the IMPROMALT consortium, especially Paul Shaw, Hazel Bull, and Malcolm
30. Watson, A. et al. Speed breeding is a powerful tool to accelerate crop research Macaulay, for sharing the marker data for all barley varieties analyzed here, as well as
and breeding. Nat. Plants 4, 23–29 (2018). Rajiv Sharma, Ian Dawson, and David Marshall for helpful discussion throughout
31. Ayalew, H. et al. Comparison of Taqman, KASP and rhAmp SNP genotyping the work.
platforms in hexaploid wheat. PLoS ONE 14, e0217222 (2019).
32. Bayer, M. M. et al. Development and evaluation of a barley 50k iSelect SNP Author contributions
array. Front. Plant Sci. 8, 1792 (2017). W.P. and I.M. proposed the research idea. C.J.Y. performed the data analysis. J.R., L.R.,
33. Darrier, B. et al. A comparison of mainstream genotyping platforms for the and W.T. provided the marker data. C.J.Y., W.P., and I.M. wrote and revised the
evaluation and use of barley genetic resources. Front. Plant Sci. 10, 544 (2019). manuscript. All authors read and approved the manuscript.
34. APHA. Fees for national listings (NL) and plant breeders rights (PBR). https://
assets.publishing.service.gov.uk/government/uploads/system/uploads/
attachment_data/file/894729/pbr-fees.pdf (2018). Competing interests
35. Wang, S. et al. Characterization of polyploid wheat genomic diversity using a The authors declare no competing interests.
high-density 90000 single nucleotide polymorphism array. Plant Biotechnol. J.
12, 787–796 (2014).
36. Unterseer, S. et al. A powerful tool for genome analysis in maize: development
Additional information
Supplementary information The online version contains supplementary material
and evaluation of the high density 600 k SNP genotyping array. BMC
available at https://doi.org/10.1038/s42003-021-01840-9.
Genomics 15, 823 (2014).
37. Elshire, R. J. et al. A robust, simple genotyping-by-sequencing (GBS) approach
Correspondence and requests for materials should be addressed to I.M.
for high diversity species. PLoS ONE 6, e19379 (2011).
38. Esquinas-Alcázar, J. Protecting crop genetic diversity for food security:
Reprints and permission information is available at http://www.nature.com/reprints
political, ethical and technical challenges. Nat. Rev. Genet. 6, 946–953 (2005).
39. R Core Team. R: a language and environment for statistical computing. R
Publisher’s note Springer Nature remains neutral with regard to jurisdictional claims in
Foundation for Statistical Computing, Vienna, Austria. https://www.R-project.
published maps and institutional affiliations.
org (2020).
40. Covarrubias-Pazaran, G. Genome-assisted prediction of quantitative traits
using the R package sommer. PLoS ONE 11, e0156744 (2016).
41. Bates, D., Maechler, M., Bolker, B. & Walker, S. Fitting linear mixed-effects Open Access This article is licensed under a Creative Commons
models using lme4. J. Stat. Softw. 67, 1–48 (2015). Attribution 4.0 International License, which permits use, sharing,
42. Lenth, R. et al. emmeans: Estimated marginal means, aka least-squares means. adaptation, distribution and reproduction in any medium or format, as long as you give
R package version 1.4.8. https://github.com/rvlenth/emmeans (2020). appropriate credit to the original author(s) and the source, provide a link to the Creative
43. Storey, J. D., Bass, A. J., Dabney, A., Robinson, D. & Warnes, G. qvalue: Q- Commons license, and indicate if changes were made. The images or other third party
value estimation for false discovery rate control. R package version 2.20.0. material in this article are included in the article’s Creative Commons license, unless
https://github.com/jdstorey/qvalue (2020). indicated otherwise in a credit line to the material. If material is not included in the
44. Gaynor, R. C., Gorjanc, G. & Hickey, J. M. AlphaSimR: an R-package for article’s Creative Commons license and your intended use is not permitted by statutory
breeding program simulations. G3 https://doi.org/10.1093/g3journal/jkaa017 regulation or exceeds the permitted use, you will need to obtain permission directly from
(2020). the copyright holder. To view a copy of this license, visit http://creativecommons.org/
45. Jia, Y. et al. Uncovering the evolutionary origin of blue anthocyanins in cereal licenses/by/4.0/.
grains. Plant J. 101, 1057–1074 (2020).
46. Zhou, Y. et al. Towards the identification of a gene for prostrate tillers in
barley (Hordeum vulgare L.). PLoS ONE 13, e0192263 (2018). © The Author(s) 2021
10 COMMUNICATIONS BIOLOGY | (2021)4:302 | https://doi.org/10.1038/s42003-021-01840-9 | www.nature.com/commsbioYou can also read