Greece is past its COVID-19 epidemic peak, now entering asymptotic decay and ending its 42-day country-wide lockdown - Zenodo
←
→
Page content transcription
If your browser does not render page correctly, please read the page content below
Greece is past its COVID-19 epidemic peak, now
entering asymptotic decay and ending its 42-day
country-wide lockdown
Harris V. Georgiou (MSc,PhD)a
a
    Data Science Lab1 , University of Piraeus2 , Greece

Version: 1.0.00 – Last update: May 10, 2020

This work is a status update over a previous report (1) published in          1. New information about the virus
mid-April, regarding the COVID-19 epidemic at the national level for
                                                                              The latest results from clinical studies, monitoring of confirmed
Greece, including SEIQRDP model identification and other data ana-
                                                                              COVID-19 cases throughout the world, as well as model re-
lytics, using the open-source datasets that were available at the time.
                                                                              estimations with updated models during the past 2-3 weeks
In this report, these models are revisited and their validity is con-
                                                                              have revealed several new aspects of the SARS-CoV-2 virus,
firmed, based on the more recent up-to-date datasets from the two
                                                                              its pathology, how it attacks human cells and how it evolves
weeks that followed. Additionally, some problems are identified and
                                                                              into a potentially lethal disease, not only related to the lungs,
addressed regarding the under-reporting of infections and delayed
                                                                              but in relation to other organs too. New evidence (2) suggests
reporting of recovered cases. All models indicate that the national
                                                                              that the virus may have already appeared in France as early
outbreak in Greece is now in recession, with a fade-out period of
                                                                              as December 2019, i.e., a month before the country’s first
about 2-3 months, i.e., well within the summer, assuming no second-
                                                                              confirmed case was reported and only few weeks after ‘patient
wave outbreak in the meantime. Provided the gradual deactivation of
                                                                              zero’ was admitted to a hospital in Wuhan, China. Addi-
strong mitigation measures, the re-opening of international travelling
                                                                              tionally, there is evidence of a new strain of the virus∗ , still
and the summer holidays period, very intense and accurate tracking
                                                                              unconfirmed and non-verified† , which seems to have become
of the infections is required in Greece and every other country.
                                                                              dominant world-wide after February and seems to be more
                                                                              contagious than the versions that spread in the early days of
COVID-19 | SARS-CoV-2 | data analytics | SEIR | Greece                        the COVID-19 pandemic (3).
                                                                                  Figure 1 illustrates a general overview of the attack process
                                                                              of the virus, according to the latest information (4). The virus
      ecent experience from the evolution of the COVID-19 pan-
R     demic throughout the world has pushed the international
interest of research teams from various fields and disciplines
                                                                          ∗

                                                                          †
                                                                              ‘Scientists say a now-dominant strain of the coronavirus could be more contagious than original’ –
                                                                              L.A. Times (5-May-2020)
                                                                              ‘The Problem With Stories About Dangerous Coronavirus Mutations’ – The Atlantic (6-May-2020)
into rapid action, including Data Analytics for Epidemics.The
main goal for such works is three-fold: (a) assemble, organize
and present proper datasets, (b) formulate the dynamics of
                                                                                   Significance Statement
the outbreak by model identification, (c) validate the results
and make sure we are better prepared for the next time. It                         The overall short-term outlook for Greece continues to be to-
is remarkable how much R&D work was accomplished in so                             wards positive. Peak active infections was realized on April
little time - thousands of research papers and technical reports,                  20-21st (1,856-1,860). There is a very strong delay in reporting
most of them made available immediately to the entire world                        recoveries, thus producing very large periods of missing data.
via open-access, in order for others to build upon them as                         Regardless, numbers for deaths and ICU used show ratios
quickly as possible. This is probably the first time the human-                    well within the world-wide estimations. The number of deaths
ity was able to track a pandemic in almost real time, with                         related to COVID-19 is expected to be limited to 170 by the
huge amounts of information and data visualizations, available                     end of July. The basic reproduction number is confirmed to
to everyone.                                                                       be R0 < 0.45 and decreasing. If no second-wave outbreak is
                                                                                   realized, the national outbreak is expected to fade out within
    This work is a status update over a previous report (1)                        August. Under-reporting of infections in Greece is revisited,
published on April 15th, regarding the evolution of the COVID-                     with models showing that the effective factor seems to be no
19 outbreak in Greece as the national epidemic had just passed                     more than 1:3, at least for the clinically important cases of
its rising inflection point (change of curvature, i.e., ‘slowing                   COVID-19; this may be up to 1:10 if patients with mild or no
down’) and stepping towards its peak. Now, about three                             symptoms are included. Simulations show that a second-wave
weeks later, the epidemic models and data analytics presented                      outbreak in Greece beginning right after the gradual deactiva-
there are revisited, re-evaluated and assessed regarding their                     tion of strong mitigation measures can still produce a five-fold
accuracy and effectiveness in capturing the dynamics of the                        epidemic intensity by mid-summer.
outbreak. It is extremely important to do so at this point, since
Greece now seems to be entering the long period of asymptotic                 1
                                                                                  Data Science Lab – http://datastories.org
decay or ‘fading-out’ of the outbreak at the national level and
                                                                              2
just starting to gradually deactivating the mitigation measures                   University of Piraeus, Greece – http://www.unipi.gr

of a country-wide lockdown that lasted 42 days.                               3
                                                                                  Corresponding author E-mail: hgeorgiou@unipi.gr

                                                                                    Technical Report       |   May 10, 2020      |      Ref: HG-TR2020A1-COV19GR1         |   1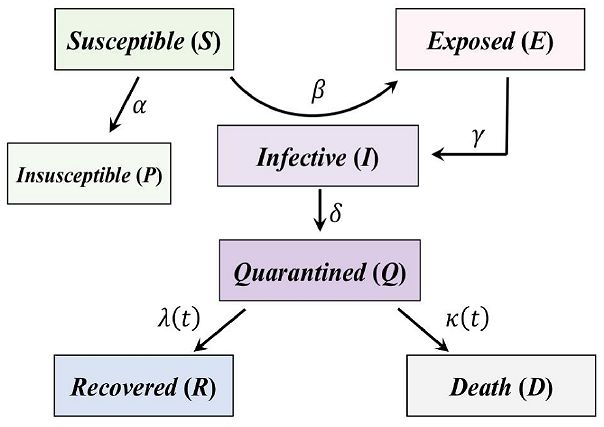
seems to exploit ACE2 receptors to attach onto and then break
its ‘spike’ proteins, thus making it easier for its membrane to
‘fuse’ onto the host cell’s membrane. Then, the virus injects
its RNA into the host cell, exploiting the normal replication
mechanism for its own replication, producing several more
copies of the virus.
Regarding the pathology, there are several COVID-19 cases
of young children and infants in France with multi-organ
inflammations of unknown mechanism in relation to the virus
and with symptoms similar to the Kawasaki disease‡ . At least
two such cases have been reported in Greece too§ . Additionally,
the actual probability of transmission of the virus outdoors
and in spaces with effective open-air ventilation seems to be
extremely low in practice¶ . Recent evidence (5) shows that
recovered patients probably gain antibodies to SARS-CoV-2,
but the effective period is still unconfirmed. Research efforts
are intensified more and more towards producing rapid testing
methods, reliable and efficient treatments for patients, as well
as a much-anticipated artificial immunization process via a
safe vaccine (6, 7).
2. Timeline update for Greece
Since March 23rd, Greece was in strict lockdown in almost
every aspect of everyday activities, from drastic reduction of
international flights in and out of the country to very strict
constraints on people’s movements and gatherings. After a few
days of uncertainty, mostly due to the incubation period of
the virus in asymptotic carriers (8, 9), the lockdown seems to
have played a major role in severely slowing down the spread
of the virus in the general population.
Since mid-April when the previous report (1) was published,
the most notable event is probably the emergence of one high-
intensity infection cell in a private clinic in Athens. Starting
from April 24th, 37 confirmed infections and three deaths
related to COVID-19 were identified within almost a single
day, due to lack of prompt testing and proper protective
measures. The clinic was in central Athens and could become
an infection super-spreader hub, if it remained undetected for
another 2-3 days. Fortunately, the clinic and all patients and
personnel were isolated, the facilities were sterilized and its
functionality (hemodialysis centre) remained under very close
monitoring in the following days.
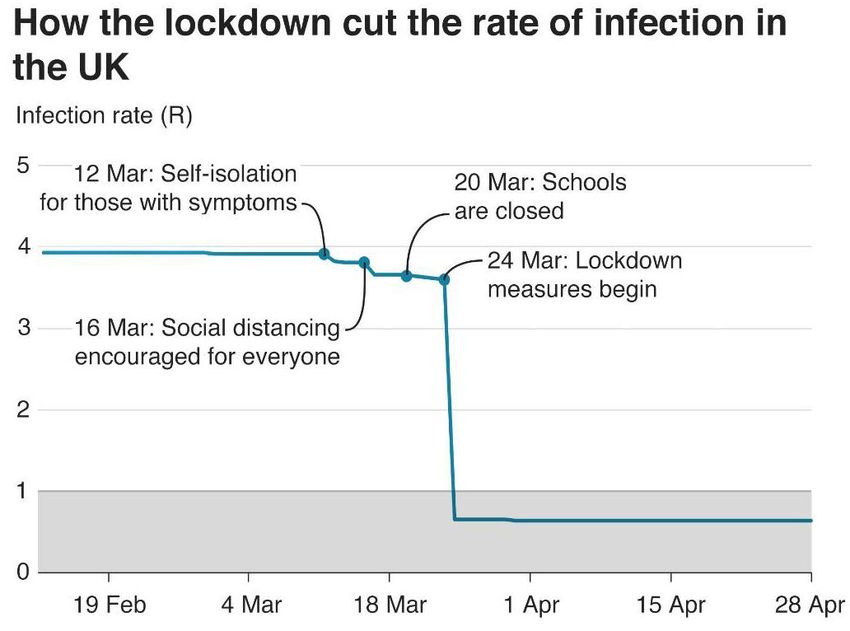
According to the officials, the single most important mitiga-
tion measure for slowing down the outbreak, especially during
the rapid rising of infections towards the peak, was explicit
social distancing. Although exact estimations are still diffi-
cult to verify at this point for Greece (more data will become
available later on), this effect seems to be supported by the
experience from other countries (10), as Figure 2 illustrates for
the UK. Publicly available data at the national level are not
of sufficient quality at this point to verify all the daily estima-
tions, the scientific committee in Greece has officially stated
that the basic reproduction number R0 has decreased steadily
since the onset of the country-wide lockdown, from R0 ≈ 4 on
March 13th to somewhere between 0.40 < R0 < 0.45 on April
30th. During the daily briefing on May 4th, the committee
stated that ‘R0 is now far below 0.5, with probability 98.5%’‖ .
‡
‘Kawasaki disease’ – Mayo Clinic (7-May-2020).
Fig. 1. General overview of the attack process of the SARS-CoV-2 virus (4).
§
‘Two children with Kawasaki symptoms in Greek hospitals’ (in Greek) (7-May-2020).
¶
‘Risk of transmitting COVID-19 outdoors is ’negligible’ says health officer’ (30-Apr-2020).
‖
https://youtu.be/fzZEcWPsDGw?t=2301
2 | doi: (preprint) H. V. Georgiou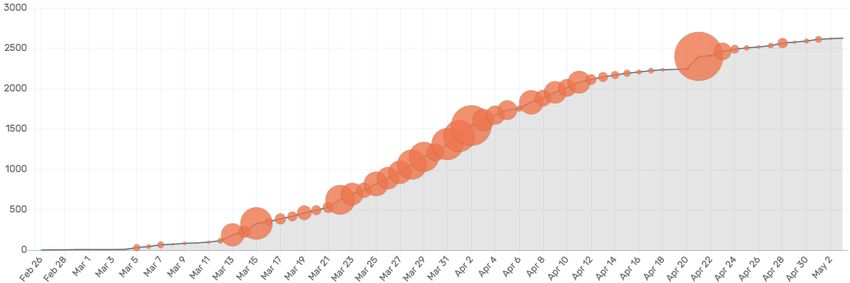
Fig. 4. Greece: Infected I(t), Deaths D(t) and Recovered R(t), in linear scale.
Fig. 2. Effects of explicit social distancing (lockdown) to the basic reproduction number
R0 in the UK (Source: Imperial College / Credits: BBC).
                                                                                             for open-access∗∗ and updated on a daily basis by John Hop-
                                                                                             kins CSSE (11), which is the most popular and reliable source
                                                                                             at the moment. It includes confirmed cases of Infected I(t),
                                                                                             Deaths D(t) and Recovered R(t), registered per-country and in
                                                                                             some cases per-province/region/state, collected by the official
                                                                                             sources from WHO, CDC (US), European CDC, state au-
                                                                                             thorities in each country, as well as other open-access sources.
                                                                                             Another source with regional data and access via API (12) was
                                                                                             explored in this report, recently introduced and maintained
                                                                                             by a volunteer team†† that is already collaborating with a
                                                                                             number of research groups in Greece.
                                                                                                The basic curves for Greece from the beginning of the
                                                                                             national epidemic are presented in Figures 4 and 5, in linear
                                                                                             and logarithmic scale, respectively. From the basic curves,
                                                                                             especially the I(t), it is clear that the progress of the outbreak
                                                                                             in Greece is exponential, as expected, but with a relatively
                                                                                             slow rate. In the first two weeks there are several step-wise
                                                                                             ‘pauses’ and ‘bursts’, as it is usually observed in the early
                                                                                             stages of a fast-growing epidemic. This is due to the fact
                                                                                             that the set sizes are still relatively small and statistics still
                                                                                             unstable, as well as the lack of strict mitigation measures
                                                                                             that are usually activated with some delay. Figure 6 presents
Fig. 3. COVID-19 heatmap of confirmed cases of infections in Greece on May 2nd,              a smoothed version of the I(t) series up to May 2nd, with
2020 (Source: WHO).
                                                                                             indications of daily increases.
                                                                                                Two critical ‘necks’ before large increases in new infections
    Following a highest-value in active infections at around                                 seem to be around day 43 and day 51 since the start of the
April 20th as expected and a gradual diffusion in the days                                   time series, i.e., March 4th and March 12th, respectively.
that followed, it was decided that the outbreak had actually                                 These dates coincide with two important events in the Greek
moved beyond its peak and into the beginning of the resolution                               timeline: (a) the 1st confirmed case in the group of tourists who
phase. Hence, the scientific advisory committee and the Civil                                returned from Israel & Egypt and (b) 10 new confirmed cases
Protection agreed that gradual deactivation of the country-                                  of unknown origin and the 1st virus-associated death. For (a) it
wide lockdown can be planned and implemented, starting from                                  was understood that this group of tourists were asymptomatic
May 4th.                                                                                     for a few days and, thus, have been spreading the virus in
                                                                                             the general population in the meantime, as the data proved
    Figure 3 presents the heat map of confirmed cases of infec-
                                                                                             subsequently. For (b) it was clear that the new confirmed cases
tions in Greece on May 2nd. Compared to the corresponding
                                                                                             of unknown origin, i.e., unrelated to both the group of tourists
heat map from March 15th (1), there are only very few regions
                                                                                             from Israel & Egypt as well as the other group that returned
of higher-than-average infections rate, with the outbreak now
                                                                                             from northern Italy a few days earlier, were to increase rapidly,
diffused throughout the entire country.
                                                                                             as was indeed the case. This is particularly important, because
                                                                                             at this point it is understood that the virus has escaped the
3. Outbreak status in Greece                                                                 strict and detailed backtracing of infections and their close
In order to analyze the progress of the outbreak in Greece, a                                encounters, in order to impose targeted isolations. Thus,
detailed dataset of daily reports must be used. More specifi-                               ∗∗
                                                                                                 https://github.com/CSSEGISandData/COVID-19
cally, the base dataset used in this study is the one provided                              ††
                                                                                                 COVID-19 Response Greece – https://www.covid19response.gr/

H. V. Georgiou                                                                                      Technical Report    |   May 10, 2020      |   Ref: HG-TR2020A1-COV19GR1   |   3
Table 1. LSE-optimal function parameters in Eq.1 for Greece. Upper
half refers to data up to April 14th, lower half refers to data up to May
3rd.
Parameter optim.value conf.interval
a 8.097 (7.974, 8.221)
b 8.722 (8.420, 9.024)
c 0.064 (0.060, 0.068)
a 7.986 (7.941, 8.030)
b 8.787 (8.517, 9.058)
c 0.068 (0.065, 0.070)
Note: b and c are used with a negative sign in Eq.1. All confidence
intervals are calculated for p = 0.95. Goodness-of-fit: R2 =0.992,
RMSE=0.017
Fig. 5. Greece: Infected I(t), Deaths D(t) and Recovered R(t), in logarithmic
scale. be developed in order to estimate important parameters of
the outbreak in Greece.
the operational plan should change to wide-range mitigation A. Infections. Using the I(t) data series the following expo-
measures, as quickly as possible. Fortunately, this is what nential formulation can be designed according to Eq.1 (1):
happened in the following days and, given that the outbreak
continued to spread at a fast rate, Greece went into a nation- I(t) ≈ ea−be
−ct
[1]
wide lockdown 11 days later. Another large ‘step’ in daily
increase (+156) of confirmed cases is now evident on April where a, b, c are the function parameters. Their best-fit optimal
21st, which may be partially attributed to the detection of a values in the least-squares (LSE) sense (15) and the 95%
the high-intensity infection cell in a private clinic in Athens confidence intervals for Greece are presented in Table 1. The
three days later, as described previously in section 2. first set of parameters (upper half) refers to the best-fit values
with data up to April 14th (1), while the second set (lower
A. Comparison to other countries. Taking into account the half) refers to the updated best-fit values including all data
progress of the pandemic world-wide since early January 2020, up to May 3rd. It is clear that the updated model is almost
the curves in Figures 4 and 5 reveal that Greece had a slow identical to the previous one.
start. However, it is not sufficient to simply align the offset It should be noted that, although the plot in Figure 6 seems
of each country’s specific event to the others’, e.g., the first purely logistic-like (‘sigmoid’) (16) y = L/(1 + e−k(x−x0 ) ), Fig-
reported death or the 100th confirmed case of COVID-19. The ures 4 and 5 reveal that at the start of the outbreak there may
entire curve has to be compared and ‘aligned’ to others for a be a sharp exponential increase after a near-linear progression
more realistic match. For this reason, Dynamic Time Warping period, i.e., at the beginning of high-rate virus spreading in
(DTW) (13, 14) with Euclidean distance (see section 4.D the general population and before the lockdown measures are
for more details) was used for comparing Greece’s infections activated. Therefore, although I(t) here is the cumulative
I(t) curve to countries in the general region of Europe and number as with D(t) and R(t) in similar well-fitted approx-
central/eastern Mediterranean Sea, especially those in direct imations, the logistic-like assumption for I(t) is valid for its
‘contact’ with Greece via international flights. middle (inflection) and rightmost (saturation) sections, but
As described in the previous report (1), the DTW matching may not be well-fitted for its leftmost (high-rate rising) sec-
provides two important parameters for further study: (a) a tion. This observation may provide better estimations on the
more realistic estimate of the time offset for temporal alignment saturation value of I(t), which for t → ∞ and α ≈ 8 gives
and (b) a DTW-based Euclidean distance that can be used as limt→∞ I(t) = eα ≤ 3, 000 cases; still, a more reliable number
a similarity measure. Figure 7 illustrates the updated relative for the saturation value is the one provided by SEIQRDP
temporal difference (offset) of Greece-versus-others regarding projections, as described later on in section 6.
the confirmed cases of infections I(t). From this new DTW
analysis it is evident that Greece is now fully ‘synchronized’ B. Recovered, Deaths. One thing that is clearly evident from
with the progress of the epidemic in the general region and its the publicly available epidemic data for Greece, especially for
neighbours, now with a positive +0.51 days reference offset the period after mid-April, is the severe delay in reporting the
instead of -1.47 days previously reported for April 14th, and recovered R(t) daily values. From Figures 4 and 5 this can be
still closely ‘aligned’ temporally with North Macedonia and easily observed for R(t) (green), where there are multiple peri-
Estonia. ods of no change at all, most notably two no-reporting periods
of 15 days between 6-20 April (269) and 9 days subsequently
4. Data-driven analytics between 21-29 April (577), as well as in the subsequent weeks.
This constitutes a major issue in terms of data quality and,
Using the daily time series for confirmed cases of Infected
in turn, create significant difficulties in producing accurate
I(t), Deaths D(t) and Recovered R(t) in Greece, as well as
and well-fitted epidemic models. Although this is a common
data for ICU‡‡ admissions, appropriate approximations can
observation in large-scale epidemics especially during in the
‡‡
ICU: Intensive Care Unit, typically a hospital bed with full quarantine and O2/ventilator capacity. period close to the peak of infections, it is not yet clear why
4 | doi: (preprint) H. V. GeorgiouFig. 6. Greece: Infected I(t) sum (curve)
and magnitude of daily increases (circles),
update: May 2nd (Source: WHO, NPHO-
Greece).
Fig. 8. Interpolation R̂(t) of Recovered R(t) against Deaths D(t).
Fig. 7. DTW-based temporal offsets of Greece-versus-others regarding the confirmed
infections I(t).
this effect was so severe in Greece with a relatively low number
of active infections at the peak.
In order to cope with such quality degradation of the epi-
demic data, an additional pre-processing step was implemented
in this work for R(t) reconstruction. More specifically, the
overall fatality rate and ICU admission rate against confirmed
cases are estimated well within the global values from other
countries with similar incident intensity (cases per 100,000
of population) and COVID-19 testing policies (1). Therefore, Fig. 9. Interpolation R̂(t) of Recovered R(t) against time (t).
since all Deaths D(t) and ICU admissions are confirmed and
logged with proper procedures in hospitals, these can be rea-
sonably considered a reliable baseline for both I(t) and R(t) Figure 8 presents the interpolation process of R̂(t) against
assessment in terms of data quality, under-reporting rates and D(t), illustrating the reference points (circles) interpolated
subsequent missing values. It should be noted that active with linear (blue), quadratic spline (magenta) and ‘pchip’ (red)
infections are calculated as a.I(t) = I(t) − R̂(t), i.e., a reliable functions; the third is chosen in this work as the best interpo-
estimation of R(t) is still required even if I(t) (cumulative) lator for its shape-preserving properties (16). Additionally, in
is accurate. Since ICU admissions related to COVID-19 per- Figure 9 the R(t) series is interpolated directly against time
country are not readily available in most data sources today (t), where there are some points where the ‘pchip’ interpolator
in order to make proper statistical comparisons for Greece, is non-smooth (non-differentiable) (19, 20), hence the need to
D(t) was used as the baseline for estimating R̂(t) within the design a similar process against D(t) instead. For additional
no-reporting periods. In practice, every single-day official re- quality assessment, Figure 10 presents a similar process for the
porting of R(t) is used as a reference point and high-quality D(t) series against time (t), also fitted with several interpo-
interpolation against D(t), specifically a spline-like piecewise lators, namely linear (blue), logistic (green), quadratic spline
cubic Hermite interpolating polynomial (‘pchip’) (17, 18), is (magenta) and ‘pchip’ (red). In this case, ‘pchip’ interpolator
employed for estimating the intermediate missing values for is again marginally better than quadratic spline due to its
R(t). shape-preserving properties (16).
H. V. Georgiou Technical Report | May 10, 2020 | Ref: HG-TR2020A1-COV19GR1 | 5Fig. 10. Interpolation of Deaths D(t) against time (t).
Fig. 12. Progress of the active Infections versus ICU ratio (blue) and its 1st derivative
(magenta).
since the official daily reports refer only to active ICU (cur-
rently used) and cumulative exits from ICU§§ , while there is
also no direct association to the final outcome, i.e., exactly
what portion moves to Recovered R(t) and Deaths D(t). This
means that the available ICU series can be associated only
with the active I(t) but not the cumulative I(t).
Using the restored version R̂(t) as previously described in
section 4.B, the active infections can be estimated as a.I(t) =
I(t)−R̂(t). Then, active infections a.I(t) per active ICU can be
created in order to track its progression as the outbreak evolved
before and after its peak infections. Figure 12 illustrates this
series (blue), together with its 1st derivative (magenta) as daily
trend; low values of this ratio translate to more ICU beds used
per confirmed infection (worse), while high values translate to
less ICU beds used per confirmed infection (better).
Fig. 11. Progress of the (estimated) ICU rate for Greece, according to the current
10-day LR approximation against I(t).
D. Phase differences. The plot in Figure 12 may initially seem
counter-intuitive: the rate of which an active infection may
The long-term ratio D(t)/I(t) of Deaths per Infection, at led to ICU might follow the rising trend of active infections
4.77% (126 in 2642) on May 5th, is more or less the same towards the peak of the outbreak. On the contrary, the plot
compared to the April 14th update (4.65%) and continues to shows almost the opposite, with less ICU beds required per
reside within the reference values 2% to 5% that is estimated active infection as the curve presents a local maximum some-
internationally for COVID-19 from studies for other countries where between days offset 59-63. This is actually common in
(9, 21). many epidemics, due to (a) high increase rate of confirmed
infections as the outbreak moves towards its peak and (b)
C. ICU admissions. One of the most important factors in the ‘phase’ difference between initial reporting of an infection and
efficient management of an epidemic is the rate of ICU admis- its subsequent admission to ICU after a few days when the
sions in the hospitals and the saturation level with regard to disease progresses to worse.
the total number available country-side. Reports from the Na- In order to investigate the phase difference between the
tional Public Health Organization of Greece have stated that predominant epidemic data series, i.e., Recovered R(t) and
the initial number of 565 ICU gradually increased to at least Deaths D(t) versus Infections I(t), Dynamic Time Warping
1,000 by mid-April. From the start of the national outbreak (DTW) (13, 14) with Euclidean distance was employed as
up to its peak in infections, Greece has been far below its in section 3.A. In practice, two such data series are ‘aligned’
saturation point, with 93 ICU beds or about 1 in 6 (at least) not only in the temporal but in both axes and the DTW
on April 5th. Fortunately, the ICU trend in Greece continues optimal warping path is analyzed in order to establish the actual
to be decreasing since its peak and especially since mid-April. ‘phase’ difference. This is accomplished by estimating the
As Figure 11 shows, the current estimation of the ICU-to-I(t) linear regressor (LR) (15, 22) between the values of the DTW
ratio has a steady negative 10-day LR slope (-0.088), twice as optimal warping path per-axis, according to the standard LR
large in magnitude compared to its previous value (-0.044) in formulation as described in Eq.2, Eq.3 and Eq.4:
the April 14th update (1).
On the other hand, it is difficult to make accurate estima- §§
According to the NPHO-Greece daily briefing, as of May 6th the number of patients that have exited
tions ratios like ICU-versus-Infections or ICU-versus-Deaths, ICU was 81 in total. – https://is.gd/5yXiZ5
6 | doi: (preprint) H. V. GeorgiouFig. 13. DTW-based estimation of ‘phase’ difference of Recovered R(t) versus Fig. 14. DTW-based estimation of ‘phase’ difference of Deaths D(t) versus Infected
dtw dtw
Infected I(t) (TR,I = 12.35 days). I(t) (TD,I = 11.52 days).
ŷi = b̂1 xi + b̂0 [2]
n
X (xi − x̄)(yi − ȳ)
b̂1 = [3]
(xi − x̄)2
i=1
b̂0 = ȳ − β̂1 x̄ [4]
where x̄ = E[x] = 1/nΣn i=1 xi and ȳ = E[y] = /nΣi=1 yi .
1 n
Then, DTW ‘phase’ difference can be estimated as the value
−b̂0 , i.e., the negative of the y-axis intercept point. In other
words, the constant coefficient (y-axis offset) of the best-fit
linear correlation between the optimal warping paths indicates
the optimal ‘lag’ between the two data series.
Using this DTW-based approach, Figures 13 and 14 present
the optimal matching paths and the matched curves for R(t)
versus I(t) and D(t) versus I(t), respectively. The recovered
‘phase’ differences is TR,I
dtw
= 12.35 days for the first and TD,I
dtw
= Fig. 15. Normalized auto-correlation plots of ∆I(t) (blue), the LR lines (red) in each
11.52 days for the second, i.e., the corresponding time period side and the reference line (green) of the case of ∆I(t) = c (constant).
between confirmed infection and recovery or death. The TR,I dtw
value is difficult to compare to other countries, mostly due to
incomplete or severe late-reporting of R(t) similarly to Greece number of days. Figure 15 presents the normalized auto-
(see section 4.B). The TD,I dtw
value is somewhat lower than the correlation plot of ∆I(t) (blue), i.e., the daily increases of I(t).
estimations of 20 ± 10 days reported by other studies in China Compared to the same plot in the previous status update on
(21), but it is still within the statistically significant (p=0.95) April 14th (1), it is evident here that the two sides of the
confidence interval, i.e., compatible to what is expected. lobe are almost entirely linear and the LR lines (red) in each
side. Additionally, they seem to have become more ‘flattened’
compared to the reference line (green) that corresponds to
5. Modelling the epidemic the case of ∆I(t) = c, i.e., for constant daily increase of
For a more in-depth analysis of the basic data curves I(t), I(t + τ ) = cτ + I(t). There is also a distinct narrow band in
D(t) and R(t) of the COVID-19 epidemic in Greece, the corre- the central part, which indicates an even stronger correlation
sponding time series were investigated in terms of linear and between successive values, i.e., more stable and ‘linearized’
periodic trends, i.e., analyze them into their primary frequency evolution. This proves that, at least in asymptotic behaviour
components (1). towards the current state, I(t) increase in Greece is gradually
One of the most important factors, regardless of the long- becoming linear, even more than 2-3 weeks ago.
term approximation of the underlying system, is the analysis Another way to track the periodic ‘bursts’ of newly reported
of the step-wise dependencies between successive data points, infections as they are reported on a daily basis is to track
especially the confirmed cases I(t). In statistical terms, this the changes in the short-term slope of ∆I(t). Instead of
is done by estimating the auto-correlation in the time series approximating the entire I(t) curve as in Eq.1 for estimating
for various lags, which produces a quantitative description the long-term behaviour, a short-term temporal window can be
of dependencies between dates, i.e., separated by a specific used to approximate the LR slope of I(t) as it progresses, i.e.,
H. V. Georgiou Technical Report | May 10, 2020 | Ref: HG-TR2020A1-COV19GR1 | 7Fig. 16. 4-day sliding window slope b̂1 of ∆I(t) (magenta), annotations of increasing/decreasing daily trends (red/green) and LSE-fitted approximation of the b̂1 .
the amplitude and sign of ∆I(t) changes over few subsequent
days. Figure 16 illustrates such a short-term tracking of ∆I(t)
via the 1st-order differential d log b̂1 (t)/dt of LR slope of I(t)
with b̂1 as defined in Eq.3, or in other words the ∆2 I(t), over
a short-term sliding window of four days.
The main curve (magenta) in Figure 16 is the short-term
LR slope b̂1 value for I(t) as it evolves; the arrow annotations
indicate decreasing (green) or increasing (red) trends; the as-
terisks (blue) on the x-axis indicate the major events regarding
the activation of mitigation measures in Greece as described in
Table 2. LSE-optimal function parameters in Eq.6 and Eq.7 for
the timeline in section 2 and in the previous update on April Greece.
14th (1). Finally, the asymptotically fading sinusoid (black) is
a LSE-fitted approximation of g( t) by ĝ(t), as defined by Eq.5, Parameter optim.value conf.interval
Eq.6 and Eq.7. α2 0.070 (0.040, 0.100)
α1 0.713 (0.681, 0.745)
d log b̂1 (t) α0 0.003 (-0.978, 0.985)
g(t) = [5] β1 -0.008 (-0.020, 0.004)
dt
3 β0 0.359 (0.128, 0.590)
X p3 19.330 (11.220, 27.440)
ĝ(t) = poly3(z(t)) = pk z(t)k [6]
p2 -3.575 (-7.223, 0.074)
k=0
p1 0.430 (0.001, 0.859)
z(t) = α2 sin(α1 t − α0 ) + (β1 t + β0 ) [7] p0 0.044 (0.025, 0.063)
The LSE-optimal parameters of this multi-level approxima- α2 0.017 (-0.011, 0.046)
tion are presented in Table 2. The upper half contains the α1 0.466 (0.382, 0.551)
values estimated in the previous update, while the bottom half α0 -9.502 (-12.980, -6.024)
the values estimated with data up to and including May 3rd. β1 -0.005 (-0.017, 0.007)
β0 0.304 (0.073, 0.535)
Similarly to the previous update on April 14th (1), the
p3 4.142 (-17.500, 25.780)
approximation curve in Figure 16 clearly indicates three major p2 3.022 (-4.415, 10.460)
factors: (a) periodic trend, captured by the first part of Eq.7 p1 0.115 (-0.490, 0.720)
with αi parameters, (b) linear decreasing trend, captured by p0 0.010 (-0.019, 0.039)
the second part of Eq.7 with βj parameters, and (c) asymptot-
ically fading trend, captured by the 3rd-degree polynomial of Note: α0 is used with a negative sign in Eq.7. All confidence intervals
Eq.6 with pk parameters. Based on the comparison of the LSE- are calculated for p = 0.95.
optimal parameter values in Table 2, there are two distinct
differences in the current update. First, the periodic parameter
α1 that is now much smaller. Second, the current polynomial
coefficients p3 and p2 are now of same sign and with a much
smaller 3rd-degree factor, which typically indicate smoother
and slower-rising derivatives. The periodic trend parameters,
more specifically the α1 = 0.466, can be translated from ra-
dians to daily temporal range via α1/2π = t/T where T = 68d
is the length of the data series (May 3rd) since the first con-
firmed infection case (February 26th), hence yielding a period
8 | doi: (preprint) H. V. GeorgiouEach interaction between the SEIQRDP compartments is
governed by a scalar parameter that governs the way frac-
tions of each subset is ‘transferred’ to another (25, 26), i.e.,
‘protection rate’ α, ‘infection rate’ β, ‘average latent time’
γ −1 and ‘quarantine entry rate’ δ. Especially for the outflows
from quarantine ‘Q’, the parameters are time-dependent with
exponential decay functions λ(t) = λ0 (1 − e−λ1 t ) with λ0 , λ1
constants and κ(t) = −κ0 eκ1 t with κ0 , κ1 constants. The full
SEIQRDP model is described by the set of typical first-order
linear differential equations (16) Eq.8 through Eq.14:
dS(t) S(t)I(t)
= −β − αS(t) [8]
dt N
dE(t) S(t)I(t)
= β − γE(t) [9]
dt N
Fig. 17. The block diagram of the SEIQRDP model and its parameters.
dI(t)
= γE(t) − δI(t) [10]
dt
tp = α1 T/2π ≈ 0.074166T ≈ 5.043d. This is marginally smaller dQ(t)
= δI(t) − λ(t)Q(t) − κ(t)Q(t) [11]
than the April 14th update (5.56d) and, again, coincides with dt
the empirical data regarding the incubation (asymptomatic) dR(t)
= λ(t)Q(t) [12]
period of COVID-19, estimated at 5.1-5.2 days (8, 9). Taking dt
into consideration that the main mitigation measures (blue dD(t)
= κ(t)Q(t) [13]
asterisks in x-axis) in Greece were activated just before each dt
major ‘peak’ in (∆I(t)), it is re-confirmed that they were dP (t)
= αS(t) [14]
imposed in a timely manner and, thus, they were appropriate dt
and effective in containing the ‘force’ of the national outbreak In this study, the SEIQRDP model was designed based on
until today. the description of similar recent studies for other countries
(24–26) and trained using the I(t), D(t) and R(t) data series
A. SEIQRDP model for Greece. The mathematical modelling for Greece, from 26-Feb-2020 to 3-May-2020. Specifically
of epidemics has been a very active research field for decades. for R(t), the reconstructed interpolation-based version R̂(t)
Their main goal is to track the progress of the outbreak and was used, as described previously in section 4.B. Based on
its phase, in order to properly and promptly plan the mitiga- this, a reconstructed version of the active infections a.I(t) =
tion measures. By far, the most popular and well-established I(t) − R̂(t) was also generated. The purpose of this modelling
approach is the family of compartmental epidemic models, was to re-estimate the general properties of SARS-CoV-2 virus
originally developed as far back as 1920s. Their common and the COVID-19 outbreak on the national level, in order
characteristic is the base assumption of having a target popu- to: (a) confirm that the available data series are adequate and
lation partitioned in compartments that are homogeneous in their evolution is in accordance to the research outcomes from
all relevant properties (e.g., sex, age, underlying pathologies, other countries and on world-wide level; and (b) to estimate
etc) and there are direct interactions between them. The the progress of the outbreak on the mid-/long-term level,
three basic compartments are S=‘susceptible’, I=‘infectious’ specifically for the epidemic phases, the expected peak date
and R=‘recovered’, assuming insignificant rate of deaths and and magnitude, etc.
permanent immunity after recovery. Variants of this SIR base The solution of the SEIQRDP system of differential equa-
model include a D=‘deaths’ compartment (SIRD), E=‘exposed’ tions defined in Eq.8 through Eq.14 was estimated by a stan-
compartment (SEIR, SEIRD) for introducing an incubation dard LSE solver (15) for iterative matching of the predicted
period, Q=‘quarantined’ compartment (SEIQRD, SEIQRDP) trajectories to the real data. The software implementation was
for separating the already isolated confirmed/possible carriers, based on a heavily modified version of an open-access toolkit
etc. Based on recent models that are already being tested (27), with several improvements on convergence stability and
with COVID-19 data from China and other countries, the derivatives accuracy, which deemed necessary in the early
current work explored the epidemic data for Greece via the stages of the epidemic in Greece due to limited compartment
generic framework of a SEIQRDP model setup (23, 24). The sizes (small-sized populations) and severe delays in reporting
additional P=‘insusceptible’ corresponds to a fraction of the R(t) as described earlier.
general population (if any) that, even when exposed to the For inclusion of a minimal under-reporting of infections,
virus, cannot become ‘infected’ and, thus, does not enter the I(t) data series was amplified by an additional +8% upon its
E compartments and stays outside the ‘pipeline’ of the epi- recorded values. The LSE solver used centralized differential
demic. More in-depth explanation of these, as well as other estimators, 1e-6 time step size (86.4 ms) and 1e-6 error toler-
approaches to epidemic modelling, is included in the previous ance for stopping criterion. In all cases, the process converged
report (1). to a solution within less than 30 iterations, which hints that
Figure 17 illustrates the SEIQRDP model and the meaning the actual epidemic data for Greece are well-described by the
of each parameter. The internal structure of the model, i.e., SEIQRDP model.
the interactions that describe the dynamics of the system, is Figures 18 and 19 present the best-fit solution of the
formulated by Eq.8 through Eq.14. SEIQRDP model (points) and its projection (lines) until Au-
H. V. Georgiou Technical Report | May 10, 2020 | Ref: HG-TR2020A1-COV19GR1 | 9Fig. 18. SEIQRDP best-fit model (points)
and its projection (lines) for I(t), D(t) and
R(t) until August (2020) in linear scale.
Fig. 19. SEIQRDP best-fit model (points)
and its projection (lines) for I(t), D(t)
and R(t) until August (2020) in logarithmic
scale.
gust (2020), in linear and logarithmic scale, respectively. The
dotted line in Figure 19 illustrates the onset of a subsequent Table 3. LSE-optimal SEIQRDP model parameters in Eq.8 through
surge of the outbreak if all the mitigation measures (quar- Eq.14 for Greece (26-Feb-2020 to 3-May-2020), with no inflation factor
antine) was to be deactivated immediately on May 4th, but for I(t) under-reporting and reconstructed R̂(t).
with the ‘infection rate’ parameter β scaled down to 1/3 of its
Parameter optim.value
solution in order to accommodate moderately effective social
distancing and personal protection practices in the general α 0.1030
population. β 3.0000
γ 0.1186
Table 3 presents the values for all the SEIQRDP parameters δ 0.0352
for the best-fit solution. The upper half contains the values λ 2.9986
estimated in the previous update, while the bottom half the κ 0.0468
values estimated with data up to and including May 3rd. It α 0.0905
should be noted that, due to the fact that much more data β 3.0000
are available now compared to the previous update (1) and a γ 0.1114
recovered version R̂(t) was used, the current SEIQRDP model δ 0.0638
fit does not include any inflation factor for I(t) for addressing λ 0.0263
under-reporting effects, as previously explored. The most κ 0.0679
notable difference between the new (May 3rd) and the previous
Note: LSE used centralized differential estimators, 1e-6 time step size
(April 14th) best-fit values is with the ‘cure rate’ λ parameter,
(86.4 ms), 1e-6 error tolerance for stopping criterion; convergence in
now more than two orders of magnitude smaller. This updated
11-36 iterations; starting conditions: E0 =0, I0 =1, D0 =0, R0 =0;
value can be considered more reliable than the previous, since
estimated population (2018): Npop =10,724,599.
it is estimated based on more epidemic data and reconstructed
R̂(t).
10 | doi: (preprint) H. V. GeorgiouBased on the additional epidemic data available up to Table 4. R0 estimations for Greece based on Eq.15 and best-fit
SEIQRDP parameter values, using the updated epidemic data (26-
May 3rd and more reliable estimation of R̂(t), the SEIQRDP Feb-2020 to 3-May-2020).
model fit provides an even better description of the outbreak
characteristics in Greece compared to the April 14th update. Date R0
The model essentially confirms the estimations of the out-
May 1st 0.495
break peak regarding the projected dates around April 19th May 2nd 0.450
from very early on, even when only the first 7-10 days of May 3rd 0.410
April data were becoming available. The peak was realized
on April 20th with a.I(t) = 1, 860 according to the actual
ˆ = 1, 856 according
reported R(t) or on April 21st with a.I(t)
to the reconstructed R̂(t). According to the SEIQRDP model, to Eq.15 this happened was between May 1st and 3rd, hence
recent data moved the projected peak of active infections confirming these statements.
about five days earlier (April 14th), but with numbers still
within the expected margins of error ∆{I(t), ˆ D̂(t), R̂(t)} = C. Under-reporting of Infections (I(t)). Under-reporting of the
{−1.26%, −0.09%, +13.76%} at the peak date. actual infections rate in the general population is a very im-
It should be noted that there is temporal difference of 9-18 portant issue in almost every epidemic and a degradation
hours between the numbers officially reported by the Greek factor for almost all analytical modelling approaches. The
authority (NPHO) and the open-access datasets from John availability of reliable and accurate epidemic data during an
Hopkins CSSE (11), due to time zone differences and scheduled outbreak, i.e., while the epidemic is evolving, is one of the most
updating tasks on a daily basis. For example, R(t) = 1, 374 important constraints to such analytical approaches. It has to
was reported on April 30th and included in the CSSE datasets be recognized, assessed in terms of magnitude and addressed
for Greece on May 1st. Hence, small temporal differences via proper pre-processing within the predictive models. One
of T ≤ 24 hours should be expected and considered normal. such pre-processing step is the restoration of R̂(t) as described
Additionally, R(t) = 1, 442 was reported by local sources on previously in section 4.B.
May 3rd, but the CSSE datasets report it as 1, 374 since April One of the most discussed issues regarding the outbreak
30th, until up to May 8th. More data sources will become in Greece is the under-reporting of infections I(t) and how
available on the national level, as well as structured retrieval this affects the epidemic models, as well as the confidence in
procedures and open-access APIs (12), as noted in section 3. planning the mitigation policies. It has been accepted by state
Summarizing the SEIQRDP model for Greece, the goodness- officials that the under-reporting of I(t) in Greece may be up
of-fit of the parameter solutions provides a valid ‘explanation’ to 20:1 (only 1 in 20 infections registered) or more, given the
for the dynamics of the national epidemic, i.e., the interaction numbers from other countries and the targeted-only tests in
between the compartments. Thus, the overall shape and scale Greece. A recent study¶¶ (30) estimated the true number of
of the corresponding curves can be considered as safe for I(t) for Greece (mid-April) between 9,652 and 20,377 in the
assessments regarding the characteristics of the epidemic and general population∗∗∗ rather than 2,145 officially documented
its comparison to how it progresses in other countries. by April 13th, i.e., an under-reporting rate of 6.5:1 in currently
active infections. On May 3rd, the scientific committee stated
B. Basic reproduction number (R0 ). The availability of epi- that the true number of infections, including a large number
demic data for Greece beyond its peak of active infections, of asymptomatic carriers, is probably around 20,000-30,000.
i.e., well past the maximum of the I(t) data series, enables In the previous status update on April 14th (1), separate
the estimation of a more reliable SEIQRDP model than in the SEIQRDP models were evaluated with different assumptions
previous status update on April 14th (1). Hence, the basic regarding the extent of the under-reporting of I(t). According
reproduction number R0 can now be estimated directly from to those models, the projected dates of peak infections ranged
the model’s best-fit parameters, instead of statistical approxi- from April 15th to May 5th, ranging from no under-reporting
mations as it was presented in the previous status update (1) (flow
I
= 1.0) to a ratio of almost 1:10 (fhigh
I
= 9.5), respectively.
based in the daily progress of I(t). For SEIQRDP the R0 can The availability of more recent epidemic data well beyond the
be defined according to Eq.15 (25, 28, 29): actual peak of I(t) as described previously enable the revisiting
of those projections and, hence, the validity of the associated
R0 = βδ −1 (1 − α)t [15] under-reporting assumptions. More specifically, the actual
peak date of 20-21 of April (see above) falls between the cases
All parameters in Eq.15 are scalar, i.e., not including the April 16th (f I = 1.08) or April 25th (f I = 4.5). By a rough
time-dependent λ(t) and κ(t), but the actual estimation of LR estimation according to Eq.2 through Eq.3, this translates
R0 is time-dependent due to the t exponent (in days). This to 2.60 ≤ f I ≤ 2.98, i.e., indicating under-reporting level for
is due to the fact that, assuming stable compartment inter- I(t) no more than 1:3.
actions when mitigation measures are in effect (clearly after Additional hints regarding the under-reporting can be in-
quarantine), Eq.15 describes the decay of infection rates in vestigated via the Deaths D(t) and ICU used compared to
the population. For the best-fit SEIQRDP parameter values the infections I(t) and active infections a.I(t), respectively, as
of Table 3 (bottom half), Eq.15 becomes R0 = 0.9095t 47.022, described in sections 4.B and 4.C. As explained previously,
which estimates R0 < 1 for April 24th and beyond. As men- the D(t)/I(t) fatality ratio is still within the expected zone,
tioned earlier in section 2, during the official daily briefing indicating that the overall tracking of I(t), D(t) and R(t)
on April 30th this value was reported at 0.40 < R0 < 0.45 ¶¶
https://imperialcollegelondon.github.io/covid19estimates/
and on May 4th the statement was that ‘R0 is now far below ∗∗∗ Estimated true Infected ≈ 0.13%(0.09%, 0.19%)Npop of the general population or I(t) ≈
0.5’. As Table 4 presents, the critical dates when according 13942(9652, 20377) w.r.t. reference demographics (2018) of Npop = 10724599 (ELSTAT).
H. V. Georgiou Technical Report | May 10, 2020 | Ref: HG-TR2020A1-COV19GR1 | 11data series are reliable enough to track the general progress • similarly, the projection of total recovered from COVID-
of the national outbreak. Assuming that Iceland and South 19, counting only confirmed cases of infections, is expected
Korea have the best random testing in massive scale, the cor- to reach 5,300 or more by the end of July;
responding fatality rates of 0.6% and 2.3% can be asserted
as a realistic estimation for low levels of under-reporting for • the currently estimated basic reproduction number is
I(t). Hence, with Greece at 5.5% and non-saturated ICU R0 < 0.45 and constantly dropping;
(similar operational efficiency), simple factoring hints that the • if no second-wave outbreak is realized, the current out-
under-reporting factor is somewhere between 2.39 ≤ f I ≤ 9.17, break is expected to fade out within August (less than 10
mostly towards the first based on South Korea (144 deaths) infections reported).
rather than Iceland (10 deaths) where the sample is too small
for statistical significance. Based on the data analytics results for Infected, Deaths,
An issue closely related to the under-reporting of infec- Recovered and ICU used, Greece gradually ‘synchronized’ with
tions I(t) is the policy and implementation plan regarding its neighbouring countries in Europe and in the general region,
clinical tests for the presence of the virus in symptomatic or while still maintaining strict mitigation measures up to May
asymptomatic population. Due to the novelty of each emerg- 3rd. However, as the travel bans are gradually deactivated
ing outbreak like with the SAR-CoV-2 virus, reliable kits are throughout the world, a second wave of SARS-CoV-2 epidemic
almost never available promptly for large-scale testing in the is expected with a very high probability, as early as October
general population, at least not in the first phases of rapidly or even September, with new spreading of the virus via air
increasing new infections. Various strategies have been pro- travelling and cross-countries summer holidays.
posed to tackle this challenge (6), ranging from sub-optimal Regarding the quality and reliability of the models for
tests of limited reliability (use plenty of tests, more than once) Greece, Deaths seems to follow a logistic (‘sigmoid’) function
to proper reliable tests but with pooling protocols (sample very closely, as expected, and with statistics well within the
multiple persons per single test)†††‡‡‡ . This is still a contro- world-wide estimations. In contrast, there are severe delays
versial issue in which every country employs its own policies in reporting Recovered, spanning to more than a week, which
and perspective. In Greece, the NPHO has always employed introduces a very strong degradation of the corresponding
policies that include limited and very targeted tests regarding data series and everything that uses it, e.g. when estimating
the monitoring of epidemics in the general population. For active infections from the cumulative number. Nevertheless,
example, for the seasonal flu the official reports state that data restoration via proper high-quality interpolation seems
under-reporting may be up to 1:1000 as a standard practice§§§ , to address this problem adequately, producing results com-
given of course the fact there is a readily available vaccine with patible with the non-restored SEIQRDP model fits but with
moderate-to-high effectiveness in terms of protection. The improved estimations within the ‘missing value’ sub-ranges for
officials have stated that such targeted-only, limited testing is the other data analytics models. The robustness of SEIQRDP
still the main strategy for SARS-CoV-2 tracking, with tests is particularly important for assessing the quality of the pro-
conducted only in hospitals with symptomatic individuals jections regarding the evolution of the outbreak in Greece well
and with mobile units that visit specific social groups, e.g. into summer, using the current data and mitigation measures
migrant/refugee camps throughout the country. (before deactivating them).
The effect of under-reporting of infections in Greece was
6. Discussion investigated via various approaches, including SEIQRDP vari-
ances with inflated Infections I(t), tracking of deaths D(t)
The data analytics, best-fit model parameters and projected
against I(t) and tracking active ICU against both I(t) and
outcomes for Greece, as presented in the previous sections,
D(t). The projected (April 14th) peak infections date for var-
provide solid evidence that the COVID-19 outbreak at the
ious under-reporting factors (1) was also assessed against the
national level can be tracked with adequate accuracy for the
actual realization of the peak, in order to check the validity
general assessment of the situation, including the transition
of the initial guesses. According to the latest estimations,
through the phases of the epidemic. Despite the problems
the effective under-reporting factor seems to be no more than
with under-reporting of infections I(t) and very late reporting
1:3, at least for the clinically important cases of COVID-19.
of recovered R(t), the models show reliable evidence that the
Unreported cases of patients with very mild symptoms or
outbreak in Greece seems to have entered recession and it is
completely asymptomatic may be much higher, 1:10 or more,
evolving into deflation, as expected.
according to the official statements in Greece and studies
According to projections by the best-fit SEIQRDP model,
in other countries. More realistic estimations will become
presented in Figures 18 and 19, there is strong evidence that:
available when antibody tests in the general population are
• the infections peak was realized in April 20th or 21st, implemented within the next months.
with 1,856-1,860 active infections, depending on the true Finally, the best-fit SEIQRDP model with data up to the
R(t) (not yet available); last day before the beginning of gradual deactivation of the
strict mitigation measures (May 3rd) was employed, using an
• the projection of total deaths related to COVID-19 by
‘infection rate’ parameter β scaled down to 1/3 of its best-
the end of July is expected to be less than 170 (currently
fit solution in order to simulate some social distancing and
at 151, May 10th);
protective measures. Based on this, a second-wave outbreak
†††
https://spectrum.ieee.org/view-from-the-valley/the-institute/ieee-member-news/everybody-in-the- from the subsequent week can produce a new infections peak
‡‡‡
pool-algorithm-researchers-tackle-the-coronavirus-test-shortage
at mid-July that may reach up to more than five times the
https://www.hospimedica.com/coronavirus/articles/294781273/israeli-researchers-introduce-
pooling-method-for-covid-19-testing-of-over-60-patients-simultaneously.html peak of the first wave (with measures still active), as Figure
§§§
https://eody.gov.gr/wp-content/uploads/2019/01/etisia_ekthesi_gripis_2018_2019.pdf 19 shows. This clearly shows the importance of maintaining
12 | doi: (preprint) H. V. Georgiouproper social distancing, personal protection measures and 13. E Keogh, C Ratanamahatana, Exact indexing of dynamic time warping. Knowl. Inf. Syst. 7,
constant alert regarding the proper tracking of active infections 358–386 (2005).
14. T Rakthanmanon, Addressing big data time series: Mining trillions of time series subse-
in the general population. quences under dynamic time warping. ACM Transactions on Knowl. Discov. from Data 7,
10:1–10:31 (2013).
15. S Theodoridis, K Koutroumbas, Pattern Recognition. (Academic Press), 4th edition, (2008).
7. Conclusion 16. M Spiegel, J Liu, S Lipschutz, Mathematical Handbook of Formulas and Tables (4th/Ed.).
(McGraw-Hill), (2012).
COVID-19 constitutes a fast-pacing, world-wide pandemic 17. F Fritsch, R Carlson, Monotone piecewise cubic interpolation. SIAM J. on Numer. Analysis
that has evolved quickly into a multi-aspect international 17, 238–246 (1980).
18. D Kahaner, C Moler, S Nash, Numerical Methods and Software. (Prentice Hall, Upper Saddle
crisis. Even with proper policies and mitigation measures River, NJ, USA), (1988).
properly and promptly in place, tracking the outbreak even at 19. M Hazewinkel, Encyclopedia of Mathematics. (Springer / Kluwer Academic Publishers),
the national level is an extremely challenging data analytics (2001).
20. S Bronshtein, Handbook of Mathematics. (Springer), 4th edition, (year?).
& modelling task as the event itself is still active, thus only 21. J Wu, K Leung, M Bushman, N Kishore, et.al., Estimating clinical severity of covid-19 from
limited and perhaps unreliable data are currently available. the transmission dynamics in wuhan, china. Nat. Medicine Lett. (2020).
22. M Spiegel, J Schiller, R Srinivasan, Probability and Statistics (3rd/Ed.). (McGraw-Hill), (2009).
In this study, Greece is the main focus for assessing the na- 23. E Piccolominib, F Zamaa, Preliminary analysis of covid-19 spread in Italy with an adaptive
tional outbreak and estimating the general trends and outlook seird model. arXiv:2003.09909v1 [q-bio.PE] (2020).
of it. Multiple data analytics procedures, spectral decomposi- 24. L Peng, W Yang, D Zhang, C Zhuge, L Hong, Epidemic analysis of covid-19 in China by
dynamical modeling. arXiv:2002.06563v1 [q-bio.PE] (2020).
tion and curve-fitting formulations are developed based on the 25. R Leipus, O Stikonien, Apibendrinto seir modelio taikymas covid-19 ilgalaikems prognozems.
data available at hand. Standard SEIQRDP epidemic mod- VU, Taikomosios Matematikos Institutas, 1–5 (2020).
26. M Bahloul, A Chahid, TM Laleg-Kirati, Fractional-order seiqrdp model for simulating the dy-
elling is applied for Greece and for the general region around namics of covid-19 epidemic. arXiv:2005.01820v1, 1–11 (2020).
it, providing hints for the outbreak progression in the mid- 27. E Cheynet, Generalized seir epidemic model (fitting and computation) (2020).
and long-term, for various infections under-reporting rates. 28. X Bardina, F Ferrante, C Rovira, A stochastic epidemic model of covid-19 disease.
arXiv:2005.02859v1, 1–14 (2020).
Now with more epidemic data available, the overall short- 29. P Driessche, Reproduction numbers of infectious disease models. Infect. Dis. Model. 2, 288–
term outlook for Greece continues to be towards positive, with 303 (2017).
much higher confidence than in mid-April (1). All numbers 30. S Flaxman, S Mishra, A Gandy, et.al., Estimating the number of infections and the impact
of nonpharmaceutical interventions on covid-19 in 11 european countries. Imp. Coll. Lond.
indicate that the national outbreak is in recession that will (UK), COVID-19 Response Team (2020).
continue to deflate well within the summer. However, the grad-
ual deactivation of strong mitigation measures, the re-opening
of international travelling and the summer holidays period
require very intense and accurate tracking of the infections
in Greece and every other country, in order for the policy
makers and the health infrastructure to be well-prepared for
the second-wave outbreak of SARS-CoV-2 that is expected
within the next months before the end of the year.
ACKNOWLEDGMENTS. The author wishes to thank every team
and researcher that is currently working towards scientific works of
high quality, readily accessible to the community, including technical
papers, research papers and datasets. This is the only viable way
to address such fast-pacing events of major world-wide impact
collectively and effectively, as quickly and reliably as possible, while
the crisis is still evolving.
REFERENCES
1. H Georgiou, COVID-19 outbreak in Greece has passed its rising inflection point and stepping
into its peak (2020) Proofreading over the previous version 1.1.00 / 15-Apr-2020.
2. A Deslandes, V Berti, Y Tandjaoui-Lambotte, et.al., Sars-cov-2 was already spreading in
france in late december 2019. Int. J. Antimicrob. Agents (to appear), 1–11 (2020).
3. B Korber, W Fischer, S Gnanakaran, H Yoon, et.al., Spike mutation pipeline reveals the emer-
gence of a more transmissible form of sars-cov-2. bioRxiv (preprint) (2020).
4. D Cyranoski, Profile of a killer: the complex biology powering the coronavirus pandemic.
Nature 581, 22–26 (2020).
5. F Wu, A Wang, M Liu, Q Wang, Neutralizing antibody responses to sars-cov-2 in a covid-19
recovered patient cohort and their implications. medRxiv (preprint) (2020).
6. M Esbin, O Whitney, S Chong, et.al., Overcoming the bottleneck to widespread testing: A
rapid review of nucleic acid testing approaches for covid-19 detection. Cold Spring Harb.
Lab. Press., 1–22 (2020).
7. C Wang, W Li, D Drabek, et.al., A human monoclonal antibody blocking sars-cov-2 infection.
Nat. Commun. 2251, 1–6 (2020).
8. S Lauer, K Grantz, Q Bi, F Jones, et.al., The incubation period of coronavirus disease 2019
(covid-19) from publicly reported confirmed cases: Estimation and application. Annals Intern.
Medicine (2020).
9. A Kucharski, T Russell, C Diamond, et.al., Early dynamics of transmission and control of
covid-19: a mathematical modelling study. The Lancet Infect. Dis. (2020).
10. B Maier, D Brockmann, Effective containment explains sub-exponential growth in confirmed
cases of recent covid-19 outbreak in mainland china. medRxiv (preprint) (2020).
11. E Dong, H Du, L Gardner, An interactive web-based dashboard to track covid-19 in real time.
The Lancet Infect. Dis. (2020).
12. CR Greece, Coronavirus greece api: A simple and fast api for tracking the coronavirus (covid-
19) outbreak in greece (2020).
H. V. Georgiou Technical Report | May 10, 2020 | Ref: HG-TR2020A1-COV19GR1 | 13You can also read